notes - value research · notes to financial ... (hindi daily), ‘divya bhaskar’ and...
TRANSCRIPT

Financial Statements - Standalone
133
Overview
Statutory R
eportsFinancial S
tatements
Subsidiaries
NOTES to financial statements as at and for the year ended March 31, 2017
1. NATURE OF OPERATIONS D. B. Corp Limited (“the Company”) is in the business
of publishing newspapers, radio broadcasting, providing integrated internet and mobile interactive services and event management. The Company is a public limited company domiciled in India and was incorporated under the provisions of the Companies Act, 1956. The major brands in publishing business are ‘Dainik Bhaskar’ (Hindi daily), ‘Divya Bhaskar’ and ‘Saurashtra Samachar’ (Gujarati dailies), ‘Divya Marathi’ (Marathi daily),and ‘DB Post’ (English daily), and monthly magazines such as ‘Aha Zindagi’, ‘Bal Bhaskar’, etc. Presently, the Company’s radio station is on air in 30 cities under the brand name ‘My FM’. The frequency allotted to the Company’s radio station is 94.3. Internet business includes the websites dainikbhaskar.com, divyabhaskar.com, dailybhaskar.com, divyamarathi.com, and homeonline.com.
The Company derives its revenue mainly from the sale of its publications and advertisements published in the publications, aired on radio, displayed on websites and portal and mobile interactive services.
The financial statements comprise the financial statements of the Company for the year ended March 31, 2017. The Company’s registered office is at Plot No.280, Sarkhej-Gandhinagar Highway, Near YMCA Club, Makarba, Ahmedabad, Gujarat, India.
The financial statements for the year ended March 31, 2017 has been reviewed by the Audit Committee and approved by the Board of Directors at their respective meetings held on May 18, 2017.
2. SIGNIFICANT ACCOUNTING POLICIES 2.1 Basis of accounting and preparation The financial statements have been prepared in
accordance with Indian Accounting Standards (Ind AS) notified under the Companies (Indian Accounting Standards) Rules, 2015 under the provision of the Companies Act, 2013 (the ‘Act’) and subsequent amendments thereof.
For all periods up to and including the year ended March 31 ,2016, the Company prepared its financial statements in accordance accounting standards notified under the section 133 of the Act, read together with paragraph 7 of the Companies (Accounts) Rules, 2014 (Indian GAAP). These financial statements for the year ended
March 31, 2017 are the first, Ind AS financial statements that the Company has prepared in accordance with Ind AS. Refer to note 3 for information on how the Company adopted Ind AS.
The financial statements are prepared on a going concern basis are presented in INR and all values are rounded to the nearest million ` (000,000) except when otherwise indicated. The financial statements have been prepared under the historical cost basis except for derivative financial instruments and certain other financial assets and liabilities that have been measured at fair value.
Current versus non-current classification The Company presents assets and liabilities in
the balance sheet based on current/ non-current classification. An asset is treated as current when it is:
• Expected to be realised or intended to be sold or consumed in normal operating cycle
• Held primarily for the purpose of trading • Expected to be realised within twelve months
after the reporting period, or • Cash or cash equivalents unless restricted
from being exchanged or used to settle a liability for at least twelve months after the reporting period
All other assets are classified as non-current.
A liability is current when: • It is expected to be settled in normal operating
cycle • It is held primarily for the purpose of trading • It is due to be settled within twelve months
after the reporting period, or • There is no unconditional right to defer the
settlement of the liability for at least twelve months after the reporting period
The Company classifies all other liabilities as non-current.
Deferred tax assets and liabilities are classified as non-current assets and liabilities.
The operating cycle is the time between the acquisition of assets for processing and their realisation in cash and cash equivalents. The

Markets That Matter
ANNUAL REPORT 2016-17134
NOTES to financial statements as at and for the year ended March 31, 2017
Company has identified period of twelve months as its operating cycle.
2.2 Property, plant and equipment Freehold land is carried at historical cost. Plant and
equipment is stated at cost, net of accumulated depreciation and accumulated impairment losses, if any. When significant parts of plant and equipment are required to be replaced at intervals, the Company depreciates them separately based on their specific useful lives. Likewise, when a major inspection is performed, its cost is recognised in the carrying amount of the plant and equipment as a replacement if the recognition criteria are satisfied. All other repair and maintenance costs are recognised in profit or loss as incurred.
Capital work in progress is stated at cost. Capital work-in-progress comprises of plant and machinery, office equipment, electrical installation which are not ready to use and expenditure incurred for construction of building.
In respect of its interests in jointly controlled assets, the Company recognises its share of the jointly controlled assets in its financial statements, classifying the jointly controlled asset as per its nature.
An item of property, plant and equipment and any significant part initially recognised is derecognised upon disposal or when no future economic benefits are expected from its use or disposal. Any gain or loss arising on derecognition of the asset (calculated as the difference between the net disposal proceeds and the carrying amount of the asset) is included in the statement of profit and loss when the asset is derecognised.
Costs of construction that relate directly to the specific asset and cost that are attributable to the construction activity in general and can be allocated to the specific assets are capitalised. Income earned during the construction period and income from trial runs is deducted from such expenditure pending allocation.
2.3 Intangible assets Intangible assets acquired separately are
measured on initial recognition at cost. Following initial recognition, intangible assets are carried
at cost less any accumulated amortisation and accumulated impairment losses, if any. Internally generated intangibles, excluding capitalised development costs, are not capitalised and the related expenditure is reflected in profit or loss in the period in which the expenditure is incurred.
Intangible assets with finite lives are amortised over the useful economic life and assessed for impairment whenever there is an indication that the intangible asset may be impaired. The amortisation period and the amortisation method for an intangible asset with a finite useful life are reviewed at least at the end of each reporting period.
Gains or losses arising from derecognition of an intangible asset are measured as the difference between the net disposal proceeds and the carrying amount of the asset and are recognised in the statement of profit and loss when the asset is derecognised.
2.4 Investment property An investment in land or building, which is not
intended to be occupied substantially for use by, or in the operations of the Company, is classified as investment property. Investment properties are stated at cost, net of accumulated depreciation and accumulated impairment losses, if any.
The cost comprises purchase price, borrowing costs if capitalization criteria are met and directly attributable cost of bringing the investment property to its working condition for the intended use. Any trade discounts and rebates are deducted in arriving at the purchase price.
Depreciation on building component of investment property is calculated on a straight-line basis using the rate arrived at based on the useful life estimated by the management which is 60 years.
Investment properties are derecognised either when they have been disposed of or when they are permanently withdrawn from use and no future economic benefit is expected from their disposal. The difference between the net disposal proceeds and the carrying amount of the asset is recognised in profit or loss in the period of derecognition.

Financial Statements - Standalone
135
Overview
Statutory R
eportsFinancial S
tatements
Subsidiaries
NOTES to financial statements as at and for the year ended March 31, 2017
2.5 Depreciation and amortisation The Company provides depreciation on property,
plant and equipment, investment properties using the straight line method at the rates computed based on the estimated useful lives of the assets as estimated by the management which are equal to the corresponding rates prescribed in Schedule II to the Act. Further, Company provides amortisation of intangible asset using the straight line method at the rates computed based on the estimated useful lives of the assets as estimated by the management.
The Company has used the following lives to provide depreciation and amortisation:
CategoryUseful lives(in years)
Factory buildings – freehold 30Office buildings – freehold 60Plant and machineries 15Office equipment 5Vehicles 8Furniture and fixtures 10Electrical Fittings, Fans and Coolers 10Computers and servers 3 to 6One time license Fees for radio stations
15
Computer software including ERP 5
Leasehold land and buildings are depreciated on a straight line basis over the period of lease specified in agreements restricted to the expected economic useful life of asset, i.e. lease period which ranges from 30 years to 99 years in case of leasehold land and up to 60 years in case of leasehold buildings. Leasehold improvements are depreciated on a straight line basis over the shorter of the estimated useful life of the asset or the lease term, which does not exceed 10 years.
The residual values, useful lives and methods of depreciation and amortisation of property, plant and equipment and intangible assets are reviewed at each financial year end and adjusted prospectively, if appropriate.
2.6 Impairment of non- financial assets The Company assesses, at each reporting date,
whether there is an indication that an asset may be impaired. If any indication exists, or when annual impairment testing for an asset is required, the
Company estimates the asset’s recoverable amount. An asset’s recoverable amount is the higher of an asset’s or cash-generating unit’s (‘CGU’) fair value less costs of disposal and its value in use. Recoverable amount is determined for an individual asset, unless the asset does not generate cash inflows that are largely independent of those from other assets or Company of assets. When the carrying amount of an asset or CGU exceeds its recoverable amount, the asset is considered impaired and is written down to its recoverable amount.
In assessing value in use, the estimated future cash flows are discounted to their present value using a pre-tax discount rate that reflects current market assessments of the time value of money and the risks specific to the asset. In determining net selling price, recent market transactions are taken into account, if available. If no such transactions can be identified, an appropriate valuation model is used.
The Company bases its impairment calculation on detailed budgets and forecast calculations which are prepared separately for each of the Company’s cash-generating units to which the individual assets are allocated. These budgets and forecast calculations are generally covering a period of five years. For longer periods, wherever applicable, a long-term growth rate is calculated and applied to projected future cash flows after the fifth year.
After impairment, depreciation is provided on the revised carrying amount of the asset over its remaining useful life.
2.7 Leases The determination of whether an arrangement is
(or contains) a lease is based on the substance of the arrangement at the inception of the lease. The arrangement is, or contains, a lease if fulfillment of the arrangement is dependent on the use of a specific asset or assets and the arrangement conveys a right to use the asset or assets, even if that right is not explicitly specified in an arrangement.
Where the Company is the lessees Leases, where the lessor effectively retains
substantially all the risks and benefits of ownership of the leased items are classified as operating leases. Operating lease payments are recognised

Markets That Matter
ANNUAL REPORT 2016-17136
NOTES to financial statements as at and for the year ended March 31, 2017
as an expense in the statement of profit and loss on a straight-line basis over the lease term.
Where the Company is the lessor Leases in which the Company does not transfer
substantially all the risks and rewards of ownership of an asset are classified as operating leases. Rental income from operating lease is recognised on a straight-line basis over the term of the relevant lease.
2.8 Inventories Inventories are valued as follows:
Raw materials (Newsprint and stores and spares) - Lower of cost and net realisable value. Cost includes cost of purchase and other costs incurred in bringing the inventories to their present location and condition. Cost is determined on a weighted average basis.
Finished goods (Magazines) - Lower of cost and net realisable value. Cost is determined on a weighted average basis.
Net realisable value is the estimated selling price in the ordinary course of business, less estimated costs of completion and the estimated costs necessary to make the sale.
2.9 Revenue recognition Revenue is recognised to the extent that it is
probable that the economic benefits will flow to the Company and the revenue can be reliably measured. Revenue is measured at the fair value of the consideration received or receivable, taking into account contractually defined terms of payment and excluding taxes or duties collected on behalf of the government. The Company has concluded that it is the principal in all of its revenue arrangements since it is the primary obligor in all the revenue arrangements as it has pricing latitude and is also exposed to inventory and credit risks.
Sales tax/ value added tax (‘VAT’) and service tax is not received by the Company on its own account. Rather, it is tax collected on value added to the commodity / services by the seller on behalf of the government. Accordingly, it is excluded from revenue.
The specific recognition criteria described below must also be met before revenue is recognised.
Advertisement revenue Revenue is recognised as and when advertisement
is published in newspaper / aired on radio / displayed on website in accordance with the terms of the contract with customer and is disclosed net of trade discounts and service tax, wherever applicable.
Sale of newspapers, magazines, wastage and scrap
Revenue is recognised when all the significant risks and rewards of ownership have passed on to the buyer, usually on delivery of the goods and is disclosed net of sales return, trade discounts and taxes.
Printing job charges Revenue from printing job work is recognised on
the completion of job work as per terms of the agreement with the customer and is disclosed net of trade discounts and taxes.
Income from event management Revenue from event management is recognised
as and when the event management services are rendered as per the terms of agreement.
Interest For all debt instruments measured either at
amortised cost, interest income is recorded using the effective interest rate (‘EIR’). EIR is the rate that exactly discounts the estimated future cash payments or receipts over the expected life of the financial instrument or a shorter period, where appropriate, to the gross carrying amount of the financial asset or to the amortised cost of a financial liability. When calculating the effective interest rate, the Company estimates the expected cash flows by considering all the contractual terms of the financial instrument but does not consider the expected credit losses. Interest income is included in finance income in the statement of profit and loss.
Dividend Income Revenue is recognised when the Company’s right
to receive the payment is established, which is generally when shareholders approve the dividend.

Financial Statements - Standalone
137
Overview
Statutory R
eportsFinancial S
tatements
Subsidiaries
NOTES to financial statements as at and for the year ended March 31, 2017
2.10 Barter transactions Revenue from barter transactions involving
exchange of advertisements with non-monetary assets such as investment or property is measured at the fair value of the advertisements published / aired, as it is more clearly evident.
The receivable relating to property barter agreements is grouped as advance for properties and included under the head ‘Other assets’.
2.11 Foreign currency transactions Transactions in foreign currencies are initially
recorded by the Company at their respective functional currency spot rates at the date the transaction first qualifies for recognition.
Monetary assets and liabilities denominated in foreign currencies are translated at the functional currency spot rates of exchange at the reporting date. Exchange differences arising on settlement or translation of monetary items are recognised as income or expenses in the period in which they arise.
Non-monetary items that are measured in terms of historical cost in a foreign currency are translated using the exchange rates at the dates of the initial transactions.
2.12 Retirement and other employee benefits Retirement benefit in the form of provident fund is
a defined contribution scheme. The Company has no obligation other than the contribution payable to the provident fund. The Company recognises contribution payable to the provident fund scheme as expenses, when an employee renders the related service.
Gratuity liability is a defined benefit obligation and is provided for on the basis of an actuarial valuation done as per projected unit credit method, carried out by an independent actuary at the end of the year. The Company makes contributions to a trust administered and managed by an insurance company to fund the gratuity liability. Under this scheme, the obligation to pay gratuity remains with the Company, although insurance company administers the scheme.
Net interest is calculated by applying the discount rate to the net defined benefit liability or asset. The Company recognises the following changes in the net defined benefit obligation as an expense in the statement of profit and loss - Service costs comprising current service costs, past-service costs, gains and losses on curtailments and non-routine settlements and net interest expense or income.
Remeasurements, comprising of actuarial gains and losses, the effect of the asset ceiling, excluding amounts included in net interest on the net defined benefit liability and the return on plan assets (excluding amounts included in net interest on the net defined benefit liability), are recognised immediately in the balance sheet with a corresponding debit or credit to retained earnings through OCI in the period in which they occur. Remeasurements are not reclassified to profit or loss in subsequent periods.
Accumulated leave, which is expected to be utilised within the next 12 months, is treated as short term employee benefit. The Company measures the expected cost of such absences as the additional amount that it expects to pay as a result of the unused entitlement that has accumulated at the reporting date. The Company treats accumulated leave expected to be carried forward beyond twelve months, as long-term employee benefit for measurement purposes. Such long term compensated absences are provided for based on the actuarial valuation using the projected unit credit method at the year end. The Company presents the leave as a short-term provision in the balance sheet to the extent it does not have an unconditional right to defer its settlement for 12 months after the reporting date. Where Company has the unconditional legal and contractual right to defer the settlement for a period beyond 12 months, the same is presented as long term provision.
2.13 Income taxes Current income tax Current income tax liabilities are measured at the
amount expected to be paid to the tax authorities in accordance with the Income-tax Act, 1961. The tax rates and tax laws used to compute the amount are those that are enacted or substantively enacted, at the reporting date.

Markets That Matter
ANNUAL REPORT 2016-17138
NOTES to financial statements as at and for the year ended March 31, 2017
Current income tax relating to items recognised outside profit or loss is recognised outside profit or loss (either in OCI or in equity). Current tax items are recognised in correlation to the underlying transaction either in OCI or directly in equity. Management periodically evaluates positions taken in the tax returns with respect to situations in which applicable tax regulations are subject to interpretation and establishes provisions where appropriate.
Deferred tax Deferred tax is provided using the liability method
on temporary differences between the tax bases of assets and liabilities and their carrying amounts for financial reporting purposes at the reporting date.
Deferred tax assets are recognised for all deductible temporary differences, the carry forward of unused tax credits and any unused tax losses. Deferred tax assets are recognised to the extent that it is probable that taxable profit will be available against which the deductible temporary differences and the carry forward of unused tax credits and unused tax losses can be utilised.
The carrying amount of deferred tax assets is reviewed at each reporting date and reduced to the extent that it is no longer probable that sufficient taxable profit will be available to allow all or part of the deferred tax asset to be utilised. Unrecognised deferred tax assets are re-assessed at each reporting date and are recognised to the extent that it has become probable that future taxable profits will allow the deferred tax asset to be recovered.
Deferred tax assets and liabilities are measured at the tax rates that are expected to apply in the year when the asset is realised or the liability is settled, based on tax rates (and tax laws) that have been enacted or substantively enacted at the reporting date.
Deferred tax relating to items recognised outside profit or loss is recognised outside profit or loss (either in OCI or in equity). Deferred tax items are recognised in correlation to the underlying transaction either in OCI or directly in equity.
Deferred tax assets and deferred tax liabilities are offset if a legally enforceable right exists to set off
current tax assets against current tax liabilities and the deferred taxes relate to the same taxable entity and the same taxation authority.
2.14 Provisions Provisions are recognised when the Company
has a present obligation (legal or constructive) as a result of a past event, it is probable that an outflow of resources embodying economic benefits will be required to settle the obligation and a reliable estimate can be made of the amount of the obligation. When the Company expects some or all of a provision to be reimbursed, for example, under an insurance contract, the reimbursement is recognised as a separate asset, but only when the reimbursement is virtually certain. The expense relating to a provision is presented in the statement of profit and loss net of any reimbursement, if any.
If the effect of the time value of money is material, provisions are discounted using a current pre-tax rate that reflects, when appropriate, the risks specific to the liability. When discounting is used, the increase in the provision due to the passage of time is recognised as a finance cost.
2.15 Contingent liabilities A contingent liability is a possible obligation that
arises from past events whose existence will be confirmed by the occurrence or non-occurrence of one or more uncertain future events beyond the control of the Company or a present obligation that arises from past events but is not recognised because it is not probable that an outflow of resources will be required to settle the obligation. A contingent liability also arises in extremely rare cases where there is a liability that cannot be recognised because it cannot be measured reliably.
2.16 Borrowing costs Borrowing costs directly attributable to the
acquisition, construction or production of an asset that necessarily takes a substantial period of time to get ready for its intended use or sale are capitalised as part of the cost of the asset. All other borrowing costs are expensed in the period in which they occur. Borrowing costs consist of interest and other costs that an entity incurs in connection with the borrowing of funds. Borrowing cost also includes exchange differences to the extent regarded as an adjustment to the borrowing costs. These exchange difference are presented in finance cost to the

Financial Statements - Standalone
139
Overview
Statutory R
eportsFinancial S
tatements
Subsidiaries
NOTES to financial statements as at and for the year ended March 31, 2017
extent which the exchange loss does not exceed the difference between the cost of borrowing in functional currency when compared to the cost of borrowing in a foreign currency.
2.17 Earnings per equity share (“EPS”) Basic EPS amounts are calculated by dividing the
profit for the year attributable to equity holders by the weighted average number of equity shares outstanding during the year.
Diluted EPS amounts are calculated by dividing the profit attributable to equity holders by the weighted average number of equity shares outstanding during the year plus the weighted average number of equity shares that would be issued on conversion of all the dilutive potential equity shares into equity shares.
2.18 Cash and cash equivalents Cash and cash equivalent in the balance sheet and
cash flow statement comprise cash at banks and on hand and short-term deposits with an original maturity of three months or less, which are subject to an insignificant risk of changes in value.
2.19 Employee stock compensation cost The cost of equity-settled transactions for unvested
tranches of grants as at April 01, 2015 is determined by the fair value at the date when the grant is made using Black and Scholes valuation model. The cost is recognised, together with a corresponding increase in “Stock options outstanding” reserves in equity, over the period in which the performance and/or service conditions are fulfilled in employee benefits expense. The cumulative expense recognised for equity-settled transactions at each reporting date until the vesting date reflects the extent to which the vesting period has expired and the Company’s best estimate of the number of equity instruments that will ultimately vest. The statement of profit and loss expense or credit for a period represents the movement in cumulative expense recognised as at the beginning and end of that period and is disclosed under employee benefits expense.
No expense is recognised for awards that remain unvested because service conditions have not been met. The dilutive effect of outstanding options is reflected as additional share dilution in the computation of diluted earnings per share.
2.20 Fair value measurement The Company measures financial instruments at fair
value at each balance sheet date.
Fair value is the price that would be received to sell an asset or paid to transfer a liability in an orderly transaction between market participants at the measurement date. The fair value measurement is based on the presumption that the transaction to sell the asset or transfer the liability takes place either:
• In the principal market for the asset or liability, or
• In the absence of a principal market, in the most advantageous market for the asset or liability
The principal or the most advantageous market must be accessible by the Company.
The fair value of an asset or a liability is measured using the assumptions that market participants would use when pricing the asset or liability, assuming that market participants act in their economic best interest.
A fair value measurement of a non-financial asset takes into account a market participant’s ability to generate economic benefits by using the asset in its highest and best use or by selling it to another market participant that would use the asset in its highest and best use.
The Company uses valuation techniques that are appropriate in the circumstances and for which sufficient data are available to measure fair value, maximising the use of relevant observable inputs and minimising the use of unobservable inputs.
All assets and liabilities for which fair value is measured or disclosed in the financial statements are categorised within the fair value hierarchy, described as follows, based on the lowest level input that is significant to the fair value measurement as a whole:
Level 1: Quoted (unadjusted) market prices in active markets for identical assets or liabilities
Markets That Matter
ANNUAL REPORT 2016-17140
NOTES to financial statements as at and for the year ended March 31, 2017
Level 2: Valuation techniques for which the lowest level input that is significant to the fair value measurement is directly or indirectly observable
Level 3: Valuation techniques for which the lowest level input that is significant to the fair value measurement is unobservable
For assets and liabilities that are recognised in the financial statements on a recurring basis, the Company determines whether transfers have occurred between levels in the hierarchy by re-assessing categorisation (based on the lowest level input that is significant to the fair value measurement as a whole) at the end of each reporting period.
External valuers are involved for valuation of significant assets, such as properties and unquoted financial assets.
For the purpose of fair value disclosures, the Company has determined classes of assets and liabilities on the basis of the nature, characteristics and risks of the asset or liability and the level of the fair value hierarchy as explained above.
2.21 Financial instruments A financial instrument is any contract that gives rise
to a financial asset of one entity and a financial liability or equity instrument of another entity.
Financial assets Initial recognition and measurement Financial assets are recognised when the Company
becomes a party to the contractual provisions of the instrument. Financial assets are initially measured at fair value. Transaction costs that are directly attributable to the acquisition or issue of financial assets (other than financial assets at fair value through profit or loss) are added to or deducted from the fair value measured on initial recognition of financial assets.
Subsequent measurement Financial assets at amortised cost For purposes of subsequent measurement, financial
assets are classified in three categories: • Debt instruments at amortised cost • Derivatives and equity instruments at Fair
Value Through Profit or Loss (‘FVTPL’) • Equity instruments measured at FVTOCI
Debt instruments at amortised cost A ‘debt instrument’ is measured at the amortised
cost using the effective interest rate (‘EIR’) method if both the following conditions are met:
a) The asset is held within a business model whose objective is to hold assets for collecting contractual cash flows, and
b) Contractual terms of the asset give rise on specified dates to cash flows that are Solely Payments of Principal and Interest (‘SPPI’) on the principal amount outstanding.
After initial measurement, such financial assets are subsequently measured at amortised cost using the effective interest rate (‘EIR’) method. Amortised cost is calculated by taking into account any discount or premium on acquisition and fees or costs that are an integral part of the EIR. The EIR amortisation is included in finance income in the profit or loss. The losses arising from impairment are recognised in the profit or loss. This category generally applies to trade receivables, deposits and advances.
Derivative financial instrument The Company uses forward currency contracts,
to hedge its foreign currency risks. Such forward currency contracts are initially recognised at fair value on the date on which a forward currency contracts is entered into and as at balance sheet date any gains or losses arising from changes in the fair value of derivatives are taken directly to statement of profit and loss.
Equity investments All equity investments in scope of Ind AS 109 are
measured at fair value. Equity instruments which are held for trading are classified as at FVTPL. For all other equity instruments, the Company may make an irrevocable election to present in OCI subsequent changes in the fair value. The Company makes such election on an instrument-by-instrument basis. The classification is made on initial recognition and is irrevocable.
Equity instruments included within the FVTPL category are measured at fair value with all changes recognized in the profit or loss.

Financial Statements - Standalone
141
Overview
Statutory R
eportsFinancial S
tatements
Subsidiaries
NOTES to financial statements as at and for the year ended March 31, 2017
If the Company decides to classify an equity instrument as at FVTOCI, then all fair value changes on the instrument, excluding dividends, are recognized in the OCI. There is no recycling of the amounts from OCI to profit and loss, even on sale of investment. However, the Company may transfer the cumulative gain or loss within equity.
Derecognition A financial asset (or, where applicable, a part of
a financial asset or part of a company of similar financial assets) is primarily derecognised (i.e. removed from the Company’s balance sheet) when:
• The rights to receive cash flows from the asset have expired, or
• The Company has transferred its rights to receive cash flows from the asset and either (a) the Company has transferred substantially all the risks and rewards of the asset, or (b) the Company has neither transferred nor retained substantially all the risks and rewards of the asset, but has transferred control of the asset.
Impairment of financial assets In accordance with Ind AS 109, the Company applies
expected credit loss (‘ECL’) model for measurement and recognition of impairment loss on the financial assets which are not fair valued through profit or loss. Loss allowance for trade receivables with no significant financing component is measured at an amount equal to lifetime ECL at each reporting date, right from its initial recognition. For all other financial assets, expected credit losses are measured at an amount equal to the 12-month ECL, unless there has been a significant increase in credit risk from initial recognition in which case those are measured at lifetime ECL. If, in a subsequent period, credit quality of the instrument improves such that there is no longer a significant increase in credit risk since initial recognition, then the entity reverts to recognising impairment loss allowance based on 12-month ECL.
ECL impairment loss allowance (or reversal) recognized during the period is recognized as income/ expense in the statement of profit and loss. This amount is reflected under the head ‘other expenses’ in the statement of profit and loss.
As a practical expedient, the Company uses a provision matrix to determine impairment loss
allowance on portfolio of its trade receivables. The provision matrix is based on its historically observed default rates over the expected life of the trade receivables and is adjusted for forward-looking estimates. At every reporting date, the historical observed default rates are updated and changes in the forward-looking estimates are analysed.
Financial liabilities Initial recognition and measurement Financial liabilities are classified, at initial recognition,
as financial liabilities at fair value through profit or loss, loans and borrowings, payables, or as derivatives financial instruments, as appropriate.
All financial liabilities are recognised initially at fair value and in the case of loans and borrowings and payables, net of directly attributable transaction costs.The Company’s financial liabilities include trade and other payables, loans and borrowings including bank overdrafts, financial guarantee contracts and derivative financial instruments.
Derecognition A financial liability is derecognised when the
obligation under the liability is discharged or cancelled or expires. When an existing financial liability is replaced by another from the same lender on substantially different terms, or the terms of an existing liability are substantially modified, such an exchange or modification is treated as the derecognition of the original liability and the recognition of a new liability. The difference in the respective carrying amounts is recognised in the statement of profit and loss.
2.22 Significant accounting judgments, estimates and assumptions
The preparation of the Company’s financial statements requires management to make judgements, estimates and assumptions that affect the reported amounts of revenues, expenses, assets and liabilities, and the accompanying disclosures, and the disclosure of contingent liabilities. Uncertainty about these assumptions and estimates could result in outcomes that require a material adjustment to the carrying amount of assets or liabilities affected in future periods.

Markets That Matter
ANNUAL REPORT 2016-17142
NOTES to financial statements as at and for the year ended March 31, 2017
Significant judgement Operating lease commitments – Company as
lessee The Company has entered into commercial
property leases for its offices and premises. The Company has determined, based on an evaluation of the terms and conditions of the arrangements, such as the lease term not constituting a major part of the economic life of the commercial property and the fair value of the asset, that it does not retain all the significant risks and rewards of ownership of these properties and accounts for the contracts as operating leases.
Estimates Defined benefit plans (gratuity benefits) The cost of the defined benefit gratuity plan and
the present value of the gratuity obligation are determined using actuarial valuations. An actuarial valuation involves making various assumptions that may differ from actual developments in the future. These include the determination of the discount rate, future salary increases and mortality rates. All assumptions are reviewed at each reporting date.
The parameter most subject to change is the discount rate. In determining the appropriate discount rate for plans operated in India, the management considers the interest rates of government bonds in currencies consistent with the currencies of the post-employment benefit obligation. Future salary increases and gratuity increases are based on expected future inflation rates for the respective countries. The mortality rate is based on publicly available mortality tables for the specific countries. Those mortality tables tend to change only at interval in response to demographic changes.
Share-based payments The Company initially measures the cost of equity-
settled transactions with employees using Black and Scholes model to determine the fair value of the liability incurred. Estimating fair value for share-based payment transactions requires determination of the most appropriate valuation model, which is dependent on the terms and conditions of the grant. This estimate also requires determination of the most appropriate inputs to the valuation model including the expected life of the share option, volatility and dividend yield and making assumptions about them.
Property, plant and equipment Property, plant and equipment represent a significant
proportion of the asset base of the Company. The charge in respect of periodic depreciation is derived after determining an estimate of an asset’s expected useful life and the expected residual value at the end of its life. The useful lives and residual values of Company assets are determined by management at the time the asset is acquired and reviewed periodically, including at each financial year end. The lives are based on historical experience with similar assets.
2.23 Recent accounting pronouncements Standards issued but not yet effective In March 2017, the Ministry of Corporate Affairs
issued the Companies (Indian Accounting Standards) (Amendments) Rules, 2017, notifying amendments to Ind AS 7, ‘Statement of cash flows’ and Ind AS 102, ‘Share-based payment.’ These amendments are in accordance with the recent amendments made by International Accounting Standards Board (IASB) to IAS 7, ‘Statement of cash flows’ and IFRS 2, ‘Share-based payment,’ respectively. The amendments are applicable to the Company from April 1, 2017.
Amendment to Ind AS 7 The amendment to Ind AS 7 requires the entities to
provide disclosures that enable users of financial statements to evaluate changes in liabilities arising from financing activities, including both changes arising from cash flows and non-cash changes, suggesting inclusion of a reconciliation between the opening and closing balances in the balance sheet for liabilities arising from financing activities, to meet the disclosure requirement. The Company is evaluating the requirements of the amendment and the effect on the financial statement is being evaluated
Amendment to Ind AS 102 The amendment to Ind AS 102 provides specific
guidance to measurement of cash-settled awards, modification of cash-settled awards and awards that include a net settlement feature in respect of withholding taxes.
It clarifies that the fair value of cash-settled awards is determined on a basis consistent with that used for equity-settled awards. Market-based performance

Financial Statements - Standalone
143
Overview
Statutory R
eportsFinancial S
tatements
Subsidiaries
NOTES to financial statements as at and for the year ended March 31, 2017
conditions and non-vesting conditions are reflected in the ‘fair values’, but non-market performance conditions and service vesting conditions are reflected in the estimate of the number of awards expected to vest. Also, the amendment clarifies that if the terms and conditions of a cash-settled share-based payment transaction are modified with the result that it becomes an equity-settled share-based payment transaction, the transaction is accounted for as such from the date of the modification. Further, the amendment requires the award that include a net settlement feature in respect of withholding taxes to be treated as equity-settled in its entirety. The cash payment to the tax authority is treated as if it was part of an equity settlement.
The Company does not have any cash settled award as at March 31 2017.
3. FIRST TIME ADOPTION OF IND AS These financial statements, for the year ended
March 31, 2017, are the first Financial statements that the Company has prepared in accordance with Ind AS together with the comparative period data as at and for the year ended March 31, 2016. In preparing these financial statements, the Company’s opening balance sheet was prepared as at April 01, 2015, the Company’s date of transition to Ind AS. This note explains the adjustments made by the Company in restating its Indian GAAP financial statements, including the balance sheet as at April 01, 2015 and the financial statements as at and for the year ended March 31, 2016.
Following Exemptions and / or election applied to the Company for the first Ind AS financial statements
(a) Ind AS 102 has not been applied to equity instruments in share-based payment transactions that vested before April 01, 2015.
(b) The Company has designated unquoted equity instruments held at April 01, 2015 as FVTOCI investments.
(c) The estimates at April 01, 2015 and at March 31, 2016 are consistent with those made for the same dates in accordance with Indian GAAP (after adjustments to reflect any differences in accounting policies) apart from the following items where application of Indian GAAP did not require estimation:
a) FVTOCI – unquoted equity shares b) FVTPL – quoted equity shares c) FVTOCI – debt securities d) Impairment of financial assets based on
expected credit loss model
The estimates used by the Company to present these amounts in accordance with Ind AS reflect conditions at April 01, 2015, the date of transition to Ind AS and as of March 31, 2016.

Markets That Matter
ANNUAL REPORT 2016-17144
NOTES to financial statements as at and for the year ended March 31, 2017
Reconciliation of equity as per previous GAAP and Ind AS for year ended March 31, 2016 and as at April 01, 2015 is as under:
(` in million)
Particulars Notes March 31, 2016 April 01, 2015Equity as per previous GAAP 13,485.36 12,864.81
Add:
Dividends (including dividend distribution tax) not recognised as liability on declared basis
5 940.05 936.90
Finance income recognised on effective interest rate basis 6 68.53 73.01
Effect of measuring financial instruments at fair value through profit & loss and OCI 2 18.95 43.27
Deferred tax Impact on above adjustments (net) 9 28.81 14.80
Less:
Exchange loss on long term foreign currency loan (net of related depreciation) 1 (241.84) (220.64)
Rent recognised over lease period 6 (208.46) (177.73)
Allowance on account of ECL 3 (88.80) (88.80)
Income from corporate guarantee given 7 (8.81) (11.45)
Others 4 and 8 0.35 -
Equity as per Ind AS 13,994.14 13,434.17
Reconciliation of total comprehensive income as previously reported under IGAAP to Ind AS (` in million)
Particulars Notes March 31, 2016Net profit as per previous GAAP 3,002.49
Add:
Interest income recognised on effective interest rate basis 6 37.79
Recognition of income on corporate guarantee given 7 2.64
Exchange loss on long term foreign currency loan (Net of related depreciation) 1 (21.20)
Actuarial loss on defined employee benefit plans recognised through OCI 10 7.21
Others 4 and 8 0.84
Less:Expense recognised on fair value of security and other deposits 6 (73.01)
Gain (net) on fair valuation / sale of financial instruments 2 (12.17)
Tax expense on above 9 12.21
Net profit as per Ind AS 2,956.80
OCI (17.55)
Total comprehensive income 2,939.25
Notes:
1. Under the previous GAAP, the Company capitalised exchange differences arising on translation / settlement of long-term foreign currency monetary items pertaining to the acquisition of a depreciable asset to the respective asset and depreciated over the remaining life of the asset. Under Ind AS the exchange difference upto April 1, 2015 is adjusted against the opening balance of retained earnings and for subsequent periods it is recorded in the statement of profit and loss.
2. As per Ind AS, equity instruments to be measured at fair value either through OCI or statement of profit and loss. The Company has designated all the equity investments as FVTOCI investments except for one of the investments which is designated as Fair Value through Profit and Loss (‘FVTPL’) as it was held for trading.
3. Under the previous GAAP, the Company had created provision for impairment of receivables only in respect of specific amount for incurred losses. Under Ind AS 109, impairment allowance has been determined based on Expected Credit Loss model (‘ECL’).
Financial Statements - Standalone
145
Overview
Statutory R
eportsFinancial S
tatements
Subsidiaries
NOTES to financial statements as at and for the year ended March 31, 2017
4. The fair value of foreign exchange forward contracts is recognised under Ind AS which was not recognised under the previous GAAP. Under the previous GAAP forward contracts were accounted under AS 11 whereby the premium was recognised to profit and loss over the period of the forward contract.
5. Under the previous GAAP, proposed dividends including DDT were recognised as a liability in the period to which they relate, irrespective of when they are declared. As per Ind AS, dividend is recognised in the period in which it is approved.
6. Under the previous GAAP, interest free lease security deposits (those are refundable on completion for the lease term) and other deposits were recorded at transactional values. Under Ind AS, these security deposits are recognised initially at the fair value. The difference between the fair value and the transaction value of these security deposits has been recognised as prepaid rent. Subsequently, these lease security deposits are measured at amortised cost using the effective interest rate (‘EIR’).
7. Under the previous GAAP, this financial guarantee was not recorded. As per Ind AS, the Company has
recognised unearned income for financial guarantee under other financial liability.
8. Under the previous GAAP, the cost of ESOS were recognised using the intrinsic value method. Under Ind AS the cost of ESOS is recognised based on the fair value of the options as at the grant date only for options unvested as at transition date.
9. Adjustments to deferred taxes has been made in accordance, for the above mentioned line items.
10. OCI: Under previous GAAP, the Company has not presented OCI separately. Hence, it has reconciled previous GAAP profit to total comprehensive income as per Ind AS.
11. The transition from previous GAAP to Ind AS has not had a material impact on the statement of cash flows.
12. In line with the requirements of Ind AS the Company has reclassified certain assets and liabilities as at April 1, 2015 and March 31, 2016. These majorly includes reclassification between current and non-current investments, security deposits and prepayments, investments and investment properties
Markets That Matter
ANNUAL REPORT 2016-17146
NOTES to financial statements as at and for the year ended March 31, 2017
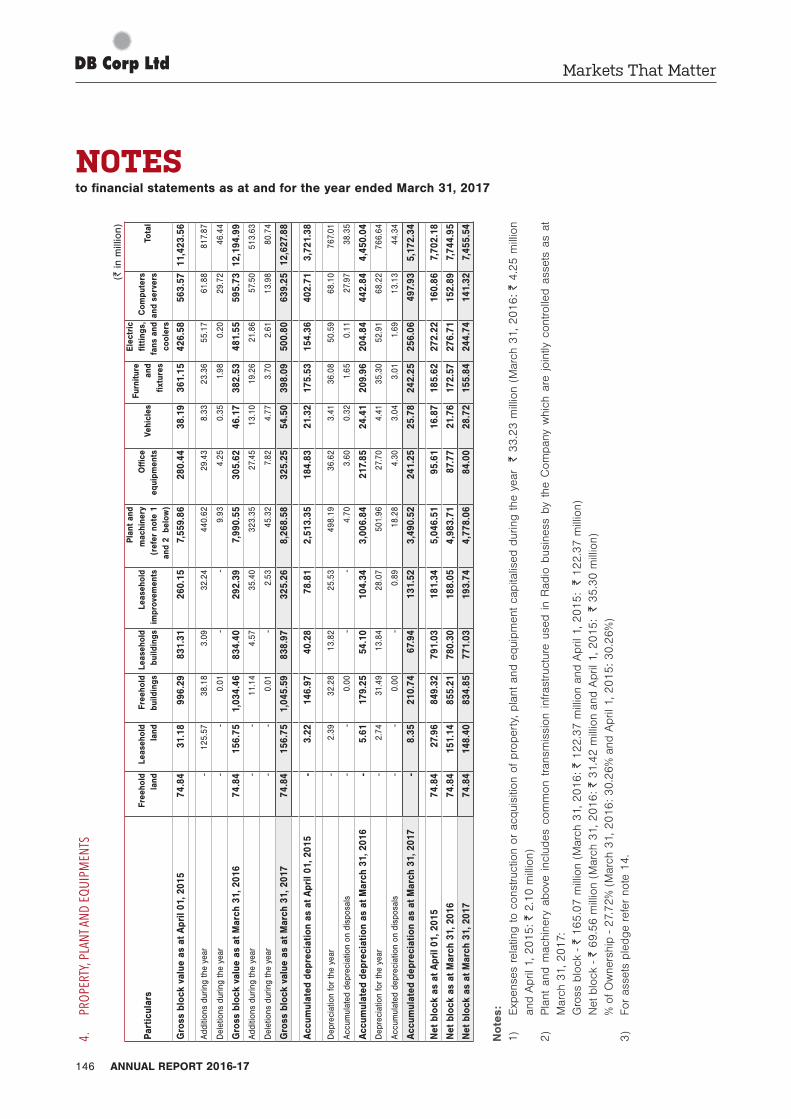
4. PR
OPER
TY, P
LANT
AND
EQUI
PMEN
TS
(` in
mill
ion)
Part
icul
ars
Fre
ehol
d la
nd
Leas
ehol
d la
nd F
reeh
old
build
ings
Le
aseh
old
build
ings
Lea
seho
ld
impr
ovem
ents
Plan
t and
m
achi
nery
(r
efer
not
e 1
and
2 b
elow
)
Offi
ce
equi
pmen
ts V
ehic
les
Fur
nitu
re
and
fixtu
res
Ele
ctri
c fit
tings
, fa
ns a
nd
cool
ers
Com
pute
rs
and
serv
ers
Tot
al
Gro
ss b
lock
val
ue a
s at
Apr
il 01
, 201
574
.84
31.1
899
6.29
831.
3126
0.15
7,55
9.86
280.
4438
.19
361.
1542
6.58
563.
5711
,423
.56
Addi
tions
dur
ing
the
year
- 12
5.57
38.1
83.
0932
.24
440.
6229
.43
8.33
23.3
655
.17
61.8
881
7.87
Del
etio
ns d
urin
g th
e ye
ar -
- 0.
01 -
- 9.
934.
250.
351.
980.
2029
.72
46.4
4
Gro
ss b
lock
val
ue a
s at
Mar
ch 3
1, 2
016
74.8
415
6.75
1,03
4.46
834.
4029
2.39
7,99
0.55
305.
6246
.17
382.
5348
1.55
595.
7312
,194
.99
Addi
tions
dur
ing
the
year
- -
11.1
44.
5735
.40
323.
3527
.45
13.1
019
.26
21.8
657
.50
513.
63
Del
etio
ns d
urin
g th
e ye
ar -
- 0.
01 -
2.53
45.3
27.
824.
773.
702.
6113
.98
80.7
4
Gro
ss b
lock
val
ue a
s at
Mar
ch 3
1, 2
017
74.8
415
6.75
1,04
5.59
838.
9732
5.26
8,26
8.58
325.
2554
.50
398.
0950
0.80
639.
2512
,627
.88
Accu
mul
ated
dep
reci
atio
n as
at A
pril
01, 2
015
- 3.
2214
6.97
40.2
878
.81
2,51
3.35
184.
8321
.32
175.
5315
4.36
402.
713,
721.
38
Dep
reci
atio
n fo
r th
e ye
ar -
2.39
32.2
813
.82
25.5
349
8.19
36.6
23.
4136
.08
50.5
968
.10
767.
01
Accu
mul
ated
dep
reci
atio
n on
dis
posa
ls -
- 0.
00 -
- 4.
703.
600.
321.
650.
1127
.97
38.3
5
Accu
mul
ated
dep
reci
atio
n as
at M
arch
31,
201
6 -
5.61
179.
2554
.10
104.
343,
006.
8421
7.85
24.4
120
9.96
204.
8444
2.84
4,45
0.04
Dep
reci
atio
n fo
r th
e ye
ar -
2.74
31.4
913
.84
28.0
750
1.96
27.7
04.
4135
.30
52.9
168
.22
766.
64
Accu
mul
ated
dep
reci
atio
n on
dis
posa
ls -
- 0.
00 -
0.89
18.2
84.
303.
043.
011.
6913
.13
44.3
4
Accu
mul
ated
dep
reci
atio
n as
at M
arch
31,
201
7 -
8.35
210.
7467
.94
131.
523,
490.
5224
1.25
25.7
824
2.25
256.
0649
7.93
5,17
2.34
Net
blo
ck a
s at
Apr
il 01
, 201
574
.84
27.9
684
9.32
791.
0318
1.34
5,04
6.51
95.6
116
.87
185.
6227
2.22
160.
867,
702.
18
Net
blo
ck a
s at
Mar
ch 3
1, 2
016
74.8
415
1.14
855.
2178
0.30
188.
054,
983.
7187
.77
21.7
617
2.57
276.
7115
2.89
7,74
4.95
Net
blo
ck a
s at
Mar
ch 3
1, 2
017
74.8
414
8.40
834.
8577
1.03
193.
744,
778.
0684
.00
28.7
215
5.84
244.
7414
1.32
7,45
5.54
Note
s:1)
Exp
ense
s re
latin
g to
con
stru
ctio
n or
acq
uisi
tion
of p
rope
rty,
pla
nt a
nd e
quip
men
t ca
pita
lised
dur
ing
the
year
`
33.2
3 m
illio
n (M
arch
31,
2016:
` 4.2
5 m
illio
n an
d A
pril
1, 2
015: `
2.1
0 m
illio
n)
2)
Pla
nt a
nd m
achi
nery
abo
ve inc
lude
s co
mm
on t
rans
mis
sion
inf
rast
ruct
ure
used
in
Rad
io b
usin
ess
by t
he C
ompa
ny w
hich
are
joi
ntly
con
trolle
d as
sets
as
at
Mar
ch 3
1, 2
017:
G
ross
blo
ck -
` 165.0
7 m
illio
n (M
arch
31,
2016: `
122.
37 m
illio
n an
d A
pril
1, 2
015:
` 122.
37 m
illio
n)
Net
blo
ck -
` 69.
56 m
illio
n (M
arch
31,
2016: `
31.
42 m
illio
n an
d A
pril
1, 2
015:
` 35.3
0 m
illio
n)
% o
f Ow
ners
hip
- 27.
72%
(M
arch
31,
2016: 3
0.2
6%
and
Apr
il 1,
2015: 3
0.2
6%
)3)
For
asse
ts p
ledg
e re
fer
note
14.

Financial Statements - Standalone
147
Overview
Statutory R
eportsFinancial S
tatements
Subsidiaries
5. INVESTMENT PROPERTIES(` in million)
Particulars Land Building Total
Gross block value as at April 01, 2015 - 118.58 118.58
Additions during the year 4.57 148.21 152.78Gross block value as at March 31, 2016 4.57 266.79 271.36Additions during the year 21.68 209.94 231.62Deletion during the year - 10.21 10.21Gross block value as at March 31, 2017 26.25 466.52 492.77
Accumulated depreciation as at April 01, 2015 - 2.29 2.29Depreciation for the year - 2.78 2.78Accumulated depreciation as at March 31, 2016 - 5.07 5.07Depreciation for the year - 5.06 5.06Accumulated depreciation on disposals - 0.54 0.54Accumulated depreciation as at March 31, 2017 - 9.59 9.59
Net block as at April 01, 2015 - 116.29 116.29Net block as at March 31, 2016 4.57 261.72 266.29Net block as at March 31, 2017 26.25 456.93 483.18
Information regarding income and expenditure of investment properties
(` in million)
Particulars March 31, 2017 March 31, 2016
Rental income derived from investment properties 1.31 0.11
Profit arising from investment properties before depreciation and indirect expenses 1.31 0.11
Less – Depreciation 5.06 2.78
Profit arising from investment properties before indirect expenses (3.75) (2.67)
The investment properties consist of commercial and residential properties based on the management’s assessment of the nature, characteristics and risks of each property. As at March 31, 2017 the fair values of the properties are ̀ 512.21 millioin. These valuation are based on valuation performed by an accredited independent valuer. The Company has no restrictions on the realisability of its investment properties and no contractual obligations to purchase, construct or develop investment properties or for repaires, maintenance and enhancements.
NOTES to financial statements as at and for the year ended March 31, 2017
Markets That Matter
ANNUAL REPORT 2016-17148
NOTES to financial statements as at and for the year ended March 31, 2017
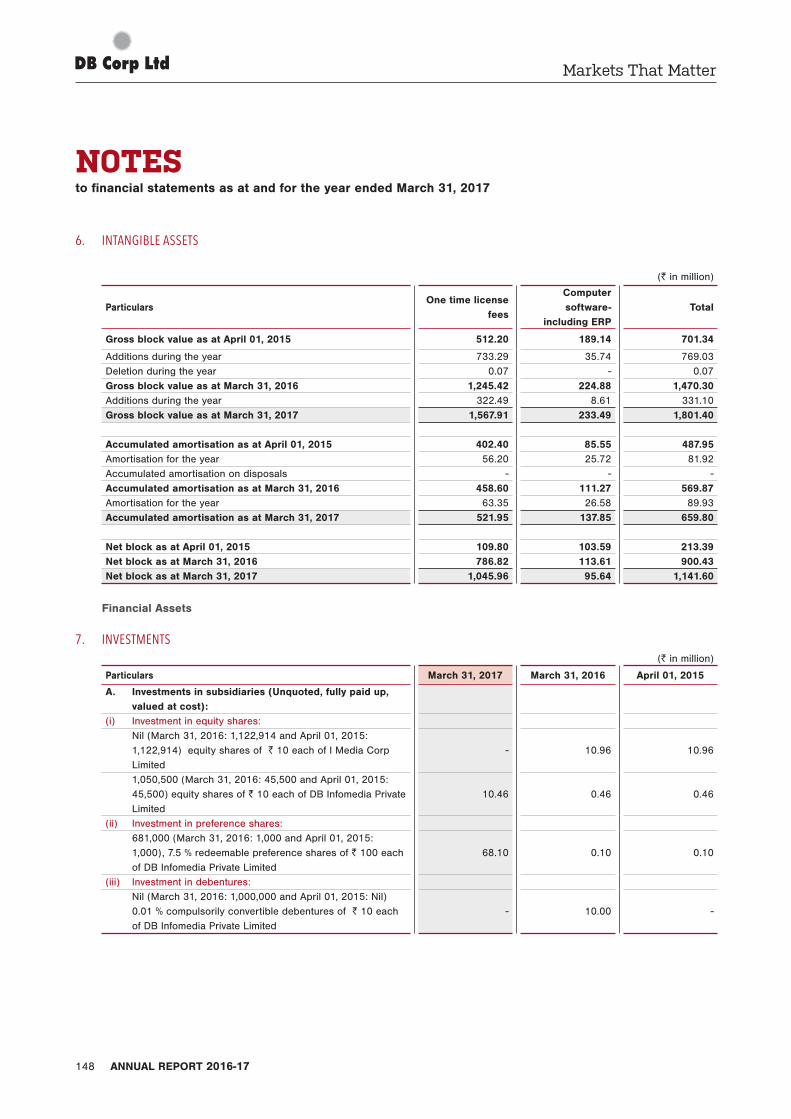
6. INTANGIBLE ASSETS
(` in million)
Particulars One time license
fees
Computer software-
including ERP Total
Gross block value as at April 01, 2015 512.20 189.14 701.34
Additions during the year 733.29 35.74 769.03Deletion during the year 0.07 - 0.07Gross block value as at March 31, 2016 1,245.42 224.88 1,470.30Additions during the year 322.49 8.61 331.10Gross block value as at March 31, 2017 1,567.91 233.49 1,801.40
Accumulated amortisation as at April 01, 2015 402.40 85.55 487.95Amortisation for the year 56.20 25.72 81.92Accumulated amortisation on disposals - - - Accumulated amortisation as at March 31, 2016 458.60 111.27 569.87Amortisation for the year 63.35 26.58 89.93Accumulated amortisation as at March 31, 2017 521.95 137.85 659.80
Net block as at April 01, 2015 109.80 103.59 213.39Net block as at March 31, 2016 786.82 113.61 900.43Net block as at March 31, 2017 1,045.96 95.64 1,141.60
Financial Assets
7. INVESTMENTS(` in million)
Particulars March 31, 2017 March 31, 2016 April 01, 2015
A. Investments in subsidiaries (Unquoted, fully paid up, valued at cost):
(i) Investment in equity shares: Nil (March 31, 2016: 1,122,914 and April 01, 2015:
1,122,914) equity shares of ` 10 each of I Media Corp Limited
- 10.96 10.96
1,050,500 (March 31, 2016: 45,500 and April 01, 2015: 45,500) equity shares of ` 10 each of DB Infomedia Private Limited
10.46 0.46 0.46
(ii) Investment in preference shares: 681,000 (March 31, 2016: 1,000 and April 01, 2015:
1,000), 7.5 % redeemable preference shares of ` 100 each of DB Infomedia Private Limited
68.10 0.10 0.10
(iii) Investment in debentures: Nil (March 31, 2016: 1,000,000 and April 01, 2015: Nil)
0.01 % compulsorily convertible debentures of ` 10 each of DB Infomedia Private Limited
- 10.00 -

Financial Statements - Standalone
149
Overview
Statutory R
eportsFinancial S
tatements
Subsidiaries
NOTES to financial statements as at and for the year ended March 31, 2017
(` in million)
Particulars March 31, 2017 March 31, 2016 April 01, 2015
B. Non - current investments at fair value through OCI (fully paid):
(a) Quoted investments in equity shares: 300,000 (March 31, 2016: 300,000 and April 01, 2015:
300,000) equity shares of ` 10 each of Ajcon Global Services Limited
5.70 6.48 5.82
52,136 (March 31, 2016: 52,136 and April 01, 2015: 52,136) equity shares of ` 10 each of Everonn Education Limited
0.63 1.06 1.17
5,340,000 (March 31, 2016: 5,340,000 and April 01, 2015: 5,340,000) equity shares of ` 5 each of DMC Education Limited
3.74 4.27 3.36
665,863 (March 31, 2016: 665,863 and April 01, 2015: Nil) equity shares of ` 10 each of Timbor Home Limited
- - -
(b) Unquoted investments:(i) Investment in equity shares: 100,000 (March 31, 2016: 100,000 and April 01, 2015:
100,000) equity shares of ` 10 each of Dwarkas Gems Limited
- - -
375,000 (March 31, 2016: 375,000 and April 01, 2015: 375,000) equity shares of ` 10 each of Arvind Coirfoam Private Limited
- - -
325,000 (March 31, 2016: 325,000 and April 01, 2015: 325,000) equity shares of ` 10 each of Micro Secure Solution Limited
- - -
81,085 (March 31, 2016: 81,085 and April 01, 2015: 81,085) equity shares of ` 10 each of Naaptol Online Shopping Private Limited
221.77 221.77 221.77
486,825 (March 31, 2016: 486,825 and April 01, 2015: 486,825) equity shares of ` 10 each of Neesa Leisure Limited
13.10 13.10 23.10
140,000 (March 31, 2016: 140,000 and April 01, 2015: 140,000) equity shares of ` 10 each of Trophic Wellness Private Limited
11.01 11.01 11.01
1,100,917 (March 31, 2016: 1,100,917 and April 01, 2015: 1,100,917) equity shares of ` 1 each of Abbee Consumables and Peripherals Sshope Limited
- - -
2,434 (March 31, 2016: 2,434 and April 01, 2015: 2,434) equity shares of ` 10 each of Koochie Play Systems Private Limited
13.37 13.37 13.37
100 (March 31, 2016: 100 and April 01, 2015: 100) equity shares of ` 100 each of United News of India
0.01 0.01 0.01

Markets That Matter
ANNUAL REPORT 2016-17150
NOTES to financial statements as at and for the year ended March 31, 2017
(` in million)
Particulars March 31, 2017 March 31, 2016 April 01, 2015
10 (March 31, 2016: 10 and April 01, 2015: 10) equity shares of ` 100 each of Press Trust of India
0.00 0.00 0.00
(ii) Investment in debentures and warrants: (fully paid) 200,000 (March 31, 2016: 200,000 and April 01, 2015:
200,000), Zero % fully convertible debentures of ` 100 each of Cubit Computers Private Limited
- - -
700,935 (March 31, 2016: 700,935 and April 01, 2015: 700,935) convertible warrants of ` 53.50 of Edserv Softsystems Limited
- - -
1 (March 31, 2016: 1 and April 01, 2015: 1), Zero % fully convertible debenture of ` 8,500,000 each of Roxton (Italy) Clothing Private Limited
- - -
Nil (March 31, 2016: Nil and April 01, 2015: 1), Zero % fully convertible debenture of ` 25,500,000 each of Timbor Home Limited
- - 3.60
Total non - current investments 347.89 292.59 294.73
C. Current investments at fair value through statement of profit and loss (fully paid):
(a) Quoted investment in equity shares: Nil (March 31, 2016: 5,201,055 and April 01, 2015:
6,054,960) equity shares of ` 10 each of Gitanjali Gems Limited
- 169.29 249.46
347.89 461.88 544.19 Aggregate book value amount of quoted investments 10.07 181.09 259.81 Aggregate market value of quoted investments 10.07 181.09 259.81 Aggregate amount of unquoted investments 337.82 280.79 284.38 Investments at fair value through OCI and statement of profit and loss reflect investment in quoted and unquoted equity and
debt securities. Investment in subsidiaries is carried at cost. Refer note 38 for determination of their fair values.
8. OTHER FINANCIAL ASSETS (Unsecured considered good unless stated otherwise)
(` in million)
ParticularsNon-current Current
March 31, 2017
March 31, 2016
April 01, 2015
March 31, 2017
March 31, 2016
April 01, 2015
Deposit for lease of properties [refer note 28 (b)]
142.82 129.91 113.44 - - -
Inter-corporate deposit placed - - 322.00 300.00 322.00 200.00
Other bank deposits with original maturity of more than 3 months but less than 12 months
- - - 0.03 8.00 2.25
Deposits with original maturity of more than 12 months
2.16 2.18 2.03 - - -
Advances to subsidiaries - - - 4.12 38.39 9.56
144.98 132.09 437.47 304.15 368.39 211.81
Financial Statements - Standalone
151
Overview
Statutory R
eportsFinancial S
tatements
Subsidiaries
NOTES to financial statements as at and for the year ended March 31, 2017
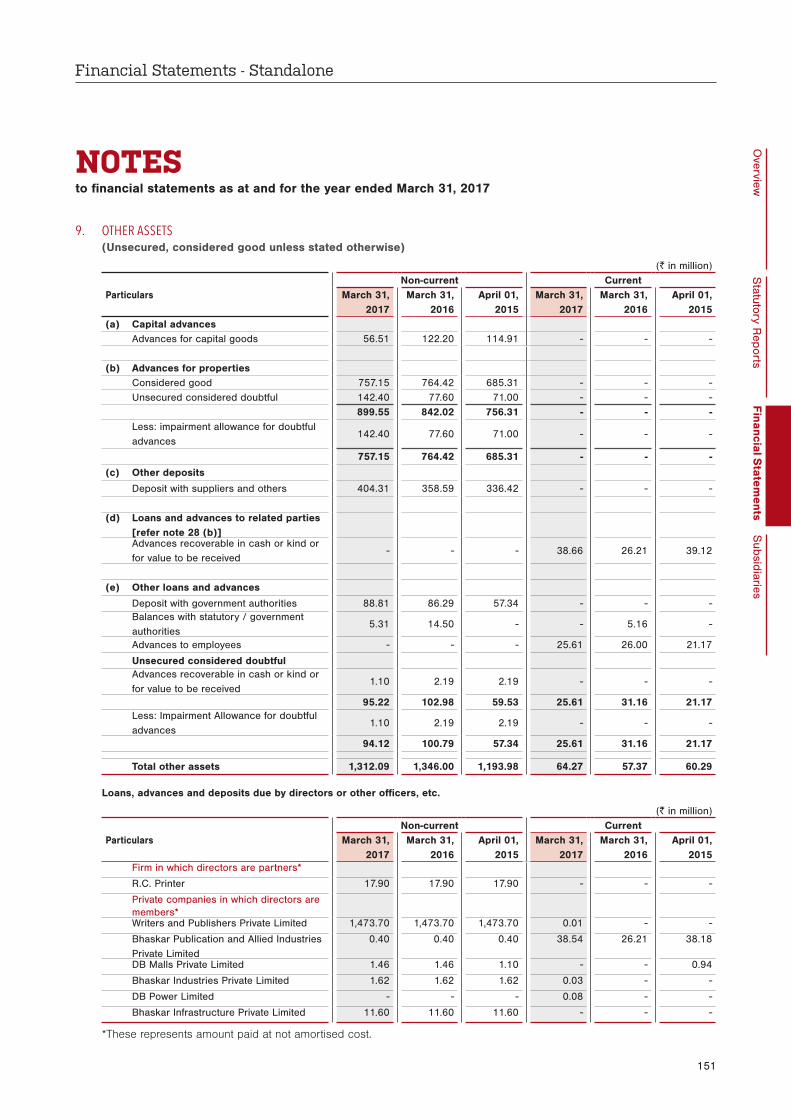
9. OTHER ASSETS (Unsecured, considered good unless stated otherwise)
(` in million)
ParticularsNon-current Current
March 31, 2017
March 31, 2016
April 01, 2015
March 31, 2017
March 31, 2016
April 01, 2015
(a) Capital advances Advances for capital goods 56.51 122.20 114.91 - - -
(b) Advances for properties Considered good 757.15 764.42 685.31 - - - Unsecured considered doubtful 142.40 77.60 71.00 - - -
899.55 842.02 756.31 - - - Less: impairment allowance for doubtful
advances142.40 77.60 71.00 - - -
757.15 764.42 685.31 - - -
(c) Other deposits
Deposit with suppliers and others 404.31 358.59 336.42 - - -
(d) Loans and advances to related parties [refer note 28 (b)]
Advances recoverable in cash or kind or for value to be received
- - - 38.66 26.21 39.12
(e) Other loans and advances
Deposit with government authorities 88.81 86.29 57.34 - - - Balances with statutory / government
authorities5.31 14.50 - - 5.16 -
Advances to employees - - - 25.61 26.00 21.17
Unsecured considered doubtful Advances recoverable in cash or kind or
for value to be received1.10 2.19 2.19 - - -
95.22 102.98 59.53 25.61 31.16 21.17 Less: Impairment Allowance for doubtful
advances1.10 2.19 2.19 - - -
94.12 100.79 57.34 25.61 31.16 21.17
Total other assets 1,312.09 1,346.00 1,193.98 64.27 57.37 60.29
Loans, advances and deposits due by directors or other officers, etc.
(` in million)
ParticularsNon-current Current
March 31, 2017
March 31, 2016
April 01, 2015
March 31, 2017
March 31, 2016
April 01, 2015
Firm in which directors are partners*
R.C. Printer 17.90 17.90 17.90 - - -
Private companies in which directors are members*
Writers and Publishers Private Limited 1,473.70 1,473.70 1,473.70 0.01 - -
Bhaskar Publication and Allied Industries Private Limited
0.40 0.40 0.40 38.54 26.21 38.18
DB Malls Private Limited 1.46 1.46 1.10 - - 0.94
Bhaskar Industries Private Limited 1.62 1.62 1.62 0.03 - -
DB Power Limited - - - 0.08 - -
Bhaskar Infrastructure Private Limited 11.60 11.60 11.60 - - -
*These represents amount paid at not amortised cost.

Markets That Matter
ANNUAL REPORT 2016-17152
NOTES to financial statements as at and for the year ended March 31, 2017
10. INVENTORIES(` in million)
ParticularsMarch 31,
2017March 31,
2016April 01,
2015Raw materials (at cost)Newsprint* 1,624.66 1,326.68 1,099.71Finished goods 3.77 4.40 4.09Stores and spares 358.70 343.64 298.16
1,987.13 1,674.72 1,401.96
* Amount includes newsprint in transit of ` 259.41 (March 31, 2016: ` 204.72, April 01, 2015: ` 173.64)
11. TRADE RECEIVABLES (Unsecured, considered good unless stated otherwise)
(` in million)
ParticularsMarch 31,
2017March 31,
2016April 01,
2015Outstanding for a period exceeding six months from the date they are due for paymentConsidered good 580.74 330.44 219.53Considered doubtful 467.68 439.41 394.18
1,048.42 769.85 613.71Less: Impairment allowance for trade receivables 467.68 439.41 394.18
580.74 330.44 219.53Other receivablesConsidered good 3,593.01 3,441.17 3,141.53
4,173.75 3,771.61 3,361.06
For details of debts due by firms or private companies in which any director is a partner or a director / member, respectively refer note 28 (b).
Trade receivables are non-interest bearing and generally on terms of 30 - 90 days.
12. CASH AND CASH EQUIVALENTS(` in million)
ParticularsMarch 31,
2017March 31,
2016April 01,
2015Balances with banks On current account 671.00 507.71 584.95 Deposits with original maturity of less than 3 months 751.05 1.01 866.48Cheques on hand / transit 294.10 328.55 287.34Cash on hand 16.25 55.05 21.97
1,732.40 892.32 1,760.74Other bank balances:Unclaimed dividend accounts 0.90 2.28 0.05
1,733.30 894.60 1,760.79
Short-term deposits are made for varying periods of one day to three months, depending on the immediate cash requirements of the Company, and earn interest at the respective short-term deposit rates.
Financial Statements - Standalone
153
Overview
Statutory R
eportsFinancial S
tatements
Subsidiaries
NOTES to financial statements as at and for the year ended March 31, 2017
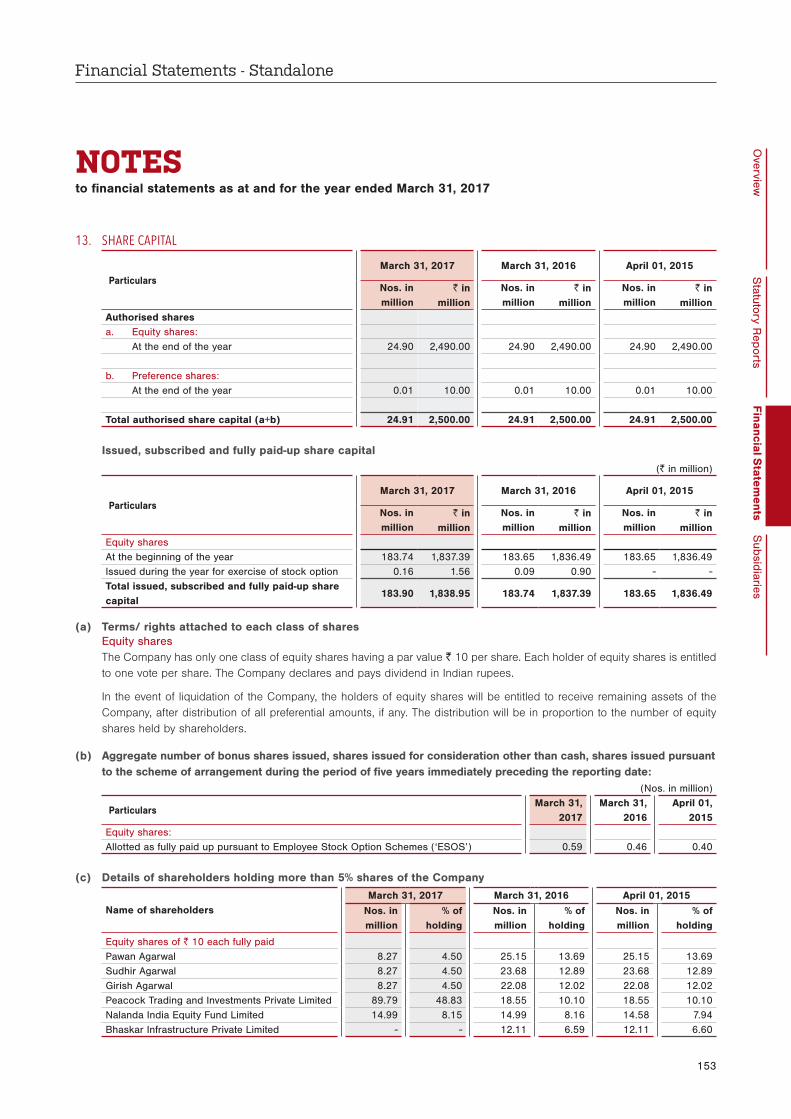
13. SHARE CAPITAL
ParticularsMarch 31, 2017 March 31, 2016 April 01, 2015
Nos. in million
` in million
Nos. in million
` in million
Nos. in million
` in million
Authorised sharesa. Equity shares: At the end of the year 24.90 2,490.00 24.90 2,490.00 24.90 2,490.00
b. Preference shares: At the end of the year 0.01 10.00 0.01 10.00 0.01 10.00
Total authorised share capital (a+b) 24.91 2,500.00 24.91 2,500.00 24.91 2,500.00
Issued, subscribed and fully paid-up share capital
(` in million)
ParticularsMarch 31, 2017 March 31, 2016 April 01, 2015
Nos. in million
` in million
Nos. in million
` in million
Nos. in million
` in million
Equity sharesAt the beginning of the year 183.74 1,837.39 183.65 1,836.49 183.65 1,836.49Issued during the year for exercise of stock option 0.16 1.56 0.09 0.90 - - Total issued, subscribed and fully paid-up share capital
183.90 1,838.95 183.74 1,837.39 183.65 1,836.49
(a) Terms/ rights attached to each class of shares Equity shares The Company has only one class of equity shares having a par value ` 10 per share. Each holder of equity shares is entitled
to one vote per share. The Company declares and pays dividend in Indian rupees.
In the event of liquidation of the Company, the holders of equity shares will be entitled to receive remaining assets of the Company, after distribution of all preferential amounts, if any. The distribution will be in proportion to the number of equity shares held by shareholders.
(b) Aggregate number of bonus shares issued, shares issued for consideration other than cash, shares issued pursuant to the scheme of arrangement during the period of five years immediately preceding the reporting date:
(Nos. in million)
ParticularsMarch 31,
2017March 31,
2016April 01,
2015Equity shares:Allotted as fully paid up pursuant to Employee Stock Option Schemes (‘ESOS’) 0.59 0.46 0.40
(c) Details of shareholders holding more than 5% shares of the Company
Name of shareholdersMarch 31, 2017 March 31, 2016 April 01, 2015
Nos. in million
% of holding
Nos. in million
% of holding
Nos. in million
% of holding
Equity shares of ` 10 each fully paidPawan Agarwal 8.27 4.50 25.15 13.69 25.15 13.69Sudhir Agarwal 8.27 4.50 23.68 12.89 23.68 12.89Girish Agarwal 8.27 4.50 22.08 12.02 22.08 12.02Peacock Trading and Investments Private Limited 89.79 48.83 18.55 10.10 18.55 10.10Nalanda India Equity Fund Limited 14.99 8.15 14.99 8.16 14.58 7.94Bhaskar Infrastructure Private Limited - - 12.11 6.59 12.11 6.60
Markets That Matter
ANNUAL REPORT 2016-17154
NOTES to financial statements as at and for the year ended March 31, 2017
(d) Shares reserved for issue under options For detail of shares reserved for issue under the ESOS of the Company (refer note 35).
(e) Distribution made and proposed
(` in million)
ParticularsMarch 31,
2017March 31,
2016Cash dividends on equity shares declared and paid:
Final dividend* (March 31, 2016: ` 4.25 per share) (March 31, 2015: ` 4.25 per share) 781.04 780.79
DDT on final dividend 159.01 156.11
Interim dividend (March 31, 2017: ` 4.00 per share) (March 31, 2016: ` 6.75 per share) 735.45 1,239.91
DDT on interim dividend 149.72 255.291,825.22 2,432.10
*Final dividend represent ̀ 4.25 per share for the year ended March 31, 2015 and March 31, 2016 proposed by the board in respective years and approved by the shareholders during the year ended March 31, 2016 and March 31,2017 respectively.
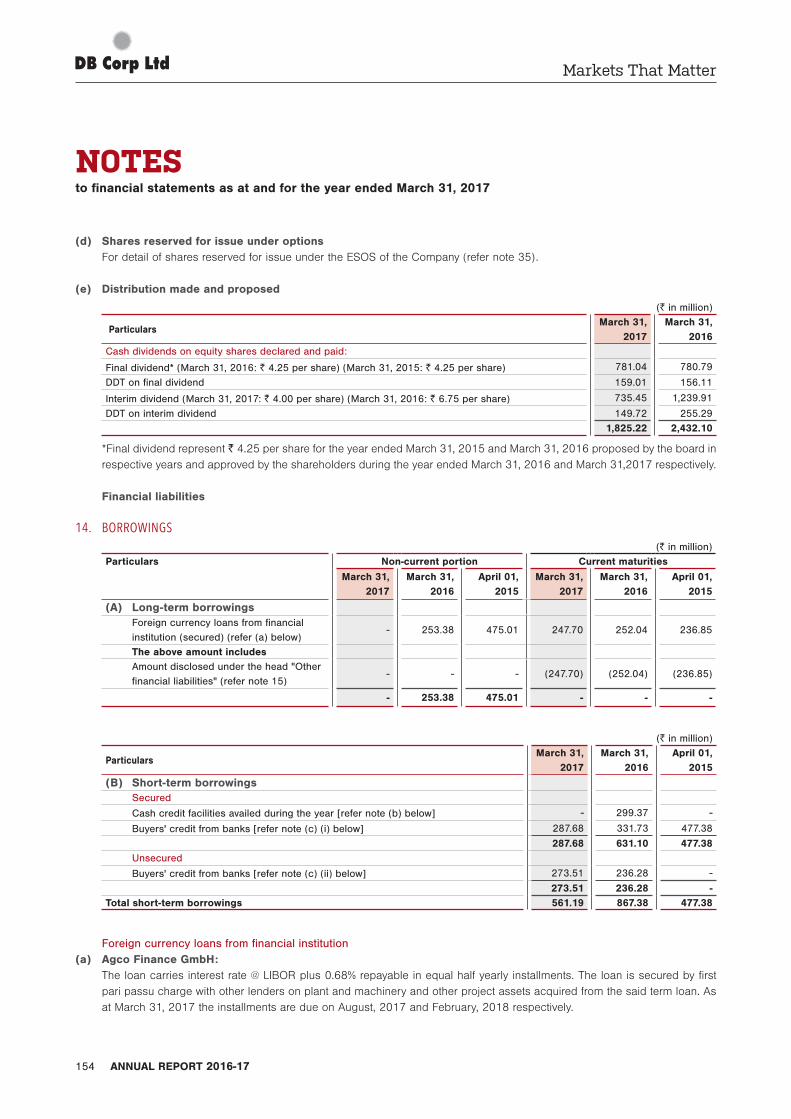
Financial liabilities
14. BORROWINGS(` in million)
Particulars
Non-current portion Current maturities
March 31, 2017
March 31, 2016
April 01, 2015
March 31, 2017
March 31, 2016
April 01, 2015
(A) Long-term borrowings Foreign currency loans from financial
institution (secured) (refer (a) below) - 253.38 475.01 247.70 252.04 236.85
The above amount includes Amount disclosed under the head "Other
financial liabilities" (refer note 15) - - - (247.70) (252.04) (236.85)
- 253.38 475.01 - - -
(` in million)
ParticularsMarch 31,
2017March 31,
2016April 01,
2015
(B) Short-term borrowings Secured
Cash credit facilities availed during the year [refer note (b) below] - 299.37 -
Buyers' credit from banks [refer note (c) (i) below] 287.68 331.73 477.38
287.68 631.10 477.38 Unsecured
Buyers' credit from banks [refer note (c) (ii) below] 273.51 236.28 -
273.51 236.28 - Total short-term borrowings 561.19 867.38 477.38
Foreign currency loans from financial institution(a) Agco Finance GmbH: The loan carries interest rate @ LIBOR plus 0.68% repayable in equal half yearly installments. The loan is secured by first
pari passu charge with other lenders on plant and machinery and other project assets acquired from the said term loan. As at March 31, 2017 the installments are due on August, 2017 and February, 2018 respectively.

Financial Statements - Standalone
155
Overview
Statutory R
eportsFinancial S
tatements
Subsidiaries
(b) Cash credit facilities: Cash credit facilities from banks are secured by first pari-passu charge on the entire current assets and second pari-passu
charge on the entire movable fixed assets of the Company with other consortium bankers. The cash credit is repayable on demand with interest rates ranging between 9.75% p.a. and 10.00% p.a. (March 31, 2016: between 9.10% p.a. and 10.50% p.a.)
(c) Buyers’ credit facilities: (i) Secured buyers’ credit facilities from banks are secured by first charge on the current assets and second charge on
moveable fixed assets of the Company with other consortium bankers. Interest rates for buyers’ credit are multiline rates ranging between 1.38% p.a. and 1.72% p.a. (March 31, 2016: between 0.91% p.a. & 1.44% p.a. and April 01, 2015: between 0.66% p.a. & 1.09% p.a.) (as mutually agreed). They are repayable within 90 to 180 days
(ii) Interest rates for unsecured buyers’ credits are multiline rates ranging between 1.41% p.a. and 1.82% p.a. (March 31, 2016: between 0.88% p.a. & 1.39% p.a. and April 01, 2015: between 0.80% p.a. & 0.99% p.a.) (as mutually agreed). They are repayable within 90 to 180 days.
15. OTHER FINANCIAL LIABILITIES(` in million)
ParticularsNon-current Current
March 31, 2017
March 31, 2016
April 01, 2015
March 31, 2017
March 31, 2016
April 01, 2015
Other current liabilitiesCurrent maturities of long-term borrowings (refer note 14)
- - - 247.70 252.04 236.85
Security deposits from newspaper agencies 481.78 439.64 377.48 53.53 48.85 41.94Interest accrued but not due on borrowings - - - 23.64 21.07 19.66Liabilities for forward contracts - - - 7.38 2.34 - Bank Guarantee Commission 4.22 6.41 8.80 2.19 2.40 2.63Payables for purchase of capital goods - - - 15.94 22.10 6.22Accrued expenses - - - 817.26 935.18 660.85Unclaimed dividend* - - - 0.90 2.28 0.05
486.00 446.05 386.28 1,168.54 1,286.26 968.20
*No amount due and outstanding to be credited to Investor Education and Protection Fund.
16. DEFERRED TAX LIABILITIES (NET)(` in million)
ParticularsBalance Sheet
March 31, 2017
March 31, 2016
April 01, 2015
Deferred tax liabilitiesDepreciation 1,086.29 1,073.96 1,027.08Fair value of investment 38.99 38.99 38.29Gross deferred tax liability 1,125.28 1,112.95 1,065.37Deferred tax assetsAllowance for doubtful trade receivables and advances 214.46 181.24 158.86Provision for gratuity and compensated absences 91.42 88.87 61.68Others 38.40 29.84 27.65Gross deferred tax assets 344.28 299.95 248.19Deferred tax liabilities (net) 781.00 813.00 817.18
NOTES to financial statements as at and for the year ended March 31, 2017

Markets That Matter
ANNUAL REPORT 2016-17156
NOTES to financial statements as at and for the year ended March 31, 2017
NOTES to financial statements as at and for the year ended March 31, 2017
Deferred tax reconciliation
(` in million)
Particulars March 31, 2017 March 31, 2016
Opening balance 813.00 817.18Tax during the year recognised in statement of profit and loss (21.05) (2.38)Tax during the year recognised in OCI (10.95) (1.80)Closing balance 781.00 813.00
Tax reconciliation
(` in million)
Particulars March 31, 2017 March 31, 2016
Accounting profit before income tax 5,679.81 4,634.42At statutory income tax rate of 34.608% (March 31, 2016: 34.608%) 1,965.67 1,603.88Effect of changes in tax rate - 2.90Effect of Non-deductible expenses 35.97 26.13Effect of items not taxable as business income (94.89) 44.71At the effective income tax rate of 33.57% (March 31, 2016: 36.20%) 1,906.75 1,677.62Income tax expense reported in the statement of profit and loss 1,906.75 1,677.62
17. PROVISIONS
(` in million)
ParticularsMarch 31,
2017March 31,
2016April 01,
2015Provision for employee benefits For gratuity (refer note 34) 123.99 112.48 94.80For compensated absences 94.46 90.78 86.67
218.45 203.26 181.47
18. OTHER LIABILITIES(` in million)
ParticularsMarch 31,
2017March 31,
2016April 01,
2015Other payablesAdvances from customers (refer note below) 261.25 347.17 428.69Statutory liabilities 77.25 73.11 57.55Other liabilities - 47.00 -
338.50 467.28 486.24
The Company has entered into arrangements with various parties whereby the Company has invested in the securities of these parties. In accordance with these arrangements, the said parties have also agreed to offer their advertisements in the Company’s print and non-print media periodically, for a specified term. The unutilised portion of advertisement advances received from these parties as at March 31, 2017 amounting to ` 29.89 million (March 31, 2016: ` 146.26 million and April 01, 2015: ` 299.18 million) is included in ‘Advance from customers’.

Financial Statements - Standalone
157
Overview
Statutory R
eportsFinancial S
tatements
Subsidiaries
NOTES to financial statements as at and for the year ended March 31, 2017
19. REVENUE FROM OPERATIONS(` in million)
Particulars March 31, 2017 March 31, 2016Sale of products Sale of newspapers 4,766.37 4,312.23 Sale of magazines 47.53 43.65
4,813.90 4,355.88
Sale of services Advertisement revenue 15,974.12 14,813.46 Printing job charges 1,190.40 1,049.37
17,164.52 15,862.83
Other operating revenue Income from event management 113.58 47.23 Sale of power 4.57 4.10 Net gain / (loss) on fair valuation of investment / sale of investment 231.25 (25.17) Sale of wastage arising during printing activity 246.45 237.33
595.85 263.49Total revenue from operations 22,574.27 20,482.20
20. OTHER INCOME(` in million)
Particulars March 31, 2017 March 31, 2016Excess liabilities / provisions written back 28.99 49.24Miscellaneous income 24.71 35.78
53.70 85.02
21. FINANCE INCOME(` in million)
Particulars March 31, 2017 March 31, 2016Interest income from: Bank deposits 38.15 62.38 Financial assets measured at amortised cost using 'EIR' basis 40.93 37.79 Others 39.35 56.61
118.43 156.78
22. COST OF RAW MATERIAL CONSUMED(` in million)
Particulars March 31, 2017 March 31, 2016NewsprintOpening inventories 1,326.68 1,099.71Add: Purchases during the year 6,906.05 6,413.64
8,232.73 7,513.35Less: Closing inventories 1,624.66 1,326.68
6,608.07 6,186.67

Markets That Matter
ANNUAL REPORT 2016-17158
NOTES to financial statements as at and for the year ended March 31, 2017
23. EMPLOYEE BENEFIT EXPENSES(` in million)
Particulars March 31, 2017 March 31, 2016Salaries, wages and bonus 3,804.12 3,469.18Contribution to provident fund and other contribution plans 205.13 186.95Employee stock option scheme (refer note 35) 50.65 40.78Gratuity expenses (refer note 34) 40.66 45.47Workmen and staff welfare expenses 178.17 155.65
4,278.73 3,898.03
24. DEPRECIATION AND AMORTISATION EXPENSES(` in million)
Particulars March 31, 2017 March 31, 2016Depreciation of property, plant and equipment (refer note 4) 766.64 767.01Depreciation of intangible assets (refer note 6) 89.93 81.92Depreciation of investment properties (refer note 5) 5.06 2.78
861.63 851.71
25. FINANCE COSTS(` in million)
Particulars March 31, 2017 March 31, 2016Interest expense: On term loans 7.78 8.52 On banks 10.24 11.17 On others 39.39 36.56Total interest expenses 57.41 56.25Foreign exchange difference considered as borrowing cost 17.07 81.93
74.48 138.18
26. OTHER EXPENSES(` in million)
Particulars March 31, 2017 March 31, 2016
Consumption of stores and spares 1,009.60 1,132.21Advertisement and publicity 420.07 412.89Electricity and water charges 416.60 394.71Rent [refer note 30 (a)] 342.23 316.32Distribution expenses 307.77 318.76Repair and maintenance Plant and machinery 312.59 257.10 Building 20.47 17.22 Others 69.90 68.44Traveling and conveyance 244.00 227.56Business promotion expenses 224.58 260.03News collection charges 201.10 188.05Legal and professional charges [refer note 33 (a) and (b)] 185.96 153.77Survey expenses 146.05 138.01Event expenses 120.28 47.34Subcontract charges 101.41 57.83Corporate social responsibility activities expenditure 73.58 46.15Printing job work charges 68.97 49.92Communication expenses 66.27 61.98

Financial Statements - Standalone
159
Overview
Statutory R
eportsFinancial S
tatements
Subsidiaries
(` in million)
Particulars March 31, 2017 March 31, 2016
License fees 64.95 56.05Insurance 24.10 23.54Loss on sale / disposal of property, plant and equipment (net) 21.57 2.80Royalty [Refer note 29 (a)] 13.64 60.72Rates and taxes 11.63 1.73Bad trade receivables written off 57.06Less: Already provided (55.93) 1.13 0.63Impairment allowance for trade receivables 84.21 94.37Impairment allowance for doubtful advances 68.80 6.60Miscellaneous expenses 654.09 595.45
5,275.55 4,990.18
27. EARNINGS PER EQUITY SHARE (‘EPS’)(` in million)
Particulars March 31, 2017 March 31, 2016
Profit for the year 3,750.66 2,939.25
Weighted average number of equity shares outstanding for basic EPS (no. in million) 183.81 183.70
Effect of dilution: On account of shares to be issued under ESOS (no. in million)
0.40 0.28
Weighted average number of Equity Shares outstanding for diluted EPS (no. in million) 184.21 183.98
Nominal value of share (`) 10.00 10.00
Basic Earnings per share (`) 20.41 16.00
Diluted Earnings per share (`) 20.36 15.98
28. (a) Related party disclosures: Following is the list of related parties:
Particulars Related Parties
Related parties with whom transactions have taken place during the year
Related parties where control exists:
I Media Corp LimitedDB Infomedia Private Limited
Key Management Personnel Shri Sudhir Agarwal, Managing DirectorShri Pawan Agarwal, Deputy Managing DirectorShri Girish Agarwal, DirectorShri P.G. Mishra, Chief Financial OfficerSmt Anita Gokhale, Company Secretary
Relatives of Key Management Personnel
Late Shri Ramesh Chandra Agarwal, Director (Father of Shri Sudhir Agarwal, Shri Girish Agarwal and Shri Pawan Agarwal)Smt Kasturi Devi Agarwal (Grand Mother of Shri Sudhir Agarwal, Shri Girish Agarwal and Shri Pawan Agarwal)Smt Jyoti Agarwal (Wife of Shri Sudhir Agarwal)Smt Namita Agarwal (Wife of Shri Girish Agarwal)Smt Nitika Agarwal (Wife of Shri Pawan Agarwal)
NOTES to financial statements as at and for the year ended March 31, 2017

Markets That Matter
ANNUAL REPORT 2016-17160
NOTES to financial statements as at and for the year ended March 31, 2017
Enterprises owned or significantly influenced by key management personnel or their relatives
Abhivyakti Kala KendraBhaskar Printing Press- MPCGBhaskar Printing Press- CPH2Bhaskar Samachar SevaBhaskar Publications and Allied Industries Private LimitedBhaskar Infrastructure Private LimitedBhaskar Industries Private Limited Decore Exxoils Private Limited Bhaskar Venkatesh Products Private Limited DB Malls Private LimitedDB Power LimitedDB Infrastructures Private LimitedR.C. PrintersWriters and Publishers Private LimitedDeligent Hotel Corporation Private LimitedPeacock Trading and Investments Private LimitedDev Fiscal Services Private LimitedStitex Global LimitedBhopal Financial Services Private LimitedAarkey Investments Private LimitedDivya Dev Developers Private LimitedDivine Housing Development Company Private LimitedSharda Solvent Limited
Independent directors Shri Kailash Chandra Chowdhary (upto October 19, 2016)Shri Piyush PandeyShri Harish BijoorShri Ashwani Kumar SinghalShri Navin Kumar KshatriyaSmt Anupriya Acharya
Terms and conditions of transactions with related parties The sales to and purchases from related parties are made on terms equivalent to those that prevail in arm’s length
transactions. These transactions are approved by the audit committee of board of directors. Outstanding balances at the year-end are unsecured and interest free and settlement occurs in cash. The Company has not recorded any impairment of receivables relating to amounts owed by related parties during the year ended March 31, 2017, March 31, 2016 and April 01, 2015. This assessment is undertaken in each financial year through examining the financial position of the related party and the market in which the related party operates.

Financial Statements - Standalone
161
Overview
Statutory R
eportsFinancial S
tatements
Subsidiaries
NOTES to financial statements as at and for the year ended March 31, 2017
28. (b) Details of transactions with related parties:(` in million)
Particulars
Transactions for the year ended
Amount receivable / (payable) as at
March 31, 2017
March 31, 2016
March 31, 2017
March 31, 2016
Advertisement revenueAbhivyakti Kala Kendra 0.06 0.16 0.18 0.18Bhaskar Venkatesh Products Private Limited 5.74 4.66 0.64 3.14DB Malls Private Limited 3.08 8.28 - *DB Power Limited 0.55 0.50 0.10 0.11Deligent Hotel Corporation Private Limited 2.50 0.23 2.18 1.97I Media Corp Limited 1.56 1.46 1.07 0.69R.C. Printers - * - - Aarkey Investments Private Limited - - * *Divine Housing Development Company Private Limited 0.32 0.81 0.08 0.11Divya Dev Developers Private Limited 3.48 2.57 1.68 0.65DB Infrastructures Private Limited 4.40 4.52 13.82 12.04Bhaskar Publications and Allied Industries Private Limited 19.38 18.08 0.09 0.51Decore Exxoils Private Limited - * * *Bhaskar Industries Private Limited 0.02 - - -
Sale of magazinesBhaskar Publications and Allied Industries Private Limited 0.13 0.13 0.23 0.09
Printing job charges (income)Bhaskar Publications and Allied Industries Private Limited 3.25 3.48 2.12 0.37DB Infrastructures Private Limited - 0.38 0.47 1.55Divya Dev Developers Private Limited 1.00 - 0.98 -
Compensation of key management personnel of the CompanyShri Sudhir Agarwal 6.75 6.00 - - Shri Pawan Agarwal 6.00 4.80 - - Shri P.G. Mishra (including perquisite value of shares issued under ESOS)
20.04 17.79 - -
Short-term employee benefits 0.19 0.19 - - Share-based payment transactions 1.72 1.24 - - Smt Anita Gokhale 1.53 1.46 - -
Rent incomeBhaskar Publications and Allied Industries Private Limited 3.06 3.02 - -
Rent paidBhaskar Industries Private Limited 0.18 0.17 - - Bhaskar Infrastructure Private Limited 4.01 3.99 - - Bhaskar Publications and Allied Industries Private Limited 0.15 0.14 - - R.C. Printers 15.87 15.74 - - Writers and Publishers Private Limited 66.72 66.16 - - DB Malls Private Limited 4.50 2.86 (0.02) - Decore Exxoils Private Limited 5.03 6.25 - -
* Represents balance below ` 10,000

Markets That Matter
ANNUAL REPORT 2016-17162
NOTES to financial statements as at and for the year ended March 31, 2017
(` in million)
Particulars
Transactions for the year ended
Amount receivable / (payable) as at
March 31, 2017
March 31, 2016
March 31, 2017
March 31, 2016
Advertisement and publicity expenses
Abhivyakti Kala Kendra 0.06 0.06 - -
Bhaskar Publications and Allied Industries Private Limited 23.22 23.77 0.14 - DB Malls Private Limited 0.65 1.03 - - Deligent Hotel Corporation Private Limited - 1.11 (0.70) -
Interest income from loans to subsidiaryDB Infomedia Private Limited 4.02 1.60 3.67 1.44
Legal and professional chargesDB Malls Private Limited - 5.49 - -
Meeting and hotel lodging chargesDeligent Hotel Corporation Private Limited 8.47 1.94 (0.23) -
Amount received on issue of shares under ESOS Shri P.G. Mishra 0.64 0.61 - -
Sale of property, plant and equipmentBhaskar Publications and Allied Industries Private Limited 0.01 0.08 - - Sharda Solvent Limited - 1.68 - -
Purchase of property, plant and equipmentDB Malls Private Limited - 0.81 - - Bhaskar Publications and Allied Industries Private Limited 0.03 0.37 - - DB Power Limited - 1.15 - - Abhivyakti Kala Kendra - 0.05 - -
Purchase of goodsBhaskar Venkatesh Products Private Limited - 2.70 - (2.70)Bhaskar Industries Private Limited 2.41 - 0.03 -
Advertisement advance repaid Writers and Publishers Private Limited - - (12.29) (12.29)
Security deposit given against lease of propertiesWriters and Publishers Private Limited - - 1,473.70 1,473.70R.C. Printers - - 17.90 17.90Bhaskar Infrastructure Private Limited - - 11.60 11.60Bhaskar Publications and Allied Industries Private Limited - - 0.40 0.40Bhaskar Industries Private Limited - - 1.62 1.62DB Malls Private Limited 0.56 0.37 2.03 1.46
* Represents balance below ` 10,000
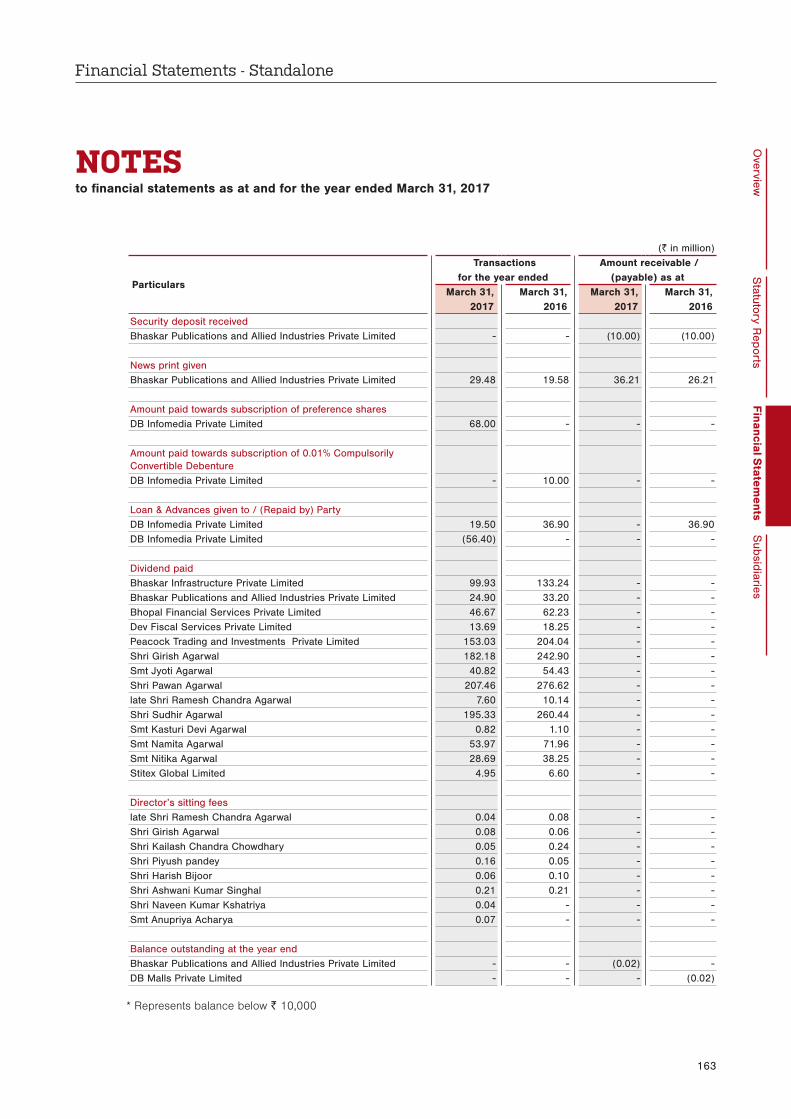
Financial Statements - Standalone
163
Overview
Statutory R
eportsFinancial S
tatements
Subsidiaries
NOTES to financial statements as at and for the year ended March 31, 2017
(` in million)
Particulars
Transactions for the year ended
Amount receivable / (payable) as at
March 31, 2017
March 31, 2016
March 31, 2017
March 31, 2016
Security deposit receivedBhaskar Publications and Allied Industries Private Limited - - (10.00) (10.00)
News print given Bhaskar Publications and Allied Industries Private Limited 29.48 19.58 36.21 26.21
Amount paid towards subscription of preference sharesDB Infomedia Private Limited 68.00 - - -
Amount paid towards subscription of 0.01% Compulsorily Convertible DebentureDB Infomedia Private Limited - 10.00 - -
Loan & Advances given to / (Repaid by) PartyDB Infomedia Private Limited 19.50 36.90 - 36.90DB Infomedia Private Limited (56.40) - - -
Dividend paidBhaskar Infrastructure Private Limited 99.93 133.24 - - Bhaskar Publications and Allied Industries Private Limited 24.90 33.20 - - Bhopal Financial Services Private Limited 46.67 62.23 - - Dev Fiscal Services Private Limited 13.69 18.25 - - Peacock Trading and Investments Private Limited 153.03 204.04 - - Shri Girish Agarwal 182.18 242.90 - - Smt Jyoti Agarwal 40.82 54.43 - - Shri Pawan Agarwal 207.46 276.62 - - late Shri Ramesh Chandra Agarwal 7.60 10.14 - - Shri Sudhir Agarwal 195.33 260.44 - - Smt Kasturi Devi Agarwal 0.82 1.10 - - Smt Namita Agarwal 53.97 71.96 - - Smt Nitika Agarwal 28.69 38.25 - - Stitex Global Limited 4.95 6.60 - -
Director’s sitting feeslate Shri Ramesh Chandra Agarwal 0.04 0.08 - - Shri Girish Agarwal 0.08 0.06 - - Shri Kailash Chandra Chowdhary 0.05 0.24 - - Shri Piyush pandey 0.16 0.05 - - Shri Harish Bijoor 0.06 0.10 - - Shri Ashwani Kumar Singhal 0.21 0.21 - - Shri Naveen Kumar Kshatriya 0.04 - - - Smt Anupriya Acharya 0.07 - - -
Balance outstanding at the year endBhaskar Publications and Allied Industries Private Limited - - (0.02) - DB Malls Private Limited - - - (0.02)
* Represents balance below ` 10,000

Markets That Matter
ANNUAL REPORT 2016-17164
NOTES to financial statements as at and for the year ended March 31, 2017
(` in million)
Particulars
Transactions for the year ended
Amount receivable / (payable) as at
March 31, 2017
March 31, 2016
March 31, 2017
March 31, 2016
DB Power Limited - - 0.08 - I Media Corp Limited - - 6.92 6.38Writers and Publishers Private Limited - - 0.01 - DB Infomedia Private Limited - - 0.46 0.05Bhaskar Samachar Seva - - (2.00) (2.00)
(c) Corporate guarantee given The Company has given a corporate guarantee of ` 234.04 million, (March 31, 2016: ` 293.60 million, April 1, 2015:
` 326.50 million) in favor of Export Development Canada on behalf of Decore Exxoils Private Limited towards the credit facility availed by Decore Exxoils Private Limited from Export Development Canada for purchase of assets.
(d) Details as required under Regulation 53 (f) read with Para (A) of Schedule VI of SEBI (Listing Obligation and Disclosure requirements) Regulation, 2015 in respect of loans, advances and investments in companies under the same managements.
(` in million)
Name of the CompanyClosing balance
Maximum amount outstanding during the year
March 31, 2017 March 31, 2016 March 31, 2017 March 31, 2016
I Media Corp Limited:Investments
- 10.96 10.96 10.96
DB Infomedia Private Limited:InvestmentsLoan
78.56
10.56
78.56
10.56
3.67 38.34 60.07 38.34
29. ROYALTY (a) Indian Performing Rights Society Limited (IPRS) IPRS had filed a suit against the Company on May 27, 2006 before the Honorable High Court of Delhi contesting against
the refusal by the Company to obtain a license from the IPRS with regards to broadcasting / performing its copyrighted works and pay royalty to IPRS.
IPRS had prayed for a permanent injunction restraining the Company from infringing any of the copyrights owned by the IPRS as well as for damages in favor of the IPRS. The Honorable Delhi High Court has denied IPRS’s application for injunction. IPRS had since preferred an appeal in the Honorable Supreme Court. In its Order dated September 20, 2016 the Honorable Supreme Court has upheld the orders of the Honorable Delhi High Court. The Honorable Delhi High Court has reserved its order and the same is yet to be pronounced. During the current year pursuant to favourable decision by the Honorable Supreme Court of India on royalty payable to Indian Performing Rights Society (‘IPRS’) pertaining to the period before June 21, 2012, the Company has written back provision amounting to ` 57.67 million. This had been netted off against royalty expense.
Considering the litigation involved, the Company has provided for royalty based on the best judgment assessment of the case for the period after June 2012. The management believes that the provision made in the books is sufficient to cover the liability for royalty, if any, which would be confirmed only after the final result of the litigation.

Financial Statements - Standalone
165
Overview
Statutory R
eportsFinancial S
tatements
Subsidiaries
NOTES to financial statements as at and for the year ended March 31, 2017
Since the matter is under litigation, the disclosures required as per the provisions of Ind AS 37 relating to the provisions made are not given as it is expected to prejudice seriously the position of the Company with regards to the litigation.
(b) Phonographic Performance Limited (PPL) A legal suit was filed by the Company on July 28, 2008 against PPL before the Copy Right Board against the
exorbitant rates proposed by PPL for grant of compulsory licenses. The Copy Right Board passed an order on August 25, 2010 by which PPL was directed to charge the proportionate amount (as per the music played) i.e. Royalty was to be calculated @ 2% of the net revenue. Accordingly, the Company is paying royalty to PPL since then. PPL has been claiming that the said revised rates were applicable only for the period starting from August 25, 2010 and the royalty for the period earlier to August 25, 2010 would be charged at a higher rate. PPL had subsequently filed a summary suit in Bombay High Court towards recovery of the said amount. At present the matter is pending before the Bombay High Court.
Considering the litigation involved, the Company has provided for the royalty for the period before August 25, 2010 based on the best judgment assessment of the case. The management believes that the provision made in the books is sufficient to cover the liability for royalty, if any, which would be confirmed only after the final result of the litigation.
Since the matter is under litigation, the disclosures required as per the provisions of Ind AS 37 –relating to the provisions made are not given as it is expected to prejudice seriously the position of the Company with regards to the litigation
30. LEASES (a) Operating lease (for assets taken on lease): Rentals in respect of operating leases are recognised as an expense in the statement of profit and loss, on a straight-
line basis over the lease term. a. The Company has taken various godown, office and residential premises under operating lease agreements.
These are generally renewable by mutual consent. b. Lease payments recognised for the year are ` 342.23 million (March 31, 2016: ` 316.32 million) c. There are no restrictions imposed in these lease agreements. There are escalation clauses in agreement with
some parties. There are no purchase options. There are no sub leases. d. The total of minimum lease payment under non-cancellable operating leases are:
(` in million)
Particulars March 31, 2017 March 31, 2016
Within one year 30.41 18.35
After one year but not more than 5 years 44.32 8.40
More than 5 years - –
Total 74.73 26.75

Markets That Matter
ANNUAL REPORT 2016-17166
(b) Operating lease (for assets given on lease): Rentals in respect of operating leases are recognised as an income in the statement of profit and loss, on a straight-line
basis over the lease term. a. The Company has given plant and machinery and investment property on operating lease arrangement for the
period ranging from 1 year to 3 years. The lease arrangement is cancellable with mutual consent. b. Lease income recognised for the year is ` 4.30 million (March 31, 2016: ` 3.11 million). c. There are no restrictions imposed in the lease agreements and there are no escalation clauses in the agreements. d. The details of assets given on operating lease are as follows:
(` in million)
Particulars March 31, 2017 March 31, 2016
Plant and machinery
Gross carrying amount 52.22 52.22
Accumulated depreciation 22.05 18.24
Depreciation for the year 3.81 3.89
Investment property
Gross carrying amount 23.13 5.67
Accumulated depreciation 3.42 0.15
Depreciation for the year 0.34 0.11
31. CONTINGENT LIABILITIES Contingent liabilities not provided for are as follows: a. For details of corporate guarantee given, refer note 28(c).
b. There are several defamation and other legal cases pending against the Company and its directors. These include criminal and civil cases. There are certain employee related cases also pending against the Company. In view of large number of cases, it is impracticable to disclose the details of each case separately. The estimated amount of claims against the Company in respect of these cases is ` 9.71 million (March 31, 2016: ` 9.28 million, April 1, 2015: ` 2.78 million). The estimated contingency in respect of some cases cannot be ascertained. Based on discussions with the solicitors and also the past trend in respect of such cases, the Company believes that there is no present obligation in respect of the above and hence no provision is considered necessary against the same.
c. Income tax demands from Income tax authorities of ̀ 7.55 million (March 31, 2016: ̀ 13.89 million, April 1, 2015: ̀ 7.47 million) relating to various assessment years is outstanding against the Company. These claims are being contested at various forums by the Company. The management does not expect these claims to succeed and accordingly, no provision for these claims has been recognised in the financial statements.
32. COMMITMENTS Estimated amount of contracts remaining to be executed on capital account and not provided for ` 47.28 million
(March 31, 2016: ` 83.51 million, April 1, 2015: ` 213.70 million).
NOTES to financial statements as at and for the year ended March 31, 2017

Financial Statements - Standalone
167
Overview
Statutory R
eportsFinancial S
tatements
Subsidiaries
NOTES to financial statements as at and for the year ended March 31, 2017
33. (a) Auditors’ remuneration (included in legal and professional charges in note 26):
(` in million)
Particulars March 31, 2017 March 31, 2016
As auditor:
Audit fees 13.79 13.77
Tax audit fees 0.46 0.46
Other services - 1.38
Reimbursement of out of pocket expenses 1.15 1.15
Total 15.40 16.76
(b) Legal and professional charges include sitting fees paid to directors ` 0.70 million (March 31, 2016: ` 0.73 million).
34. EMPLOYEE BENEFITS As per the payment of Gratuity Act, 1972, the Company has a defined benefit gratuity plan. Every employee who has
completed five years or more of service gets a gratuity on departure at 15 days’ salary (last drawn salary) for each completed year of service. The scheme of the Company is funded with an insurance company in the form of a qualifying insurance policy.
Management aims to keep annual contribution relatively stable at such a level such that no plan deficits will arise.
The following table’s summaries the components of net benefit expense recognised in the statement of profit and loss and the funded status and amounts recognised in the balance sheet for the respective plans of the Company.
Statement of profit and loss- Net employee benefits expense (recognised in employee cost)
(` in million)
Particulars March 31, 2017 March 31, 2016
Current service cost 30.01 29.16
Net interest cost 10.65 16.31
Net benefit expense 40.66 45.47
Balance sheet- Details of provision and fair value of plan assets
(` in million)
Particulars March 31, 2017 March 31, 2016
Benefit obligation 310.53 251.56
Fair value of plan assets (186.54) (139.08)
Net liability 123.99 112.48
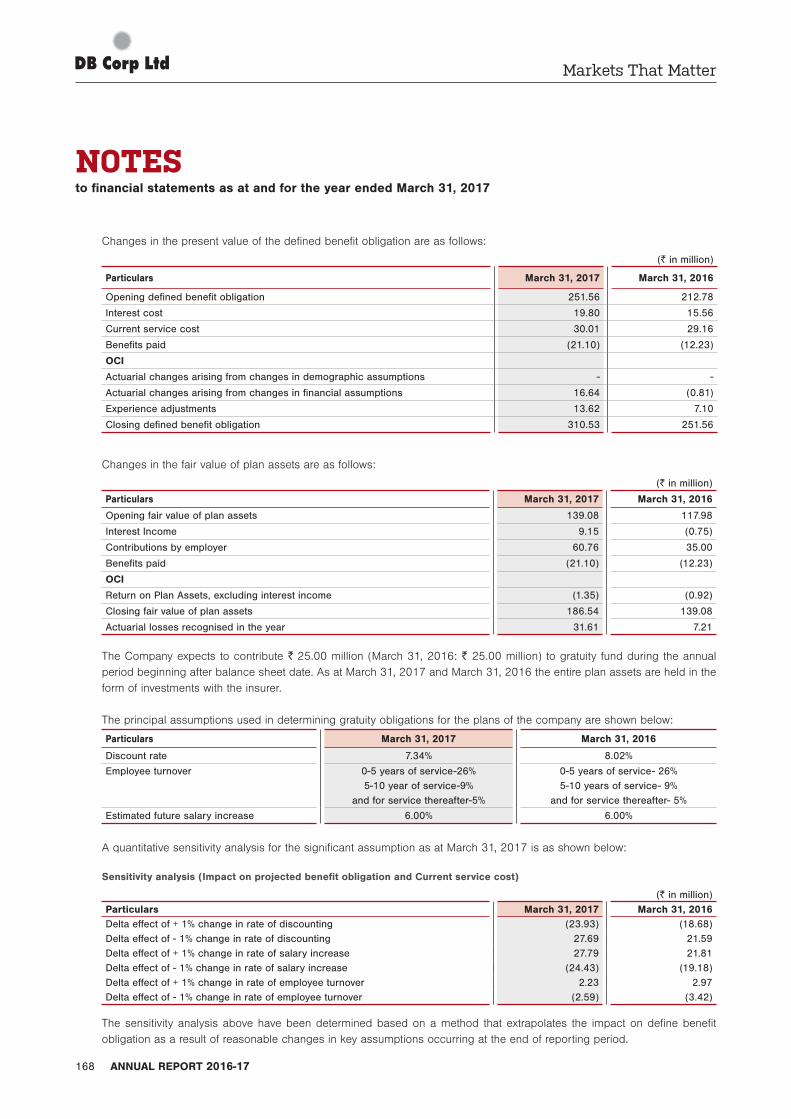
Markets That Matter
ANNUAL REPORT 2016-17168
NOTES to financial statements as at and for the year ended March 31, 2017
Changes in the present value of the defined benefit obligation are as follows:
(` in million)
Particulars March 31, 2017 March 31, 2016
Opening defined benefit obligation 251.56 212.78
Interest cost 19.80 15.56
Current service cost 30.01 29.16
Benefits paid (21.10) (12.23)
OCI
Actuarial changes arising from changes in demographic assumptions - -
Actuarial changes arising from changes in financial assumptions 16.64 (0.81)
Experience adjustments 13.62 7.10
Closing defined benefit obligation 310.53 251.56
Changes in the fair value of plan assets are as follows:
(` in million)
Particulars March 31, 2017 March 31, 2016
Opening fair value of plan assets 139.08 117.98
Interest Income 9.15 (0.75)
Contributions by employer 60.76 35.00
Benefits paid (21.10) (12.23)
OCI
Return on Plan Assets, excluding interest income (1.35) (0.92)
Closing fair value of plan assets 186.54 139.08
Actuarial losses recognised in the year 31.61 7.21
The Company expects to contribute ` 25.00 million (March 31, 2016: ` 25.00 million) to gratuity fund during the annual period beginning after balance sheet date. As at March 31, 2017 and March 31, 2016 the entire plan assets are held in the form of investments with the insurer.
The principal assumptions used in determining gratuity obligations for the plans of the company are shown below:
Particulars March 31, 2017 March 31, 2016
Discount rate 7.34% 8.02%
Employee turnover 0-5 years of service-26%5-10 year of service-9%
and for service thereafter-5%
0-5 years of service- 26%5-10 years of service- 9%
and for service thereafter- 5%
Estimated future salary increase 6.00% 6.00%
A quantitative sensitivity analysis for the significant assumption as at March 31, 2017 is as shown below:
Sensitivity analysis (Impact on projected benefit obligation and Current service cost)
(` in million)Particulars March 31, 2017 March 31, 2016Delta effect of + 1% change in rate of discounting (23.93) (18.68)Delta effect of - 1% change in rate of discounting 27.69 21.59Delta effect of + 1% change in rate of salary increase 27.79 21.81Delta effect of - 1% change in rate of salary increase (24.43) (19.18)Delta effect of + 1% change in rate of employee turnover 2.23 2.97Delta effect of - 1% change in rate of employee turnover (2.59) (3.42)
The sensitivity analysis above have been determined based on a method that extrapolates the impact on define benefit obligation as a result of reasonable changes in key assumptions occurring at the end of reporting period.
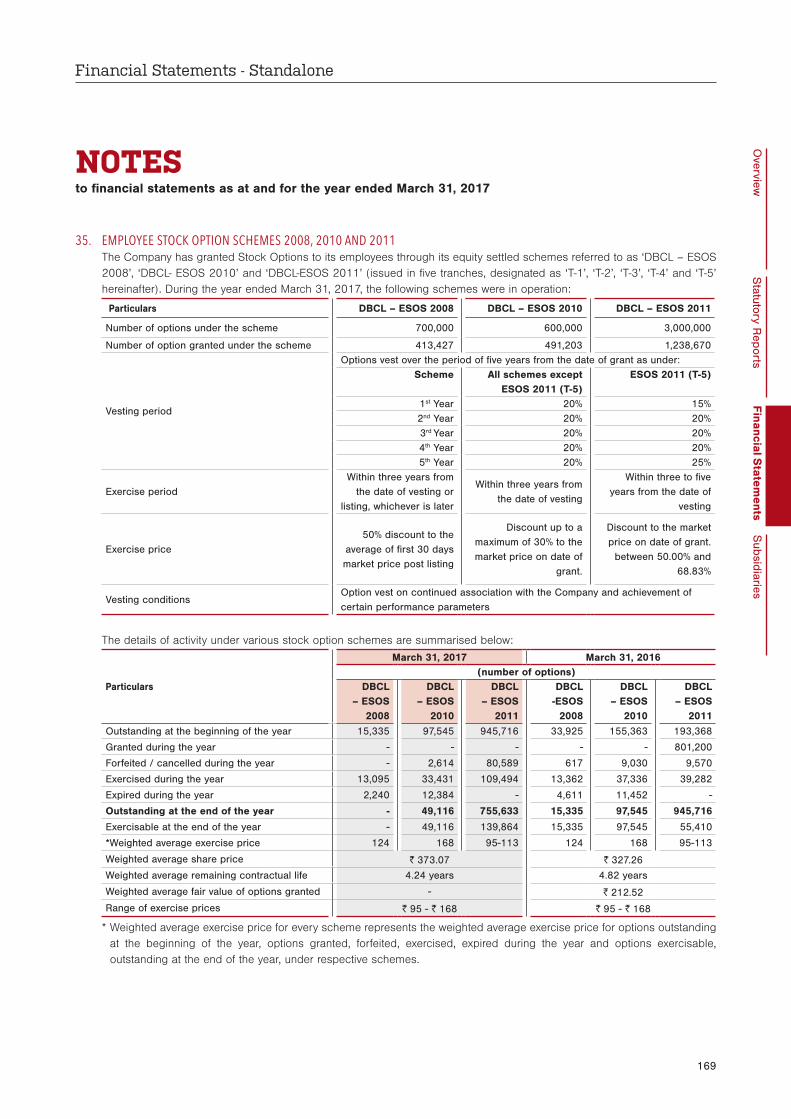
Financial Statements - Standalone
169
Overview
Statutory R
eportsFinancial S
tatements
Subsidiaries
35. EMPLOYEE STOCK OPTION SCHEMES 2008, 2010 AND 2011 The Company has granted Stock Options to its employees through its equity settled schemes referred to as ‘DBCL – ESOS
2008’, ‘DBCL- ESOS 2010’ and ‘DBCL-ESOS 2011’ (issued in five tranches, designated as ‘T-1’, ‘T-2’, ‘T-3’, ‘T-4’ and ‘T-5’ hereinafter). During the year ended March 31, 2017, the following schemes were in operation:
Particulars DBCL – ESOS 2008 DBCL – ESOS 2010 DBCL – ESOS 2011
Number of options under the scheme 700,000 600,000 3,000,000
Number of option granted under the scheme 413,427 491,203 1,238,670
Vesting period
Options vest over the period of five years from the date of grant as under:Scheme All schemes except
ESOS 2011 (T-5)ESOS 2011 (T-5)
1st Year 20% 15%2nd Year 20% 20%3rd Year 20% 20%4th Year 20% 20%5th Year 20% 25%
Exercise periodWithin three years from
the date of vesting or listing, whichever is later
Within three years from the date of vesting
Within three to five years from the date of
vesting
Exercise price50% discount to the
average of first 30 days market price post listing
Discount up to a maximum of 30% to the market price on date of
grant.
Discount to the market price on date of grant.
between 50.00% and 68.83%
Vesting conditionsOption vest on continued association with the Company and achievement of certain performance parameters
The details of activity under various stock option schemes are summarised below:
Particulars
March 31, 2017 March 31, 2016(number of options)
DBCL – ESOS
2008
DBCL – ESOS
2010
DBCL – ESOS
2011
DBCL -ESOS
2008
DBCL – ESOS
2010
DBCL – ESOS
2011
Outstanding at the beginning of the year 15,335 97,545 945,716 33,925 155,363 193,368
Granted during the year - - - - - 801,200
Forfeited / cancelled during the year - 2,614 80,589 617 9,030 9,570
Exercised during the year 13,095 33,431 109,494 13,362 37,336 39,282
Expired during the year 2,240 12,384 - 4,611 11,452 -
Outstanding at the end of the year - 49,116 755,633 15,335 97,545 945,716
Exercisable at the end of the year - 49,116 139,864 15,335 97,545 55,410
*Weighted average exercise price 124 168 95-113 124 168 95-113
Weighted average share price ` 373.07 ` 327.26
Weighted average remaining contractual life 4.24 years 4.82 years
Weighted average fair value of options granted - ` 212.52
Range of exercise prices ` 95 - ` 168 ` 95 - ` 168
* Weighted average exercise price for every scheme represents the weighted average exercise price for options outstanding at the beginning of the year, options granted, forfeited, exercised, expired during the year and options exercisable, outstanding at the end of the year, under respective schemes.
NOTES to financial statements as at and for the year ended March 31, 2017

Markets That Matter
ANNUAL REPORT 2016-17170
36. DETAILS OF DUES TO MICRO AND SMALL ENTERPRISES AS PER MICRO, SMALL AND MEDIUM ENTERPRISES DEVELOPMENT ACT, 2006
(a) An amount of ` 6.14 million (March 31, 2016: ` 12.93 million), (April 1, 2015: ` 7.00 million) and ` Nil, (March 31, 2016: ` Nil), (April 1, 2015: ` Nil) was due and outstanding to suppliers as at March 31, 2017 on account of principal and interest respectively.
(b) No interest was paid during the year to any supplier (March 31, 2016: ` Nil), (April 1, 2015: ` Nil). (c) No interest was paid to any suppliers for payments made beyond the appointed date during the accounting year
(March 31, 2016: ` Nil), (April 1, 2015: ` Nil). (d) No claims have been received till the end of the year for interest under Micro, Small and Medium Enterprises
Development Act, 2006 (March 31, 2016: ` Nil), (April 1, 2015: ` Nil). (e) No amount of interest was accrued and unpaid at March 31, 2017 (March 31, 2016: ` Nil), (April 1, 2015: ` Nil).
The above information regarding Micro, Small and Medium Enterprises has been determined to the extent such parties have been identified on the basis of information available with the Company. This has been relied upon by the auditors.
37. EXPENDITURE ON CORPORATE SOCIAL RESPONSIBILITY(` in million)
Particulars March 31, 2017 March 31, 2016
(a) Gross amount required to be spent by the Company during the year 94.44 85.90
(b) Amount spent during the year:
Promoting empowering women, setting up old age homes - 25.78
Rural development program 10.00 -
Promoting education, including special education and employment enhancing vocation skills
59.72 16.26
Ensuring environment sustainability, ecological balance, animal welfare, donation to Army welfare Fund
3.64 2.44
Eradicating hunger, poverty and malnutrition, promoting preventive health care
0.22 1.67
Above amounts are fully paid during the year
38. FAIR VALUE HIERARCHY The following table provides the fair value measurement hierarchy of the Company’s financial assets and financial liabilities.
Quantitative disclosures fair value measurement hierarchy as at March 31, 2017:
(` in million)
Particulars Total Level 1 Level 2 Level 3
Assets measured at fair value
FVTOCI financial investments
- Quoted equity shares 10.07 10.07 - -
- Unquoted equity shares 259.26 - - 259.26
Total financial assets measured at fair value 269.33 10.07 - 259.26
Liabilities measured at fair value
Foreign exchange forward contract 7.38 - 7.38 -
NOTES to financial statements as at and for the year ended March 31, 2017

Financial Statements - Standalone
171
Overview
Statutory R
eportsFinancial S
tatements
Subsidiaries
Quantitative disclosures fair value measurement hierarchy as at March 31, 2016:(` in million)
Particulars Total Level 1 Level 2 Level 3
FVTOCI financial investments
- Quoted equity shares 11.81 11.81 - -
- Unquoted equity shares 259.26 - - 259.26
FVTPL financial investments
- Quoted equity shares 169.29 169.29 - -
Total financial assets measured at fair value 440.36 181.10 - 259.26
Liabilities measured at fair value
Foreign exchange forward contract 2.34 - 2.34 -
Quantitative disclosures fair value measurement hierarchy as at April 1, 2015:(` in million)
Particulars Total Level 1 Level 2 Level 3
FVTOCI financial investments
- Quoted equity shares 10.35 10.35 - -
- Unquoted equity shares 269.26 - - 269.26
- Unquoted debentures 3.60 - - 3.60
FVTPL financial investments
- Quoted equity shares 249.46 249.46 - -
Total financial assets measured at fair value 532.67 259.81 - 272.86
The management assessed that cash and cash equivalents, trade receivables, trade payables, short-term borrowings, bank overdrafts and other current liabilities approximate their carrying amounts largely due to the short-term maturities of these instruments. Further the long-term borrowing has been considered at fair value since it carries a floating rate of interest.
Break up of financial assets carried at amortised cost
(` in million)
Particulars March 31, 2017 March 31, 2016 April 01, 2015
Trade receivable (note 11) 4,173.75 3,771.61 3,361.06
Cash and cash equivalents (note 12) 1,733.30 894.60 1,760.79
Other financial assets (note 8) 449.13 500.48 649.28
Total financial assets carried at amortised cost 6,356.18 5,166.69 5,771.13
Break up of financial liabilities carried at amortised cost(` in million)
Particulars March 31, 2017 March 31, 2016 April 01, 2015
Trade Payables 1,274.85 1,177.55 1,214.29
Other financial liabilities 1,647.16 1,729.97 1,354.48
Total financial assets carried at amortised cost 2,922.01 2,907.52 2,568.77
The fair value of the financial assets and liabilities is included at the amount at which the instrument could be exchanged in a current transaction between willing parties, other than in a forced or liquidation sale. The following methods and assumptions were used to estimate the fair values:
The Company has used prices from prior transactions / third-party pricing information with relevant adjustment for the valuation of unquoted equity shares. Hence the quantitative information about the significant unobservable inputs have not been disclosed.
NOTES to financial statements as at and for the year ended March 31, 2017

Markets That Matter
ANNUAL REPORT 2016-17172
NOTES to financial statements as at and for the year ended March 31, 2017
The Company enters into derivative financial instruments majorly foreign exchange forward contracts with the banks. These foreign exchange forward contracts are valued using valuation techniques, which employs the use of market observable inputs.
39. FINANCIAL RISK MANAGEMENT OBJECTIVES AND POLICIES The Company’s principal financial liabilities, other than derivatives, comprise loans and borrowings, trade and other payables.
The main purpose of these financial liabilities is to finance the Company’s operations. The Company’s principal financial assets include loans, trade and other receivables, and cash and cash equivalents that derive directly from its operations. The Company also holds quoted and unquoted investments .
The Company is exposed to market risk, credit risk and liquidity risk. The Company’s senior management oversees the management of these risks. The Company’s senior management ensures that the Company’s financial risk activities are governed by appropriate policies and procedures and that financial risks are identified, measured and managed in accordance with the Company’s policies and risk objectives. It is the Company’s policy that no trading in derivatives for speculative purposes may be undertaken. The senior management reviews and agrees policies for managing each of these risks, which are summarised below.
Market risk Market risk is the risk that the fair value of future cash flows of a financial instrument will fluctuate because of changes in
market prices. Market risk comprises two types of risk: currency risk and other price risk, such as equity price risk and commodity risk. Financial instruments affected by market risk include deposits, investments, derivative financial instruments and borrowings.
The sensitivity analysis have been prepared on the basis that the proportion of financial instruments in foreign currencies are all constant as at March 31, 2017.
The analysis exclude the impact of movements in market variables on: the carrying values of gratuity and non-financial assets and liabilities
The following assumptions have been made in calculating the sensitivity analysis: The sensitivity of the relevant profit or loss item is the effect of the assumed changes in respective market risks. This is
based on the financial liabilities held at March 31, 2017 and March 31, 2016
Foreign currency sensitivity The Company procures newsprint from the international markets after considering the prevailing prices in the domestic and
international markets. The Company uses foreign exchange forward contracts to manage some of its transaction exposures. These foreign exchange forward contracts are not designated as cash flow hedges and are entered into for the periods consistent with the foreign currency exposure of the underlying transactions, generally from one to six months.
Particulars of derivative contracts outstanding as at the balance sheet date:(` in million)
Nature of derivative contract
Nature of underlying exposures
PurposeMarch 31, 2017 March 31, 2016 April 1, 2015
$ ` $ ` $ `
Foreign exchange forward contracts
Buyers credit from banks Purchase of
news print
1.49 96.46 1.63 108.00 0.90 56.39
Trade payables 3.97 257.15 0.65 43.07 - -
As at balance sheet date, the Company’s net foreign currency exposure (payable) that is not hedged is ` 1,030.75 million (March 31, 2016: ` 1,407.62 million and April 1, 2015: ` 1,594.63 million)

Financial Statements - Standalone
173
Overview
Statutory R
eportsFinancial S
tatements
Subsidiaries
The following tables demonstrate the sensitivity to a reasonably possible change in USD exchange rates, with all other variables held constant.
(` in million)
ParticularChange in Effect on profit before tax
$ `
March 31, 2017
5% -69.22
-5% 69.22
10% -138.44
-10% 138.44
March 31, 2016
5% -77.93
-5% 77.93
10% -155.87
-10% 155.87
The impact on the Company’s profit before tax is due to changes in the fair value of monetary assets and liabilities including non-designated foreign currency derivatives and embedded derivatives. The impact on the Company’s pre-tax equity is due to changes in the fair value of forward exchange contracts designated as cash flow hedges and net investment hedges. The Company’s exposure to foreign currency changes for all other currencies is not material.
Commodity price risk The Company is affected by the price volatility of certain commodities. Its operating activities require the ongoing printing of
newspapers and magazines and therefore require a continuous supply of newsprint. The Company’s Board of Directors has developed and enacted a risk management strategy regarding commodity price risk and its mitigation. Based on a 12-month forecast of the required newsprint supply, the Company hedges the purchase price using forward commodity purchase contracts. The forecast is deemed to be highly probable.
Credit risk Credit risk is the risk that counterparty will not meet its obligations under a financial instrument or customer contract, leading
to a financial loss. The Company is exposed to credit risk from its operating activities (primarily trade receivables).
Trade receivables Customer credit risk is managed by each business unit subject to the Company’s established policy, procedures and
control relating to customer credit risk management. Credit quality of a customer is assessed based on an individual credit limits are defined in accordance with this assessment. Outstanding customer receivables are regularly monitored. At March 31, 2017, the Company had 5 customers (March 31, 2016: 6 customers, April 01, 2015: 9 customers) that owed the Company more than ` 50.00 million each and accounted for approximately 12% (March 31, 2016: 12%, April 01, 2015: 17%) of all the receivables outstanding. There were 50 customers (March 31, 2016: 50 customers, April 01, 2015: 37 customers) with balances greater than ` 10.00 million accounting for just over 31% (March 31, 2016: 33%, April 01, 2015: 32%) of the total amount receivables.
An impairment analysis is performed at each reporting date on an individual basis for major clients. In addition, a large number of minor receivables are grouped into homogeneous Company’s and assessed for impairment collectively. The maximum exposure to credit risk at the reporting date is the carrying value of each class of financial assets disclosed in Note 11. The Company does not hold collateral as security. The Company evaluates the concentration of risk with respect to trade receivables as low, as its customers are located in several jurisdictions and industries and operate in largely independent markets.
Liquidity risk The Company’s objective is to maintain a balance between continuity of funding and flexibility through the use of buyer’s
credit and bank loans. All of the Company’s debt will mature in less than one year at March 31, 2017 based on the carrying value of borrowings reflected in the financial statements. The Company assessed the concentration of risk with respect to refinancing its debt and concluded it to be low. The Company has access to a sufficient variety of sources of funding and debt maturing within 12 months can be rolled over with existing lenders.
NOTES to financial statements as at and for the year ended March 31, 2017

Markets That Matter
ANNUAL REPORT 2016-17174
The table below provides details regarding the contractual maturities of significant financial liabilities as at March 31, 2017:
(` in million)
Particulars On demandLess than 3
months3 to 12 months
1 to 5 years Total
Borrowings (note 14) - - 561.19 - 561.19
Trade and other payables 26.80 759.07 488.98 - 1,274.85
Other financial liabilities 751.41 5.48 409.46 481.78 1,648.13 Total 778.21 764.55 1,459.63 481.78 3,484.17
The table below provides details regarding the contractual maturities of significant financial liabilities as at March 31, 2016:(` in million)
Particulars On demandLess than 3
months3 to 12 months
1 to 5 years Total
Borrowings (note 14) - - 253.38 867.38 1,120.76
Trade and other payables 31.47 1,004.14 141.94 - 1,177.55Other financial liabilities 805.47 - 478.39 439.64 1,723.50Total 836.94 1004.14 873.71 1,307.02 4,021.81
Excessive risk concentration Concentrations arise when a number of counterparties are engaged in similar business activities, or activities in the
same geographical region, or have economic features that would cause their ability to meet contractual obligations to be similarly affected by changes in economic, political or other conditions. Concentrations indicate the relative sensitivity of the Company’s performance to developments affecting a particular industry.
In order to avoid excessive concentrations of risk, the Company’s policies and procedures include specific guidelines to focus on the maintenance of a diversified portfolio. Identified concentrations of credit risks are controlled and managed accordingly.
Capital management For the purpose of the Company’s capital management, capital includes issued equity capital, securities premium and all
other equity reserves attributable to the equity holders of the Company. The primary objective of the Company’s capital management is to maximise the shareholder value.
The Company manages its capital structure and makes adjustments in light of changes in economic conditions and the requirements of the financial covenants. To maintain or adjust the capital structure, the Company may adjust the dividend payment to shareholders, return capital to shareholders or issue new shares. The Company monitors capital using a gearing ratio, which is net debt divided by total capital plus net debt. The Company’s policy is to keep the gearing ratio less than 20%. The Company includes within net debt, interest bearing loans and borrowings, trade and other payables, less cash and cash equivalents, as calculated below.
(` in million)
Particulars March 31, 2017 March 31, 2016 April 01, 2015
Borrowings 808.89 1,374.80 1,189.24
Trade payables 1,274.85 1,177.55 1,214.29
Other payables 1,400.43 1,471.46 1,106.20
Less: Cash and cash equivalents 1,733.30 894.60 1,760.79
Net debt 1,750.87 3,129.21 1,748.94
Equity 15,988.51 13,994.14 13,434.17
Equity and net debt 17,739.38 17,123.35 15,183.11
Gearing ratio 9.87% 18.27% 11.52%
NOTES to financial statements as at and for the year ended March 31, 2017

Financial Statements - Standalone
175
Overview
Statutory R
eportsFinancial S
tatements
Subsidiaries
In order to achieve this overall objective, the Company’s capital management, amongst other things, aims to ensure that it meets financial covenants attached to the interest-bearing loans and borrowings that define capital structure requirements. Breaches in meeting the financial covenants would permit the bank to immediately call loans and borrowings. There have been no breaches in the financial covenants of any interest-bearing loans and borrowing in the current period.
No changes were made in the objectives, policies or processes for managing capital during the years ended March 31, 2017 and March 31, 2016.
40. DISCLOSURE ON SPECIFIED BANK NOTE (SBNs) In accordance with MCA notification G.S.R. 308(E) dated March 31, 2017, details of Specified Bank Notes (‘SBN’) and other
denomination notes (‘ODNs’) held and transacted during the period from November 8, 2016 to December, 30 2016, is given below:
(` in million)
Particulars SBNs ODNs Total
Closing cash on hand as on November 8, 2016 74.20 4.80 79.00
(+) Permitted receipts - 264.03 264.03
(-) Permitted payments 0.08 15.39 15.47
(-) Amount deposited in Banks 74.12 244.49 318.61
Closing cash on hand as on December 30, 2016 - 8.95 8.95
As per our report of even date
For S.R. Batliboi & Associates LLP ICAI Firm registration number:
For Gupta Navin K. & Co. ICAI Firm registration number:
For and on behalf of the Board of Directors of D. B. Corp Limited
101049W/E300004 006263CChartered Accountants Chartered Accountants
per Kalpesh Jain per Navin K. Gupta Sudhir Agarwal Pawan AgarwalPartner Partner Managing Director Deputy Managing DirectorMembership No. 106406 Membership No. 075030
P. G. Mishra Anita GokhaleChief Financial Officer Company Secretary
Place: Mumbai Place: Mumbai Place: Mumbai
Date: May 18, 2017 Date: May 18, 2017 Date: May 18, 2017
NOTES to financial statements as at and for the year ended March 31, 2017