notice concerning copyright restrictionspubs.geothermal-library.org/lib/grc/1029410.pdf ·...
TRANSCRIPT

NOTICE CONCERNING COPYRIGHT RESTRICTIONS
This document may contain copyrighted materials. These materials have been made available for use in research, teaching, and private study, but may not be used for any commercial purpose. Users may not otherwise copy, reproduce, retransmit, distribute, publish, commercially exploit or otherwise transfer any material.
The copyright law of the United States (Title 17, United States Code) governs the making of photocopies or other reproductions of copyrighted material.
Under certain conditions specified in the law, libraries and archives are authorized to furnish a photocopy or other reproduction. One of these specific conditions is that the photocopy or reproduction is not to be "used for any purpose other than private study, scholarship, or research." If a user makes a request for, or later uses, a photocopy or reproduction for purposes in excess of "fair use," that user may be liable for copyright infringement.
This institution reserves the right to refuse to accept a copying order if, in its judgment, fulfillment of the order would involve violation of copyright law.
GRC Transactions, Vol. 35, 2011
1255
KeywordsPerforation, acidizing, short term flow test, water loss test, Gümüşköy
ABSTRACT
Gümüşköy geothermal area is located at the Western of the Büyük Menderes Graben adjacent to Germencik GEPP (47.4 MW) in Aydın, Turkey. BM Holding Inc. has been working in this exploration concession since 2005. So far 13 gradient well were drilled with one wildcat exploration well GK-1 and a develop-ment well GK-3. GK-1 was completed on 28 May 2009 at a total depth of 2100 meters. Flow tests confirm presence of a geother-mal reserve in the Gümüşköy formation, yielding a flow rate of 230 tons/hour and a maximum reservoir temperature of 181 °C. Exploration drilling was continued with development well GK-3 reaching 2057 m depth with a maximum temperature of 165 °C and a flow rate of 115 tons/hour.
Post-completion well logs in GK-3 revealed the presence of a high temperature zone behind the cemented 9 5/8” casing in the well at approximately 1050 m depth, where further analysis placed this as an additional production zone. Following detailed analysis, GK-3’s 5 sections (6 m long each) from 1028 m till 1131 m depth was perforated where, jet perforating guns equipped with shaped explosive charges were used. Before the perforation, cold water was injected into the well for 2 days, in order to cool the well for logging-probe operating conditions. Ex-isting and recent CBL logs were used and correlated for precise depth information and application depths. As a result, a production path was created from the production zone into the well bore. Following the operation, acidizing was performed to further increase production. Water loss tests were conducted along each step of the operation as reference for future analyses. These operations resulted in an overall increase of 36 tons/hr for the flow rate of GK-3.
1. Introduction
Gümüşköy geothermal area is located at the Western end of the Büyük Menderes Graben adjacent to Germencik GEPP (47.4 MW) in Aydın, Turkey. Most of the geothermal systems of Western Anatolia were formed in E-W directions by extensional tectonic features.
The Anatolide belt of Western Turkey, which is also known as Menderes Massive was continuously effected by regional exten-sional deformation from at Early Oligocene times to the present (Lister; Banga & Feenstra, 1984; Buick, 1991; Seyitoglu, Scott & Rundle, 1992; Hetzel et al. 1995a; Gessner et al. 2001a). The Menderes Massive has a complex nappe-pile structure developed during the closing of Neotethys consisting of different tectonic slices including metamorphic and metaophiolitic rocks (Ring et al. 1999, 2003). Pan-African intense deformation and eclogitic metamorphism affected only the core of the massif and deforma-tion followed by regional amphibolite-facies metamorphism with
Perforation and Acidizing Applications of GK-3 Well, Gumuskoy Geothermal System, Aydın, Turkey
Ö. Çağlan Kuyumcu, Umut Z. D. Solaroğlu, Ozan Atalay, Sertaç Akar, Bahadır İpek, Mahmut Çi̇ftçi̇
BM Engineering and Construction Inc., Ankara, Turkey
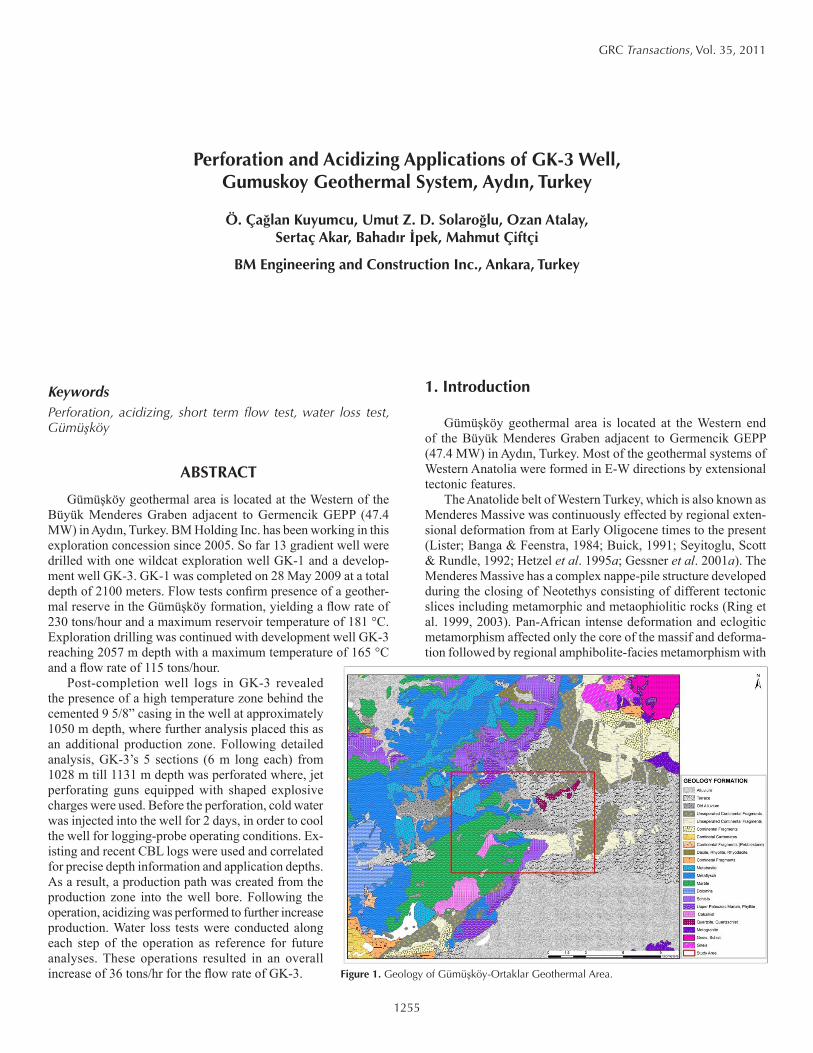
Figure 1. Geology of Gümüşköy-Ortaklar Geothermal Area.
1256
Kuyumcu, et al.
local anatexis (Rimmelé et al.2004; Şengör et al., 1984; Candan et al. 2001). Main structures characterizing and shaping this neo-tectonic domain are the The E-W-trending graben-horst systems and their margin boundary normal faults (Figure 1).
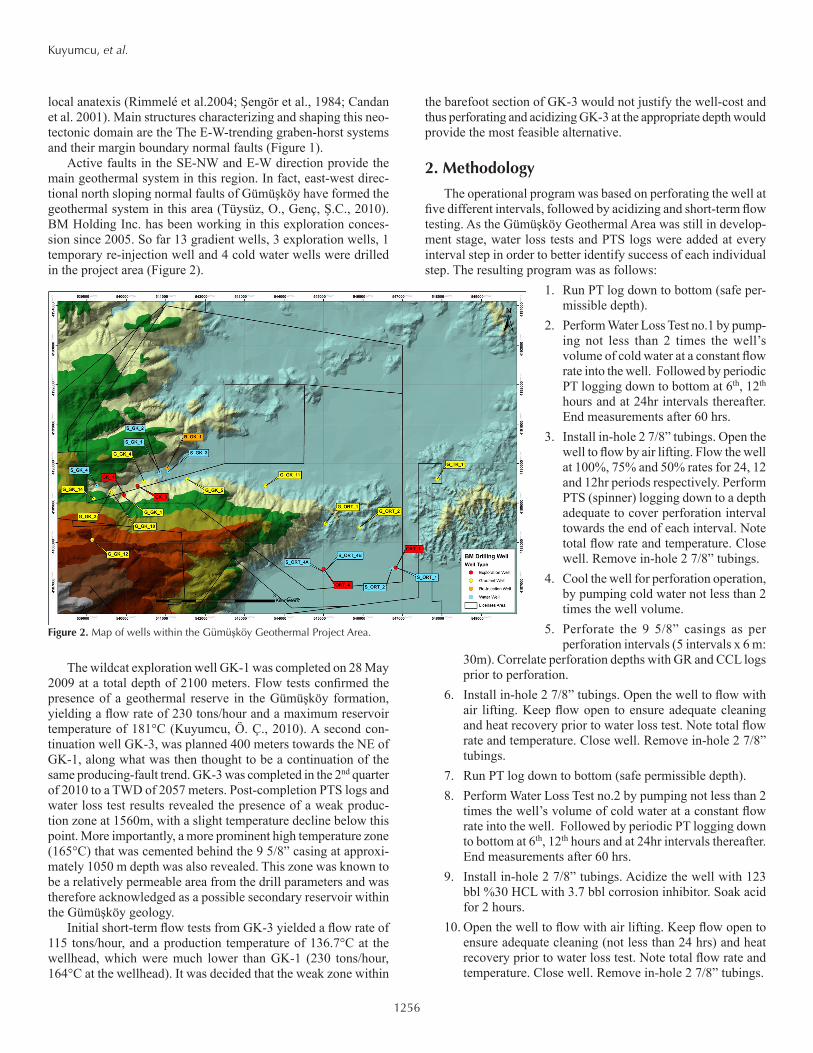
Active faults in the SE-NW and E-W direction provide the main geothermal system in this region. In fact, east-west direc-tional north sloping normal faults of Gümüşköy have formed the geothermal system in this area (Tüysüz, O., Genç, Ş.C., 2010). BM Holding Inc. has been working in this exploration conces-sion since 2005. So far 13 gradient wells, 3 exploration wells, 1 temporary re-injection well and 4 cold water wells were drilled in the project area (Figure 2).
The wildcat exploration well GK-1 was completed on 28 May 2009 at a total depth of 2100 meters. Flow tests confirmed the presence of a geothermal reserve in the Gümüşköy formation, yielding a flow rate of 230 tons/hour and a maximum reservoir temperature of 181°C (Kuyumcu, Ö. Ç., 2010). A second con-tinuation well GK-3, was planned 400 meters towards the NE of GK-1, along what was then thought to be a continuation of the same producing-fault trend. GK-3 was completed in the 2nd quarter of 2010 to a TWD of 2057 meters. Post-completion PTS logs and water loss test results revealed the presence of a weak produc-tion zone at 1560m, with a slight temperature decline below this point. More importantly, a more prominent high temperature zone (165°C) that was cemented behind the 9 5/8” casing at approxi-mately 1050 m depth was also revealed. This zone was known to be a relatively permeable area from the drill parameters and was therefore acknowledged as a possible secondary reservoir within the Gümüşköy geology.
Initial short-term flow tests from GK-3 yielded a flow rate of 115 tons/hour, and a production temperature of 136.7°C at the wellhead, which were much lower than GK-1 (230 tons/hour, 164°C at the wellhead). It was decided that the weak zone within
the barefoot section of GK-3 would not justify the well-cost and thus perforating and acidizing GK-3 at the appropriate depth would provide the most feasible alternative.
2. Methodology
The operational program was based on perforating the well at five different intervals, followed by acidizing and short-term flow testing. As the Gümüşköy Geothermal Area was still in develop-ment stage, water loss tests and PTS logs were added at every interval step in order to better identify success of each individual step. The resulting program was as follows:
1. Run PT log down to bottom (safe per-missible depth).
2. Perform Water Loss Test no.1 by pump-ing not less than 2 times the well’s volume of cold water at a constant flow rate into the well. Followed by periodic PT logging down to bottom at 6th, 12th hours and at 24hr intervals thereafter. End measurements after 60 hrs.
3. Install in-hole 2 7/8” tubings. Open the well to flow by air lifting. Flow the well at 100%, 75% and 50% rates for 24, 12 and 12hr periods respectively. Perform PTS (spinner) logging down to a depth adequate to cover perforation interval towards the end of each interval. Note total flow rate and temperature. Close well. Remove in-hole 2 7/8” tubings.
4. Cool the well for perforation operation, by pumping cold water not less than 2 times the well volume.
5. Perforate the 9 5/8” casings as per perforation intervals (5 intervals x 6 m:
30m). Correlate perforation depths with GR and CCL logs prior to perforation.
6. Install in-hole 2 7/8” tubings. Open the well to flow with air lifting. Keep flow open to ensure adequate cleaning and heat recovery prior to water loss test. Note total flow rate and temperature. Close well. Remove in-hole 2 7/8” tubings.
7. Run PT log down to bottom (safe permissible depth).8. Perform Water Loss Test no.2 by pumping not less than 2
times the well’s volume of cold water at a constant flow rate into the well. Followed by periodic PT logging down to bottom at 6th, 12th hours and at 24hr intervals thereafter. End measurements after 60 hrs.
9. Install in-hole 2 7/8” tubings. Acidize the well with 123 bbl %30 HCL with 3.7 bbl corrosion inhibitor. Soak acid for 2 hours.
10. Open the well to flow with air lifting. Keep flow open to ensure adequate cleaning (not less than 24 hrs) and heat recovery prior to water loss test. Note total flow rate and temperature. Close well. Remove in-hole 2 7/8” tubings.
Figure 2. Map of wells within the Gümüşköy Geothermal Project Area.

1257
Kuyumcu, et al.
11. Run PT log down to bottom (safe permissible depth).12. Perform Water Loss Test no. 3 by pumping not less than
2 times the well’s volume of cold water at a constant flow rate into the well. Followed by periodic PT logging down to bottom at 6th, 12th hours and at 24hr intervals thereafter. End measurements after 60 hrs.
13. End operation.
3. Perforation Overview
Perforation is a method typically used in the oil and gas indus-try. In cased-hole completions, the well will typically be drilled down past the section of the formation desired for production and will have casing or liner run-in, separating the formation from the wellbore. Perforation helps create a hole in the final casing through the cement and into the formation, to form a channel for the oil and gas to flow from the producing formation into the wellbore. Alternative uses include recovery of other formation fluids, and injection into formation of fluids, gas, cement or other agents. (T. Qayyum, 2009; T. Qayyum, K. Khattak, I. Qureshi, T. Aizad, 2009.)
Perforation is commonly performed by using perforation guns that are pre-loaded with shaped charges and run into the well on E-line, slick-line or coiled Tubing (for highly deviated wells). A mechanism on the gun arms the charges upon reaching a certain temperature and pressure or is otherwise activated via a timer. Dif-ferent types and sizes of guns can be selected based on wellbore restrictions or limitations imposed by the surface equipment. The disadvantage is that perforating can lead to “skin damage”, where debris from the perforations can hinder productivity of the well. In order to mitigate this, perforating is commonly done under balanced (lower pressure in the well bore than in the formation) as the higher formation pressure will cause a surge of fluids into the well at the point of perforating, hopefully carrying the debris with it. (Halliburton, Perforating Solutions)
4. Determination of Perforation Sections
The target area for perforation was the high temperature zone (approx. 165°C) that was cemented behind the 9 5/8” cas-
ing between 1000 m to 1150m depths. This zone was known to be a relatively permeable area from the drill parameters and was therefore acknowledged as a possible secondary reservoir within the Gümüşköy geology. Zones of interest within the target area were determined based on initial water loss test results and con-secutive PT log readings. Although water loss tests do not work for encased sections of the well, temperature recovery profile of GK-3 still served as a valuable tool to confirm the presence of a higher temperature zone behind the casing. Within this zone, successive PT logs were subtracted from each other in order to observe temperature buildup profile. This study revealed two zones of interest, a larger one between 1020 – 1090m depth and a smaller one between 1125 – 1145m depth.
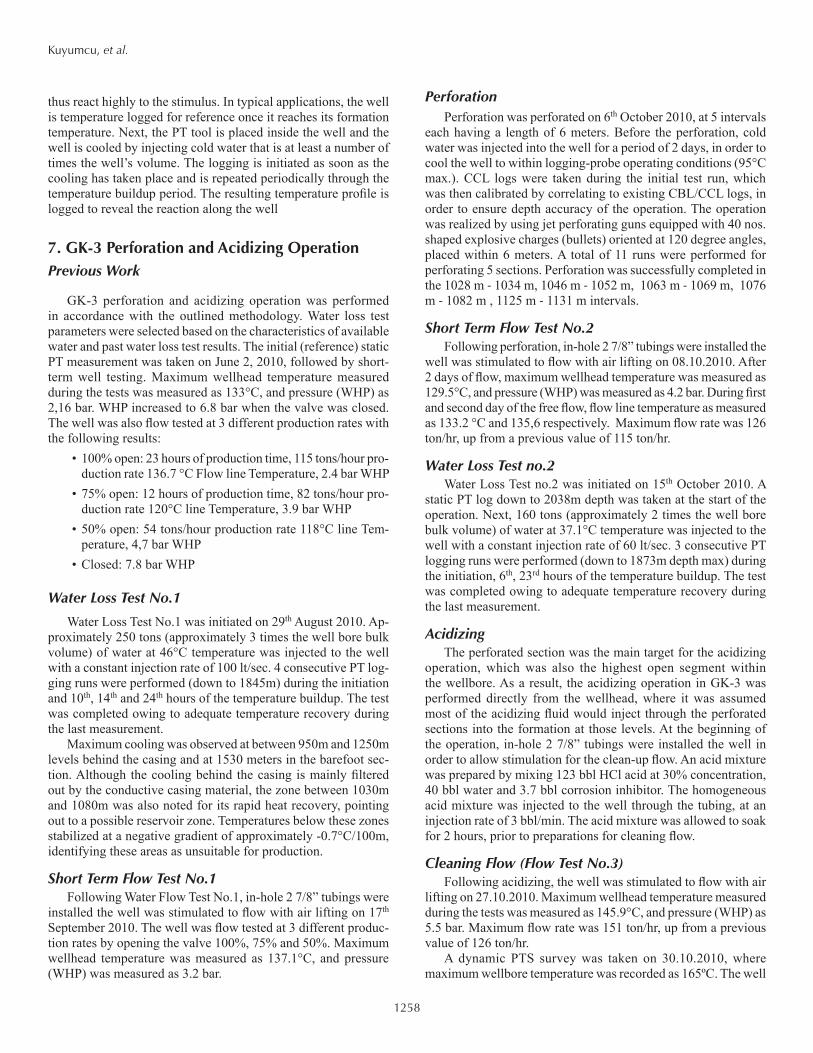
The number of perforation sections was determined based on typically available 3 meter long perforating guns commonly used for perforating 6 meter sections (Figure 3). An unperforated section of casing was retained between each perforated section in order to sustain casing integrity. A total of 5 intervals, for a total perforated depth of 30 meters were selected to adequately cover the 90m area of interest. Perforation depths for the 6m sections were determined based on the information received from Gamma-ray, Litology and Cement Bond Logs (CBL).
Selected perforation intervals were as follows:1028 m – 1034 m (schist, gneiss with pyrite minerals)1046 m – 1052 m (quartz-schist, chlorite-schist, gneiss)1063 m – 1069 m (quartz-schist)1076 m – 1082 m (quart-schist / gneiss; contact)1125 m – 1131 m (gneiss, quartz and pyrite minerals)
5. Acidizing Overview
Acid is used to clean wellbore and stimulate production / injectivity in all types of formations. Acid treatment types can be defined by injection rate and pumping pressure. Acid stimulation treatments carried out below formation fracture pressures are termed “Matrix Acidizing Treatments” while those carried out at pressures greater than formation fracture pressures are catego-rized as “Fracture Acidizing Treatments”. Acidizing operations are optimized based on a number of controlling factors includ-ing pressure, temperature, velocity, concentration, contact area and volume ratio, formation composition, surface wetting and viscosity. Mineral, organic acids, powdered acids (acid sticks) or combinations thereof can be used for treatment. Application is realized through pumping the acid mixture directly from the wellhead or through a tubing installed to a certain depth. The acidizing interval can also be confined for improved isolation by using packers.
6. Water Loss Testing and Logging Overview
Water loss testing is performed to determine permeable zones within the open wellbore in geothermal systems. It is based on the principle of cooling (or heating as the case may be) the well and observing most effectively cooled (heated) zones and rates of temperature recovery along the well profile. It is assumed that permeable zones shall allow the influx of cold (hot) water and
Figure. 3 Perforation operation at GK-3.
1258
Kuyumcu, et al.
thus react highly to the stimulus. In typical applications, the well is temperature logged for reference once it reaches its formation temperature. Next, the PT tool is placed inside the well and the well is cooled by injecting cold water that is at least a number of times the well’s volume. The logging is initiated as soon as the cooling has taken place and is repeated periodically through the temperature buildup period. The resulting temperature profile is logged to reveal the reaction along the well
7. GK-3 Perforation and Acidizing OperationPrevious Work
GK-3 perforation and acidizing operation was performed in accordance with the outlined methodology. Water loss test parameters were selected based on the characteristics of available water and past water loss test results. The initial (reference) static PT measurement was taken on June 2, 2010, followed by short-term well testing. Maximum wellhead temperature measured during the tests was measured as 133°C, and pressure (WHP) as 2,16 bar. WHP increased to 6.8 bar when the valve was closed. The well was also flow tested at 3 different production rates with the following results:
• 100% open: 23 hours of production time, 115 tons/hour pro-duction rate 136.7 °C Flow line Temperature, 2.4 bar WHP
• 75% open: 12 hours of production time, 82 tons/hour pro-duction rate 120°C line Temperature, 3.9 bar WHP
• 50% open: 54 tons/hour production rate 118°C line Tem-perature, 4,7 bar WHP
• Closed: 7.8 bar WHP
Water Loss Test No.1
Water Loss Test No.1 was initiated on 29th August 2010. Ap-proximately 250 tons (approximately 3 times the well bore bulk volume) of water at 46°C temperature was injected to the well with a constant injection rate of 100 lt/sec. 4 consecutive PT log-ging runs were performed (down to 1845m) during the initiation and 10th, 14th and 24th hours of the temperature buildup. The test was completed owing to adequate temperature recovery during the last measurement.
Maximum cooling was observed at between 950m and 1250m levels behind the casing and at 1530 meters in the barefoot sec-tion. Although the cooling behind the casing is mainly filtered out by the conductive casing material, the zone between 1030m and 1080m was also noted for its rapid heat recovery, pointing out to a possible reservoir zone. Temperatures below these zones stabilized at a negative gradient of approximately -0.7°C/100m, identifying these areas as unsuitable for production.
Short Term Flow Test No.1Following Water Flow Test No.1, in-hole 2 7/8” tubings were
installed the well was stimulated to flow with air lifting on 17th September 2010. The well was flow tested at 3 different produc-tion rates by opening the valve 100%, 75% and 50%. Maximum wellhead temperature was measured as 137.1°C, and pressure (WHP) was measured as 3.2 bar.
PerforationPerforation was perforated on 6th October 2010, at 5 intervals
each having a length of 6 meters. Before the perforation, cold water was injected into the well for a period of 2 days, in order to cool the well to within logging-probe operating conditions (95°C max.). CCL logs were taken during the initial test run, which was then calibrated by correlating to existing CBL/CCL logs, in order to ensure depth accuracy of the operation. The operation was realized by using jet perforating guns equipped with 40 nos. shaped explosive charges (bullets) oriented at 120 degree angles, placed within 6 meters. A total of 11 runs were performed for perforating 5 sections. Perforation was successfully completed in the 1028 m ‐ 1034 m, 1046 m ‐ 1052 m, 1063 m ‐ 1069 m, 1076 m ‐ 1082 m , 1125 m ‐ 1131 m intervals.
Short Term Flow Test No.2Following perforation, in-hole 2 7/8” tubings were installed the
well was stimulated to flow with air lifting on 08.10.2010. After 2 days of flow, maximum wellhead temperature was measured as 129.5°C, and pressure (WHP) was measured as 4.2 bar. During first and second day of the free flow, flow line temperature as measured as 133.2 °C and 135,6 respectively. Maximum flow rate was 126 ton/hr, up from a previous value of 115 ton/hr.
Water Loss Test no.2Water Loss Test no.2 was initiated on 15th October 2010. A
static PT log down to 2038m depth was taken at the start of the operation. Next, 160 tons (approximately 2 times the well bore bulk volume) of water at 37.1°C temperature was injected to the well with a constant injection rate of 60 lt/sec. 3 consecutive PT logging runs were performed (down to 1873m depth max) during the initiation, 6th, 23rd hours of the temperature buildup. The test was completed owing to adequate temperature recovery during the last measurement.
AcidizingThe perforated section was the main target for the acidizing
operation, which was also the highest open segment within the wellbore. As a result, the acidizing operation in GK-3 was performed directly from the wellhead, where it was assumed most of the acidizing fluid would inject through the perforated sections into the formation at those levels. At the beginning of the operation, in-hole 2 7/8” tubings were installed the well in order to allow stimulation for the clean-up flow. An acid mixture was prepared by mixing 123 bbl HCl acid at 30% concentration, 40 bbl water and 3.7 bbl corrosion inhibitor. The homogeneous acid mixture was injected to the well through the tubing, at an injection rate of 3 bbl/min. The acid mixture was allowed to soak for 2 hours, prior to preparations for cleaning flow.
Cleaning Flow (Flow Test No.3)Following acidizing, the well was stimulated to flow with air
lifting on 27.10.2010. Maximum wellhead temperature measured during the tests was measured as 145.9°C, and pressure (WHP) as 5.5 bar. Maximum flow rate was 151 ton/hr, up from a previous value of 126 ton/hr.
A dynamic PTS survey was taken on 30.10.2010, where maximum wellbore temperature was recorded as 165ºC. The well
1259
Kuyumcu, et al.
was closed on 31.10.2010, where WHP after close up was recorded as 8.75 bar, up from a previous value of 7,8 bar.
Water Loss Test no.3Water Loss Test no.3 was initiated on 08.11.2010. 160 tons
(approximately 2 times the well bore bulk volume) of water at 21°C temperature was injected to the well with a constant injection rate of 80 lt/sec. 3 consecutive PT logging runs were performed (down to 1954m depth max) during the initiation, 6th, 18th hours of the temperature buildup. The test was completed owing to adequate temperature recovery during the last measurement.
8. Results
A comparison of three consecutive flow tests reveals the following:
• Flow test no.1 (initial state): 115 tons/hour total flow rate at 137.1°C. 7.8 bar static WHP, 3.2 bar WHP
• Flow test no.2 (post-perforation): 126 tons/hour total flow rate at 129.5 °C. 7,1 bar static WHP, 4.2 bar WHP
• Flow test no.3 (post-acidizing): 151 tons/hour total flow rate at 145.9°C. 8.75 bar static WHP, 5.5 bar WHP
A total increase of 36 ton/hr was gained in the total flow rate of the well as a result of the described operations. Meanwhile, well-head temperature during flow also increased 5.3 °C from 136,7°C to 142°C.
Results from Water Loss Test No.2 and No.3 fail to capture the inflow from the perforated section into the well. This may be explained by the thermal conductivity of the casing still remaining in the perfo-rated sections, which may be masking the temperature drop in the formation at those levels. However, decrease in the total flow rate during Flow Rate No.2 agrees with Water Loss Test No.2 in demonstrating that the perforated sections in the wellbore were initially closed to flow, prior to acidizing. This may be attributable to two things, (a) possible deformations owing to perforation blasting and (b) clogging owing to breakups from the poor (partial) cement behind the casing, as seen in CBL logs.
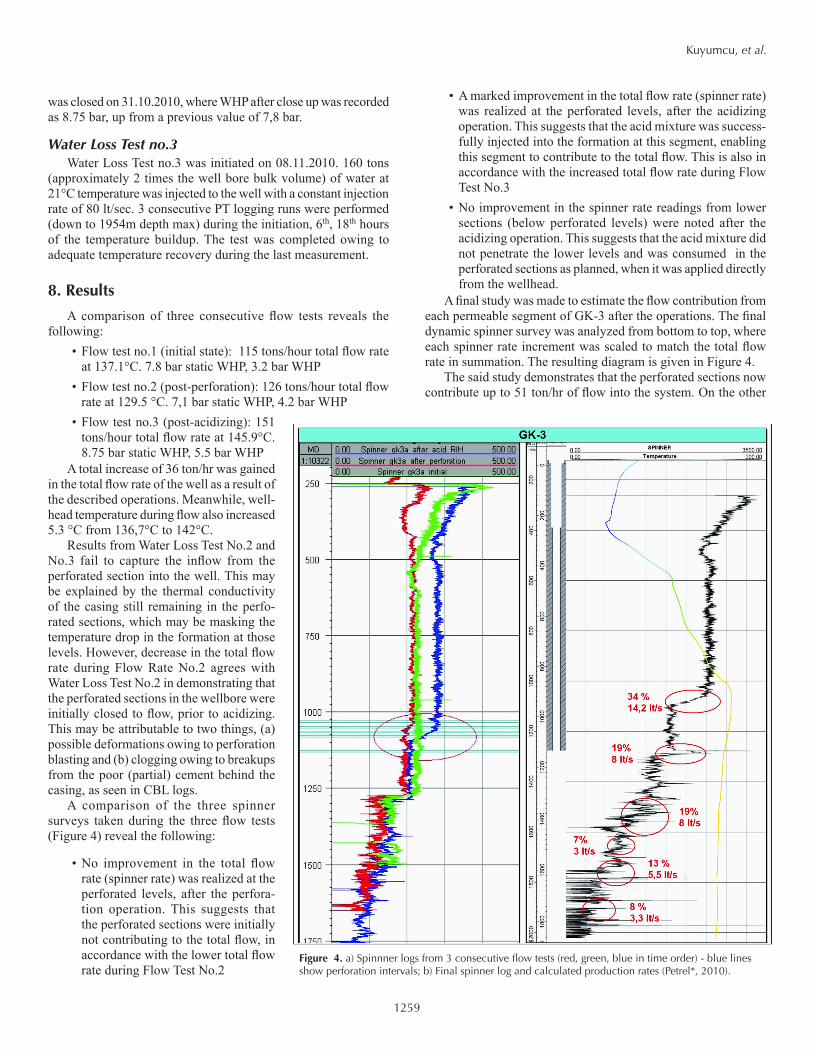
A comparison of the three spinner surveys taken during the three flow tests (Figure 4) reveal the following:
• No improvement in the total flow rate (spinner rate) was realized at the perforated levels, after the perfora-tion operation. This suggests that the perforated sections were initially not contributing to the total flow, in accordance with the lower total flow rate during Flow Test No.2
• A marked improvement in the total flow rate (spinner rate) was realized at the perforated levels, after the acidizing operation. This suggests that the acid mixture was success-fully injected into the formation at this segment, enabling this segment to contribute to the total flow. This is also in accordance with the increased total flow rate during Flow Test No.3
• No improvement in the spinner rate readings from lower sections (below perforated levels) were noted after the acidizing operation. This suggests that the acid mixture did not penetrate the lower levels and was consumed in the perforated sections as planned, when it was applied directly from the wellhead.
A final study was made to estimate the flow contribution from each permeable segment of GK-3 after the operations. The final dynamic spinner survey was analyzed from bottom to top, where each spinner rate increment was scaled to match the total flow rate in summation. The resulting diagram is given in Figure 4.
The said study demonstrates that the perforated sections now contribute up to 51 ton/hr of flow into the system. On the other
Figure 4. a) Spinnner logs from 3 consecutive flow tests (red, green, blue in time order) - blue lines show perforation intervals; b) Final spinner log and calculated production rates (Petrel*, 2010).

1260
Kuyumcu, et al.
hand, it may be argued that this contribution is partially balanced by a loss of flow from lower sections owing to the back pressure caused by this contribution, thus yielding a combined increase of only 36 tons/hr.
9. Conclusions and Recommendations
GK-3 was a partially successful well, where expected portions of the main reservoir could not be penetrated, while a secondary (upper) reservoir was cemented behind 9-5/8” casing and by-passed. The following production improvements were achieved at the end of a successful perforation and acidizing operation:
• 31.3% increase in total flow rate, from 115 to 151 tons/hr, • Slight increase in flowline temperature from 136.7°C to
142°C,• 38,2% increase in enthalpy from 7.6x10³ kcal/h to 10.5x10³
kcal/h, based on 70°C exit temperature assumption. This shows that perforation and acidizing operation is a
successful combination for adding geothermal production and/or enthalpy from encased (suitable) formation zones. The same methodology can be used for improving injectivity values of wells, if zones that are suited to that purpose may be found behind the casing. As already noted from other applications, it was once again observed that acidizing directly from the wellhead is sufficient to penetrate uppermost permeable zones, where the application has minimal effect on lower sections. This eliminates the need for costlier workover rigs and packers for these applications. It was also observed that Water Loss Testing has significant limitations for pre or post assessment of perforated sections, owing to the masking effect of the remaining thermally conductive casing. On the other hand, consecutive spinner logging and careful analysis of combined PTS data was found to be a very capable method of assessing flow contributions from different formation levels.
10. ReferencesCandan, O., Ö. Dora, R. Oberhänsli, M. Çetinkaplan, J. Partzsch, F. Warkus,
and S. Dürr, 2001. “Pan-African High-Pressure Metamorphism in the
Precambrian Basement of the Menderes Massif, Western Anatolia, Tur-key.” Int. Journal of Earth Sciences, v 89, p. 793–811.
Gessner, K., U. Ring, C. Passchier, and T. Güngör, 2001. “How to Resist Subduction: Evidence for Large-Scale Out-of-Sequence Thrusting Dur-ing Eocene Collision in Western Turkey.” J. of Geo. Soc. of London, v 158, p. 769 –784.
Halliburton, Perforating Solutions. http://www.halliburton.com/public/lp/contents/Books_and_Catalogs
Hetzel, R., C.W. Passchier, U. Ring, Ö.Dora, 1995a. “Bivergent extension in orogenic belts: the Menderes Massif (southwestern Turkey).” Geology v 23, p. 455-458.
Koçyiğit, A., 2009. “Active Tectonics of Söke-Argavlı and Gümüşköy Area.” BM Engineering and Construction Inc., BM Engineering and Construc-tion Inc., Internal report p. 1-26.
Kuyumcu, Ö. Ç., U. Destegül, and A.Ü. Akman, 2010. “Exploration and Discovery of the Gümüşköy Geothermal Reservoir in Aydın, Turkey.” GRC Transactions, v. 34, p. 575–580.
Petrel*, 2010. “Schlumberger Information Solution.” Petrel Software Online Help. http://www.slb.com/services/software/geo/petrel.aspx
Ring, U., K. Gessner, T. Güngör, and C. W. Passchier, 1999. “The Menderes Massif of Western Turkey and the Cycladic Massif in the Aegean–Do They Really Correlate?” Journal of the Geological Society of London, v 156, p. 3–6.
Ring U., C. Johnson, R. Hetzel, K. Gessner, 2003. “Tectonic Denudation of a Late Cretaceous–Tertiary Collusional Belt: Regionally Symmetric Cool-ing Patterns and Their Relation to Extensional Faults in the Anatolide Belt of Western Turkey.” Geol. Mag., No. 140 (4), p. 421–441.
Rimmelé, G., T. Parra, B. Goffé, R. Oberhänsli, L. Jolivet, and O. Candan, 2004. “Exhumation Paths of High-Pressure-Low-Temperature Me-tamorphic Rocks from the Lycian Nappes and the Menderes Massif (SW Turkey): a Multi-Equilibrium Approach.” Journal of Petrology, p. 1–29.
Sengör, A.M.C., M. Satir, and R. Akkök, 1984. “Timing of the Tectonic Events in the Menderes Massif, Western Turkey: Implications for Tectonic Evolution and Evidence for Pan-African Basement in Turkey.” Tectonics no. 3, p. 693–707.
Tüysüz, O., Ş.C. Genç, 2010. “Geology of the Söke-Ortaklar-Selçuk Area.” BM Engineering and Construction Inc., Internal Report p. 1-39.
T. Qayyum, K. Khattak, I. Qureshi, T. Aizad, 2009. “Successful Introduction of Next Generation-Reactive Perforating Technology in Pakistan.” SPE/ IADC 125901.