notice of meeting vancouver board of education ... graves, vesta nick milum & duva karunakaran,...
TRANSCRIPT
NOTICE OF MEETING Committee III/V: Penny Noble Janet Fraser Allan Wong Joy Alexander Patti Bacchus Fraser Ballantyne Mike Lombardi Christopher Richardson Stacy Robertson
Vancouver Board of Education Secretary-Treasurer's Office
April 17, 2015
Scott Robinson, Superintendent of Schools Notice of Meeting
A Meeting of the Plenary/Education and Student Services Committee and Finance & Legal Committee (Joint Committee III/V) will be held in Boardroom, VSB Education Centre, 1580 West Broadway, Vancouver, British Columbia, on
Tuesday, April 21, 2015 at 5:00 pm Yours truly,
Rick Krowchuk Secretary-Treasurer
Student Trustee: Jing Wang
Senior
Maureen Ciarniello
Brian Kuhn
David Nelson
Ian Wind Staff:
Catherine Jamieson
Lisa Landry
Rob Schindel Denise Johnson
Jim Meschino
Janet Stewart
Others: Secretary-Treasurer's Office Maisie Louie, Learning Services Kurt Heinrich Chris Allen Lynda Bonvillain
Alt: Trish Mugford, VSTA Heather Allison, VESTA
Ron Bergeron, PASA Mabel Sun, DPAC Lois Holmlund, CUPE 15
Ken Chohanik, Trades
Debbie Pawluk, VSTA Greg Canning, VESTA
Alex Dow, DPAC Maureen Cowin, PASA
Tim Chester, IUOE Sung Wong, CUPE National Jessica Land, PASA Melanie Antweiler, DPAC
District Parents Ed Centre Building Engineer Rentals Cafeteria B. Ostrom, Operations
Comm III Reps Sylvia Metzner, VSTA Jody Polukoshko, VESTA Doug Matear, VASSA Hugh Blackman, VEPVPA Cathy Hasley, PASA Farah Shroff, DPAC Joey Lau, CUPE Loc 15 c/o Tim DeVivo, IUOE John Pesa, Trades Brent Boyd, CUPE 407 Sally Lin, VDSC
Comm V Reps Terry Stanway, VSTA Janek Kuchmistrz, VESTA Irfan Sheikh, VASSA Connie Carver, VEPVPA Harjit Khangura, IUOE Iraj Khabazian, DPAC Sherry Kallergis, PASA Leanne Toderian, CUPE 15 Charleen Ann Derzak, CUPE 407 Vince Bararac, VDSC
Other Reps: Ellen Roberts, VASSA Marion Broadbent, VEPVPA Dan Graves, VESTA Nick Milum & Duva Karunakaran, VDSC
0 VANCOUVER BOARD OF EDUCATION
COMMITTEE MEETING PLENARY COMMITTEE III/V — FINANCE & LEGAL
EDUCATION & STUDENT SERVICES
Tuesday, April 2L 2015 at 5:00 pm Boardroom, VSB Education Centre
AGENDA
A. Reports for Trustee Information
1. 2015 / 2016 Revised Operating Budget Proposals (Material will be distributed at the meeting)
B. New Business
C. Date and Time of Next Meeting
At the call of the Chair
I 0 ooae
pi Memorandum 2
vik vancouver school board
n t e
e ITEM 1
April 21, 2015
To: Plenary Education and Student Services and Finance and Legal Committee (Committee IIIN)
From: Senior Management Team
Subject: 2015/2016 Revised Preliminary Budget Proposals
On March 31, 2015, the 2015/2016 Preliminary Budget Proposals were presented to the Plenary Education and Student Services and Finance and Legal Committee (Committee IIIN). The funding shortfall for 2015/2016 was projected to be $8.52 million. In order to achieve a balanced budget for 2015/2016, the Preliminary Budget Proposals included proposed expenditure reductions and revenue increases of $9.12 million, together with $0.60 million in potential budget additions.
Consultation was undertaken with respect to the Preliminary Budget Proposals at the following meetings:
• April 13, 2015 — Stakeholder Consultation • April 14, 2014 — Public Consultation through the Committee-of-the-Whole
In total, 30 speakers provided comments on the Preliminary Budget Proposals. In addition, written submissions were received and forwarded to Trustees.
Proposed Revisions to the Preliminary Budget Proposals
Subsequent to the presentation of the preliminary budget proposals on March 31, 2015, the following additional information has been received:
• The preliminary budget proposal C2 — Leasing of Surplus Space included potentially leasing Education Centre space for $50,000 for the Vancouver Seismic Project Office. It has now been determined that the Project Office will be located in Downtown Vancouver and not at the Education Centre.
• Further work on the Band & Strings budget proposal indicates that the reduction in FTE of 3.8 needs to be revised to 3.0 FTE. This has the impact of reducing the budget proposal from $420,000 down to $340,000.
Given the above noted changes in these two budget proposals for 2015/2016, a change has been made to the projected amount of holdback budgeted to be received in 2015/2016, from $0.75 million to $0.88 million.
1

In addition to the changes proposed above, as a result of feedback from the stakeholder and public consultation sessions on April 13 and 14, revisions have been proposed related to the Adult Education budget proposal (D3). Instead of closing the Kiwassa Youth Program, the South Hill Youth Program will be discontinued. Self-paced programs will continue at the Main Street and South Hill Centres on alternate days, as well as every day at Gathering Place. The overall budget impact for Adult Education will be the same as outlined in the preliminary budget proposals. In summary, the changes in this revised budget, compared to the preliminary budget proposals, are as follows:
Revised Budget Proposal Changes ($ millions)
C1 Holdback
0.13 C2 Lease of Underutilized Space (0.05) D1 Band & Strings (0.08) D3 Adult Education
A further Committee of the Whole will be held on Monday, April 27, 2015 to receive comments on the Revised Budget Proposals.
This item is provided for information.
2
VANCOUVER BOARD OF EDUCATION
2015/2016
REVISED PRELIMINARY BUDGET PROPOSALS
Senior Management Team
April 21, 2015

P a g e | I I
2015/2016
Revised Preliminary Budget Proposals
1.0 Base Budget Projections ............................................................................................................................... 1
1.1 Summary of Projected Funding Shortfall .................................................................................................. 1
1.2 Local Capital Reserve ................................................................................................................................ 4
1.3 2016/2017 Preliminary Financial Projection ............................................................................................ 4
2.0 Summary of Revised Preliminary Budget Proposals ..................................................................................... 7
Attachment A: Revised Preliminary Budget Proposals ....................................................................................... 9
P a g e | 1
1.0 Base Budget Projections The Base Budget projections reflect the estimated costs for 2015/2016 to maintain the same level of service as provided in 2014/2015. It is developed based on the 2014/2015 Amended Annual Budget adjusted for projected changes for enrolment, enrolment driven revenue and staffing changes, estimated salary and employee benefit increases, inflation and other factors for 2015/2016.
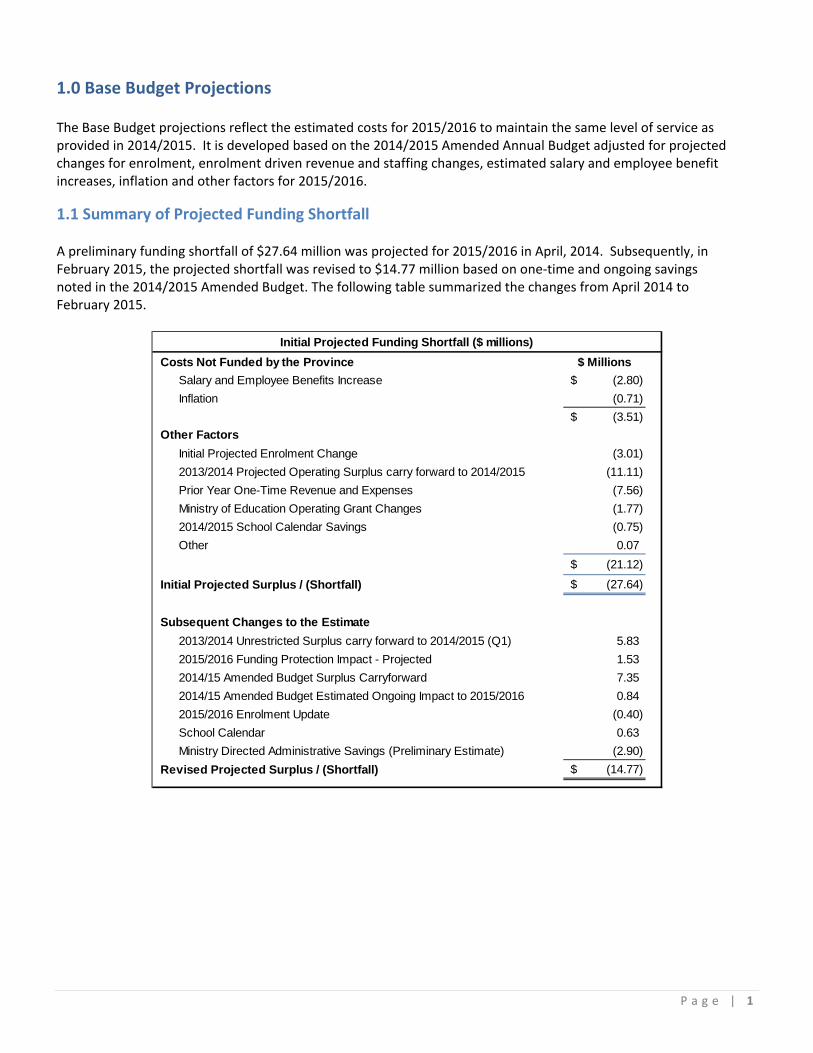
1.1 Summary of Projected Funding Shortfall A preliminary funding shortfall of $27.64 million was projected for 2015/2016 in April, 2014. Subsequently, in February 2015, the projected shortfall was revised to $14.77 million based on one‐time and ongoing savings noted in the 2014/2015 Amended Budget. The following table summarized the changes from April 2014 to February 2015.
Costs Not Funded by the Province $ Millions
Salary and Employee Benefits Increase (2.80)$
Inflation (0.71)
(3.51)$
Other Factors
Initial Projected Enrolment Change (3.01)
2013/2014 Projected Operating Surplus carry forward to 2014/2015 (11.11)
Prior Year One-Time Revenue and Expenses (7.56)
Ministry of Education Operating Grant Changes (1.77)
2014/2015 School Calendar Savings (0.75)
Other 0.07
(21.12)$
Initial Projected Surplus / (Shortfall) (27.64)$
Subsequent Changes to the Estimate
2013/2014 Unrestricted Surplus carry forward to 2014/2015 (Q1) 5.83
2015/2016 Funding Protection Impact - Projected 1.53
2014/15 Amended Budget Surplus Carryforward 7.35
2014/15 Amended Budget Estimated Ongoing Impact to 2015/2016 0.84
2015/2016 Enrolment Update (0.40)
School Calendar 0.63
Ministry Directed Administrative Savings (Preliminary Estimate) (2.90)
Revised Projected Surplus / (Shortfall) (14.77)$
Initial Projected Funding Shortfall ($ millions)

P a g e | 2
Based on an updated projection the shortfall is currently estimated to be $8.52 million. The following table outlines the components of the shortfall and the changes from the February, 2015 projection. The major changes include the following:
A reduction in the employee benefits increase is due to projections provided by our benefits provider indicating lower claims;
Enrolment change due to updated enrolment estimates including reduction in administrative time;
Further refinement of estimates on employee benefits;
Ministry operating grant increase due to increase in the funding per student rate to fund the settlement of the collective agreements.

P a g e | 3
2015/2016 Projected Operating Budget Shortfall
($ millions)
February
2015
Revised
ProjectionChange
Costs Not Funded by the Province
Salary Increments 1) (1.23)$ (1.25)$ (0.02)$
Employee Benefits Increase 2) (1.57) (0.87) 0.70
Inflation 3) (0.71) (0.68) 0.03
(3.51)$ (2.80)$ 0.71$
Enrolment Change 4) (4.19)$ (3.33)$ 0.87$
Other Factors
2014/2015 Projected Operating Surplus Carry forward to 2015/2016 5) 7.35$ 7.70$ 0.35$
Prior Year One‐Time Revenue and Expenses 6) (18.61) (18.77) (0.16)
Prior Year Ongoing Revenue and Expenses 7) 0.84 3.40 2.56
Ministry of Education Operating Grant Changes 8) 0.55 1.79 1.24
Use of 2013/2014 Unrestricted Surplus 9) 5.83 5.83 0.00
2015/2016 Ministry Directed Administrative Savings 10) (2.90) (2.68) 0.22
Ministry Provided Shared Services Savings 11) ‐ 0.37 0.37
Other 12) (0.13) (0.05) 0.08
(7.07)$ (2.40)$ 4.67$
Total Projected Surplus / (Shortfall) (14.77)$ (8.52)$ 6.25$
1)
2)
3)
4)
5)
6)
7)
8)
9)
10)
11)
12)
Includes cost increases for salary increments (for teachers, administrators and exempt staff) partially offset by
teacher turnover savings.
Includes increase to Medical Services Plan (MSP) of 4.18% and to Worksafe BC of 8.9%, offset by savings in Dental
and Group Life premiums based on average of actual claims paid across all policies.
Based on 2.0% inflation per year for supplies and generally higher rates of increase for utilities and other items
under contract.
Projected enrolment decline as of February 2015 of 419 FTE compared to the 2014/2015.
Board approved carry forward of projected surplus from 2014/2015 Amended Annual Budget to 2015/2016.
Net cost of change in School Calendar for 2015/2016 ($0.13 million) and additional costs for the Mandarin Bilingual
Program ($0.02 million).
One‐time savings included in the 2014/2015 Final Budget that will not repeat for 2015/2016: 2013/2014 projected
surplus carried forward ($11.11 million) and 2013/2014 April holdback release ($0.59 million), Board approved
transfer from Local Capital Reserve ($2.48 million), budgeted distribution of holdback funding from the Ministry of
Education ($1.50 million), elimination of Inflation on Services & Supplies ($0.45 million), delay of furniture and
equipment replacement ($0.38 million) and consolidated purchasing ($0.10 million).
Ongoing 2014/2015 projected savings in: Employee benefits ($2.71 million), average teacher's salaries ($1.33
million), average P/VP salaries ($0.33 million), student transportation ($0.16 million), special education assistants
($0.41 million), carbon tax refund revenue ($0.48 million), offset by increased costs for HCM/Peoplesoft licensing
($1.29 million), and a projected increase in heating costs ($0.29 million).
Increased funding due to a projected increase in Funding Protection of $2.93 million and $1.02 million increase in
the per student rate to fund the settlement of the collective agreements offset by the loss of Provincial Holdback of
$2.38 million.
Board approved carryforward of 2013/2014 unrestricted surplus.
Expected savings in 2015/2016 of administrative costs as directed by the Ministry of Education.
2014/2015 Ministry Attendance Support and Wellness Grant ($0.32 million) and 2015/2016 one‐time savings from
estimated Ministry shared legal sevices ($0.05 million).
P a g e | 4
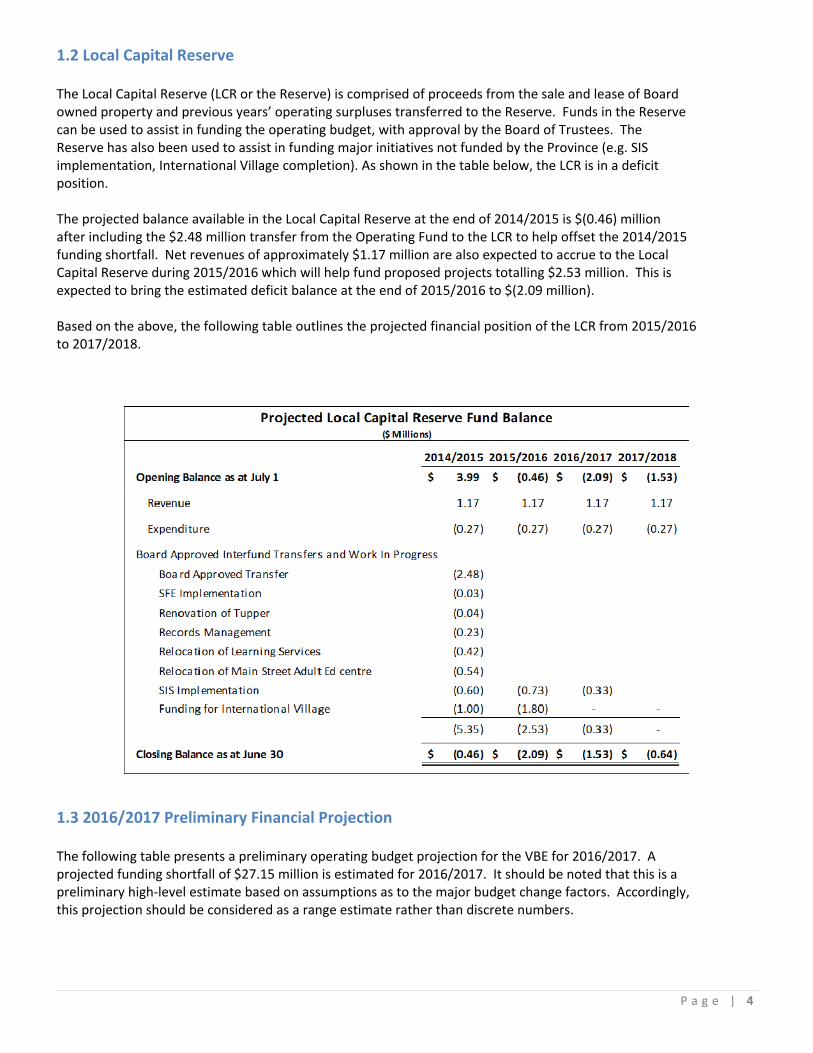
1.2 Local Capital Reserve The Local Capital Reserve (LCR or the Reserve) is comprised of proceeds from the sale and lease of Board owned property and previous years’ operating surpluses transferred to the Reserve. Funds in the Reserve can be used to assist in funding the operating budget, with approval by the Board of Trustees. The Reserve has also been used to assist in funding major initiatives not funded by the Province (e.g. SIS implementation, International Village completion). As shown in the table below, the LCR is in a deficit position. The projected balance available in the Local Capital Reserve at the end of 2014/2015 is $(0.46) million after including the $2.48 million transfer from the Operating Fund to the LCR to help offset the 2014/2015 funding shortfall. Net revenues of approximately $1.17 million are also expected to accrue to the Local Capital Reserve during 2015/2016 which will help fund proposed projects totalling $2.53 million. This is expected to bring the estimated deficit balance at the end of 2015/2016 to $(2.09 million). Based on the above, the following table outlines the projected financial position of the LCR from 2015/2016 to 2017/2018.
1.3 2016/2017 Preliminary Financial Projection The following table presents a preliminary operating budget projection for the VBE for 2016/2017. A projected funding shortfall of $27.15 million is estimated for 2016/2017. It should be noted that this is a preliminary high‐level estimate based on assumptions as to the major budget change factors. Accordingly, this projection should be considered as a range estimate rather than discrete numbers.

P a g e | 5
The estimates for 2015/2016 and 2016/2017 are based on the following key assumptions:
- estimated changes in general student enrolment based on a decline of 183 FTE for 2016/2017;
- there will be continued cost increases for employee benefit costs, utilities and goods and services;
- no net cost increase for future labour settlements (assumes no increases or that they are fully funded by the Province);
- approval by the Board of one‐time budget proposals for 2015/2016 totalling $5.82 million. These will result in savings for 2015/2016, but at the same time increase the funding shortfall for 2016/2017.

P a g e | 6
2015/2016 2016/2017
Costs Not Funded by the Province
Salary Increments 1) (1.25)$ (1.23)$
Employee Benefits Increase 2) (0.87) (0.85)
Inflation 3) (0.68) (0.77)
(2.80)$ (2.85)$
Enrolment Change 4) (3.33)$ (0.94)$
Other Factors
2014/2015 Projected Operating Surplus Carry forward to 2015/2016 5 7.70$ (7.70)$
Prior Year One‐Time Revenue and Expenses 6) (18.77)
Prior Year Ongoing Revenue and Expenses 7) 3.40
Ministry of Education Operating Grant Changes 8) 1.79 (0.65)
Use of 2013/2014 Unrestricted Surplus 9) 5.83 (5.83)
2015/2016 Ministry Directed Administrative Savings 10) (2.68) (2.31)
2014/2015 Ministry Attendance Support and Wellness Grant 11) 0.37 (0.37)
Other 12) (0.05) (0.68)
(2.40)$ (17.54)$
Total Projected Surplus / (Shortfall) (8.52)$ (21.33)$
Reversal of 2015/2016 One‐Time Proposals (5.82)
Revised Shortfall (8.52) (27.15)
1)
2)
3)
4)
5)
6)
7)
8)
9)
10)
11)
12)
Increased funding due to a projected increase in Funding Protection of $2.93 million and $1.02 million
higher than anticipated funding for collective agreement increases offset by the loss of Provincial
Holdback of $2.38 million.
Board approved carryforward of 2013/2014 unrestricted surplus.
2014/2015 Ministry Attendance Support and Wellness Grant ($0.32 million) and 2015/2016 one‐time
savings from estimated Ministry shared legal sevices ($0.05 million).
Net cost of change in School Calendar for 2015/2016 ($0.13 million) and additional costs for the
Mandarin Bilingual Program ($0.02 million).
One‐time 2014/2015 funding to carryforward to 2015/2016.
Projected enrolment decline as of February 2015 of 419 FTE compared to 2014/2015 and a further
projected decrease of 183 FTE for 2016/2017.
2016/2017 Preliminary Operating Budget Projection
($ millions)
Includes cost increases for salary increments (for teachers, administrators and exempt staff) partially offset
by teacher turnover savings.
Includes increase to Medical Services Plan (MSP) of 4.18% and to Worksafe BC of 8.9%, offset by savings
in Dental and Group Life premiums based on average of actual claims paid across all policies.
Based on 2.0% inflation per year for supplies and generally higher rates of increase for utilities and other
items under contract.
Board approved carry forward of projected surplus from 2014/2015 Amended Annual Budget to
2015/2016.
One‐time savings included in the 2014/2015 Final Budget that will not repeat for 2015/2016:
2013/2014 projected surplus carried forward ($11.11 million) and 2013/2014 April holdback release
($0.59 million), Board approved transfer from Local Capital Reserve ($2.48 million), budgeted
distribution of holdback funding from the Ministry of Education ($1.50 million), elimination of Inflation
on Services & Supplies ($0.45 million), delay of furniture and equipment replacement ($0.38 million) and
consolidated purchasing ($0.10 million).
Ongoing 2014/2015 projected savings in: Employee benefits ($2.71 million), average teacher's salaries
($1.33 million), average P/VP salaries ($0.33 million), student transportation ($0.16 million), special
education assistants ($0.41 million), carbon tax refund revenue ($0.48 million), offset by increased costs
for HCM/Peoplesoft licensing ($1.29 million), and a projected increase in heating costs ($0.29 million).

P a g e | 7
2.0 Summary of Revised Preliminary Budget Proposals
A revised operating budget shortfall of $8.52 million is projected for 2015/2016. The following table provides a summary of the revised preliminary proposals to achieve a balanced budget for 2015/2016 and to fund a limited number of budget additions. Attachment A provides detail with respect to the revised preliminary operating budget proposals for 2015/2016.
Budget Proposals Summary
Original Revised
Updated Base Budget Funding Shortfall (8.52) (8.52)$
Budget Proposals
Administrative 3.50$ 3.50$
Facilities 0.54 0.54
Revenue Generating/Funding 0.90 0.98
Educational 2.23 2.15
Other 1.95 1.95
Additions (0.60) (0.60)
8.52$ 8.52$
Revised Projected Surplus/(Shortfall) ‐$ ‐$

P a g e | 8
Attachment A
Revised Preliminary Budget Proposals

P a g e | 9
Attachment A: Revised Preliminary Budget Proposals A revised operating shortfall of $8.52 million is projected for 2015/2016. The following revised proposals are presented in order to achieve a balanced operating budget for 2015/2016 and to fund a limited number of budget additions.
Original Revised
Budget Items FTE $ millions FTE $ millions
A Admininistrative
1 Sale & Leaseback 2.93 2.93
2 Furniture & Equipment 0.38 0.38
3 Print Management 0.20 0.20
B Facilities
1 Maintenance Service Reductions 5.00 0.50 5.00 0.50
2 Classroom Closure 0.80 0.04 0.80 0.04
C Revenue Generating/Funding
1 Holdback 0.75 0.88
2 Lease of Underutilized Space 0.15 0.10
D Educational
1 Band & Strings 3.80 0.42 3.00 0.34
2 International Education (4.60) 0.23 (4.60) 0.23
3 Adult Education 26.32 0.53 26.32 0.53
4 K‐12 Teaching Allocation 10.73 1.05 10.73 1.05
E Other
1 Benefits Surplus 1.95 1.95
Total Proposed Reducitons 42.05 9.12 41.25 9.12
F Potential Budget Additions
1 Digital Support Project (0.10) (0.10)
2 Learning & Technology Infrastructure Requirements (0.38) (0.38)
3 Educational Psychologist (1.00) (0.08) (1.00) (0.08)
4 Learning Technologies Mentor (0.40) (0.04) (0.40) (0.04)
Total Proposed Additional Expenditures (1.40) (0.60) (1.40) (0.60)
Total Budget Proposals 40.65 8.52 39.85 8.52
2015/2016 Revised Preliminary Budget Proposals

P a g e | 1 0
Preliminary Budget Proposal /
P a g e | 1 1
A1 – Sale and Leaseback
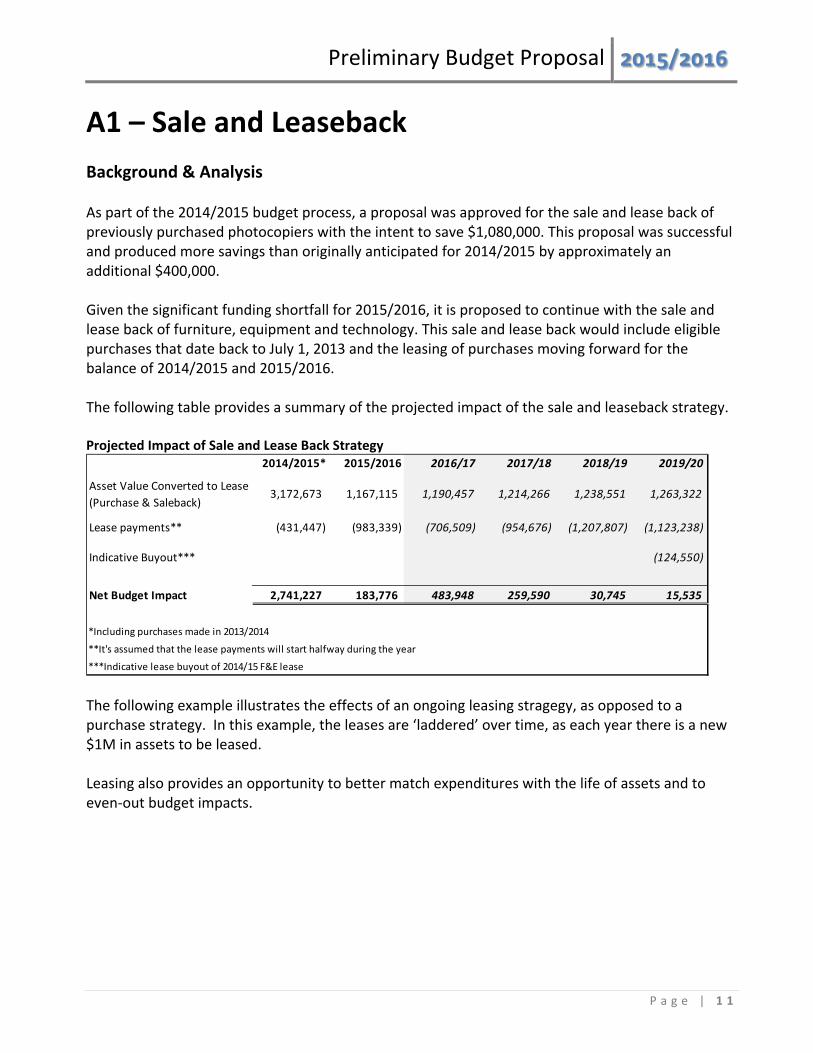
Background & Analysis As part of the 2014/2015 budget process, a proposal was approved for the sale and lease back of previously purchased photocopiers with the intent to save $1,080,000. This proposal was successful and produced more savings than originally anticipated for 2014/2015 by approximately an additional $400,000. Given the significant funding shortfall for 2015/2016, it is proposed to continue with the sale and lease back of furniture, equipment and technology. This sale and lease back would include eligible purchases that date back to July 1, 2013 and the leasing of purchases moving forward for the balance of 2014/2015 and 2015/2016. The following table provides a summary of the projected impact of the sale and leaseback strategy. Projected Impact of Sale and Lease Back Strategy
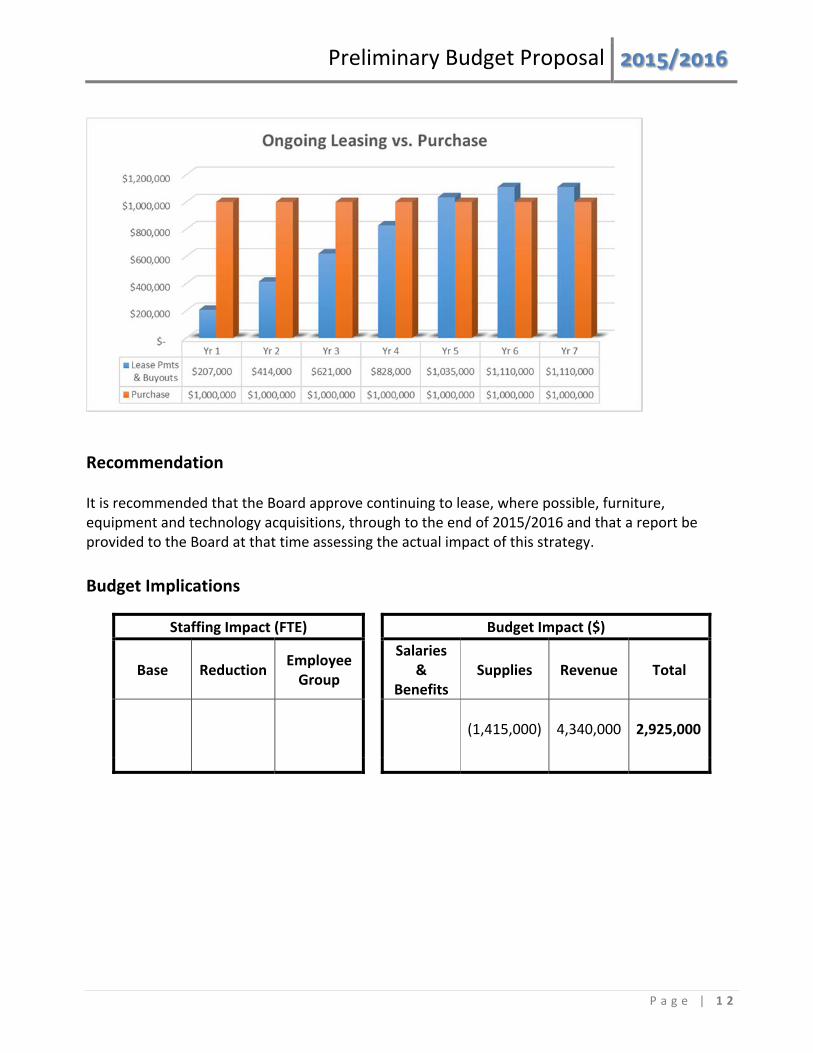
The following example illustrates the effects of an ongoing leasing stragegy, as opposed to a purchase strategy. In this example, the leases are ‘laddered’ over time, as each year there is a new $1M in assets to be leased. Leasing also provides an opportunity to better match expenditures with the life of assets and to even‐out budget impacts.
2014/2015* 2015/2016 2016/17 2017/18 2018/19 2019/20
Asset Value Converted to Lease
(Purchase & Saleback)3,172,673 1,167,115 1,190,457 1,214,266 1,238,551 1,263,322
Lease payments** (431,447) (983,339) (706,509) (954,676) (1,207,807) (1,123,238)
Indicative Buyout*** (124,550)
Net Budget Impact 2,741,227 183,776 483,948 259,590 30,745 15,535
*Including purchases made in 2013/2014
**It's assumed that the lease payments will start halfway during the year
***Indicative lease buyout of 2014/15 F&E lease
Preliminary Budget Proposal /
P a g e | 1 2
Recommendation It is recommended that the Board approve continuing to lease, where possible, furniture, equipment and technology acquisitions, through to the end of 2015/2016 and that a report be provided to the Board at that time assessing the actual impact of this strategy.
Budget Implications
Staffing Impact (FTE) Budget Impact ($)
Base Reduction Employee Group
Salaries
& Benefits
Supplies Revenue Total
(1,415,000)
4,340,000
2,925,000

Preliminary Budget Proposal /
P a g e | 1 3
A2 – Furniture and Equipment
Background & Analysis The Purchasing and Administrative Services Department maintains a central budget to support the purchase of major furniture and equipment in schools, at the Education Centre and at other district sites. The budget has been approximately $1,100,000, however as a part of the 2014/2015 budget process, a one‐time reduction of $375,000 was made resulting in the net 2014/2015 budget of $725,000. Based on the past three years of actual expenditure history, expenditures average $884,087 per year.
BUDGET YEAR EXPENDITURES
2013/14 $852,931
2012/13 $843,575
2011/12 $998,435
AVERAGE $884,087
Purchasing and Administrative Services department manages this budget by ensuring requests fit the following criteria and prioritize requests dependent on need.
The replacement of essential furniture and equipment that are; o Unsafe or potentially hazardous, o beyond economical repair, o obsolete, and o incorrectly sized student furniture.
The provision of essential classroom furniture and equipment for schools with increased enrolment.
Recommendation Given the projected funding shortfall for 2015/2016, it is recommended that the one‐time budget reduction ($375,000) made as part of the 2014/2015 budget be continued for 2015/2016. As the budgets were not fully spent in previous years, it is anticipated that the district could manage based on an annual budget of $725,000 for furniture and equipment. It should be noted however, that as the proposed budget of $725,000 is lower than the $884,087 average spent in the recent three fiscal years, there will be a need to carefully prioritize the purchase of furniture and equipment next year. It should also be noted that each school also receives funding through the “Flex Budget” for the purchase of minor furniture and equipment. For 2014/2015, this amount totals $545,000. This proposal does not impact the “Flex Budget” currently received by schools.

Preliminary Budget Proposal /
P a g e | 1 4
Budget Implications
Staffing Impact (FTE) Budget Impact ($)
Base Reduction Employee Group
Salaries
& Benefits
Supplies Revenue Total
375,000
375,000

Preliminary Budget Proposal /
P a g e | 1 5
A3 – Print Management Strategy
Background & Analysis The VSB currently has a copier fleet of 370 devices. The fleet consists of; 356 devices with multi‐function capabilities and 14 with single copy function only. In 2014, the total copy and print images made on these devices was 72,000,000. In addition to the copier fleet and based on 2013 audit numbers, the district has just over 3,000 single function devices including inkjet, laser printers, and fax that provide an estimated 14,800,000 images. The annual operating cost including cost per copy, paper and electricity for copiers and single function devices is estimated at $1.6 million. In 2011, the VSB awarded a contract to Canon Canada following a formal Request For Proposals (RFP) process. The RFP stated that the resulting contracted supplier would; “reduce the VSBs carbon foot print”, “effectively manage print/copy requirements for the Board including the reduction of costs and paper usage” and “provide configuration recommendations for new and replacement devices that incorporate life cycle and factor in the return on investment strategies to the Board”.
To date Canon Canada and the VSB have taken the following action toward a print management solution.
1) Upgraded hardware 2) Consolidation of devices 3) Streamlined vendors
The above actions have resulted in the following benefits
o lower total cost of ownership, including
lower cost of printing,
reduction of single function print devices
reduced energy consumption
reduced administration
o utilization of new multi‐function technology that allows
increased functionality including copy/print/scan/ and in some cases fax,
staff to print to copiers at a lower cost than single function print type devices,
reduce single function devices
ease of use due to a standardized interface
accurate reporting
The 2014/2015 budget included savings of $327,000 with respect to this phase. The next steps to achieve print management includes 1) further consolidation of single function print devices and 2) the purchase and implementation of a print output management software solution that can manage the print copy and scan processes in an organization. The anticipated results to the VSB by implementing these two steps include;
Preliminary Budget Proposal /
P a g e | 1 6
1) Consolidation of 800 single function print (SFP) devices to 100 multi‐function print (MFP)
devices. This implementation is expected to take twelve months and can begin May 2015.
Savings are a result of lower printing cost per copy for supplies and reduced electrical
consumption.
This step ties directly into the Boards direction with regards to environmental sustainability and also benefits the Information Technology department as there are less devices requiring setup and break‐fix service.
2) Implement a print output management software solution to manage the print/copy and
scan process in the VSB. This software will provide copy and print accounting, challenge
print behavior resulting in reduced waste and cost, allows for mobile and secure print and
provides information for print device fleet management.
With the implementation of a print output management software, it is anticipated that savings will be realized through;
a) Secure printing – helps eliminate paper wastage by NOT printing until the user
goes up to the device and releases the print through a user authentication using a
PIN code or swiping a FOB/Card key.
b) Universal print driver defaults – all prints will be defaulted to black and white and double‐sided prints. It is projected that 35% of paper used will be double‐sided
print reducing paper usage.
c) Rules and routing – the output management software will influence user print
behavior by interactively engaging users to choose more cost‐efficient printing
devices when sending print jobs.
Implementation of this software will begin May 2015, with a complete roll‐out to all sites by December 2015, for estimated savings at $200,000 in 2015/2016 and up to $500,000 for the following year. Savings include reduced cost per copy charges, electricity, paper and toner.
Recommendations
It is recommended that the VSB proceed with both the consolidation of 800 single function print devices and implement a print output management software. Savings of $200,000 are expected for 2015/2016.

Preliminary Budget Proposal /
P a g e | 1 7
Budget Implications
Staffing Impact (FTE) Budget Impact ($)
Base Reduction Employee Group
Salaries & Benefits
Supplies Revenue Total
200,000
200,000

Preliminary Budget Proposal /
P a g e | 1 8
B1 – Maintenance Service Reductions
Background & Analysis
Due to previous operating budget reductions and Annual Facilities Grant (AFG) funding shortfalls, current maintenance funding levels are presently significantly less than those required to prevent our schools from deteriorating further on an annual basis. However, facility maintenance expenditures are not constrained by legislative or collective agreement requirements. Accordingly, there is some flexibility to vary the level of maintenance work performed each year. As part of the 2014/2015 budget, a one‐time reduction of $500,000 was made to maintenance trades staff (two painters, two sheet metal workers and one machinist).
Recommendations
As the VBE is faced with another significant funding shortfall for 2015/2016, it is proposed that the reduction to maintenance trades made in 2014/2015 be continued again for 2015/2016. Specifically for 2015/2016 it is proposed that the reduction of 2 painters, 2 sheet metal workers , and 1 machinist approved last year continue again for 2015/2016.
Budget Implications
Staffing Impact (FTE) Budget Impact ($)
Base Reduction Employee Group
Salaries &
Benefits Supplies Revenue Total
22.0 16.0 7.0
2.0 2.0 1.0
Painters
Sheet Metal Machinists
172,265 170,464 84,666
25,840 34,093 17,300
504,628

Preliminary Budget Proposal /
P a g e | 1 9
B2 – Closure of Classroom Space
Background & Analysis
Due to declining enrollment there are several classrooms throughout the district which may be considered surplus to the needs of a school for enrolling purposes. Currently the area for these classrooms is included in the calculation for cleaning time for Operations staff. If a classroom was closed and not used by the school, the area could be removed from the calculation for cleaning which would reduce staff and therefore budgets. The area for classrooms varies throughout the district, however based on an average of 70sq.m per classroom; the savings would be approximately $1,400 per classroom. The classroom would need to be locked and the schools would no longer be able to have access to them for any purpose. The Building Engineer would maintain a key to allow access to the room for Operations & Maintenance purposes.
Recommendations
It is recommended to close a total of 28 classrooms in 2015/2016 for a savings of $39,200.
Budget Implications
Staffing Impact (FTE) Budget Impact ($)
Base Reduction Employee Group
Salaries
& Benefits
Supplies Revenue Total
418.93
0.8
IUOE
39,200
39,200
Preliminary Budget Proposal /
P a g e | 2 0
C1 – Provincial Holdback Funds ‐ Revised
Background & Analysis
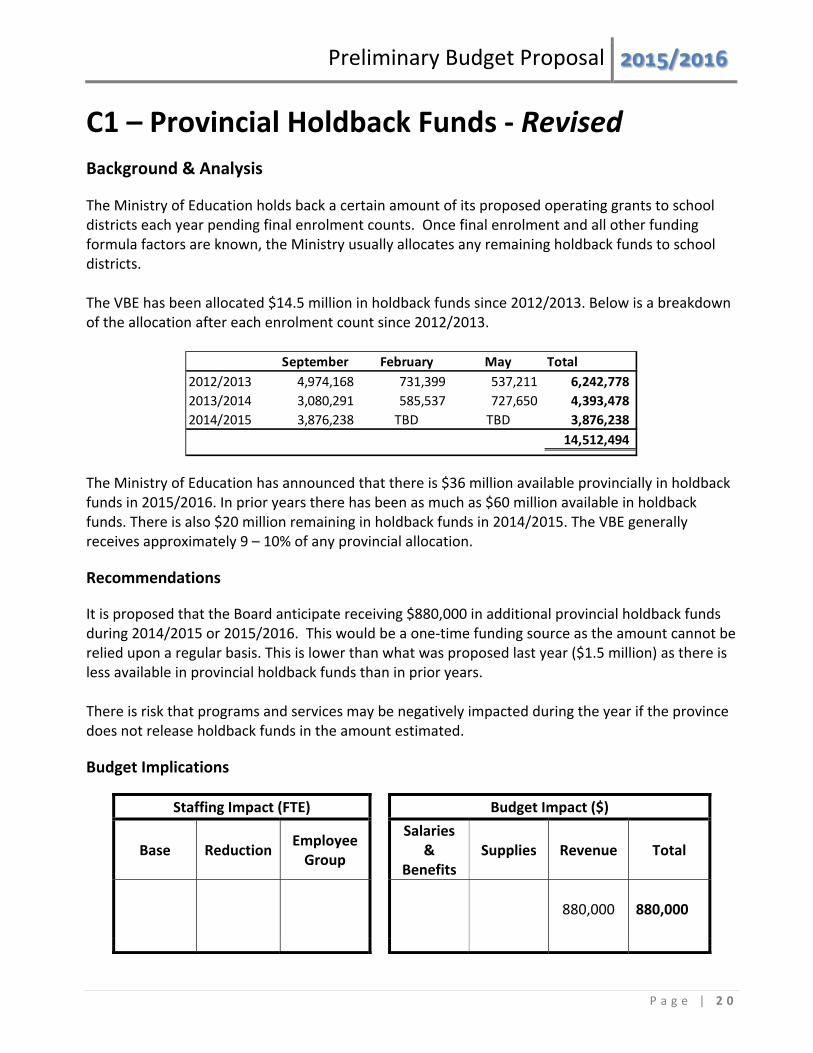
The Ministry of Education holds back a certain amount of its proposed operating grants to school districts each year pending final enrolment counts. Once final enrolment and all other funding formula factors are known, the Ministry usually allocates any remaining holdback funds to school districts. The VBE has been allocated $14.5 million in holdback funds since 2012/2013. Below is a breakdown of the allocation after each enrolment count since 2012/2013.
The Ministry of Education has announced that there is $36 million available provincially in holdback funds in 2015/2016. In prior years there has been as much as $60 million available in holdback funds. There is also $20 million remaining in holdback funds in 2014/2015. The VBE generally receives approximately 9 – 10% of any provincial allocation.
Recommendations
It is proposed that the Board anticipate receiving $880,000 in additional provincial holdback funds during 2014/2015 or 2015/2016. This would be a one‐time funding source as the amount cannot be relied upon a regular basis. This is lower than what was proposed last year ($1.5 million) as there is less available in provincial holdback funds than in prior years. There is risk that programs and services may be negatively impacted during the year if the province does not release holdback funds in the amount estimated.
Budget Implications
Staffing Impact (FTE) Budget Impact ($)
Base Reduction Employee Group
Salaries
& Benefits
Supplies Revenue Total
880,000
880,000
September February May Total
2012/2013 4,974,168 731,399 537,211 6,242,778
2013/2014 3,080,291 585,537 727,650 4,393,478
2014/2015 3,876,238 TBD TBD 3,876,238
14,512,494
Preliminary Budget Proposal /
P a g e | 2 1
C2 – Lease of Underutilized Space ‐ Revised
Background & Analysis
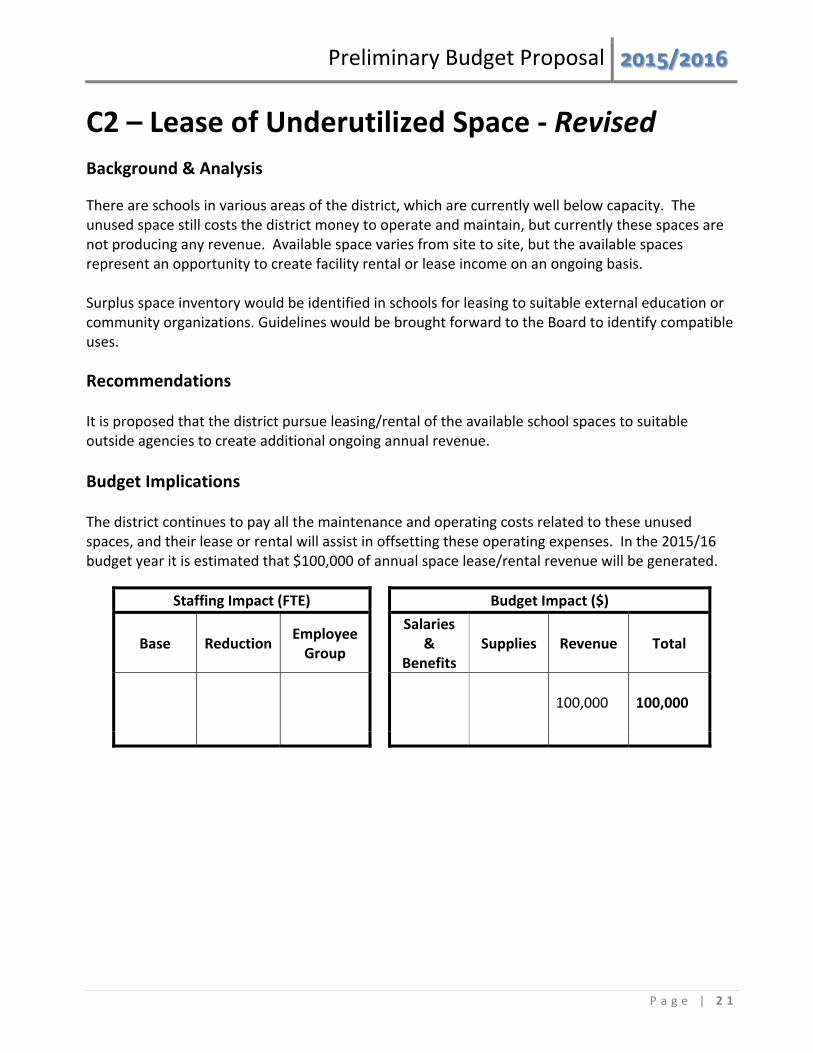
There are schools in various areas of the district, which are currently well below capacity. The unused space still costs the district money to operate and maintain, but currently these spaces are not producing any revenue. Available space varies from site to site, but the available spaces represent an opportunity to create facility rental or lease income on an ongoing basis. Surplus space inventory would be identified in schools for leasing to suitable external education or community organizations. Guidelines would be brought forward to the Board to identify compatible uses.
Recommendations It is proposed that the district pursue leasing/rental of the available school spaces to suitable outside agencies to create additional ongoing annual revenue.
Budget Implications The district continues to pay all the maintenance and operating costs related to these unused spaces, and their lease or rental will assist in offsetting these operating expenses. In the 2015/16 budget year it is estimated that $100,000 of annual space lease/rental revenue will be generated.
Staffing Impact (FTE) Budget Impact ($)
Base Reduction Employee Group
Salaries
& Benefits
Supplies Revenue Total
100,000
100,000

Preliminary Budget Proposal /
P a g e | 2 2
D1 – Band and Strings – Revised
Background & Analysis In the Spring of 2014, during the 2014‐2015 budget development process, the Board considered a proposal to eliminate the district staffing of 8.85 FTE that supported the optional elementary Band and Strings program in 51 elementary schools. During the budget deliberations the Board heard from many advocates for the program, and about the value of quality music education overall, including presentations from students, parents, staff, and community organizations. The Board made a decision to identify additional, one‐time only funding for the 2014‐2015 budget in order to continue the program for that year. The Board also asked that the sustainability of the optional elementary Band and Strings program be explored, including looking to other jurisdictions for other models, and meeting with stakeholders to seek advice. A consultant’s report was presented in February 2015, outlining a number of possible strategies for maintaining the program option, while reducing some of the additional district staffing costs. District staff presented a report on March 25, 2015 with several strategies for reducing the additional district staffing costs including program grade configuration (Band at Grades 6 and 7; Strings at Grades 5 to 7), and implementation of a pilot preparation time delivery model at a number of school sites for September 2015. Following the initial budget proposal, it has been determined that the savings related to grade configuration will result in a lower reduction in FTE, than originally estimated. The two strategies combined are estimated to result in a minimum reduction of 3.0 FTE from the current 8.85 FTE additional staffing allocation with a projected savings of $295,950 Additionally, the report recommended increasing the user‐fee contribution for participants in the current optional pull‐out program model, from $2.50 per month to $5.00 per month which would help offset the district program costs. The total additional fee collection would be dependent upon the number of schools implementing the preparation model for September 2015. A preliminary estimate of the additional revenue would be about $45,000.
Recommendations It is recommended that staffing allocations to the Band & Strings programs be reduced by 3.0 FTE and to increase the fee from $2.50 per month to $5.00 per month.

Preliminary Budget Proposal /
P a g e | 2 3
Budget Implications
Staffing Impact (FTE) Budget Impact ($)
Base Reduction Employee Group
Salaries & Benefits
Supplies Revenue Total
8.85
3.0
Teachers
295,950
45,000
340,950
Preliminary Budget Proposal /
P a g e | 2 4
D2 – International Education
Background & Analysis The international program department directs and supports international student enrolment in Vancouver School District schools. The program currently provides district support to over 1,560 international students at 18 secondary schools, 26 elementary schools and 2 adult education centres. The international education department has successfully promoted VSB’s program to attract students from 38 countries. The program currently generates net annual revenue of approximately $8.65 million to the district and creates over 83 full time teaching positions. Continued infrastructure support is needed for student success within a growing program and a two‐component plan of increased revenue and increased department staffing is therefore proposed to the Board for its consideration. Proposed Enrolment Increase: It is proposed that the International program enrol an additional 50 FTE international students in 2015‐16, resulting in an increase in gross revenue of $650,000. This additional enrolment will also generate corresponding expenses in commissions to agencies for targeted referrals ($65,000), funding to schools ($2,500), and 2.60 FTE additional teachers ($191,150). The overall additional net revenue associated with this enrolment increase will therefore be $ 391,350. Proposed Staffing Increase: The VBE’s international Education program is currently the largest in the province and one of the largest in the country. The program has seen a significant increase in the number of enquiries about and interest in our program. With the proposed addition of another fifty FTE students in the 2015‐16 school year, program enrolment will have grown by over five hundred students since the 2011‐12 school year, a 47% increase in the past four years. Concurrent with this growth has been significantly increased requirements on international educational program staff. The department is nearing its capacity in terms of its ability to continue to manage the volume and complexity of work associated with such a large program. It is therefore requested that concurrent with the proposed enrolment increase, the Board approve the addition of two continuing positions, both of which will be funded on an ongoing basis by the proposed enrolment increase. Program Coordinator: The VSB currently employs one program coordinator for over 1560 students who is responsible for a variety of duties, including significant aspects of custodial arrangements and admissions processes, particularly as they relate to the homestay care of children while they attend VSB schools. The program coordinator is also responsible for adherence to rules pertaining to immigration policies and study permit procedures, as well as overseeing provision of student medical insurance with providers, and providing information sessions to custodians, parents and agencies. The program coordinator also has responsibilities relating to promotion of the program both locally and overseas, organizing group programs and school visits, and programming recreation
Preliminary Budget Proposal /
P a g e | 2 5
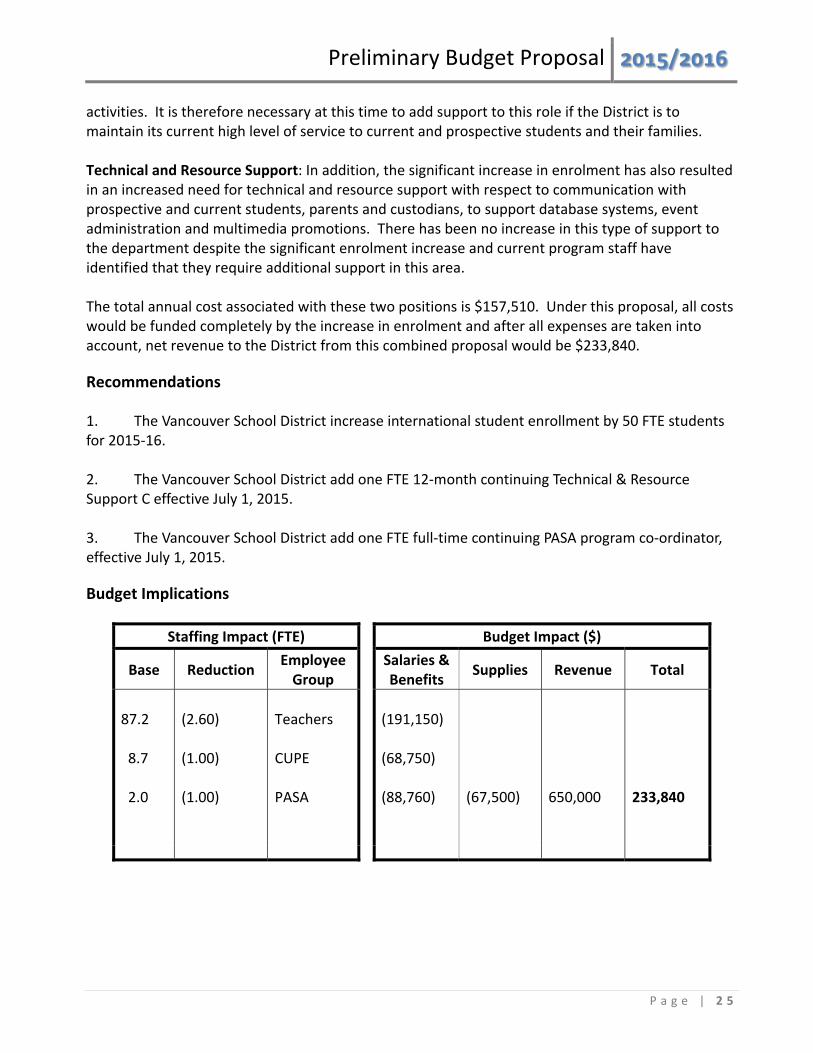
activities. It is therefore necessary at this time to add support to this role if the District is to maintain its current high level of service to current and prospective students and their families. Technical and Resource Support: In addition, the significant increase in enrolment has also resulted in an increased need for technical and resource support with respect to communication with prospective and current students, parents and custodians, to support database systems, event administration and multimedia promotions. There has been no increase in this type of support to the department despite the significant enrolment increase and current program staff have identified that they require additional support in this area. The total annual cost associated with these two positions is $157,510. Under this proposal, all costs would be funded completely by the increase in enrolment and after all expenses are taken into account, net revenue to the District from this combined proposal would be $233,840.
Recommendations
1. The Vancouver School District increase international student enrollment by 50 FTE students for 2015‐16. 2. The Vancouver School District add one FTE 12‐month continuing Technical & Resource Support C effective July 1, 2015.
3. The Vancouver School District add one FTE full‐time continuing PASA program co‐ordinator, effective July 1, 2015.
Budget Implications
Staffing Impact (FTE) Budget Impact ($)
Base Reduction Employee Group
Salaries & Benefits
Supplies Revenue Total
87.2 8.7 2.0
(2.60) (1.00) (1.00)
Teachers CUPE PASA
(191,150) (68,750) (88,760)
(67,500)
650,000
233,840

Preliminary Budget Proposal /
P a g e | 2 6
D3 – Adult Education ‐ Revised
Background & Analysis In B.C., Adult Education is optional programming that is offered outside of the K‐12 core mandate. The Vancouver School District offers credit programs for adults who wish to undertake academic upgrading, improve their English language skills or pursue an adult graduation diploma. Presently, the program consists of the following:
Five adult education centres
Seven elementary outreach programs
Four youth programs for school aged students (16‐19) The Adult Education program has been experiencing declining enrollment over the past several years, in great part due to the Education Guarantee changes. 0n May 1, 2015, the Education Guarantee will change again and only the 26 literacy foundation courses will be eligible for ministry funding. This change will result in a further decline in funding. The table below outlines the enrollment and funding challenges of the program which has been operating at a deficit for the past several years, and has required funding beyond that generated from Adult Education student enrollment.
School Year Enrollment Decline
Operating Deficit
2012‐13 ‐17% $2.06 million
2013‐14 ‐14% $2.92 million
2014‐15* ‐17% $2.01 million
2015‐16* ‐20% $.93 million *Projected
The AE program continues to operate with an annual deficit despite several actions implemented by the district. Current AE program challenges include: declining enrolment across the program, underutilized capacity at all sites and/or sites where physical space limits class size, and a self‐paced program delivery option that is not sustainable at all sites. Class size averages are currently less than 20 in the AE program. In order for courses to operate on a cost neutral basis, a class size minimum of 26 is required. As a comparison, the district employs a 30 class size average for secondary classes. Current AE sites are operating at less than full capacity: DEEC operates at 44%; GP at 60%; Hastings at 67%; Main Street at 68%; and South Hill at 84% capacity. The current and projected student enrolment can be accommodated in fewer sites, which would result in reductions in the area of administrative and clerical support costs, as well as some facility leasing costs.

Preliminary Budget Proposal /
P a g e | 2 7
Physical classroom space at these current sites (HEC, GP, DEEC) are not able to accommodate a class size minimum of 26 students, which creates an ongoing operational deficit for the overall program. As well there are several satellite programs, providing Literacy Foundation courses to adults at elementary school sites or serving youth under 19. The participants in these two types of programs can be supported within other existing sites, i.e. Main Street or South Hill in the case of adults taking Literacy Foundation courses, or through existing programs at South Hill and GP (RAIL program) in the case of youth under 19. This would reduce the level of administrator staffing required to provide oversight of the satellite programs, and ensure larger cohorts of students were being supported in existing programs. During the budget discussion process, there has been consideration of a different location option for youth programs. This would entail closing South Hill Youth Program, and maintaining the Kiwassa Youth Program location, as a presence in the northeast area of the city. The RAIL program at GP, would remain. This proposed change would not result in any changes to proposed budget costs. Several sites have Learning Centres where AE students may take a self‐paced course option. Each of these centres has a higher staffing level than in structured courses, of 3 FTE (teachers and instructional assistants). As with overall AE enrollment, there has been a continuing decline in the enrolment in self‐paced courses over the past 3 years. A further decline is projected for 2014/15.
Self‐Paced Course Enrolment
2011/12 2012/13 2013/14
339 Student FTE 239 Student FTE 175 Student FTE
In the self‐paced course option across all the AE sites, there are 12.66 teaching staff FTE. In 2013/14, the student/teacher ratio ranged from 4 FTE students to 1 FTE teaching staff in some centres to 17 FTE student to 1 FTE teaching staff across the centres. As students in self‐paced programs are on continuous entry, and start and finish the course at varied times, there may be fluctuation in the number of students who are actually present in the program or in the centres at any given period of time. In response to budget discussions, a need has been identified to maintain more sites with self‐paced learning centre hours, than originally proposed. This would include maintaining some hours at both Main Street at Gladstone, and at South Hill. The schedule for operating hours would be developed to require the same level of staffing as in the original budget proposal; moving some of the additional staff time proposed for GP, to the other two centres. By establishing a class minimum of 26, reducing the number of AE centres and satellite programs, designating GP as a self‐paced learning centre only, and offering limited self‐paced learning centre hours at Main Street at Gladstone, and South Hill, it is anticipated that the district could maintain a
Preliminary Budget Proposal /
P a g e | 2 8
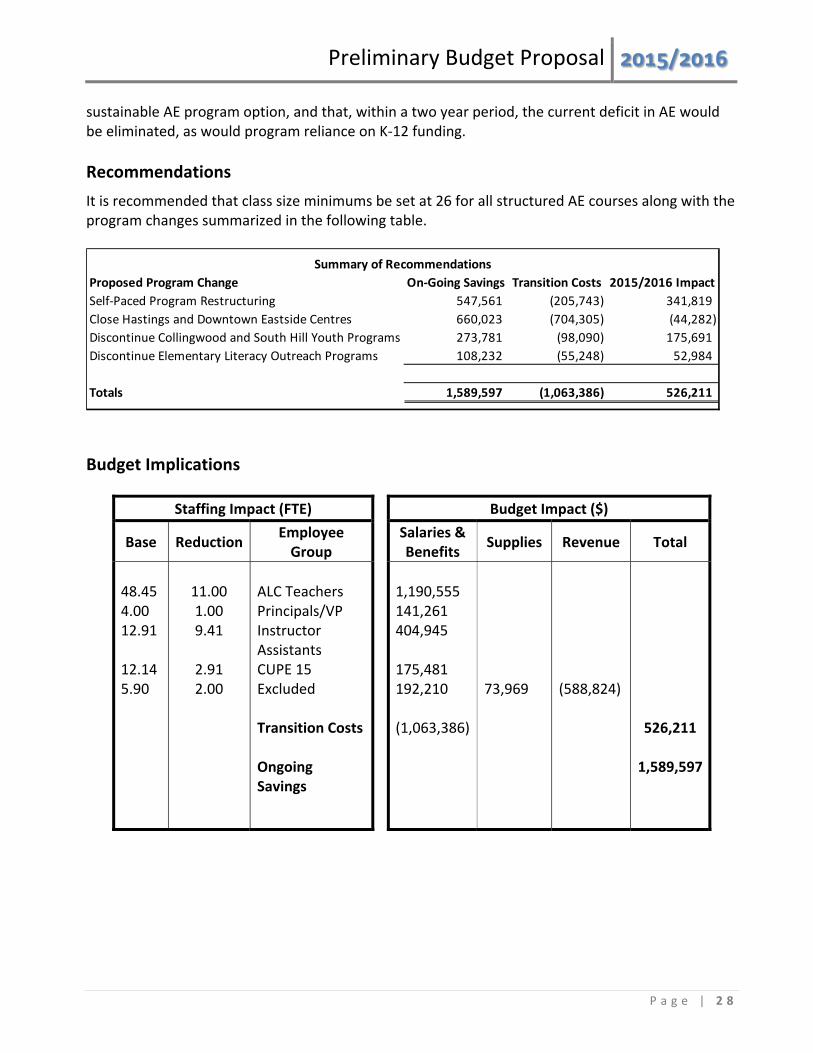
sustainable AE program option, and that, within a two year period, the current deficit in AE would be eliminated, as would program reliance on K‐12 funding.
Recommendations
It is recommended that class size minimums be set at 26 for all structured AE courses along with the program changes summarized in the following table.
Budget Implications
Staffing Impact (FTE) Budget Impact ($)
Base Reduction Employee Group
Salaries & Benefits
Supplies Revenue Total
48.45 4.00 12.91 12.14 5.90
11.00 1.00 9.41
2.91 2.00
ALC Teachers Principals/VP Instructor Assistants CUPE 15 Excluded Transition Costs Ongoing Savings
1,190,555 141,261 404,945 175,481 192,210 (1,063,386)
73,969
(588,824)
526,211
1,589,597
Summary of Recommendations
Proposed Program Change On‐Going Savings Transition Costs 2015/2016 Impact
Self‐Paced Program Restructuring 547,561 (205,743) 341,819
Close Hastings and Downtown Eastside Centres 660,023 (704,305) (44,282)
Discontinue Collingwood and South Hill Youth Programs 273,781 (98,090) 175,691
Discontinue Elementary Literacy Outreach Programs 108,232 (55,248) 52,984
Totals 1,589,597 (1,063,386) 526,211

Preliminary Budget Proposal /
P a g e | 2 9
D4 – K‐12 Teaching Allocation
Background & Analysis Teaching costs represent 54% of the district’s operating budget. In an attempt to achieve budget savings in this significant cost area, the proposal is to reduce 9.96 FTE from the overall staffing allotment. This would yield a total of $979,671 in savings. This could be achieved in the following two areas: International Education Schools who enroll International students currently receive extra teacher staffing. The formula for allocating International teaching blocks equates to 1.0 FTE for every 20 International Education students enrolled at a school. By changing the formula to a ratio of 22 students per 1.0 FTE of teaching, 7.73 FTE less teachers would be allocated resulting in a reduction in teacher costs of $760,246.
Secondary Enrolling Teachers A further reduction of 3.00 FTE teachers could be made to teaching entitlement formula for secondary schools. This reduction represents a small decrease (less than one‐half of 1%) of the total secondary enrolling teacher entitlement therefore the impact across all 18 secondary schools would be minimal. This would generate a cost savings of $295,386.
Recommendations It is recommended that the:
1. Teaching entitlement formula be adjusted to 22 international students per 1.0 FTE teacher and;
2. The allocation of teachers to secondary schools be reduced by 3.00 FTE.
Budget Implications
Staffing Impact (FTE) Budget Impact ($)
Base Reduction Employee Group
Salaries & Benefits
Supplies Revenue Total
2,739.28
10.73
Teachers
1,055,632
1,055,632

Preliminary Budget Proposal /
P a g e | 3 0
E1 – Benefits Surplus
Background & Analysis In January, a report was presented to the Board advising that a number of the employee benefit plans were over‐contributed as of November 30, 2014, and the Board adopted a recommendation of a lump sum withdrawal of excess benefit contributions up to and including November 30, 2014. Morneau Sheppell, our benefits advisor, recently updated the over‐contribution calculations to February 28, 2015, and then extrapolated the amount to the end of the current fiscal year, June 30, 2015. Excess contributions are anticipated to accumulate further, providing an opportunity to take a further premium holiday or lump sum withdrawal.
It should be noted that given the trend over the last few years to accumulate over‐contributions in these benefit plans, the contribution rate increases for 2015/2016 have been lowered to avoid large over‐contributions.
Recommendations
It is recommended that the Board approve the lump sum withdrawal of funds and premium holidays that are forecast to accumulate to June 30, 2015.
Budget Implications
Staffing Impact (FTE) Budget Impact ($)
Base Reduction Employee Group
Salaries & Benefits
Supplies Revenue Total
1,945,293
1,945,293

Preliminary Budget Proposal /
P a g e | 3 1
F1 –Digital Support Project
Background & Analysis The District is currently executing a previously approved and funded Records Management Project to enable the District to properly govern and manage all of its documents and more effectively meet its legal obligations under the Freedom of Information and Protection of Privacy Act. This project includes the ability to manage records, forms, and processes with programmed work flows and new improved modes of communication to reduce the use of e‐mail, and improve storage and retrieval of documents such as minutes, agendas, and reports. One of the first components of the Records Management Project includes the Online Fee Payment initiatives, currently underway, to allow the management of forms, fee payments, and other communication activities between schools and the district, and schools and parents. Other components, including teaching and learning spaces, mobile access, connections to school and District public websites, will be added as internal resources and funds permit to support school work processes, teaching, and learning. To move from a paper based system to effective electronic document creation, access and management requires system management software to support regular, rigorous data governance, security, system content, and access controls (i.e. user permissions). The introduction of the Records Management Project creates a requirement for these new management software tools.
Recommendations
Base funding is required to support the ongoing purchase of specialized content governance and access control software and services.
Budget Implications
Staffing Impact (FTE) Budget Impact ($)
Base Reduction Employee Group
Salaries & Benefits
Supplies Revenue Total
(100,000)
(100,000)

Preliminary Budget Proposal /
P a g e | 3 2
F2 – Learning & Technology Infrastructure Requirements
Background & Analysis The District has an extensive LIT infrastructure in support of education and business related systems and practices. Some of the key infrastructure includes:
Approximately 125 physical and nearly 100 virtual (software‐based) servers that provide core functions. Fifty percent (50%) of these were replaced in 2014‐15. The functions of the servers include file/document storage/sharing/management, printing, directory services, software application services, internal and public (external facing) web sites, security services (filtering, monitoring), databases, collaboration portals, email, business systems, identity management, data/file backup / recovery, system and network management, monitoring, and reporting.
Wireless networking system across all schools and District sites.
5000+ iPads, primarily for student use. Some of these are District purchases, but most often are purchased at the school level, which presents challenges for the District in terms of predicting or controlling the pace and volume of new acquisitions.
Approximately 11,000 PC desktop and/or laptop computers, and 1500 Apple computers in schools and worksites.
Successful infrastructure requires a sustainably funded renewal plan that supports regular maintenance, support, and an asset replacement cycle. This is necessary to ensure that all mission critical systems are maintained for students, staff, and public access. This support includes licensing of system software tools, the provision of maintenance and support agreements, and planned refreshment of hardware (i.e. servers, computers). As central servers, central file / document and data storage / backup systems, and school servers have reached the end of their useful life, there is a need to reduce the likelihood that services will be interrupted. Over the past year there have been a number of significant hardware failures (50) with aging school servers which caused significant multi‐day downtimes for staff and students. This creates significant risk to the District by negatively impacting the learning of students and work of employees, and contributing to data and information loss. The initial wireless network project included a pre‐purchase of initial support and maintenance. That agreement has ended however service is still necessary. With a limited number of technicians, a Mobile Device Management system is required to effectively manage and support the increasing number of mobile devices (5000+ iPads, 800 iPhones

Preliminary Budget Proposal /
P a g e | 3 3
and Androids). Similarly with the increase in purchases of MAC computers, there is a need to acquire and adopt appropriate Mac OSX deployment and management tools. To shift to a sustainable model, as infrastructure components reach their end of life they will be replaced using a lease or subscription model. There is a need to incorporate funding into the LIT budget to finance this model, for components, service and licensing. This approach would significantly mitigate the current and future risks faced by the District in its use of electronic systems and data.
Recommendations
It is recommended that the VBE:
1. Subscribe to annual software licensing and maintenance agreements for the Wireless network equipment and software (essential for vendor support and hardware maintenance)
2. Replace mission critical data center servers, file/document storage systems, and maintain data center backup power supply for providing core District digital services.
3. Subscribe to Mobile Device Management system (manage and support iPads, iPhones, Androids)
4. Replace the remaining 50% of obsolete school file/print/directory servers (50% funded in 2014‐15 budget)
Budget Implications
Staffing Impact (FTE) Budget Impact ($)
Base Reduction Employee Group
Salaries &
BenefitsSupplies Revenue Total
1. (44,000) 2. (224,000)3. (27,000) 4. (83,000)
(378,000)
Preliminary Budget Proposal /
P a g e | 3 4
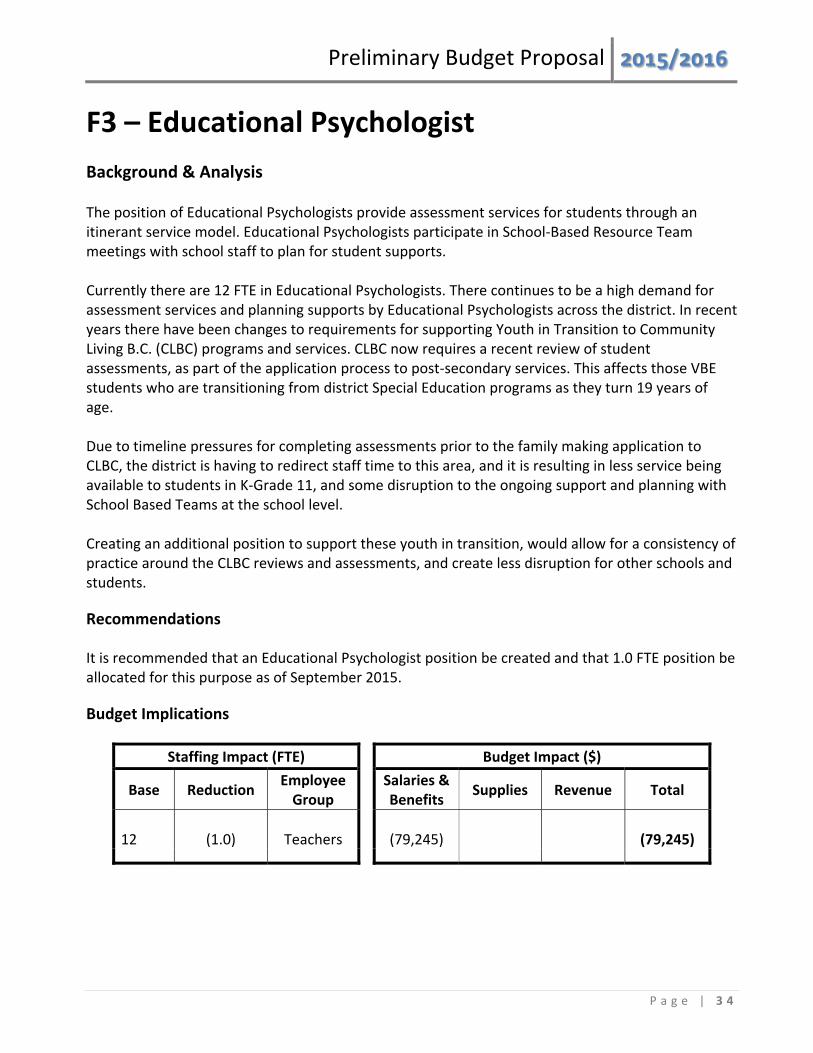
F3 – Educational Psychologist
Background & Analysis The position of Educational Psychologists provide assessment services for students through an itinerant service model. Educational Psychologists participate in School‐Based Resource Team meetings with school staff to plan for student supports. Currently there are 12 FTE in Educational Psychologists. There continues to be a high demand for assessment services and planning supports by Educational Psychologists across the district. In recent years there have been changes to requirements for supporting Youth in Transition to Community Living B.C. (CLBC) programs and services. CLBC now requires a recent review of student assessments, as part of the application process to post‐secondary services. This affects those VBE students who are transitioning from district Special Education programs as they turn 19 years of age. Due to timeline pressures for completing assessments prior to the family making application to CLBC, the district is having to redirect staff time to this area, and it is resulting in less service being available to students in K‐Grade 11, and some disruption to the ongoing support and planning with School Based Teams at the school level. Creating an additional position to support these youth in transition, would allow for a consistency of practice around the CLBC reviews and assessments, and create less disruption for other schools and students.
Recommendations
It is recommended that an Educational Psychologist position be created and that 1.0 FTE position be allocated for this purpose as of September 2015.
Budget Implications
Staffing Impact (FTE) Budget Impact ($)
Base Reduction Employee Group
Salaries & Benefits
Supplies Revenue Total
12
(1.0)
Teachers
(79,245)
(79,245)
Preliminary Budget Proposal /
P a g e | 3 5
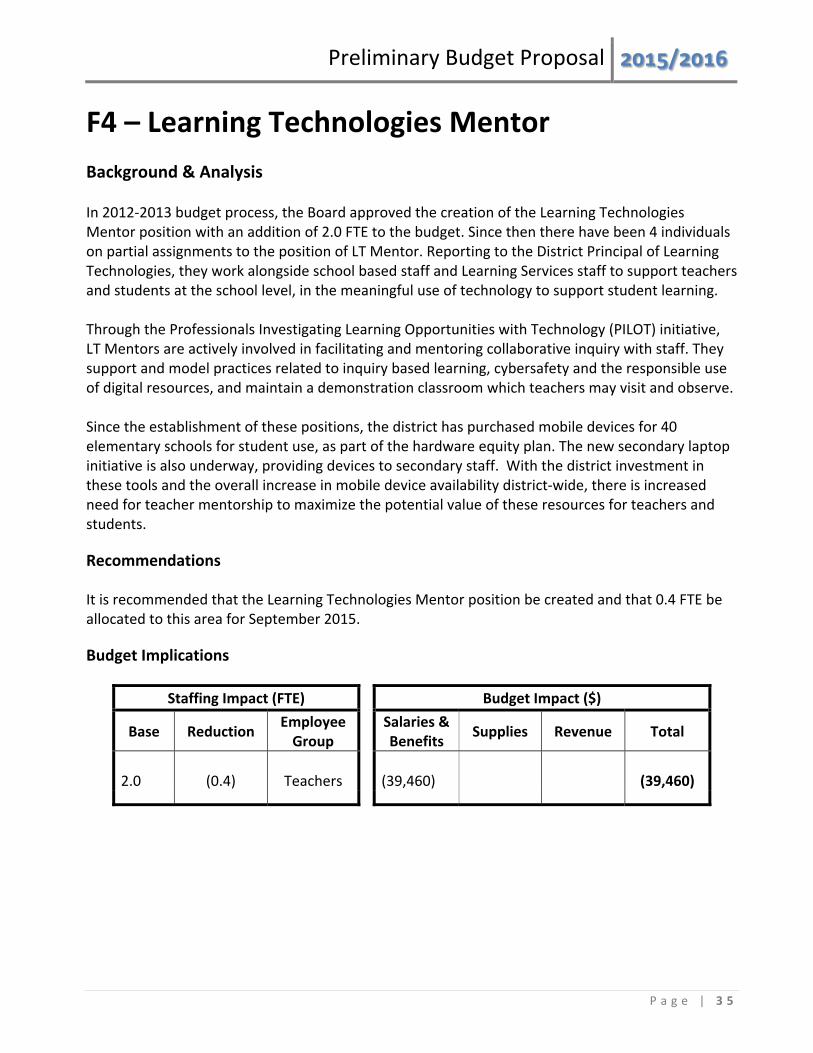
F4 – Learning Technologies Mentor
Background & Analysis In 2012‐2013 budget process, the Board approved the creation of the Learning Technologies Mentor position with an addition of 2.0 FTE to the budget. Since then there have been 4 individuals on partial assignments to the position of LT Mentor. Reporting to the District Principal of Learning Technologies, they work alongside school based staff and Learning Services staff to support teachers and students at the school level, in the meaningful use of technology to support student learning. Through the Professionals Investigating Learning Opportunities with Technology (PILOT) initiative, LT Mentors are actively involved in facilitating and mentoring collaborative inquiry with staff. They support and model practices related to inquiry based learning, cybersafety and the responsible use of digital resources, and maintain a demonstration classroom which teachers may visit and observe. Since the establishment of these positions, the district has purchased mobile devices for 40 elementary schools for student use, as part of the hardware equity plan. The new secondary laptop initiative is also underway, providing devices to secondary staff. With the district investment in these tools and the overall increase in mobile device availability district‐wide, there is increased need for teacher mentorship to maximize the potential value of these resources for teachers and students.
Recommendations
It is recommended that the Learning Technologies Mentor position be created and that 0.4 FTE be allocated to this area for September 2015.
Budget Implications
Staffing Impact (FTE) Budget Impact ($)
Base Reduction Employee Group
Salaries & Benefits
Supplies Revenue Total
2.0
(0.4)
Teachers
(39,460)
(39,460)

I 0 Does Memorandum 4-1
vancouver school board
n t e
e April 21, 2015
To:
From:
Subject:
Plenary Education and Student Services and Finance and Legal Committee (Committee IIIN)
Rick Krowchuk, Secretary-Treasurer Lisa Landry, Director of Finance
2015/2016 Budget, Additional Information
During the Plenary Committee IIIN meeting on April 13, 2015, a number of queries were raised Subsequent information has been gathered, and staff would like to update the Committee.
Key Performance Indicators
In order to inform the budget process, the VBE undertook a comparison of student / staffing ratios with a subset of other large urban British Columbia school districts. The VBE statistics are compared to a 'sub-set', which is an average of the results of five school districts.
Further to a query to release the names, staff have received permission to release the names of the individual school districts that make up the comparative `sub-set. The members of the comparative sub-set are as follows: Burnaby, Central Okanagan, Coquitlam, Surrey, and Victoria.
Secured v. Unsecured Borrowing Rates
Budget proposal Al contemplates the sale and leaseback of equipment owned by the district. Trustees have inquired as to the cost of a loan that is not secured. Staff have made inquiries, and the information is summarized in the following table:
Indicative Rates
Term Secured Unsecured 3 year term 2.65% 2.92% 5 year term 2.90% 3.22%
* as of March 26, 2015 per discussion with
chartered Canadian bank
During the consultation meetings, the Municipal Finance Authority has also been mentioned as a possible lender. Staff are aware that the MFA had been extending their portfolio and looking into lending funds to entities outside of municipalities and regional districts. The information available currently specifically references only municipalities and RDs, however, the MFA could be certainly included in the actual call for financing.
1

Adult Education Class Size
Further to a query regarding the class sizes for Adult Education classes, staff have researched the costing, and arrived at the following:
• A class size of 21 Adult Education students would provide funding equal to the expenditures for an average teacher's salary. It would not provide funding for other costs including administrative, excluded and clerical staff salaries, supplies and materials.
• A class size of 32 Adult Education students would provide funding equal to the expenditures for an average teacher's salary and all costs, including administrative, excluded and clerical staff salaries, supplies and materials.
Changes contained in the D3 Adult Education budget proposal include:
• an increase to minimum class sizes • reduced number of program locations; and • a reduction in hours of self-paced learning centres.
As a result of these changes, it is anticipated that an average of 29 students would generate funding to meet all costs as outlined in the second point above.
Secondary School Administrator's Staffing Levels
A questiOn was raised at the April 13th Committee meeting, with respect to secondary school administrator staffing levels and how they are impacted by changes in enrolment.
A general framework or guideline is used to review secondary administrator staff levels each year, based on the estimated enrolment of each secondary school. This guideline helps determine the number of administrators to be assigned to each school and their administrative versus teaching allocation. As secondary schools generally have enrolments between 500 and 2,000 students, the steps which result in changes to administrator allocations are fairly broad. Teacher staffing, on the other hand, varies more directly with changes in enrolment.
This item is provided for information
2