nova center for applied research and professional development 2n year... · 1 nova center for...
TRANSCRIPT
Dr. Frank Till Superintendent of Schools
Nova Center for Applied Research and Professional Development
EVALUATION REPORT
The School Board of Broward County, Florida
Carmen Varela-Russo Associate Superintendent
Technology, Strategic Planning & Accountability
Dr. Katherine A. Blasik Director, Research and Evaluation
Dr. Cary Sutton Director, Research Services
Darla L. Carter, Chairperson Diana Wasserman-Rubin, Vice Chairperson
Carole L. Andrews Judie S. Budnick
Paul D. Eichner, Esq. Stephanie Arma Kraft, Esq.
Miriam M. Oliphant Dr. Robert D. Parks
Lois Wexler
December, 1999 Evaluator: Dr. Arlene K. Brown

Nova Center for Applied Research and Professional Development
TABLE OF CONTENTS
I. EXECUTIVE SUMMARY iii
II.
INTRODUCTION
1
III.
RELATED EVALUATION FINDINGS
2
IV.
PROGRAM DESCRIPTION
3
V.
PURPOSE OF THE EVALUATION REPORT
5
VI.
METHODS
5
VII.
RESULTS
8
VIII.
SUMMARY AND RECOMMENDATIONS
40
IX.
REFERENCES
43
X.
APPENDICES
45
1
Nova Center for Applied Research and Professional Development
Evaluation Report This study continues to report on the findings and recommendations resulting from the 1998 formative evaluation of the implementation of the Three-Year Nova Center for Applied Research and Development Design Team Plan. The evaluation highlights the second and third years’ implementation process and the observable results of the planned changes at the four Nova schools through the 1998-99 school year. The evaluation focuses on the impact of the changes on students, teachers, and parents. The evaluation includes information gathered through multiple sources including: (a) site visits to each of the four schools and to the Human Resource Development (HRD) office of the Nova Center, (b) individual interviews with the four principals and the Director of HRD, (c) group interviews with the four Principals and the Director of HRD, (d) focus group with teachers from the lower and upper levels, (e) focus groups with current team leaders from the lower and upper levels, (f) interviews with relevant district staff, (g) telephone interviews with previous team leaders, (h) telephone interviews with parents from the upper and lower levels, (i) written Customer Surveys completed by students, parents and teachers, (j) written surveys related to team leaders and the House/Learning Community completed by Nova teachers, (k) analysis of standardized achievement tests for three or four year periods, and (l) review of pertinent local reports and documents. The findings provide evidence that the second and third years were spent continuing to implement and revise the redesign recommendations for the Nova schools. Withdrawal rates have increased, the waiting list has decreased, team leader positions have had high turnover and minimal research dissemination has occurred. In spite of this, the students’ standardized test scores have remained for the most part higher than district scores. Parents, teachers and students have a more positive perspective regarding the Center as compared to their perspectives in previous years. The aggregate conclusion reached was that the Nova Center has yet to realize the uniqueness envisioned for the Center.
INTRODUCTION The Nova Center for Applied Research and Development (Nova Center) was implemented with the beginning of the 1996-97 school year. The establishment of the Nova Center was designed to ensure student achievement and instructional effectiveness at the four Nova schools. The goal of the Nova Center is to develop a centralized location for Broward County Public Schools (BCPS) in the areas of action research and development, professional development, and dissemination. The programs’ priorities, which are to be transferable for district dissemination, include academic achievement based upon identified programmatic and training needs. The Nova Center is to serve as the hub for the new

2
proposed Standards of Practice for Professional Development and is to directly support all major system priorities and missions. The ability to provide a much improved and more focused training and staff development process for the Broward County School system is to be achieved through ensuring student and staff accountability; attracting, retaining and training the best teachers, principals and support personnel; and enhancing utilization of technology. The importance of merging professional development and action research to improve the quality of education is well documented throughout the professional literature. The National Research Center on Student Learning reports that the one of the most important issues related to improved education is the combination of sound basic research and the actual practices of classroom teachers (Maloy, 1993). School restructuring and educational reform initiatives have been enhanced by action research investigations undertaken by teachers (Watt, & Watt, 1991). The involvement of teachers and schools in action research projects greatly enhances the research findings and makes them more applicable in the classroom (Maloy, 1993). Hansen (1996) documented the benefits of having students do research with other students and having teachers do research with other teachers within the science classroom. Action research conducted by teachers is one of the fastest-growing and most promising vehicles for positive change in schools today. By systematically studying their own practices within their classrooms and their school, teachers develop useful knowledge to further enhance student learning (Check, 1997). The technique of looping where students have the same teacher for two successive years has also been studied. It was documented that in general, looping students outperformed non-looping students (Burke, 1997; Yang, 1997). Another strategy that has been found to ensure continuous learning is multiage classrooms (Jones, 1996). The link between high quality, focused professional development, and improved student achievement is well researched. Helping teachers acquire and practice effective strategies needs to be merged with professional development activities that are linked to the district or school plan for strengthening teachers’ performance (New York City Public Schools, 1991). Improved classroom learning is characterized by teachers implementing what they learn during professional development training and empirically testing their knowledge in the classroom (Coladarci, 1982). The U.S. Department of Education’s 1997 Framework for Education Research, “Building Knowledge for a Nation of Learners”, states that an important function of professional development is to inform teachers with the results of research as well as actually engaging them in the actual research activities (Robinson, 1997).
3
Related Evaluation Findings A March 1998 BCPS evaluation of the Nova Center for Applied Research and Professional Development (Brown, 1998) was completed as a formative evaluation to document the first year and a half progress in implementing the Three-Year Implementation Plan for the Nova Center Redesign. The evaluation focused on the redesign as it affected the functioning of the four Nova schools. The evaluation revealed that the first year and a half were spent interpreting and implementing the 58 redesign recommendations for the Nova schools and redesigning the Human Resource Department. Findings suggested that administrators and faculty were still learning their new roles and working to carry out specialized functions. Conflicting views as to the role of Nova regarding research and professional development hindered progress towards reaching the full intent of the Nova Redesign. However, there were many strengths and milestones documented. During the first year, Nova implemented a centerwide School Improvement Team, centralized the budget, provided more leadership roles for teachers, and implemented a more equitable lottery admission process. Findings revealed that the students’ academic learning was not negatively impacted by the many changes that were accomplished during the first year of the redesign implementation. The chaos and confusion surrounding the first year of the redesign was shielded to a great extent from the students primarily because of the role of the team leaders providing assistance and support to students. The majority saw the creation of the team leader position as moving in the right direction to personalize educational and support services for students. Recommendations addressed the need to consider organizational changes, to define the vision for Nova and to clarify roles and responsibilities of school, area, and district staff. Further, an Ad Hoc committee was recommended to convene to visit the components of the Nova redesign. An Ad Hoc committee acted upon these recommendations during the 1998-99 school year.
Program Description Nova Center for Applied Research and Professional Development consists of a K-12 facility which includes the elementary level (grades K–5) – Nova Blanche Forman Campus and Nova Dwight Eisenhower Campus, the middle level (grades 6-8), the upper level (grades 9-12), the Adult/Community level, and the Human Resource Development Department for the School Board of Broward County. Collectively the elementary, middle and upper level schools serve over 5,400 students demographically representative of Broward County’s diverse student population, with a faculty consisting of 280 teachers. The Center’s mission is to establish a learning community in which Pre-K through postsecondary students receive a personalized, quality education; action research and development functions are initiated, implemented and disseminated systemwide; and
4
preservice and inservice professional development opportunities are provided throughout the district.
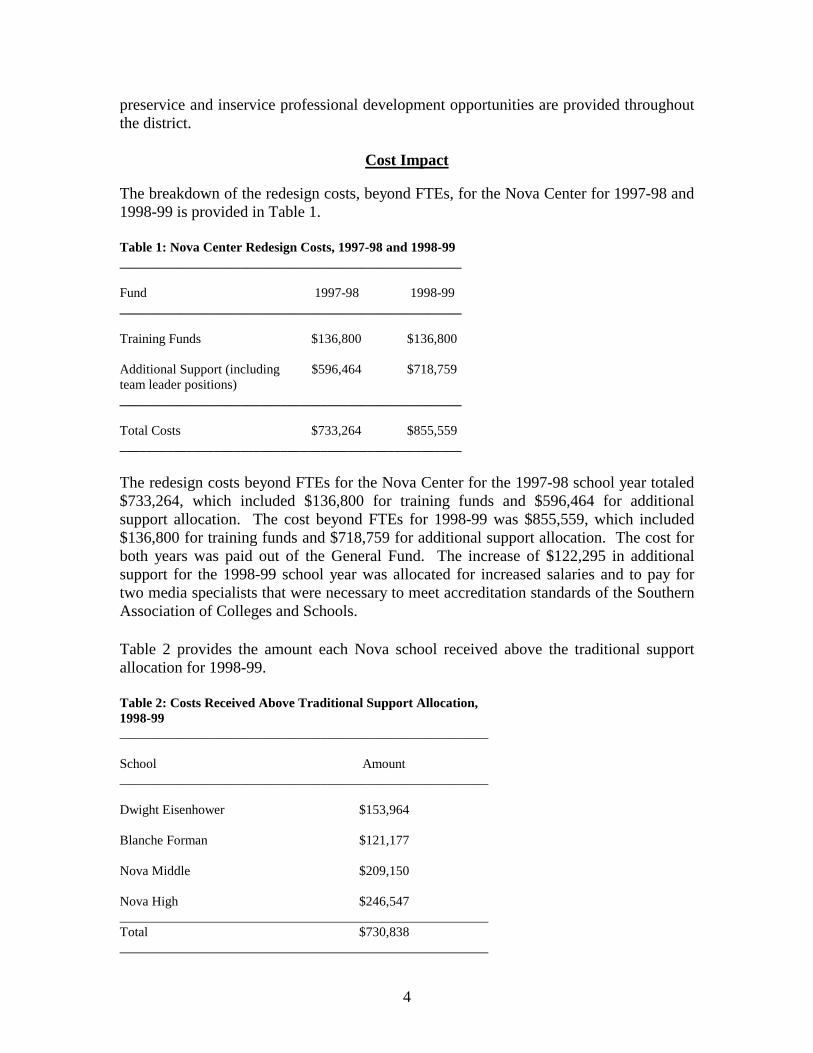
Cost Impact The breakdown of the redesign costs, beyond FTEs, for the Nova Center for 1997-98 and 1998-99 is provided in Table 1. Table 1: Nova Center Redesign Costs, 1997-98 and 1998-99 ___________________________________________________ Fund 1997-98 1998-99 ___________________________________________________ Training Funds $136,800 $136,800 Additional Support (including $596,464 $718,759 team leader positions) ___________________________________________________ Total Costs $733,264 $855,559 ___________________________________________________ The redesign costs beyond FTEs for the Nova Center for the 1997-98 school year totaled $733,264, which included $136,800 for training funds and $596,464 for additional support allocation. The cost beyond FTEs for 1998-99 was $855,559, which included $136,800 for training funds and $718,759 for additional support allocation. The cost for both years was paid out of the General Fund. The increase of $122,295 in additional support for the 1998-99 school year was allocated for increased salaries and to pay for two media specialists that were necessary to meet accreditation standards of the Southern Association of Colleges and Schools. Table 2 provides the amount each Nova school received above the traditional support allocation for 1998-99. Table 2: Costs Received Above Traditional Support Allocation, 1998-99 _______________________________________________________ School Amount _______________________________________________________ Dwight Eisenhower $153,964 Blanche Forman $121,177 Nova Middle $209,150 Nova High $246,547 _______________________________________________________ Total $730,838 _______________________________________________________
5
Including the 5% increase that was added to all school budgets for supplement raises, the Nova Center received a total of $730,838 more than other district schools using the traditional support allocation. This additional allocation is used primarily to fund the team leader positions. The amount allocated to each school was determined by the BCPS budget guidelines.
Purpose Of The Evaluation Report The purpose of this evaluation report is to continue to document the findings and recommendations of the progress in implementing the Three-Year Nova Center for Applied Research Development Design Plan. The evaluation highlights the second and third years’ implementation process and the observable results of the planned changes at the Nova schools through the 1998-99 school year. This evaluation addresses the following questions: 1. What have been the demographic characteristics of students who have applied to,
attended, or withdrawn from the Nova Schools? 2. What have been the suspension and alternative to external suspension program rates
for Nova Middle and Nova High school students? 3. What have been the demographic characteristics of the teachers compared to the
students at the Nova Center? 4. What has been the absence rate for the teachers at the Nova Center? 5. What has been the impact of the team leaders? 6. What new initiatives have been undertaken since the inception of the redesign? 7. What were the perspectives of students, parents, and faculty after three years of
implementation? 8. What impact did the redesign have on student performance on standardized achievement tests?
METHODS
Data Collection To gather information about the Nova Center’s Program, a combination of assessment approaches were utilized including site visit observation, interview, and survey. A review of pertinent local reports and handbooks, withdrawal requests, teacher handbooks, position descriptions, school improvement plans, budget information, grant applications, brochures, newsletters, and statistical data was completed. Personnel in the evaluation study included principals, parents, teachers, team leaders, ex-team leaders, and Broward

6
County School Board staff. Student interviews were scheduled on two separate occasions but were cancelled due to inclement weather and final exams.
Achievement Data Student achievement data reported in this study came from the administration of norm-referenced, standardized achievement tests. These tests were administered to students districtwide in grades two through twelve. Four years of achievement data were reported beginning with the 1995-96 school year and ending with the 1998-99 school year for those tests whose results were available for 1998-99 at the time of this report and for all others, three years data is provided.
Student, Parent, and Teacher Surveys Improving Our Schools Survey Written customer surveys were prepared by the Broward County School Board’s Research and Evaluation Department and were completed in the fall 1997 and again in the fall 1998. The 1997 distribution for the Nova Center was completed by 4,002 students, 408 parents, and 223 teachers. The completion and response rate for the 1998 distribution was 3,977 students (86%), 332 parents (17%), and 186 (67%) teachers. The upper and middle level teacher response rate for the 1998 distribution was noted as problematic as the response rate for Nova Middle and Nova High was 69% and 43% respectively. For the confidential parent survey, an unduplicated sampling frame for each Nova School included all parents of students attending each Nova school, K-12. Surveys were mailed to parents. The confidential student survey was administered during a specific class period to every student in grades 3-12. Every classroom teacher at each site was given the survey and asked to fill it out anonymously. The student, parent and teacher surveys were formatted with a five-point Likert scale to assess the respondent’s attitudes and satisfaction with their school. The surveys were divided into 12 sections: (a) Instructional Programs, (b) School Work and Teaching, (c) Teaching Processes, (d) Communication and Involvement, (e) Supervision of Students, (f) Student and Teacher Support, (g) Safety to and From School, (h) Safety at School, (i) Weapons, Gangs and Alcohol, (j) Physical Harm and Threat, (k) Neighborhood Safety, and (l) Satisfaction with School. Teacher/Team Leader Survey In the spring of 1998, a written survey related to team leaders and house/learning communities was distributed to all instructional personnel. The anonymous survey contained 29 open-ended questions and six questions related to demographic information. The response rate for teachers by level was 33 elementary (31%), 10 middle (13%), and 23 high schools (21%). Although these response rates were very low, findings from the surveys mirrored those found from the conduct of focus group interviews. This survey was conducted by personnel from the Nova Center, and was intended to serve alternative

7
purposes. Research and Evaluation staff “borrowed” their findings for the purposes of this evaluation.
Focus Groups Five separate focus groups were held with (a) middle and high school teachers, (b) middle and high school team leaders, (c) elementary teachers, (d) Nova Blanche Forman team leaders, and (e) Nova Dwight Eisenhower team leaders. A total of 19 (100%) of the current team leaders participated in the focus groups. Nine teachers (45% of a random sample of 20 teachers) from the four schools attended the teacher focus groups. The purpose of all of the focus groups was to obtain qualitative data and procure observations and feelings regarding the first three years of the implementation of the Nova Redesign including the team leader concept. Recommendations for improving the Nova Center were also solicited. Student focus groups were scheduled on two separate occasions but were cancelled due to inclement weather and final exams. However, 86% of the student body provided their input via the “Improving our Schools” survey.
Personal Interviews
Personal interviews were held with the Director of the HRD/Nova Center; the four principals of the Nova schools; the Grant Coordinator for the Nova Center; the Director of the School Boundaries, Desegregation and Student Assignment; and other selected district staff. The interviews contained an extensive fact-finding component regarding the first three years’ implementation of the Nova Redesign and the team leader concept. The purpose of the interviews was to gather general background information, historical statistics, programmatic details, funding data, documentation, impressions, and recommendations for change.
Telephone Interviews Telephone interviews were conducted with faculty who were previously, but no longer, team leaders. Of the 20 individuals who have left the position as team leader, 10 (50%) were selected to be interviewed - one from each elementary and four from both the high and the middle school. Telephone interviews were also completed with twenty parents, five from each school, who were randomly selected by ethnicity, student grade level and gender. The parent and ex-team leader interviews were conducted using a structured format in order to obtain their perspective regarding the Nova Center and the team leader concept. The Director of Magnet Programs was also interviewed to ascertain how the Nova Center coordinates with the Magnet Program.
Site Visits During the course of the evaluation, site visits were made to each of the four schools and to the Human Resource Department. The purpose of the visits was to interview selected staff, facilitate focus groups, and to observe students in the Center’s common area.

8
RESULTS 1. What have been the demographic characteristics of students who have applied to,
attended, or withdrawn from the Nova Schools? Waiting List During the 1996-97 school year, the Nova Waiting List remained intact and was used for admission procedures. The old Nova Waiting List was stopped in October 1996 and purged several times until the new admissions policy went into effect with the 1998-99 school year. The new policy established a more equitable admissions process between the existing Nova Waiting List students and new applicants wishing to obtain admission. With the new policy, the first 50% of students include siblings of students currently attending a Nova school and those on the old waiting list and does not consider diversity characteristics in determining admission acceptance. The remaining 50% of available seats by grade level are filled using an annual random selection process with special consideration given to years on the Nova Waiting List and underrepresented diversity groups. Figure 1 illustrates the significant decrease in the waiting list due to the discontinuation of the previous admission policy and purging of the waiting list. The waiting list numbers include children anywhere from birth to school age.
The waiting list has decreased from 23,169 in February 1996 to 7,355 in May 1999. The Office of School Boundaries, Student Assignment/Charter Schools/Summer Schools/Year Round Schools anticipates that the waiting list will decrease to approximately 3,000 for the 2000-01 school year. Table 3 provides the data for ethnic breakdown for new Nova applicants for 1998-99 and 1999-00. Figure 2 graphically depicts this data.
Figure 1: Nova's Waiting List 1996-1999
7,3559,67610,184
14,257
23,169
0
5,000
10,000
15,000
20,000
25,000
2//96 5//96 5//97 5//98 5//99
Dates
Stu
dent
s on
Wai
ting
Lis
t

9
Table 3: Ethnic Breakdown for New Nova Applicants, 1998-99 and 1999-00 ______________________________________________________________________ Ethnicity 1998-99 1999-00 % Increase ______________________________________________________________________ Black 40 34 -6% White 29 31 +2% Hispanic 15 17 +2% Asian 6 7 +1% Multiracial 9 9 ----- American Indian 1 2 +1% ___________________________________________________________
The ethnic breakdown for new applicants for 1998-99 and 1999-00 was examined to determine if there was a change in the ethnicity of students applying for the Nova Center. The data indicates that there was a 6% decrease in black and 2% increase in white and Hispanic students applying to the Nova schools from the 1998-99 to the 1999-00 school year. Admissions For the 1998-99 year, there were a total of 9,669 school age students in the pool of applicants for K-12. Of those, a total of 946 students were offered admission and of that number 739 (78%) accepted. Of the students in the applicant pool, 1,099 (11%) had siblings attending Nova. There were 273 students who had siblings that were accepted (37% of those accepted) which was a 13% increase from the 1997-98 school year. The gender breakdown for those entering in 1998-99 was 47% male and 53% female. Ethnic breakdown was white (50%), black (30%), Hispanic (9%), Asian (4%), multiracial
F i g u r e 2 : E t h n i c i t y o f N e w A p p l i c a n t s , 1 9 9 8 - 9 9 a n d 1 9 9 9 - 0 0
4 0
2 9
1 5
69
1
3 43 1
1 7
79
2
0
5
1 0
1 5
2 0
2 5
3 0
3 5
4 0
4 5
B l a c k W h i t e H i s p a n i c A s i a n M u l t i r a c i a l A m e r i c a nI n d i a n
E t h n i c i t y
Per
cent
age
1 9 9 8 - 9 9
1 9 9 9 - 0 0

10
(6%), and American Indian (1%). Further data related to the 1998-99 Nova pool and acceptances is provided in Appendix A. Enrollment The 20th day membership report for 1998-99 reveals that the Nova Center had 5,552 students enrolled with 2,073 (37%) enrolled in the upper level, 1,534 (28%) in the middle level, and 1,945 (35%) in the elementary level. The ethnic breakdown of the student enrollment for 1998-99 for the entire Nova Center was white (54%), black (29%), Hispanic (11%), Asian (5%), American Indian (0.2%), and multiracial (0.3%). Table 4 provides a breakdown of the 20th day membership enrollment broken down by ethnicity and school since the first year of the redesign.

11
Table 4: Enrollment Breakdown by Ethnicity and School, 1996-97 through 1998-99 ___________________________________________________________________________________ American Multi- School Year White Black Hispanic Asian Indian Racial Total ___________________________________________________________________________________ Blanche 1996-97 516 285 87 40 0 0 928 Forman (56%) (31%) (9%) (4%) (0%) (0%) 1997-98 511 302 98 48 0 0 959
(53%) (32%) (10%) (5%) (0%) (0%) 1998-99 520 300 103 55 0 0 978
(53%) (31%) (11%) (6%) (0%) (0%) ___________________________________________________________________________________ Dwight 1996-97 521 327 65 44 2 1 960 Eisenhower (54%) (34%) (7%) (5%) (0.2%) (0.1%) 1997-98 513 327 78 31 2 4 955
(54%) (34%) (8%) (3%) (0.2%) (0.4%) 1998-99 485 316 111 37 3 15 967
(50%) (33%) (11%) (4%) (0.3%) (2%) ___________________________________________________________________________________ Nova 1996-97 904 385 143 64 4 0 1,500 Middle (60%) (26%) (10%) (4%) (0.3%) (0%) 1997-98 854 426 166 71 1 2 1,520
(56%) (28%) (11%) (5%) (0.1%) (0.1%) 1998-99 820 445 190 76 1 2 1,534
(53%) (29%) (12%) (5%) (0.1%) (0.1%) ___________________________________________________________________________________ Nova 1996-97 1,105 514 139 132 2 0 1,892 High (58%) (27%) (7%) (7%) (0.1%) (0%) 1997-98 1,169 563 224 136 5 1 2,098
(56%) (27%) (11%) (7%) (0.1%) (0%) 1998-99 1,167 540 230 128 8 0 2,073
(56%) (26%) (11%) (6%) (0.4%) (0%) ____________________________________________________________________________________ The increase in enrollment since the baseline year was 9% at the upper level, 2% at the middle level, 5% at Nova Blanche Forman and less than 1% at Nova Dwight Eisenhower. Over the last three school years, the white population has decreased minimally in the elementary (3%-4%) and the upper levels (2%) while the middle level decreased 7%. During the same time period, the black population increased 3% at the middle level but
12
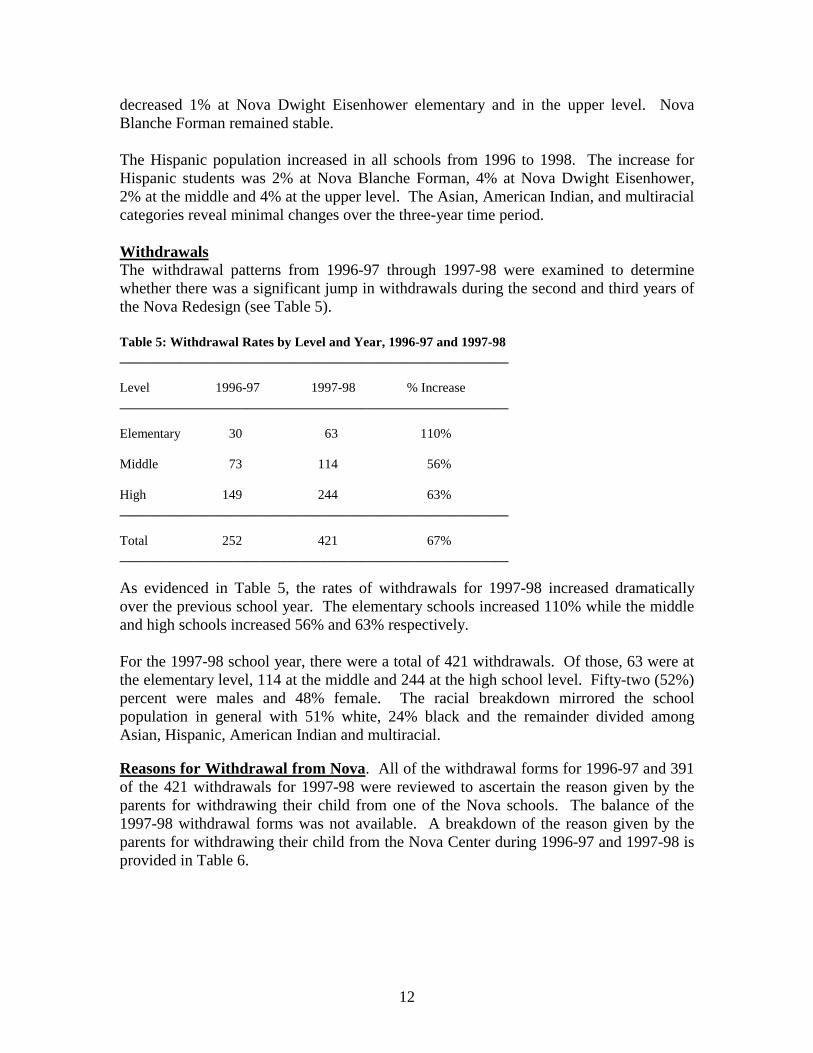
decreased 1% at Nova Dwight Eisenhower elementary and in the upper level. Nova Blanche Forman remained stable. The Hispanic population increased in all schools from 1996 to 1998. The increase for Hispanic students was 2% at Nova Blanche Forman, 4% at Nova Dwight Eisenhower, 2% at the middle and 4% at the upper level. The Asian, American Indian, and multiracial categories reveal minimal changes over the three-year time period. Withdrawals The withdrawal patterns from 1996-97 through 1997-98 were examined to determine whether there was a significant jump in withdrawals during the second and third years of the Nova Redesign (see Table 5). Table 5: Withdrawal Rates by Level and Year, 1996-97 and 1997-98 __________________________________________________________ Level 1996-97 1997-98 % Increase __________________________________________________________ Elementary 30 63 110% Middle 73 114 56% High 149 244 63% __________________________________________________________ Total 252 421 67% __________________________________________________________ As evidenced in Table 5, the rates of withdrawals for 1997-98 increased dramatically over the previous school year. The elementary schools increased 110% while the middle and high schools increased 56% and 63% respectively. For the 1997-98 school year, there were a total of 421 withdrawals. Of those, 63 were at the elementary level, 114 at the middle and 244 at the high school level. Fifty-two (52%) percent were males and 48% female. The racial breakdown mirrored the school population in general with 51% white, 24% black and the remainder divided among Asian, Hispanic, American Indian and multiracial. Reasons for Withdrawal from Nova. All of the withdrawal forms for 1996-97 and 391 of the 421 withdrawals for 1997-98 were reviewed to ascertain the reason given by the parents for withdrawing their child from one of the Nova schools. The balance of the 1997-98 withdrawal forms was not available. A breakdown of the reason given by the parents for withdrawing their child from the Nova Center during 1996-97 and 1997-98 is provided in Table 6.
13
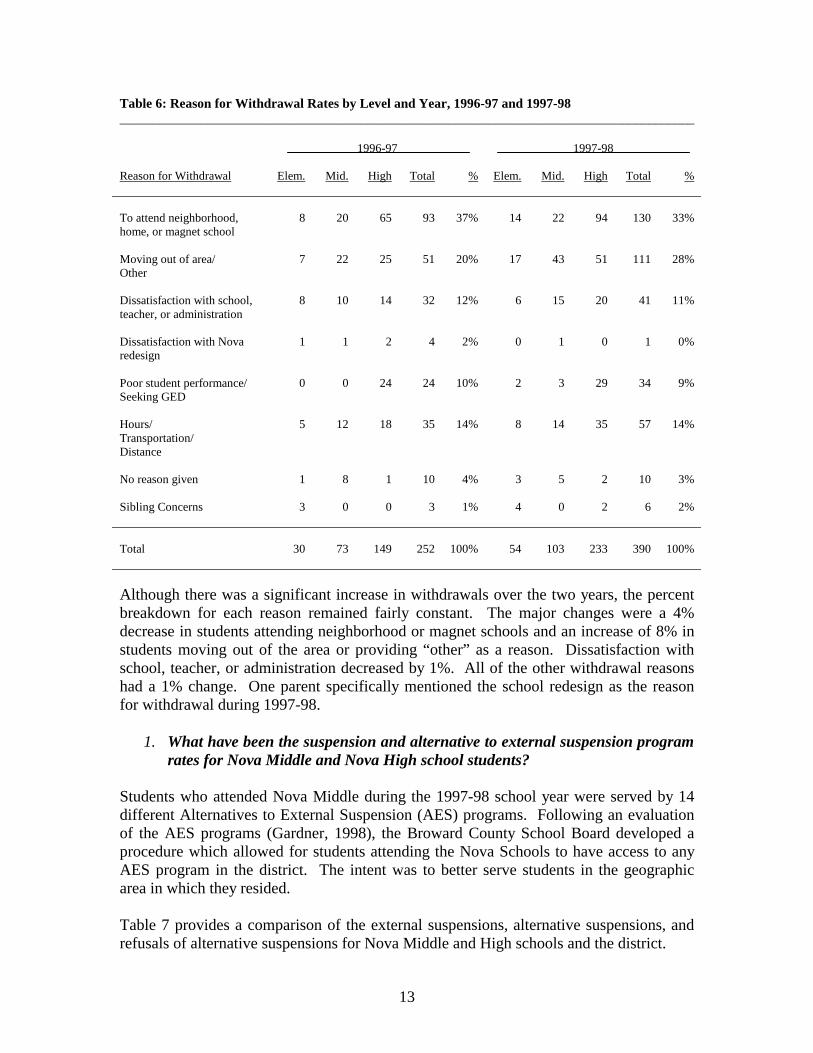
Table 6: Reason for Withdrawal Rates by Level and Year, 1996-97 and 1997-98 ______________________________________________________________________________________ 1996-97 1997-98
Reason for Withdrawal Elem. Mid. High Total % Elem. Mid. High Total %
To attend neighborhood, home, or magnet school
8
20
65
93
37%
14
22
94
130
33%
Moving out of area/ Other
7 22 25 51 20% 17 43 51 111 28%
Dissatisfaction with school, teacher, or administration
8 10 14 32 12% 6 15 20 41 11%
Dissatisfaction with Nova redesign
1 1 2 4 2% 0 1 0 1 0%
Poor student performance/ Seeking GED
0 0 24 24 10% 2 3 29 34 9%
Hours/ Transportation/ Distance
5 12 18 35 14% 8 14 35 57 14%
No reason given
1 8 1 10 4% 3 5 2 10 3%
Sibling Concerns
3 0 0 3 1% 4 0 2 6 2%
Total
30
73
149
252
100%
54
103
233
390
100%
Although there was a significant increase in withdrawals over the two years, the percent breakdown for each reason remained fairly constant. The major changes were a 4% decrease in students attending neighborhood or magnet schools and an increase of 8% in students moving out of the area or providing “other” as a reason. Dissatisfaction with school, teacher, or administration decreased by 1%. All of the other withdrawal reasons had a 1% change. One parent specifically mentioned the school redesign as the reason for withdrawal during 1997-98.
1. What have been the suspension and alternative to external suspension program rates for Nova Middle and Nova High school students?
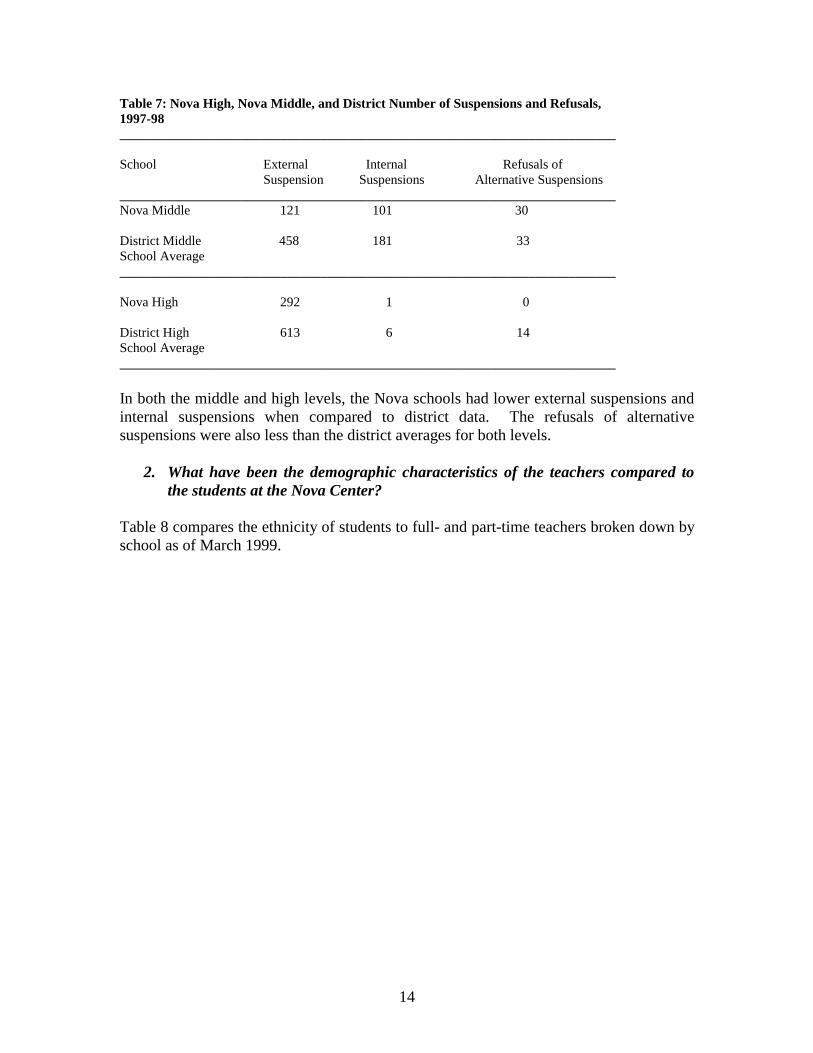
Students who attended Nova Middle during the 1997-98 school year were served by 14 different Alternatives to External Suspension (AES) programs. Following an evaluation of the AES programs (Gardner, 1998), the Broward County School Board developed a procedure which allowed for students attending the Nova Schools to have access to any AES program in the district. The intent was to better serve students in the geographic area in which they resided. Table 7 provides a comparison of the external suspensions, alternative suspensions, and refusals of alternative suspensions for Nova Middle and High schools and the district.
14
Table 7: Nova High, Nova Middle, and District Number of Suspensions and Refusals, 1997-98 __________________________________________________________________________ School External Internal Refusals of
Suspension Suspensions Alternative Suspensions __________________________________________________________________________ Nova Middle 121 101 30 District Middle 458 181 33 School Average __________________________________________________________________________ Nova High 292 1 0 District High 613 6 14 School Average __________________________________________________________________________ In both the middle and high levels, the Nova schools had lower external suspensions and internal suspensions when compared to district data. The refusals of alternative suspensions were also less than the district averages for both levels.
2. What have been the demographic characteristics of the teachers compared to the students at the Nova Center?
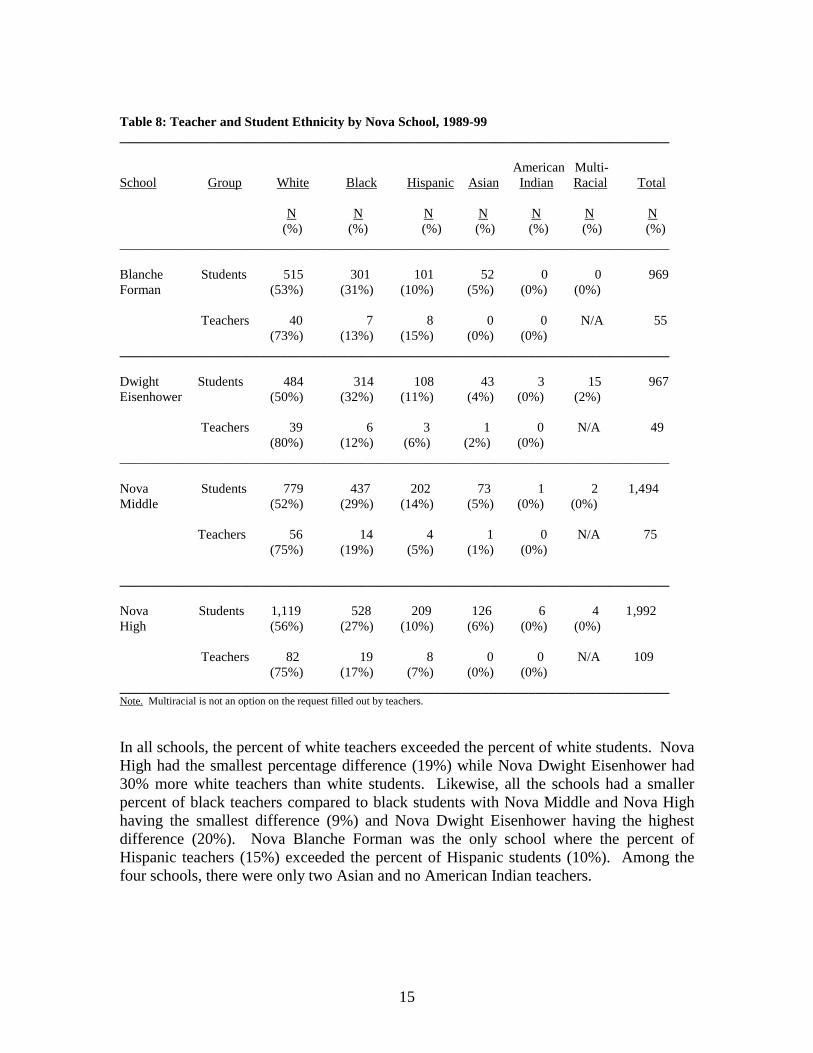
Table 8 compares the ethnicity of students to full- and part-time teachers broken down by school as of March 1999.
15
Table 8: Teacher and Student Ethnicity by Nova School, 1989-99 __________________________________________________________________________________ American Multi- School Group White Black Hispanic Asian Indian Racial Total N N N N N N N
(%) (%) (%) (%) (%) (%) (%) __________________________________________________________________________________ Blanche Students 515 301 101 52 0 0 969 Forman (53%) (31%) (10%) (5%) (0%) (0%) Teachers 40 7 8 0 0 N/A 55
(73%) (13%) (15%) (0%) (0%) __________________________________________________________________________________ Dwight Students 484 314 108 43 3 15 967 Eisenhower (50%) (32%) (11%) (4%) (0%) (2%) Teachers 39 6 3 1 0 N/A 49
(80%) (12%) (6%) (2%) (0%) __________________________________________________________________________________ Nova Students 779 437 202 73 1 2 1,494 Middle (52%) (29%) (14%) (5%) (0%) (0%) Teachers 56 14 4 1 0 N/A 75
(75%) (19%) (5%) (1%) (0%)
__________________________________________________________________________________ Nova Students 1,119 528 209 126 6 4 1,992 High (56%) (27%) (10%) (6%) (0%) (0%) Teachers 82 19 8 0 0 N/A 109
(75%) (17%) (7%) (0%) (0%) __________________________________________________________________________________ Note. Multiracial is not an option on the request filled out by teachers.
In all schools, the percent of white teachers exceeded the percent of white students. Nova High had the smallest percentage difference (19%) while Nova Dwight Eisenhower had 30% more white teachers than white students. Likewise, all the schools had a smaller percent of black teachers compared to black students with Nova Middle and Nova High having the smallest difference (9%) and Nova Dwight Eisenhower having the highest difference (20%). Nova Blanche Forman was the only school where the percent of Hispanic teachers (15%) exceeded the percent of Hispanic students (10%). Among the four schools, there were only two Asian and no American Indian teachers.
16
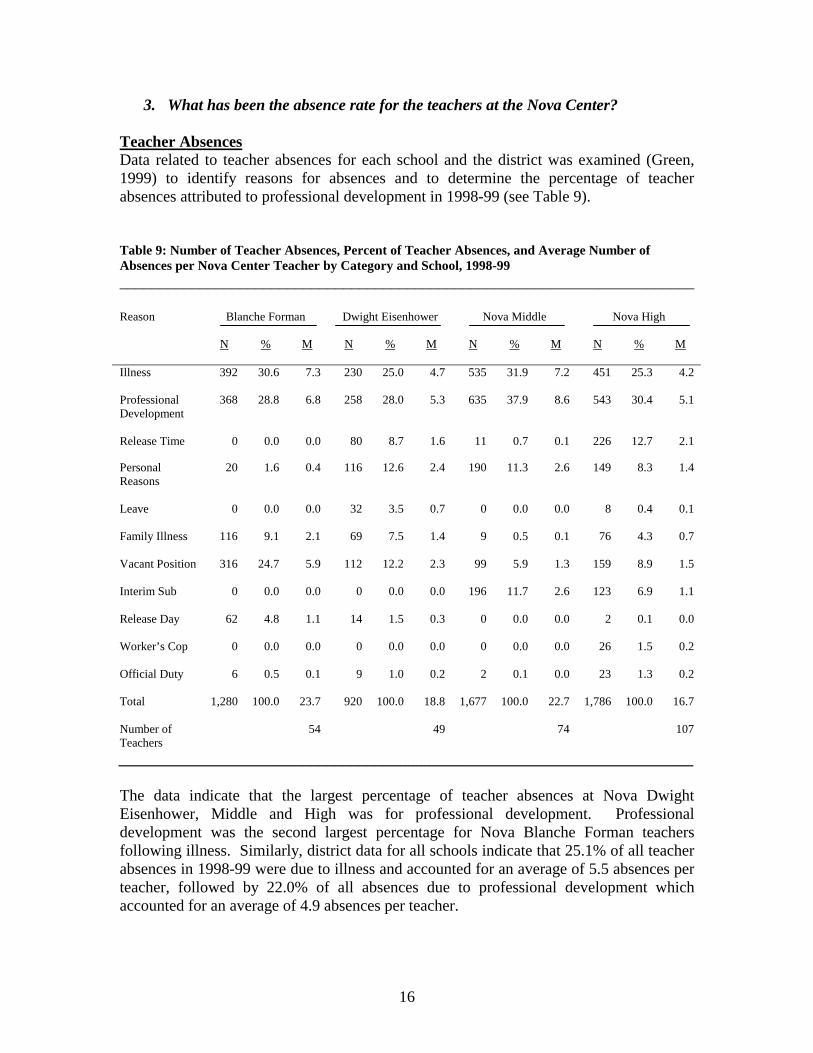
3. What has been the absence rate for the teachers at the Nova Center? Teacher Absences Data related to teacher absences for each school and the district was examined (Green, 1999) to identify reasons for absences and to determine the percentage of teacher absences attributed to professional development in 1998-99 (see Table 9). Table 9: Number of Teacher Absences, Percent of Teacher Absences, and Average Number of Absences per Nova Center Teacher by Category and School, 1998-99 ________________________________________________________________________ Reason Blanche Forman Dwight Eisenhower
Nova Middle Nova High
N % M N % M N % M N % M
Illness
392 30.6 7.3 230 25.0 4.7 535 31.9 7.2 451 25.3 4.2
Professional Development
368 28.8 6.8 258 28.0 5.3 635 37.9 8.6 543 30.4 5.1
Release Time 0 0.0 0.0 80 8.7 1.6 11 0.7 0.1 226 12.7 2.1
Personal Reasons
20 1.6 0.4 116 12.6 2.4 190 11.3 2.6 149 8.3 1.4
Leave
0 0.0 0.0 32 3.5 0.7 0 0.0 0.0 8 0.4 0.1
Family Illness
116 9.1 2.1 69 7.5 1.4 9 0.5 0.1 76 4.3 0.7
Vacant Position
316 24.7 5.9 112 12.2 2.3 99 5.9 1.3 159 8.9 1.5
Interim Sub
0 0.0 0.0 0 0.0 0.0 196 11.7 2.6 123 6.9 1.1
Release Day
62 4.8 1.1 14 1.5 0.3 0 0.0 0.0 2 0.1 0.0
Worker’s Cop
0 0.0 0.0 0 0.0 0.0 0 0.0 0.0 26 1.5 0.2
Official Duty
6 0.5 0.1 9 1.0 0.2 2 0.1 0.0 23 1.3 0.2
Total
1,280 100.0 23.7 920 100.0 18.8 1,677 100.0 22.7 1,786 100.0 16.7
Number of Teachers
54 49 74 107
________________________________________________________________________ The data indicate that the largest percentage of teacher absences at Nova Dwight Eisenhower, Middle and High was for professional development. Professional development was the second largest percentage for Nova Blanche Forman teachers following illness. Similarly, district data for all schools indicate that 25.1% of all teacher absences in 1998-99 were due to illness and accounted for an average of 5.5 absences per teacher, followed by 22.0% of all absences due to professional development which accounted for an average of 4.9 absences per teacher.

17
Table 10 provides the number of total absences per teacher, and the percent and average number of absences per teacher for professional development by school and district for 1998-99. Table 10: Teacher Absences for Professional Development by School and District, 1998-99 Level School Number
of Teachers
Total Absences/ Teacher
Percent for
Illness
Absences/ Teacher
for Illness
Percent for Prof.
Dev.
Absences/ Teacher for Prof.
Dev.
Elementary Blanche Forman 54 23.7 30.6 7.3 28.8 6.8
Dwight Eisenhower
49 18.8 25.0 4.7 28.0 5.3
District 5,933 22.8 26.5 6.0 23.3 5.3
Middle Nova Middle 74 22.7 31.9 7.2 37.9 8.6
District 2,616 26.4 22.1 5.8 19.5 5.2
High Nova High 107 16.7 25.3 4.2 30.4 5.1
District 2,691 15.8 27.9 4.4 23.0 3.6
As indicated in Table 10, the percent of Nova teachers absent for illness at Nova Blanche Forman and Nova Middle exceeds the percent of absences for illness of district teachers. Nova Dwight Eisenhower and Nova High have a smaller percent of teachers absent for illness than the district. The percent of Nova teacher absences for professional development at all levels exceeded the percent of absences for professional development of district teachers. 5. What has been the impact of the Team leader positions? Background To provide for personalization and a more holistic delivery of student services, each of the four Nova schools implemented a learning community model in 1996. In this Model for Student Support, one support staff/team leader is responsible for providing ESE and guidance services to approximately 225 students as opposed to the traditional model of one guidance counselor/ESE specialist per 900 students. The team leaders provide direct support to teachers and students and facilitate optimal student achievement by serving as the point person to provide information about curriculum, guidance, ESE, ESOL, and classroom support. The team leader job description lists 17 separate performance responsibilities which include support and leadership, design and implementation of curriculum and instructional strategies, counseling of students, providing support to teachers and parents, participating on project management teams, researching and evaluating programs, and various other administrative and support functions. In 1998-99 the function of providing discipline was removed from the team leaders responsibilities and in 1999-00 the function of being the Nova Link will be removed.

18
Team leaders have an extended contract for eleven months and are paid according to the teacher salary schedule. The qualifications for a team leader as identified in the official job description are a Bachelor’s degree with a specialization in curriculum and/or guidance and/or Exceptional Student Education with five years of satisfactory teaching experience which includes two years of supervisory experience. The supervisory experience may come from being a team leader, department chairperson, grade chairperson, guidance director or the equivalent. There are currently 20 team leader positions assigned to the Nova Center, four at each elementary, seven at the middle level, and nine at the high school level. Principals have had the flexibility to make individual team leader positions responsible for special functions. One team leader position is used solely for ESE functions at the middle school and one position is allocated solely for guidance at the high school level. At the end of the 1998-99 school year, one team leader position at Nova Blanche was vacant. At the two elementary schools, team leaders are responsible for their “house” with a primary goal of “growing with” their assigned students from kindergarten through fifth grade. At the middle and high schools, team leaders are assigned to learning communities of teachers and students. There is no consistency among the four schools regarding how much of the team leader’s time is spent in the classroom. Team leaders at Nova Blanche conduct reading groups for 90 minutes each day while there is no set time allotted at the three other schools for classroom activities. Team leaders at the middle school try to visit every class every day and assist the teacher with learning activities such as labs on alternate days. Turnover The turnover in the team leader positions has been high with only one of the original team leaders at both the middle and high school still remaining in the position at the end of the 1998-99 school year. The team leader turnover breakdown by school and outcome of transfer is delineated in Table 11. Table 11: Team Leader Turnover by School and Outcome, 1996-97 through 1998-99 ________________________________________________________________________ School Promoted Lateral Demotion Total ________________________________________________________________________ Blanche Forman 2 0 0 2 Dwight Eisenhower 1 2 0 3 Nova Middle 3 3 0 6 Nova High 7 1 1 9 ________________________________________________________________________ Total 13 6 1 20 ____________________________________________________________

19
Since the inception of the team leader position in 1996, there have been 20 team leaders who have left their position. Of those that have left, 65% were promoted, 30% took lateral transfers within the district, and 5% were demoted. The Team Leader innovation has not produced to date the critical level of input needed to produce exportable research studies that can be viewed as crucial by other staffs in the district.
Focus Groups/Interviews Participants Interviews or focus groups were held with a cross section of individuals involved in the team leader concept including 100% of the current team leaders, 50% of individuals who had left the team leader position, four Nova principals, 9 teachers and 20 parents. Of the ten ex-team leaders interviewed, nine had started as a team leader during the first year (1996) and one started in the position in 1997. Six were promoted and four voluntarily chose on their own to take a lateral transfer within the district. The average time spent in the team leader position was 1.55 years. Of the four who assumed lateral transfers, two wanted to return to being a guidance counselor full-time, one chose a district job for career growth, and one went to a district job because of concern whether the team leader position would be refunded. Fifty percent of the ex-team leaders stated they were happy in the team leader position, but wanted to either take a lateral position or move into an Assistant Principal position. These five individuals stated there was nothing that could have been changed to make them remain in the position. The remaining five individuals stated that increased pay, reduced hours and a smaller workload would have made them reconsider their decision to leave the position. The majority of current and ex-team leaders interviewed stated that they enjoyed the job and felt that the goals of the position helped to personalize students’ education. There was unanimous agreement among everyone interviewed that the team leader concept has become more effective than it was during the initial years; however, there was consensus that the position still needed ongoing restructuring and job function refinement. The majority felt that the job duties of the team leader position were too extensive and that the position needed to be more focused and structured. The feeling was that everyone saw the job duties differently within each school and across campuses which led to confusion regarding setting priorities and being able to accomplish a multitude of different tasks. There was concern voiced that the job description does not correlate with actual job duties of the position. Strengths of the team leader position were viewed as smaller student:team leader ratio compared to other schools, being able to have a holistic view of the assigned children, greater personalization and involvement in all aspects of the student’s life (i.e., academics, behavior, etc.), and excellent preparation for being promoted to an Assistant Principal position.

20
Weaknesses of the position were seen as having to conduct administrative duties that took time away from working with students, no job specific training for new team leaders, insufficient clerical support, too many job responsibilities (i.e., hall, bus, and lunch duty; department head responsibilities; working with parents; ESE staffings; Nova Link, etc.). Further, it was felt that the guidance function was overshadowed by the amount of work involved in ESE functions, especially at the middle and high school levels. There was consensus that the in-depth knowledge and expertise needed for ESE requirements that have changed three times in the last three years made that function of the job difficult. Approximately half of those interviewed felt that the guidance and ESE functions should be removed from the team leaders’ job duties and placed back with guidance and ESE specialists. When ex-team leaders were questioned regarding whether the workload of the team leader position was realistic, 40% stated it was unrealistic while 20% stated it was realistic. Forty percent also stated that initially the job was overwhelming, but that it got better with time and experience. Of the current team leaders, the majority felt that the workload was unrealistic and excessive. These team leaders felt they needed to be everything to everybody and could not adequately address all of the multiple demands. There was no consensus among the principals regarding the workload. A decline in communication among the team leaders from the four schools was evident. During 1996-97, the team leaders met often as a center; however, with each succeeding year, the amount of communication among schools comprising the Nova Center has dwindled. There has not been any one person who has assumed the center-wide responsibility for clarifying team leader responsibilities throughout the Nova Center. The role of the Nova Zone Facilitator was unclear regarding their responsibility to meld support among the Nova team leaders. Overall, teachers at the middle and high schools felt positive about the team leader positions, and felt that team leaders provided a positive service to students. Elementary teachers were less positive about the role team leaders played in assisting teachers and students. They felt team leaders spent the majority of their time completing administrative work. Teachers at all three levels felt that guidance was an area that was lacking attention due to the multiple demands of the team leader. Teachers at the high school level wanted team leaders to be more involved in discipline while elementary teachers wanted team leaders to serve more as a buffer between teachers and administration. All the team leaders past and present, who were in the position in 1996, viewed the initial year’s training as extensive and helpful. The majority was concerned with the lack of specific team leader training that is occurring for new hires. Half (50%) of the parents felt that the team leader concept was successful, 10% felt it was unsuccessful, and 40% had no opinion. The parents of the elementary students rated the team leader concept higher than middle and high school parents. Elementary parents

21
recommended that team leaders needed more counseling expertise and needed to be more accountable. Middle school parents felt that team leaders needed to have less responsibility, more authority, and more classroom interaction with students. When asked what the primary factor was that accounted for the lack of stability in the position, there was unanimous agreement among all interviewed that the position is a good training ground to become an Assistant Principal. In fact, it was repeatedly mentioned that the majority of the original people hired for the team leader position had aspirations to become Assistant principals or work at the district level. Suggestions on how to maintain greater stability in the position included financial incentives to stay and not hiring individuals with strong desires to move into administrative positions in the near future. There was no consensus among the principals related to the long-term viability of the team leader position. Opinions included deleting the positions and adding more teachers, providing more support staff to relieve the team leaders of some of the ESE functions, and having specialized ESE and guidance staff rather than having all functions invested in the team leader position. Current and ex-team leaders made the following recommendations to make the team leader concept more effective: deletion of all disciplinary and extraneous responsibilities (i.e. cafeteria, bus, and morning duty), re-evaluation of the feasibility of guidance and ESE functions being done by team leaders, clearer definition of the job, increased conversations between grade level and site team leaders, and job-specific training during the summer for new hires. There was no consensus whether the team leaders should receive an increase in pay. Several individuals recommended that the name “team leader” be changed since it is synonymous with grade chairs in the upper levels. It was suggested that if the team leader position is replicated in the district, then it should initially be tried with one position and located in an underperforming school. Teacher/Team Leader Survey Of the 66 instructional staff that returned the survey, 54 (82%) were classroom teachers, 7 (11%) were team leaders, 4 (6%) were ESE resource teachers, and 1 (2%) was a resource teacher in another area. Survey findings mirrored those revealed during focus groups and interviews. Overall, responses by elementary and middle school staff were more favorable towards team leaders as compared to responses from the high school staff. Team leaders’ roles were seen as facilitating learning and helping to implement or improve strategies for student achievement. The heavy emphasis on administrative and ESE tasks were noted throughout the responses. Overwhelmingly, all levels wanted team leaders to provide more individualized student attention and time in the classroom. The most significant contribution of the team leader position was seen as support to students and parents. The elementary and middle level teachers noted that a major contribution of their team leaders was that they kept all stakeholders focused. Thirty-five

22
(35%) of the high school responses stated no significant contribution was provided by the team leaders. The least significant contribution was seen as a lack of time and direct involvement with students. Recommendations included increased visibility and classroom involvement with less outside work and paperwork. 6. What new initiatives have been undertaken since the inception of the redesign? Several key actions were implemented to maintain the redesigned Nova. The following highlight the most significant changes that occurred: Revised Redesign During the second year of the redesign, an Ad Hoc Strategic Vision Committee was developed which consisted of administrators, district staff, community members, and parents but did not include teachers. The original 58 recommendations were seen as too fragmented, too massive in scope, and included many governing issues that were not seen as significant in terms of the mission of the Center. The Ad Hoc Committee condensed the original redesign into 10 new recommendations (see Appendix B). The goal of the new recommendations was to create continuous progress and implement programs to improve student learning. The intention of the new recommendations was to have the focus of the Nova Center returned to the classroom and individual schools instead of on the Center organization and structure. Budget During the first two years of the Nova redesign, the four schools maintained a centralized budget. The third year saw the budget decentralized except for K-12 functions that mirrored the vision of the Center. For the 1999-00 year, the only two K-12 functions that will continue to have a centralized budget will be accountability and professional development activities. Personnel Structure During the 1997-98 school year, the administration was changed so that the South Area Superintendent provided operational supervision of the four principals. The Director of HRD/Nova Center was charged with “indirect supervision” over the Nova Center for Professional Development. Operational supervision of the Nova Center along with all charter schools will be transferred to the North Central Area Superintendent beginning with the 1999-00 school year. Each of the four principals continue to have traditional daily operational job functions as well as direct supervision of at least one assistant principal, and also directs a specialized K-12 administrative responsibility for the Nova Center (i.e., Accountability, Professional Development, Research, or Curriculum & Assessment). The four principals have mutually agreed upon the division of the K-12 responsibilities. The principal over Curriculum & Assessment was designated as the Zone Facilitator and calls monthly meetings of principals. These meeting include the principal of William T. McFatter Vocational-Technical Center.
23
Professional Development The district vision for staff development is a coordinated system of standards-based, job-embedded, and collaborative adult learning activities, which builds a culture of continuous improvement resulting in increased student achievement and school effectiveness. The role of HRD at Nova is to assist the four Nova schools with initiating, implementing, and disseminating results-driven professional development models. The Nova Center’s 1998-99 K-12 School Improvement Plan addresses the role of the Center in the provision of training and information to schools throughout Broward County on models of effective instructional practices for increasing student achievement. The four Nova Center schools participate in a coordinated K-12 professional development plan with a centralized budget to achieve a more efficient utilization of resources. There is an additional $136,000 allocated for staff development for the Nova Center above that of other schools in the district. These training dollars are for Nova Center personnel and are not used for training activities involving other teachers in the district. Each of the Nova schools are involved in results driven professional development utilizing one of the following models: Job Embedded Training Team, Community Action Groups/Study Groups, or Pre-Service/In-Service Co-Teaching Pilot. Some of the district initiatives that the Nova Center has piloted include curriculum assessment, literacy folders, electronic report cards, employee schedule, electronic technology inventory, seamless innovation zone model, Panasonic Foundation Partnership, Behavior Change Program, and Bridge Project. The dissemination of training is an area that is recognized as needing further development. The Myron Ashmore Resource Center is located at the high school and serves as a staff development resource facility. The Center provides a clearinghouse for district staff in relation to the evaluation of technologies for classroom use. South Florida Annenberg Challenge Grants During the 1998-99 school year, the Broward County Educational Consortium, in partnership with the Coulter Corporation and the Nova Center for Applied Research and Professional Development, was awarded $24,981 over a six-month period from the South Florida Annenberg Challenge to be matched by $15,144 from public resources (Nova Center). The implementation grant was followed by the awarding of $449,920 to establish the Broward County Academy for Teacher Excellence. The Academy will focus on increasing teacher effectiveness to improve student achievement among Broward County’s students. The primary goal of the Academy is to raise student achievement of K-12 students throughout Broward County, beginning with the Nova public schools, and the dissemination of effective instructional practices throughout the district in the areas of mathematics, reading, and writing. To accomplish this goal, the Academy will focus on increasing the skill level and effectiveness of

24
teachers as well as raising the level of competence of preservice students and entry-level teachers. The Professional Development Initiative was established in 1998 through a partnership between the Florida Department of Education, the South Florida Annenberg Challenge and the Broward, Palm Beach, and Miami-Dade School Districts. This Initiative will provide professional development activities to support student achievement by focusing on three areas: Professional Development, Incentives and Rewards, and Technology. Action Research Action research is defined by the School Board’s Human Resource Department as conducting research within a program, school, or classroom when the program is operational by unobtrusively looking at the action/processes that are going on within that program, school, or classroom (Broward County School Board, 1998). Community Action Groups/Study Groups have been initiated at all four Nova Center schools to examine individual and collective team practices, strategies, and methodologies. The research teams have received training in basic action research awareness from post-secondary partners. A generic Research Program Considerations document was developed in collaboration with the Broward County Educational Consortium for the purpose of aligning research project formats with district standards. Further, a Nova Center Research Guide was developed to provide a framework for qualitative action research and will be distributed to teachers starting this summer. The following research projects have been initiated:
• Multiage Classrooms/Peer Monitoring • Learning Communities (Elementary House Structures) • E-Mate Technology Support • Block Schedule • Teaming for Student Achievement • Teams Leaders and Student Achievement • Job Embedded Staff Development • Professor in Residence Program
Three grants, the Professor in Residence Program and two Annenberg Challenge Grants were received by the Nova Center to assist with research activities. The Professor in Residence Program, located at the high school, funds a professor from Florida International University who provides assistance and guidance with action research projects. Grants from the Annenberg Challenge included a planning grant and an implementation grant. Over a two-year period, the Annenberg Implementation Grant will enable the formation of the Broward County Academy for Teaching Excellence, which will focus on the study, alignment, assessment and dissemination of effective teaching practices.

25
The Nova Innovation Zone Newsletter, which has a research focus, was begun in 1998-99 and is provided quarterly to the academic community to describe research initiatives being undertaken at the Nova Center. To date, minimal dissemination of research activities has occurred. Research and dissemination activities to date do not provide evidence of the Nova Center’s uniqueness or ability to promote change among other schools in the district. Block Scheduling Block scheduling was implemented in some form at all of the Nova schools during 1998-99. Both elementary schools have a block schedule for all grades for reading and language arts. In addition, Nova Dwight Eisenhower has mathematics in a block format. Nova Middle school implemented a 3 X 3 block schedule model wherein students attend three classes one day and another three classes on alternate days. Nova High implemented an A/B Block schedule where every student has three one hundred-minute classes each day, as well as a constant 50 minute seventh period class. Nova Zone and Nova Network In an effort to promote unity and maintain a common vision for students throughout the Nova Innovation Zone, the four Nova schools have merged their individual school improvement processes and plans into one global Innovation Zone Improvement Process and Plan. Facilitated by the Principal in charge of Accountability, the process also includes one budget for Accountability funds throughout the Center. The Nova Network is the established Nova Innovation Zone working group consisting of parents, teachers, students, administrators, and community representatives who function as a guiding force for the Center’s operations. Continuous Progress Models During the past three years, the two Nova elementary schools have implemented a model of continuous progress through “houses” consisting of K-5 students with a shared team of teachers facilitated by a team leader. Through teacher collaboration, teaching is tailored to the students’ individual skill levels as opposed to traditional age or grade-level grouping. Greater flexibility in academic groupings has been accomplished in the elementary levels by the implementation of multiage settings. The schools have also implemented looping of teachers whereby teachers stay with their students for two years enabling continuous learning in a consistent environment. At the middle and high school levels, the philosophy of continuous progress is furthered through alternative (block) scheduling at both levels, and the implementation of the team leader learning community structure. An alternative structure for learning communities is found at the high school which consists of four learning communities, one per grade level, each composed of an interdisciplinary team of teachers with common students. Each learning community, facilitated by two team leaders, moves through the high school years with their community of students. The structure is intended to support and promote personalization and continuity of caring for all students.
26
Priority Areas The four schools within the Nova Center have initiated two models of school reform: Paideia and the Coalition of Essential Schools. Other priority areas/projects that have been designated are Cooperative Learning, New Jersey Writing Project, Writing Across the Curriculum, Secondary Techniques Accelerate Reading Training Center (STAR), and Technology Integration. Intensive Preservice Teacher Education Project The Intensive Preservice Teacher Education Project at Nova Dwight Eisenhower Elementary was successfully piloted during the 1998-99 school year. The project pairs one senior level preservice teacher with a host teacher in a school for one full year. The feasibility of incorporating this project in demonstration classes next year is being investigated. Marketing Budget There have been discussions regarding whether the Nova Center schools should be considered as magnet schools and receive magnet funding for marketing activities. The administration and faculty at the Nova Center strongly believe the Center should be considered a magnet program, and should receive additional funding and resources under this category. No additional money is currently being provided to the Nova Center to assist with marketing activities. The Nova Center previously had a person who was responsible for marketing; however, that employee has transferred to Professional Development. According to the Magnet Director for the Broward County School Board, marketing, application handling, thematic funding, and a coordinator’s position is provided to magnet schools by the Magnet Program. Except for the International Baccalaureate (IB) programs, all magnet schools have a clear thematic or career option tract. The Magnet Director relates that Nova has never met, nor does it currently meet the criteria of being a magnet program because it is not underenrolled, has no problems with diversity and already has innovative programs. The Nova Center is seen as a school-of-choice rather than a magnet program. Nonetheless, since the redesign, the Magnet Program has helped the Nova Center with technical assistance for marketing and has provided actual marketing brochures listing Nova among their publications. Related Research Health Education Evaluation. The Department of Research and Evaluation has released several reports that include information pertinent to the Nova stakeholders. One evaluation required the administration of a Health Test to a sample of seventh graders to assess knowledge levels pertaining to health acquired by students (Younkin & Iskandar, 1999). The assessment revealed that Nova middle students scored below expectations on the Health Test. The evaluation recommended that the Health Education Services Staff investigate the schools that were identified as outliers to learn from those that performed unusually high and assist those that performed unusually low, thereby ensuring that all schools meet the Sunshine State Standards.

27
High School Science Enrollment. Another research report was prepared and addressed high school enrollment in science courses (Hartshorn & Clement, 1999). This report showed that the number of students enrolling in high school science courses increased from 1994-95 to 1998-99. In 1998-99, 65.3% of the districts’ high school students were enrolled in a Level 2 science course. Of the students enrolled in a Level 2 science course, 59.4% completed the course with a grade of C or better. Although, only 27% of Nova High students were enrolled in a Level 2 science course, it should be noted that most Nova students were enrolled in Level 3 science courses. Of the Nova High students enrolled in a Level 2 science course 73% completed the course with a grade of C or better. In addition, 24.1% of the districts high school students were enrolled in a Level 3 science course. Of the students enrolled in a Level 3 science course, 85.5% completed the course with a grade of C or better. In comparison, 55% of Nova High students were enrolled in a Level 3 science course. Of the Nova High students enrolled in a Level 3 science course 94% completed the course with a grade of C or better. It should be noted that the enrollment rates in Level 2 and 3 science courses at Nova include participants in the Summer Science/Saturday Science program. 7. What were the perspectives of students, parents, and faculty after three years of
implementation? Improving Our School Survey A large-scale data collection process designed to provide each school with a summary of perspectives held by students, parents, and teachers on the operation of each respective school was completed during the fall of 1997 and the fall of 1998. The “Improving our Schools” surveys were formatted with a five-point Likert scale to assess the respondent’s attitudes and satisfaction with their school. The surveys were divided into 12 sections: (a) Instructional Programs, (b) School Work and Teaching, (c) Teaching Processes, d) Communication and Involvement, (e) Supervision of Students, (f) Student and Teacher Support, (g) Safety to and From School, (h) Safety at School, (i) Weapons, Gangs and Alcohol, (j) Physical Harm and Threat, (k) Neighborhood Safety, and (l) Satisfaction with School. The starting point statistics for these measures are available at the school site. The responses for the students and parent surveys were collapsed into dichotomous scores with always, usually and sometimes being summed into one positive response while never and don’t know were summed into a negative response for comparison sake. Comparing the collapsed dichotomous responses from 1997 to 1998, there were a total of 34 questions where the average positive response varied 10% or more from 1997 to 1998. The 5 student, 17 teacher and 12 parent questions with a 10% or greater change from 1997 to 1998 are identified in Appendix C.

28
The results of the surveys indicate that teachers and parents have gained more positive feelings about the instructional programs at both elementary schools. Student expectations do not need to be increased according to teachers at Nova Dwight Eisenhower and Nova High. There was a strong negative change in Nova Blanche teachers in the area of teachers having enough time in the day to effectively teach their students. Nova Dwight Eisenhower teachers decreased in their belief that the use of a computer is considered to be a basic skill for students at their school. In the area of communication and involvement, teachers at Nova Dwight Eisenhower feel more strongly that they are involved in a meaningful way in the development of the School Improvement Plan, that their communication with school administrators has improved and that they are kept informed of their school-wide disciplinary plan. According to students at Nova Middle, there has been an increase in teachers stopping fights and disagreements between students and an increase in students following school rules. Students at Nova Dwight Eisenhower decreased in their feelings that students threaten or fight each other or intentionally hurt each other. In the area of safety, parents of Nova Blanche Forman students felt safer about their child walking home and parents of Nova Middle students felt there was less drugs, alcohol, or gangs in their neighborhood. Decreases in responses occurred for parents at the middle level in their belief that students at their child’s school are members of gangs while parents at the high school level have decreased beliefs that students bring drugs or alcohol to school.
Focus Groups/Interviews Teachers Two separate teacher focus groups were held, one for the elementary schools and one for the middle and high school combined. No school administrative staff member was in attendance at either of the teacher focus groups. For those teachers who were at Nova since 1996-97, there was unanimous agreement that some positive changes have occurred. Teachers at all three levels stated they felt more supported by administrators. Newer teachers, however, were not aware of what the Nova Center redesign was and could not describe the Nova vision. Teachers at all levels compared their jobs to teachers at other schools. Teachers felt that the expectations and responsibilities are much greater when compared to teachers at boundaried neighborhood schools. These teachers add that additional compensation or incentives do not accompany these expectations. However, an issue raised at both focus groups was that some teachers felt that the Nova schools were not that much different than neighborhood schools, except for the team leader positions. A concern that was voiced in the focus groups during the last evaluation and was revoiced again is that the district continues to be struggling with the notion of turning the Nova Center into traditional neighborhood schools. Although in the teacher focus group held for the last evaluation, teachers stated that the team leader positions were helpful to them, particularly in the areas of operations and

29
discipline, they were not as positive about the team leader position. A concern that was voiced last year and continued to be an issue with teachers was communication. Teachers felt that there was not enough continuity and communication between grade levels and subjects. Teachers at the elementary schools stated they did not understand action research and were not sure if the different methods they are implementing now are considered action research projects. They stated they had not had training in this area. Training is being offered this summer through Annenberg, however. Teachers at the middle and high school were able to provide a list of areas they felt met the criteria for action research. They stated they have had adequate training in the area of Paideia. Recommendations to improve the action research component of the Nova Center included the purchase of more software technology and better dissemination of existing innovative programs. Teachers at the elementary level were supportive of block scheduling and felt that they could be more focused and creative by having an uninterrupted amount of time to finish projects. Teachers at the middle and high level had mixed feelings regarding block scheduling. Although they felt that they had more flexibility in teaching strategies and more continuity in writing, they felt class sizes were larger in some subjects and felt it was harder to keep students focused for an extended time period. A concern was also raised that students needed time for information to be absorbed and time to either practice subject matter or memorize material such as in science and languages. Elementary teachers were supportive of the house and looping concepts, but not of multi-age groupings. Looping of teachers allowed instructional time to begin immediately in the beginning of the year since the teacher already knew the students. Looping was also seen as reinforcing to teachers when they saw academic progress in their students throughout the years. They felt that children’s needs are better met and planning is more coordinated with the house model. Administrators’ and District Staff Interviews Administrators express a great deal of dedication to the Nova Center and acknowledge that given adequate time, the revised redesign can work. They are unanimous in feeling that there will be continued improvement at the Nova Center with the new 10 recommendations for redesign rather than trying to continue to implement the original 58 recommendations. Although the population of Nova is changing to more closely mirror the district’s population, Nova staff view the uniqueness of Nova was seen as the tradition and reputation Nova has for having high standards that has been present since the inception of the Nova school. The K-12 continuous progress model was seen as another unique aspect of the Nova Center. The principals were enthusiastic that the organizational structure now provides the opportunities for a greater amount of innovation within individual schools. Principals feel they have more ability to be creative in running and making decisions regarding their
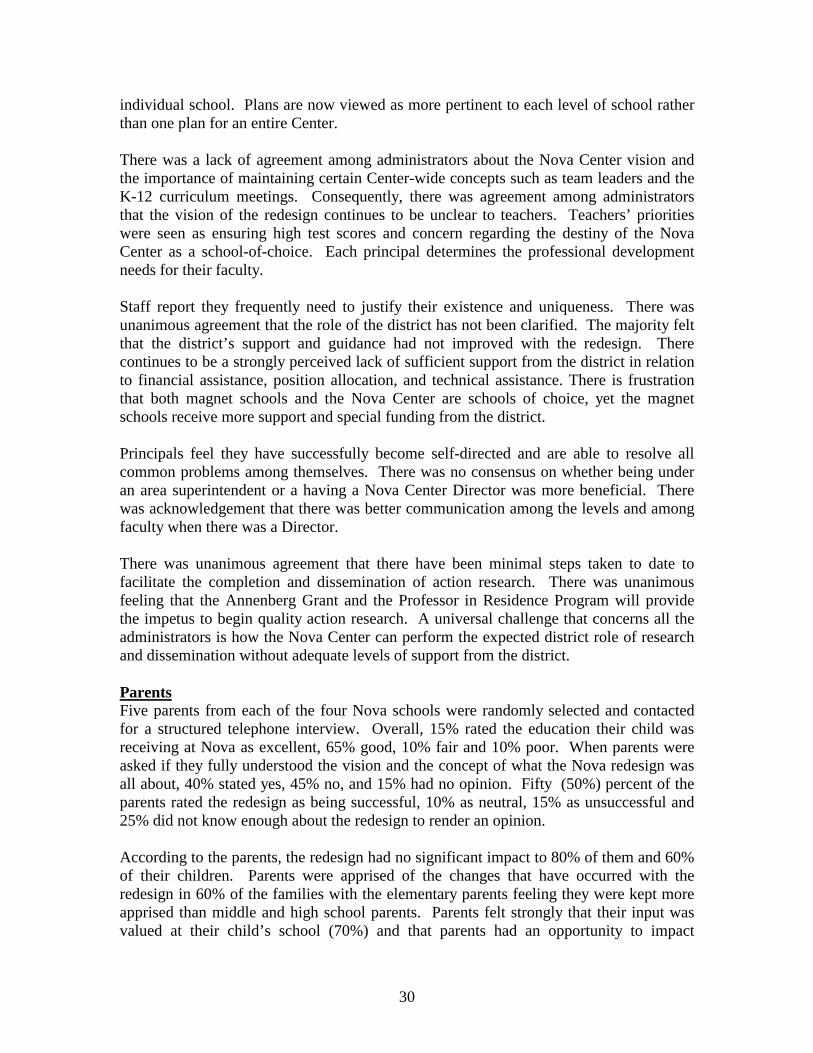
30
individual school. Plans are now viewed as more pertinent to each level of school rather than one plan for an entire Center. There was a lack of agreement among administrators about the Nova Center vision and the importance of maintaining certain Center-wide concepts such as team leaders and the K-12 curriculum meetings. Consequently, there was agreement among administrators that the vision of the redesign continues to be unclear to teachers. Teachers’ priorities were seen as ensuring high test scores and concern regarding the destiny of the Nova Center as a school-of-choice. Each principal determines the professional development needs for their faculty. Staff report they frequently need to justify their existence and uniqueness. There was unanimous agreement that the role of the district has not been clarified. The majority felt that the district’s support and guidance had not improved with the redesign. There continues to be a strongly perceived lack of sufficient support from the district in relation to financial assistance, position allocation, and technical assistance. There is frustration that both magnet schools and the Nova Center are schools of choice, yet the magnet schools receive more support and special funding from the district. Principals feel they have successfully become self-directed and are able to resolve all common problems among themselves. There was no consensus on whether being under an area superintendent or a having a Nova Center Director was more beneficial. There was acknowledgement that there was better communication among the levels and among faculty when there was a Director. There was unanimous agreement that there have been minimal steps taken to date to facilitate the completion and dissemination of action research. There was unanimous feeling that the Annenberg Grant and the Professor in Residence Program will provide the impetus to begin quality action research. A universal challenge that concerns all the administrators is how the Nova Center can perform the expected district role of research and dissemination without adequate levels of support from the district. Parents Five parents from each of the four Nova schools were randomly selected and contacted for a structured telephone interview. Overall, 15% rated the education their child was receiving at Nova as excellent, 65% good, 10% fair and 10% poor. When parents were asked if they fully understood the vision and the concept of what the Nova redesign was all about, 40% stated yes, 45% no, and 15% had no opinion. Fifty (50%) percent of the parents rated the redesign as being successful, 10% as neutral, 15% as unsuccessful and 25% did not know enough about the redesign to render an opinion. According to the parents, the redesign had no significant impact to 80% of them and 60% of their children. Parents were apprised of the changes that have occurred with the redesign in 60% of the families with the elementary parents feeling they were kept more apprised than middle and high school parents. Parents felt strongly that their input was valued at their child’s school (70%) and that parents had an opportunity to impact

31
changes at the Nova Center (75%). Overwhelmingly (90%) of the parents were not aware of any research or development that had been conducted at the Nova Center since the redesign. Seventy-five (75%) percent of the families stated they had continuity in dealing with the same person at their child’s school when there was a problem. Parents would either call the teacher (45%), team leader (45%), guidance counselor (5%), or no specific person (5%) if they had a problem. The only strength of the redesign that was mentioned by each level was the team leader. Strengths of the redesign mentioned by elementary parents were the treehouse concept and the belief that their children received more individualized help. High school parents felt that with the redesign there was a better learning process and more effective communication with parents. Weaknesses of the redesign included constant revision of the redesign, and a lack of creativity in teachers. The lack of effective communication between teachers and team leaders was mentioned as a weakness in both the elementary and middle levels. Recommendations from elementary parents for improving the Nova Center included increased computer support for technical assistance, more standardized curriculum, and higher standards for teachers. Elementary and middle school parents felt that class sizes were too large. Middle and high school parents felt that students should be challenged more. Other recommendations from high school parents included improved communication with parents and more updated computers. 8. What impact did the redesign have on student performance on standardized
achievement tests? Standardized test scores for a four-year period are provided for the Florida Writing Assessment; Stanford Achievement Test, 8th Edition (SAT8); and the High School Competency Test. Standardized test scores for a three-year period are provided for the Scholastic Assessment Test, American College Testing Assessment, and Advanced Placement Test as the 1998-99 test scores had not been released as of the date of this report. The scores for the Florida Comprehensive Achievement Test are provided for the last two years. The 1995-96 data is the baseline data prior to the Nova Center redesign being implemented at the start of the 1996-97 school year. Florida Writing Assessment The Florida Writing Assessment is a test mandated by the legislature to assess student writing in grades 4, 8, and 10. Scores range from 1 to 6. Broward County Public Schools have set an expectation that an average score of 3.0 represents a fixed standard of performance, which is desired for BCPS students. Certificates for meeting the highest standards on the assessment are given to fourth grade students achieving a score of 5.0 or better and eighth and tenth graders achieving a score of 5.5 or better. Table 12 provides results of the Florida Writing Assessment for the four Nova Schools, the District and state for the years 1995-96 through 1998-99.

32
Table 12. Florida Writing Assessment Scores for Nova, District and Florida by Year and School, 1995-96 through 1998-99 ____________________________________________________________ School Year Expository Narrative Total Average Average ________________________________________________________________________ Blanche 1995-96 2.3 3.1 2.7 Forman 1996-97 2.5 2.8 2.6 1997-98 3.0 2.8 2.9 1998-99 3.0 3.5 3.2 Dwight 1995-96 2.2 3.0 2.6 Eisenhower 1996-97 2.8 2.8 2.8 1997-98 3.2 3.1 3.2 1998-99 3.1 3.5 3.3 District (4th Grade) 1995-96 2.3 2.8 2.5 1996-97 2.5 2.7 2.6 1997-98 3.1 3.1 3.1 1998-99 2.9 3.2 3.1 Florida (4th Grade) 1995-96 2.2 2.8 2.5 1996-97 2.5 2.8 2.6 1997-98 3.0 3.1 3.0 1998-99 2.9 3.2 3.1 ______________________________________________________________________ Nova Middle 1995-96 4.1 3.7 3.9 (8th Grade) 1996-97 3.8 3.6 3.7 1997-98 3.5 3.3 3.4 1998-99 3.5 3.3 3.4 District (8th Grade) 1995-96 3.6 3.3 3.5 1996-97 3.4 3.3 3.4 1997-98 3.3 3.2 3.2 1998-99 3.4 3.3 3.3 Florida (8th Grade) 1995-96 3.7 3.3 3.5 1996-97 3.4 3.3 3.4 1997-98 3.4 3.2 3.3 1998-99 3.5 3.4 3.4 _______________________________________________________________________ Nova High 1995-96 3.4 3.4 3.4 (10th Grade) 1996-97 4.1 3.9 4.0 1997-98 3.7 3.8 3.8 1998-99 4.0 3.9 4.0 District (10th Grade) 1995-96 3.2 3.3 3.3 1996-97 3.6 3.5 3.6 1997-98 3.5 3.4 3.5 1998-99 3.4 3.4 3.4 Florida (10th Grade) 1995-96 3.2 3.4 3.3 1996-97 3.7 3.5 3.6 1997-98 3.6 3.5 3.6 1998-99 3.6 3.5 3.6 ________________________________________________________________________

33
Test results reported in Table 12 indicate that all four Nova schools met or exceeded the district and state totals for each of the four years reported. From the baseline period to 1998-99, total writing scores for the elementary schools evidenced an increase of 0.5 for Nova Blanche Forman, 0.7 for Nova Dwight Eisenhower and 0.6 for Nova High while Nova Middle decreased 0.5. Expository scores at the elementary level peaked in 1997-98 and leveled off in 1998-99. The two elementary schools reported the highest total 1998-99 scores when compared to the three prior years. Total scores for Nova Middle have successively decreased and are lower than the baseline year, yet the middle school scores were the same as the state scores and 0.1 higher than the district. Nova High’s 1998-99 total scores increased 0.2 from the previous year and exceeded the district scores by 0.6 and state scores by 0.4. Stanford Achievement Test, 8th Edition, (SAT8) The Stanford Achievement Test, 8th Edition (SAT8) is a standardized test to measure skills in specific content areas. The average national norm is 50%. Results for the mathematics and reading sections for grades 2-9 for a four-year period starting with 1995-96 through 1998-99 are provided in Table 13.

34
Table 13: Stanford Achievement Test, 8th Edition, (SAT8) Scores by Year and School, 1995-96 through 1998-99 ______________________________________________________________________________________
1995-96 1996-97 1997-98 1998-99 School Grade Math Reading Math Reading Math Reading Math Reading ______________________________________________________________________________________ Blanche 2nd 52 48 58 56 63 47 67 53 Forman 3rd 65 55 59 44 65 45 74 46
4th 75 65 72 56 72 53 73 55 5th 75 57 78 62 64 51 73 49
Dwight 2nd 72 62 71 57 76 65 75 53 Eisenh- 3rd 68 54 68 57 68 50 77 54 Hower 4th 72 57 73 57 69 60 71 61 5th 76 55 78 60 77 61 78 66 District 2nd 49 41 55 46 58 48 60 48
3rd 58 42 63 43 62 41 66 44 4th 61 49 66 50 66 50 67 51 5th 60 44 64 48 64 46 67 47
______________________________________________________________________________________ Nova 6th 83 77 77 65 77 66 70 57 Middle 7th 82 74 77 67 74 63 76 61
8th 89 75 85 74 77 68 74 62 District 6th 57 49 59 48 59 47 58 47
7th 57 49 58 49 58 50 59 49 8th 57 52 56 50 56 49 53 50
______________________________________________________________________________________ Nova 9th 81 66 86 66 88 66 84 67 High District 9th 54 46 60 47 61 45 63 45 ______________________________________________________________________________________ In comparing the 1998-99 Mathematics scores to the baseline year, second and third grade at both elementary schools and fifth grade at Nova Dwight Eisenhower improved. Mathematics scores for the fourth and fifth grade at Nova Blanche Forman and fourth grade at Nova Dwight Eisenhower decreased since the baseline year. 1998-99 Reading scores improved since baseline for second grade at Nova Blanche Forman and for fourth and fifth grade at Nova Dwight Eisenhower. Since the baseline year, decreases in Reading scores occurred in 1998-99 for third, fourth, and fifth grade at Nova Blanche Forman and for second grade at Nova Dwight Eisenhower. Nova Blanche Forman students improved in 1998-99 in each grade in both Mathematics and Reading from 1997-98 scores with the exception of a slight decrease in the fifth grade Reading scores. Nova Dwight Eisenhower second graders decreased in both

35
Mathematics and Reading from 1997-98 to 1998-99 while all other Nova Dwight Eisenhower students improved in both Mathematics and Reading. Middle school students experienced decreased scores in Mathematics from baseline to 1998-99. Sixth graders decreased Mathematics scores by 13 points, 7th graders by 6 points, and 8th graders by 15 points. From the baseline years, Reading scores decreased 13 points for both 7th and 8th graders while 6th graders decreased by 20 points. The high school students improved three points in Mathematics and one point in Reading from the baseline year. When comparing Mathematics scores to Reading scores across grades for 1998-99, students at all grade levels and every school scored significantly higher in Mathematics as compared to Reading. SAT8 scores for all four of the Nova schools for the 1998-99 year exceeded the district and state totals. Test scores were also analyzed across grades by comparing students as they move from one grade to the next. The data reveals that 5th graders in Nova Blanche Forman increased Mathematics scores by 21 points and their Reading scores by one point from 1995 to 1998. During the same time period, Nova Dwight Eisenhower students increased their Mathematics scores by 6 points, while Reading scores increased by 4 points. Middle school students decreased their Mathematics scores by 9 points and their Reading scores by 15 points. High school students showed progress in both subject areas. When examining 9th grade students in 1998 to their scores when they were in middle school, the high school students improved 25 points in Mathematics and 20 points in Reading from their 6th grade scores.
High School Competency Test (HSCT) The HSCT measures the attainment of basic skills consisting of two sections, Mathematics and Communications. All Florida students enrolled in public schools are tested and must take and pass both parts of the HSCT to qualify for a regular diploma. Students’ first opportunity to take this test begins in the tenth grade. Students who do not achieve a passing score on the first administration are allowed additional opportunities to retake only the section(s) of the test where a passing score was not attained. Table 14 summarizes the percentage of students passing the HSCT for Nova High, district and state for the years 1995-96 through 1998-99.

36
Table 14: Nova, Broward, and Florida High School Competency Test (HSCT), Communication and Mathematics Scores by Year and School, 1995-96 through 1998-99 __________________________________________________________________________________
Communication Skills Mathematics School Year # Tested % Passed # Tested % Passed __________________________________________________________________________________ Nova High 1995-96 402 93% 403 87%
1996-97 456 78% 457 83% 1997-98 427 79% 427 81% 1998-99 385 84% 386 88%
__________________________________________________________________________________ District 1995-96 10,024 86% 10,141 74% 1996-97 10,669 72% 10,767 71% 1997-98 10,945 74% 10,981 71% 1998-99 11,937 76% 11,961 73% __________________________________________________________________________________ Florida 1995-96 102,455 89% 104,091 77% 1996-97 104,806 77% 106,466 75% 1997-98 107,263 78% 107,657 75%
1998-99 108,694 81% 109,315 77% __________________________________________________________________________________ As can be seen from Table 14, Communication and Mathematics scores for Nova students exceeded both District and Florida scores for each school year reported. Scores for the 1998-99 school year for Nova, district, and Florida students showed an increase in both Communications and Mathematics over the scores from the two previous school years. Compared to the 1997-98 scores, Nova students increased by 5% in Communication and 7% in Mathematics for the 1998-99 scores. Further, Nova students increased at a higher percent (5% - 7%) during the last school year as compared to the District (2%) and state (2% - 3%). The 1994-95 school year was a transition year for the HSCT and a new set of skills were implemented. The test administered to first time test takers imposed higher standards on the students. The test was leveled to take into consideration the change in test standards. A new passing score took effect with the October, 1996 (1996-97 school year) administration of the HSCT, requiring all students to meet the new passing standards whether taking the HSCT for the first time or retaking one or both sections of the test. The passing score for the Communication section increased from 45 questions correct to 53 questions (18% increase) correct from a total of 65 questions. The passing score for the Mathematics section increased from 34 questions correct to 37 questions (9% increase) correct from a total of 55 questions.
In reviewing the drop in scores from 1995-96 to 1998-99, in Communication and initially for Mathematics, the instability of scores during this period is most likely a reflection of

37
the leveling of the test and the imposed higher standards required to pass. Therefore, caution must be used in comparing these scores between different years.
Scholastic Assessment Test (SAT) The Scholastic Assessment Test (SAT) is a comprehensive, standardized college entrance test used to measure verbal and mathematical abilities deemed critical for successful college academic performance. Table 15 provides 1995-96 through 1997-98 SAT results for Nova High, the district, state, and nation over the last three year period. Scores for the 1998-99 year were not available at the time this report was written. The numbers of students as well as their overall average for the Verbal and Mathematics sections are reflected in the table. Table 15: Scholastic Assessment Test Scores (SAT) for Nova High, District, Florida and National, 1995-96 through 1997-98 __________________________________________________________________ Number Verbal Math Location Year Tested Scores Scores __________________________________________________________________ Nova High 1995-96 271 523 550 1996-97 299 514 544 1997-98 328 514 539 __________________________________________________________________ District 1995-96 4,467 490 500 1996-97 4,931 485 496 1997-98 5,217 486 498 __________________________________________________________________ Florida 1995-96 50,979 498 496 1996-97 55,085 499 499 1997-98 58,040 500 501 __________________________________________________________________ National 1995-96 1,084,725 505 508 1996-97 1,127,021 505 511 1997-98 1,172,779 505 512 __________________________________________________________________

38
Average scores may appear higher for 1996-97 than the previous years as the College Board recentered the national score scale. Previous years’ data has been reported as recentered. As indicated in the above data, district and Florida students consistently scored lower than national averages for both the verbal and math sections during the three-year period. Nova students, on the other hand, scored significantly higher for each of the three years in both the verbal and math section as compared to district, Florida, and national students. Mathematics scores have consistently been higher than Verbal scores for Nova students. From the 1996-97 school year to the 1997-98 school year, Verbal scores for Nova students remained the same while Mathematics scores decreased 5%. American College Testing Program (ACT) The American College Testing Program (ACT) is a comprehensive, standardized college entrance test used to measure verbal and mathematical abilities deemed critical for successful college academic performance.
Table 16 provides 1995-96 through 1997-98 ACT participation rates and test results for Nova High, the district, state and nation for the last three years. Scores for 1998-99 were not available at the time this report was written. The number of students, as well as their overall averages for the English, Mathematics, Reading, and Science Reasoning subtests and the composite scores is included. Table 16: American College Testing Program (ACT) Scores for Nova High, District, Florida, and National, 1995-96 through 1997-98 ___________________________________________________________________________________ Science Location Year Number English Math Reading Reasoning Composite ___________________________________________________________________________________ Nova High 1995-96 136 21.8 23.1 22.0 21.3 22.2 1996-97 155 21.0 22.8 21.6 21.3 21.8 1997-98 129 21.6 23.5 22.6 21.2 22.3 ___________________________________________________________________________________ District 1995-96 2,673 19.8 20.9 21.1 20.5 20.7 1996-97 2,962 19.5 20.9 20.5 20.2 20.4 1997-98 3,075 19.3 20.9 20.6 20.1 20.4 ___________________________________________________________________________________ Florida 1995-96 36,264 19.9 20.3 21.2 20.6 20.6
1996-97 40,496 19.9 20.7 21.1 20.6 20.7 1997-98 43,379 20.0 20.7 21.3 20.6 20.8 ___________________________________________________________________________________ National 1995-96 924,663 20.3 20.2 21.3 21.1 20.9 1996-97 959,301 20.3 20.6 21.3 21.1 21.0 1997-98 995,039 20.4 20.8 21.4 21.1 21.0 ___________________________________________________________________________________

39
Inspection of Table 16 reveals that Nova students consistently scored higher on all five sections of the ACT test when compared to district, Florida, and national scores during the three-year period. Nova scores for the 1997-98 year increased from the previous year by less than one point in four of the categories. The fifth category, Science Reasoning, decreased by less than one point. Advanced Placement (AP) The Advanced Placement (AP) Program gives students who take college-level courses while still in high school the opportunity to take advanced placement examinations. The 29 examinations, offered in 16 fields, are reported on a scale from 0 to 5. Although each college decides which AP Examination grades it will accept, most higher education institutions grant credit and/or advanced placement for scores of three (3) or better. Table 17 shows Nova and district school enrollment in Grades 9 through 12, the number of AP students and AP enrollments, the number and percent of AP exams, and the number and percent of AP exams passed for the past three school years. Scores for the 1998-99 year were not available at the time this report was written. Advanced Placement students may be enrolled in more than one Advanced Placement course and may take more than one exam. Table 17: Advanced Placement (AP) Scores for Nova High, District, Florida and National, 1995-96 through 1997-98 _____________________________________________________________________________________ Number Number Number Percent Number Percent High School AP AP AP AP Exams Exams Location Year Enrollment Students Enrollment Exams Exams Passed Passed ______________________________________________________________________________________ Nova High 1995-96 2,042 247 551 513 93.1 364 71.0 1996-97 2,043 284 651 593 91.1 443 74.7 1997-98 1,985 346 717 714 99.6 509 71.3 ______________________________________________________________________________________ District 1995-96 60,441 3,021 5,304 4,580 86.3 2,609 57 1996-97 63,434 3,228 5,797 5,161 89.0 3,010 58.3 1997-98 51,350 3,213 5,705 5,529 96.9 3,215 58.1 ______________________________________________________________________________________ Table 17 statistics for the three-year period reveal a decreasing enrollment at Nova High and the district, yet an increasing number of AP enrollments and examinations taken at Nova and at all Broward schools. Between the 1995-96 and 1997-98 school years, the number of AP students increased by 40% for Nova and 6% for the district. The number of AP enrollments for Nova and the district increased 30% and 7% respectively. The number of AP exams increased by 39% for Nova and 20% for the district. The percentage of Nova students passing the exam decreased 3.4% from 1996-97 to 1997-98. However, the percentage of Nova students passing the exam has exceeded district students for each of the three years by at least 13%.

40
Florida Comprehensive Assessment Test (FCAT) The Florida Comprehensive Assessment Test (FCAT) questions measure specific Sunshine State Standard benchmarks in language arts and mathematics. Students in Grades 4, 8, and 10 are tested in Reading while students in Grades 5, 8, and 10 are tested in Mathematics. The total score that students can achieve ranges from 100 to 500. Table 18 presents FCAT Reading and Mathematics scores for Nova, district, and state students since the first year the FCAT was used by the state.

41
Table 18: Florida Comprehensive Assessment Test (FCAT) Scores by Year and School, 1997-98 through 1998-99 _____________________________________________________________________________ 1997-98 1998-99 School Grade Reading Math Reading Math _____________________________________________________________________________ Blanche 4th 297 * 296 * Forman 5th * 303 * 315 Dwight 4th 304 * 310 * Eisenhower 5th * 318 * 336 District 4th 292 * 290 * 5th * 299 * 311 Florida 4th 294 * 296 * 5th * 300 * 310 _____________________________________________________________________________ Nova Middle 8th 317 326 315 323 District 8th 295 299 299 301 Florida 8th 298 299 302 304 _____________________________________________________________________________ Nova High 10th 313 324 317 335 District 10th 294 297 298 305 Florida 10th 299 302 306 312 _____________________________________________________________________________ * Grade 4 students are assessed on Reading only and Grade 5 students are assessed on Mathematics only. Table 18 reveals that at all three levels, Nova students either met or exceeded district and state FCAT scores in both Reading and Mathematics. From 1997-98 to 1998-99, Mathematics scores increased 12 points for Nova Blanche Forman and 18 points for Nova Dwight Eisenhower while Reading scores decreased 1 point at Nova Blanche Forman and increased 6 points at Nova Dwight Eisenhower. At the middle school, scores decreased by two points in Reading and three points in Mathematics while both district and state scores increased for both categories. Nova High increased scores by four points in Reading and 11 points in Mathematics that mirrored increases at the district and state levels. 1999 School Accountability Report. According to the state’s new A+ Plan criteria, Nova Blanche Forman, Nova Dwight D. Eisenhower, Nova Middle, and Nova High each received a “C” grade for the 1998-99 school year (DOE, 1999). Comparisons were conducted with other “similar” schools to determine the academic progress of Nova schools. Five measures were used from the 1997-98 School Indicators Report to determine similarity: enrollment, proportion of students classified as Exceptional Student

42
Education (ESE) students, proportion of students with Limited English Proficient (LEP) status, proportion of students with Free and/or Reduced Lunch (FRL) status, and schoolwide mobility rates. The outline below identifies schools with a similar proportion of FRL students to Nova Blanche Forman and with comparable proportions in at least two of the remaining school indicators. While no schools displayed an exact comparison with Nova Blanche Forman, Floranada (C), Quiet Waters (C), and Boulevard Heights (C) were most similar. As shown, to achieve a school grade of B, Nova Blanche Forman, Floranada, and Quiet Waters need to improve performance for subgroups of students and increase the proportion of students scoring Level 3 on the FCAT-Mathematics. Boulevard Heights needs to improve only in FCAT-Mathematics at Level 3. Nova Blanche Forman
What they need to become a B: • 50% of the students must score at Level 3 or above on FCAT Math. • No subgroup data are below minimum criteria.
What they need to become an A: • 50% of the students must score at Level 3 or above on FCAT Math. • No subgroup data are below minimum criteria. • Demonstrate substantial improvement in reading scores.
Floranada What they need to become a B:
• 50% of the students must score at Level 3 or above on FCAT Math. • No subgroup data are below minimum criteria.
What they need to become an A: • 50% of the students must score at Level 3 or above on FCAT Math. • No subgroup data are below minimum criteria. • Demonstrate substantial improvement in reading scores. • Percent of students absent more than 20 days is below the state average.
Quiet Waters What they need to become a B:
• 50% of the students must score at Level 3 or above on FCAT Math. • No subgroup data are below minimum criteria.
What they need to become an A: • 50% of the students must score at Level 3 or above on FCAT Math. • No subgroup data are below minimum criteria.
Boulevard Heights What they need to become a B:
• 50% of the students must score at Level 3 or above on FCAT Math. What they need to become an A:
• 50% of the students must score at Level 3 or above on FCAT Math. • Percent of students absent more than 20 days is below the state average.

43
The following outline identifies schools with a similar proportion of FRL students to Nova’s Dwight D. Eisenhower and with comparable proportions in at least two of the remaining school indicators. Schools most similar to Nova Eisenhower were: Hollywood Hills (C), Virginia Young (C), and Tradewinds (C). To become B schools, Nova Eisenhower needs to improve their subgroup performance, Hollywood Hills and Virginia Young need to improve their FCAT-Mathematics at Level 3 performance, and Tradewinds needs to improve their Level 3 performance in both Mathematics and Reading. It is important to note that Nova Eisenhower needs only to improve their subgroup performance in order to also achieve an A status, while these other schools need to improve in two or more additional categories. Nova’s Dwight D. Eisenhower
What they need to become a B: • No subgroup data are below minimum criteria.
What they need to become an A: • No subgroup data are below minimum criteria.
Hollywood Hills What they need to become a B:
• 50% of the students must score at Level 3 or above on FCAT Math. What they need to become an A:
• 50% of the students must score at Level 3 or above on FCAT Math. • Demonstrates no substantial decline on Florida Writes!.
Virginia Young What they need to become a B:
• 50% of the students must score at Level 3 or above on FCAT Math. What they need to become an A:
• 50% of the students must score at Level 3 or above on FCAT Math. • Demonstrates no substantial decline on Florida Writes!. • Demonstrate substantial improvement in reading scores.
Tradewinds What they need to become a B:
• 50% of the students must score at Level 3 or above on FCAT Math. • 50% of the students must score at Level 3 or above on FCAT Reading.
What they need to become an A: • 50% of the students must score at Level 3 or above on FCAT Math. • 50% of the students must score at Level 3 or above on FCAT Reading. • Demonstrate substantial improvement in reading scores. • Percent of students absent more than 20 days is below the state average.
The outline below identifies Forest Glen (B) as the only school similar to Nova Middle with three comparable indicators. Nova Middle must improve its subgroup performance to become a B school and both subgroup performance and reading improvements to become an A school. Forest Glen must also display stronger improvements in reading and absence rates below the state average to become an A school.

44
Nova Middle
What they need to become a B: • No subgroup data are below minimum criteria.
What they need to become an A: • No subgroup data are below minimum criteria. • Demonstrate substantial improvement in reading scores.
Forest Glen What they need to become an A:
• Demonstrate substantial improvement in reading scores. • Percent of students absent more than 20 days is below the state average.
Finally, the outline below identifies South Plantation (D+) as the only school similar to Nova High with three comparable indicators. Nova High needs to improve its FCAT-Reading at Level 3 and its subgroup performance to achieve a B status. South Plantation will need to improve the minimum criteria of 75% or more students scoring 3 or above in Florida Writes! to achieve a C grade. Nova High
What they need to become a B: • 50% of the students must score at Level 3 or above on FCAT Reading. • No subgroup data are below minimum criteria.
What they need to become an A: • 50% of the students must score at Level 3 or above on FCAT Reading. • No subgroup data are below minimum criteria. • At least 95% of the standard curriculum students are tested.
South Plantation What they need to become a C:
• 75% of the students must score 3 or above in Florida Writes!. Overall, these findings reveal that the Nova schools are ahead of comparison schools in terms of achieving higher A+ Plan grades regarding some indicators, but fall behind other comparison schools relative to other indicators. These finding are “mixed” and do not provide solid evidence that student achievement among Nova’s students is superior to that of students who attend “similar” schools.
SUMMARY AND RECOMMENDATIONS
The findings provide evidence that the second and third years were spent continuing to implement and revise the redesign recommendations for the Nova schools. Since the inception of the redesign, the Nova Center and the faculty have endured many changes which include the revised redesign plan, administrative oversight reassignment, new admission policies, job reconfigurations, high team leader turnover, increased withdrawal rates, decreased waiting list, student population that more closely mirrors the general population, and district expectations that are not always clearly delineated.
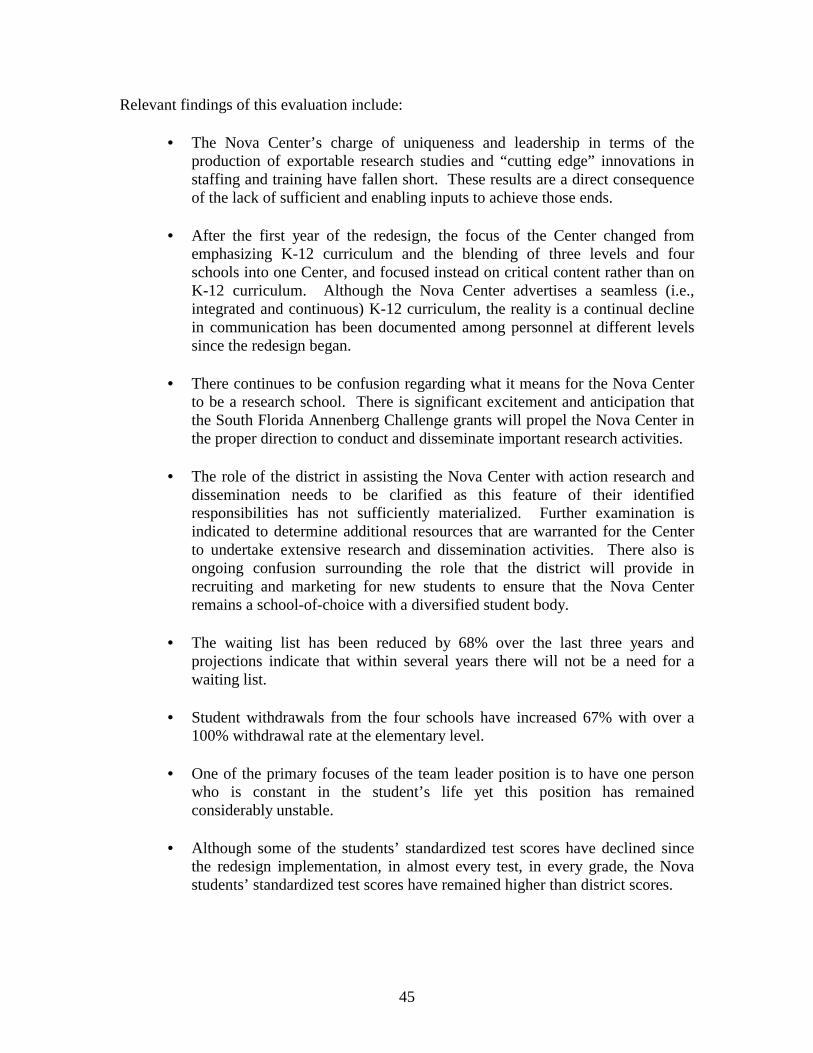
45
Relevant findings of this evaluation include:
• The Nova Center’s charge of uniqueness and leadership in terms of the production of exportable research studies and “cutting edge” innovations in staffing and training have fallen short. These results are a direct consequence of the lack of sufficient and enabling inputs to achieve those ends.
• After the first year of the redesign, the focus of the Center changed from
emphasizing K-12 curriculum and the blending of three levels and four schools into one Center, and focused instead on critical content rather than on K-12 curriculum. Although the Nova Center advertises a seamless (i.e., integrated and continuous) K-12 curriculum, the reality is a continual decline in communication has been documented among personnel at different levels since the redesign began.
• There continues to be confusion regarding what it means for the Nova Center
to be a research school. There is significant excitement and anticipation that the South Florida Annenberg Challenge grants will propel the Nova Center in the proper direction to conduct and disseminate important research activities.
• The role of the district in assisting the Nova Center with action research and
dissemination needs to be clarified as this feature of their identified responsibilities has not sufficiently materialized. Further examination is indicated to determine additional resources that are warranted for the Center to undertake extensive research and dissemination activities. There also is ongoing confusion surrounding the role that the district will provide in recruiting and marketing for new students to ensure that the Nova Center remains a school-of-choice with a diversified student body.
• The waiting list has been reduced by 68% over the last three years and
projections indicate that within several years there will not be a need for a waiting list.
• Student withdrawals from the four schools have increased 67% with over a
100% withdrawal rate at the elementary level.
• One of the primary focuses of the team leader position is to have one person who is constant in the student’s life yet this position has remained considerably unstable.
• Although some of the students’ standardized test scores have declined since
the redesign implementation, in almost every test, in every grade, the Nova students’ standardized test scores have remained higher than district scores.
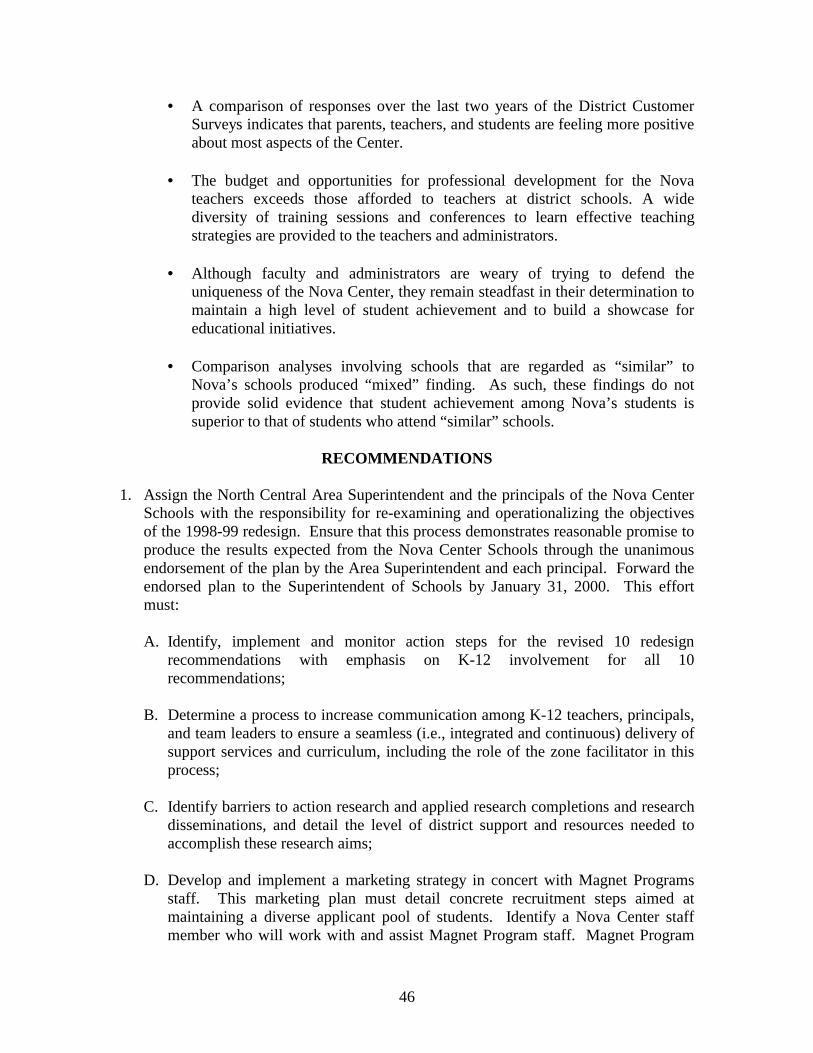
46
• A comparison of responses over the last two years of the District Customer Surveys indicates that parents, teachers, and students are feeling more positive about most aspects of the Center.
• The budget and opportunities for professional development for the Nova
teachers exceeds those afforded to teachers at district schools. A wide diversity of training sessions and conferences to learn effective teaching strategies are provided to the teachers and administrators.
• Although faculty and administrators are weary of trying to defend the
uniqueness of the Nova Center, they remain steadfast in their determination to maintain a high level of student achievement and to build a showcase for educational initiatives.
• Comparison analyses involving schools that are regarded as “similar” to
Nova’s schools produced “mixed” finding. As such, these findings do not provide solid evidence that student achievement among Nova’s students is superior to that of students who attend “similar” schools.
RECOMMENDATIONS
1. Assign the North Central Area Superintendent and the principals of the Nova Center
Schools with the responsibility for re-examining and operationalizing the objectives of the 1998-99 redesign. Ensure that this process demonstrates reasonable promise to produce the results expected from the Nova Center Schools through the unanimous endorsement of the plan by the Area Superintendent and each principal. Forward the endorsed plan to the Superintendent of Schools by January 31, 2000. This effort must:
A. Identify, implement and monitor action steps for the revised 10 redesign
recommendations with emphasis on K-12 involvement for all 10 recommendations;
B. Determine a process to increase communication among K-12 teachers, principals,
and team leaders to ensure a seamless (i.e., integrated and continuous) delivery of support services and curriculum, including the role of the zone facilitator in this process;
C. Identify barriers to action research and applied research completions and research
disseminations, and detail the level of district support and resources needed to accomplish these research aims;
D. Develop and implement a marketing strategy in concert with Magnet Programs
staff. This marketing plan must detail concrete recruitment steps aimed at maintaining a diverse applicant pool of students. Identify a Nova Center staff member who will work with and assist Magnet Program staff. Magnet Program

47
staff will be responsible for the operational responsibilities of marketing and recruitment. The existing Nova Center staff member selected must assist in the development of brochures and other materials needed for effective outreach and recruitment activities;
E. Revisit the allocation of dollars above the traditional support allocation to
specifically address issues related to the function and the role of team leaders. The review should concentrate on specific job-related responsibilities and identify their responsibilities as those activities that may result in exportable benefits to other district schools. Fund the increased support allocation for team leaders only upon the condition that their adjusted responsibilities demonstrate reasonable promise of developing new, innovative procedures, practices or methods that may be used and exported to other district schools.
2. Provide center-wide professional development plans that specifically address the need
for pre-service and continuing education for team leaders. Topics to include should relate to curriculum, guidance, ESE, ESOL, and classroom support.
References
Broward County School Board. (1998). Professional Pathways Resource Guide: A Comprehensive Guide to Staff Development. Brown, A. (1998). Nova Center for Applied Research and Professional Development: Evaluation Report. The School Board of Broward County, Florida. Burke, D. (1997). Looping: Adding Time, Strengthening Relationships. (ERIC Reproduction Service No. ED 414098). Check, J. (1997, May/June). Teacher Research as Powerful Professional Development. Harvard Education Letter, 6-8. Coladarci, T. (1982). Empirical Research as Inservice Teacher Education. Paper presented at the Annual Meeting of the American Educational Research Association New York, NY). (ERIC Document Reproduction Service No. ED 222460). Florida Department of Education. (1999, June). 1999 School Accountability Report. Gardner, D. (1998). Alternative to External Suspension Program: Evaluation Report. The School Board of Broward County, Florida. Green, L. (1999). Teacher Absences in Broward County Public Schools: Update; Research Brief. The School Board of Broward County, Florida. Hansen, C. (1996). Implementing Research in the Science Classroom: Students and Teachers as Researchers. Science Educator, 5(1), 36-40.

48
Hartshorn, T. & Clement, R. (1999). High School Enrollment in Science Courses from 1994-1999: Research Report. The School Board of Broward County, Florida. Jones, M. (1996). Smoothing Rough Edges in Concrete: A Rural Washington Community Looks to Multiage Classrooms as a foundation for Continuous Learning. Northwest Education, 2(2), 22-25. Maloy, K. (1993). Toward a New Science of Instruction: Programmatic Investigations in Cognitive Science and Education. Washington, DC: National Research Center on Student Learning. New York City Public Schools (1991). Making Staff Development Pay Off in the Classroom. Research Brief #4. New York, NY. Robinson, S. (1997). Building Knowledge for a Nation of Learners: A Framework for Education Research. Washington, DC: U.S. Department of Education. Yang, X. (1997). Educational Benefits in Elementary School through Looping and Friday In-Services. Part 2: Benefits of Looping. Paper presented at the Annual Seminar of the National Association for Year-Round Education (San Diego, CA). (ERIC Document Reproduction Service No. ED 425850). Younkin, W. & Iskandar, N. (1999). Health Education in Middle Schools: One Course Versus Integration; Evaluation Report. The School Board of Broward County, Florida. Watt, M., & Watt, D. (1991). Teacher Research, Action Research. (Report No. 91-4). Newton, MA: Education Development Center. (ERIC Document Reproduction Service No. ED 341686).
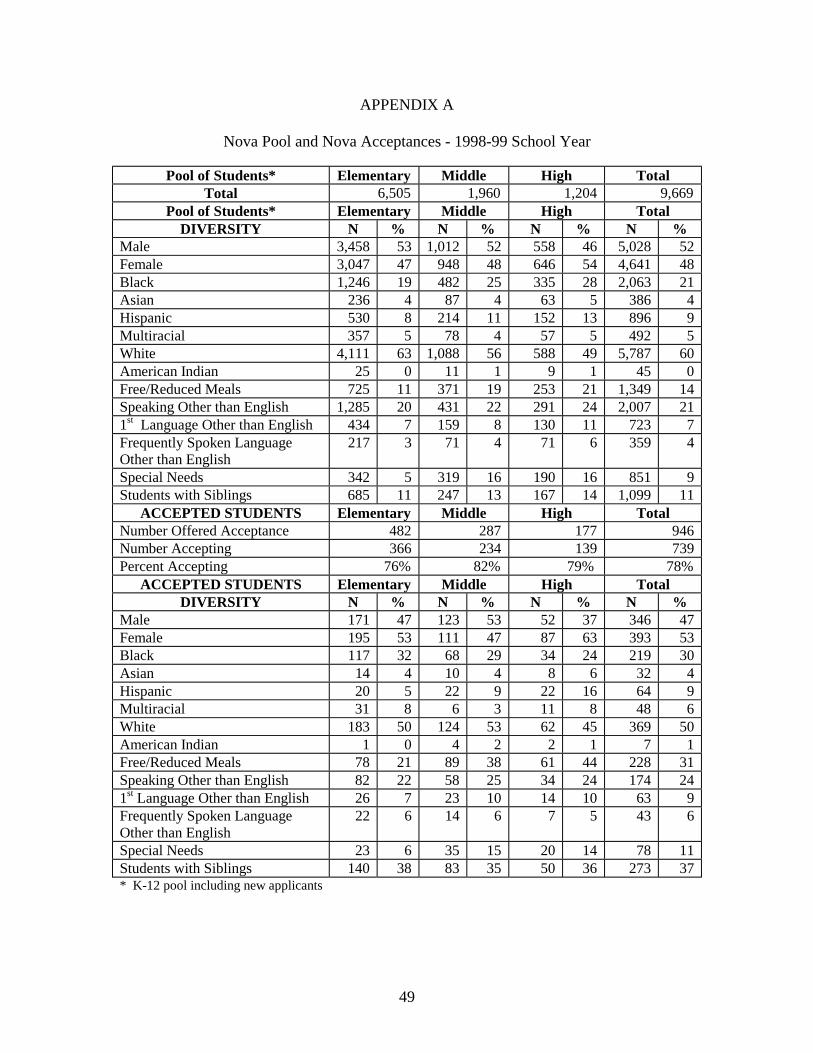
49
APPENDIX A
Nova Pool and Nova Acceptances - 1998-99 School Year
Pool of Students* Elementary Middle High Total Total 6,505 1,960 1,204 9,669
Pool of Students* Elementary Middle High Total DIVERSITY N % N % N % N %
Male 3,458 53 1,012 52 558 46 5,028 52 Female 3,047 47 948 48 646 54 4,641 48 Black 1,246 19 482 25 335 28 2,063 21 Asian 236 4 87 4 63 5 386 4 Hispanic 530 8 214 11 152 13 896 9 Multiracial 357 5 78 4 57 5 492 5 White 4,111 63 1,088 56 588 49 5,787 60 American Indian 25 0 11 1 9 1 45 0 Free/Reduced Meals 725 11 371 19 253 21 1,349 14 Speaking Other than English 1,285 20 431 22 291 24 2,007 21 1st Language Other than English 434 7 159 8 130 11 723 7 Frequently Spoken Language Other than English
217 3 71 4 71 6 359 4
Special Needs 342 5 319 16 190 16 851 9 Students with Siblings 685 11 247 13 167 14 1,099 11
ACCEPTED STUDENTS Elementary Middle High Total Number Offered Acceptance 482 287 177 946 Number Accepting 366 234 139 739 Percent Accepting 76% 82% 79% 78%
ACCEPTED STUDENTS Elementary Middle High Total DIVERSITY N % N % N % N %
Male 171 47 123 53 52 37 346 47 Female 195 53 111 47 87 63 393 53 Black 117 32 68 29 34 24 219 30 Asian 14 4 10 4 8 6 32 4 Hispanic 20 5 22 9 22 16 64 9 Multiracial 31 8 6 3 11 8 48 6 White 183 50 124 53 62 45 369 50 American Indian 1 0 4 2 2 1 7 1 Free/Reduced Meals 78 21 89 38 61 44 228 31 Speaking Other than English 82 22 58 25 34 24 174 24 1st Language Other than English 26 7 23 10 14 10 63 9 Frequently Spoken Language Other than English
22 6 14 6 7 5 43 6
Special Needs 23 6 35 15 20 14 78 11 Students with Siblings 140 38 83 35 50 36 273 37 * K-12 pool including new applicants

50
APPENDIX B
Revised Design Team Recommendations
1. Nova will develop, implement, and evaluate a seamless K-postsecondary continuous progress model incorporating various House restructures and site reconfigurations.
2. Nova will develop, implement, and evaluate alternative models of time usage to facilitate training
and planning and include university partnerships for preservice and inservice. Calendar extensions will accommodate Teacher Training, Teaching Children at other sites, Studying and Self-development, Research and Development, and Curriculum Development.
3. Nova will actively integrate technology throughout the curriculum and training programs.
Retrofitting and a common technology standard will be applied throughout the Nova site including Nova High School and Nova Blanche Forman Elementary School.
4. Nova/HRD will develop and implement a process for professional development, research,
dissemination and training at the Nova site.
Components of the Nova/HRS site will include: a place for collegial sharing a professional library a training site a distance learning center a computerized research network
Products developed by the Nova/HRD site will include: resource guides/banks video-taped lessons of best practices models to disseminate research and practice
5. There will be a commitment to continuous learning by all. 6. Faculty from Nova, along with district staff, will create team(s) with redefined roles to respond to
requests from schools, to identify and share expertise and best practices in other schools, and to assist in developing a district-wide clearinghouse of resources.
7. A research committee at the site, comprised of key district administrators university
representative(s), team leaders, and other professional staff will manage research project/initiatives.
8. Comprehensive marketing strategies, including adding Nova Schools to the Magnet Program
brochure, will target the interest/needs of audiences (communities). Marketing targets are students, parents, community members, and representative groups with shared interests.
9. Nova/HRD will develop historical briefs and case studies to address innovations such as
alternative models of time usage, as well as integrated curriculum and technology models. 10. The district will specify evaluation procedures and conduct programmatic reviews annually.

51
APPENDIX C
Student, Parent, and Teacher “Improving Our Schools” Survey
Changes from 1997 to 1998
Table 13: Student, Parent, and Teacher Survey Changes from 1997 to 1998 School Survey Selection (Question) 1997
Positive Response *
1998 Positive Response *
Percent Change
INSTRUCTIONAL PROGRAMS TEACHERS: I provide or integrate high quality Reading and Language Arts instruction
84.6% 95.4% +10.8%
PARENTS: I like the school’s Math program. 88.6% 100% +11.4% PARENTS: I like the school’s Science program. 69.4% 83.4% +14.0%
Blanche Forman
PARENTS: I like the school’s Social Studies program.
71.0% 87.9% +16.9%
TEACHERS: I feel students read and write at a high level.
89.0% 100% +11.0%
TEACHERS: I believe all students, if taught correctly, can pass Algebra to graduate.
86.1% 100% +13.9%
PARENTS: I like the school’s Science program. 81.3% 94.6% +13.3% PARENTS: I like the school’s Social Studies program.
71.9% 89.3% +17.4%
Dwight Eisenhower
TEACHERS: The effective use of a computer is considered to be a basic skill for students at this school.
99.8% 84.6% -15.2%
Nova Middle
STUDENTS: I like the Science classes at my school.
74.8% 85.9% +11.1%
SCHOOL WORK & TEACHING Dwight Eisenhower
TEACHERS: Teachers at this school need to raise their expectations of students’ performance.
91.9% 61.6% -30.3%
Nova High TEACHERS: Expectations for student performance at this school are too high.
22.0% 36.3% +14.3%
TEACHING PROCESSES Blanche Forman
TEACHERS: I have enough time in the day to effectively teach my students.
82.1% 53.6% -28.5%
PARENTS: The teachers keep me informed of how my child is doing in school.
89.3% 99.9% +10.6% Dwight Eisenhower
TEACHERS: I use technology in the delivery of curriculum and instruction.
78.4% 92.3% +13.9%
COMMUNICATION & INVOLVEMENT Dwight Eisenhower
TEACHERS: My communication with school administrators is good at this school.
78.3% 92.3% +14.0%

52
Dwight Eisenhower
TEACHERS: I am involved in a meaningful way in the development and implementation of our School Improvement Plan (SIP).
69.4% 89.7% +20.3%
SUPERVISION OF STUDENTS Dwight Eisenhower
TEACHERS: I am kept informed regarding our school-wide disciplinary plan at this school.
86.4% 100% +13.6%
TEACHERS: School staff members supervise the hallways during arrival, dismissal, and class changes.
96.5% 86.5% -10.0%
STUDENTS: Teachers stop fights and disagreements between students.
82.5% 92.5% +10.0%
Nova Middle
STUDENTS: Students follow school rules when they are at school.
76.1% 86.1% +10.0%
STUDENT AND TEACHER SUPPORT Blanche Forman
PARENTS: My child learns about various races and cultures through classroom activities.
85.3% 95.4% +10.1%
Dwight Eisenhower
TEACHERS: In this school, discipline is a joint responsibility of staff and parents.
86.1% 100% +13.9%
Nova Middle
TEACHERS: I use computers to effectively manage information and reduce paperwork.
82.8% 95.8% +13.0%
SAFETY TO AND FROM SCHOOL Blanche Forman
PARENTS: My child is safe walking home from school or the bus stop.
50.0% 72.3% +22.3%
SAFETY AT SCHOOL Nova Middle
TEACHERS: I can carry valuables to school without fear of theft.
74.1% 53.2% -20.9%
Nova High TEACHERS: I can carry valuables to school without fear of theft.
69.1% 58.9% -10.2%
WEAPONS, GANGS, AND ALCOHOL AT SCHOOL Nova Middle
PARENTS: Students at my child’s school are members of gangs.
32.0% 14.9% -17.1%
Nova High PARENTS: Students bring drugs or alcohol to my child’s school.
48.6% 30.7% -17.9%
PHYSICAL HARM AND THREATS AT SCHOOL STUDENTS: Students intentionally hurt me while I’m at school.
33.4% 23.0% -10.4%
STUDENTS: Students threaten or fight with each other when they are at my school.
70.2% 57.1% -13.1%
Dwight Eisenhower
TEACHERS: I feel safe from crime in the neighborhood surrounding this school.
100% 89.7% -10.3%
NEIGHBORHOOD SAFETY PARENTS: Students have drugs or alcohol in my neighborhood.
36.3% 20.6% -15.7% Nova Middle
PARENTS: Students in my neighborhood are members of gangs.
20.6% 10.2% -10.4%
* Collapsed responses of always, usually and sometimes.