novel methods of species and product authenticity and
TRANSCRIPT

Novel Methods of Species and Product Authenticity and Traceability Testing Using DNA Analysis for Food and Agricultural Applications
By
Amanda Madelaine Naaum
A Thesis
presented to
The University of Guelph
In partial fulfillment of requirements
for the degree of
Doctor of Philosophy in Integrative Biology
Guelph, Ontario, Canada
© Amanda Naaum, April, 2014

ABSTRACT
NOVEL METHODS OF SPECIES AND PRODUCT AUTHENTICITY AND TRACEABILITY TESTING USING DNA ANALYSIS FOR FOOD AND
AGRICULTURAL APPLICATIONS
Amanda Madelaine Naaum Advisor:
University of Guelph, 2014 Robert Hanner
Categorization and identification of biodiversity is key to global food security and
integrity. Accurate species identification is relevant to many sectors involved in food
production and processing, including for pest identification and management and for
food authenticity testing. The usual methods of visual identification of species are often
not applicable to food products as morphological characters are often removed during
processing. However, methods using DNA analysis enable identifications from
immature life stages, or fragmentary remains, and are therefore may be of particular
use in the food and agriculture industries. Food fraud is a serious socioeconomic issue
that continues to grow due to increasing global trade, and technological innovation for
detection as well as perpetrating fraud. Incorrect species labeling of food products is
one example of food adulteration that has broad impacts including economic, health,
conservation and religious consequences. Molecular techniques, like DNA barcoding,
have become part of routine methods for species identification and their implementation
in the regulation of market products has begun. Although DNA barcoding provides
several advantages over other methods, the ~650 base pair target required for analysis
is often too long for recovery from degraded samples, for example in cooked or canned
products. In these cases real-time PCR provides an alternative. Design of real-time
PCR assays requires particular attention to the haplotype coverage and sequence
quality. DNA barcode sequences from the Barcode of Life Data System (BOLD), an
online DNA barcode sequence library, are a source of quality sequences available for a
wide range of species, particularly those of commercial importance. Therefore, BOLD is

a useful resource in the design of successful real-time PCR assays for identification of
species in food products as well as other species of interest to the food industry, such
as agricultural pests. When endogenous DNA is not available, or provides limited
information, synthetic oligonucleotide “barcodes” can be employed for traceability and
authenticity testing. This thesis explores the linkages between species identification and
product authenticity in the agriculture and food industries and provides a proof of
concept for the use and detection of an oligonucleotide tag for traceability of apple juice.

iv
Acknowledgements Funding for student stipend was provided in part by a University of Guelph College of
Biological Sciences PhD Award. Financial support for oligonucleotide tagging research
was provided by the Advanced Food and Materials Network. I would like to thank Let’s
Talk Science and all the participating teachers and students for their collaboration on
the seafood market survey. The market survey was funded through a Mitacs Accelerate
internship. Aphid identification studies received funding from OMAFRA.
I am grateful to Teresa Crease, Nicholas Low and Rickey Yada for their helpful
comments and guidance. I would like to thank my advisor, Robert Hanner for the
opportunities provided over the course of my graduate studies. I am very appreciative of
the contributions from all my collaborators that made this research possible: Robert
Foottit, Eric Maw, Piotr Diakowski, Heinz Bernard Kraatz, Rosalee Rasmussen-
Hellberg, Haile Yancy, Jonathan Deeds, Sara Handy, Michael Morrissey and Nicholas
Low.
Finally I would like to thank my friends, and most of all my family, for their unconditional
support and encouragement.

v
Statement of Authorship and Contributions Chapters in this thesis represent co-authored work. The following is a statement of the
contributions of authors to each chapter. Citations are provided at the beginning of each
chapter for published work.
Chapter Two: Naaum and Hanner designed research. Hanner provided reagents and
equipment. Naaum performed research, analyzed data and wrote the paper.
Chapter Three: Rasmussen-Hellberg, Naaum and Hanner designed research, the
research reported in this thesis was performed by Naaum and analyzed by Rasmussen-
Hellberg and Naaum. Rasmussen-Hellberg wrote the original paper including this
research with assistance from other authors. A portion of the original paper has been
edited for inclusion in this thesis by Naaum, with the addition of results from further
research conducted by Naaum on the use of traditional PCR for salmonid identification.
Chapter Four: This chapter is a combination of two papers with the same co-authors,
with the addition of a direct visualization method for soybean aphid identification
developed by Naaum. In the case of both papers, Naaum, Foottit, and Hanner designed
research. Foottit and Maw provided morphological sample identification. Naaum
performed research and analyzed the data. Hanner provided reagents and equipment.
The papers were written by Naaum with assistance from Foottit, Maw and Hanner.
Chapter Five: Naaum, Hanner and Low designed the research, Naaum performed
research and analyzed data. Hanner provided reagents and equipment. Naaum wrote
the paper with assistance from Hanner and Low.
Chapter Six: Naaum, Diakowski, Bernard-Kraatz and Hanner designed the research.
Naaum and Diakowski performed the research. Bernard-Kraatz provided reagents and
equipment. Diakowski and Naaum analysed the data and wrote the paper.

vi
Table of Contents ABSTRACT ii Acknowledgements iv Statement of Authorship and Contributions v
List of Tables vii
List of Figures viii Chapter 1: General Introduction and Review of Relevant Literature 1 Species Identification and Food 1 Impact of Food Fraud 1 Methods of Species Identification 2 Methods for species identification using DNA 3 Standardization of gene region 5 Limitations of DNA analysis 7 Food Traceability 8 Summary 10
Section 1: The Use of Endogenous DNA for Species-Specific Identification for Authentication of Agricultural Pests or Food Products 29 Chapter 2: Seafood Market Survey Using DNA Barcoding 29 Chapter 3. Application of DNA Barcode Sequences for Identifying Salmonid Species of Commercial Interest 49 Chapter 4: Application of DNA Barcode Sequences for Differentiation of Pest Aphid Species Using Real-‐time and Conventional PCR 62
Section 2: The Use of Synthetic DNA for Food Product Traceability: Apple Juice Case Study 79 Introduction to Synthetic Tagging 79 Chapter 5: Real-‐time PCR Approach for Oligonucleotide Tag Detection 81 Chapter 6: Electrochemical Impedance Spectroscopy Approach 94 Synthetic Tagging Conclusions 108
References 115

vii
List of Tables Table 1.1 Studies employing PCR-RFLP for species authentication in food products
Table 1.2 Studies using species-specific PCR to authenticate species in food
products
Table 1.3 Studies using real-time PCR to authenticate species in food products
Table 1.4 DNA barcoding for species identification and authentication of food and
herbal medicines.
Table 2.1 Identification of market samples from this study based on DNA barcoding
Table 3.1 Samples analyzed in this study using real-time PCR. Market names and
cooking methods were collected from sample labels. Assigned species were those
detected using qPCR.
Table 4.1 Sequences of species-specific oligonucleotides used in this study
Table 4.2 Collection information for aphid specimens used in this study.
Table 5.1. List of oligonucleotides used in real-time PCR tag detection Table 5.2. Comparison of results of tag detection in apple juice from FTA and
Qiagen Blood and Tissue Kit extraction methods.
Table 5.3 Table 5.3. Tag detection after lab-simulated apple juice processing.
Table 5.4. Results of shelf-life testing.
Table 6.1 Values of the equivalent circuit elements for the DNA sensor electrode
estimated after different incubation steps.
13
17
20
26
35
57
72
73
86
87
88
89
101

viii
List of Figures Figure 1.1 Taqman probe chemistry.
Figure 3.1 Typical results after agarose gel electrophoresis of single-plex traditional
PCR for identification of salmonid species.
Figure 4.1 Linearity of multiplex assay for A. pomi and A. spiraecola
Figure 4.2 Standard curve for A. glycines
Figure 4.3 Direct visualization assay for identification of A. glycines
Figure 5.1 Oligonucleotide tag
Figure 5.2 Linearity curve for serial dilutions of tag recovered from apple juice using
Qiagen DNeasy Blood and Tissue Kit.
Figure 5.3 Linearity curve for serial dilutions of tag recovered from apple juice using
FTA extraction cards
Figure 5.4 Linearity curve for serial dilutions of tag recovered from apple juice
concentrate.
Figure 6.1 Overview of oligonucleotide tag recovery from beverages using
electrochemical impedance spectroscopy.
Figure 6.2 Typical Nyquist plots obtained for unmodified Au electrode, sensor
electrode modified with capture strand (strand 1), and sensor electrode after incubation
in buffer solution tagged with strand 2 for 2 hours.
Figure 6.3 Equivalent circuit model representing the apatamer sensor and used to
obtain theoretical impedance spectra.
Figure 6.4 Typical Nyquist plots obtained for sensor electrode modified with strand 1,
sensor electrode incubated for 2 hours in buffered apple juice, followed by 2 hours
sensor incubation in apple juice tagged with strand 2.
Figure 6.5 Typical Nyquist plots obtained for sensor electrode modified with strand 1,
sensor electrode incubated for 2 hours in buffer containing 3 mM Zn2+, followed by 2
hours sensor incubation apple juice solution tagged with strand 2
28
61
76
77
78
90
91
92
93
102
103
104
105
106

ix
Figure 6.6 Nyquist plots obtained for sensor electrode modified with strand 1, sensor
electrode incubated for 2 hours in Tris-buffer (pH 8.6) containing 50 mM tag, sensor
after dehybridization for 1 hour in Tris-buffer (pH 10.5), and subsequent incubation in
Tris-buffer (pH 8.6) containing 50 mM tag.
Figure 7.1. Haploytype accumulations curves representing random sampling of
individuals from the BOLD project “Salmonid Species North America
107
114

1
Chapter 1: General Introduction and Review of Relevant Literature Species Identification and Food
Categorization of biodiversity into species has many practical implications for food
production and authentication. The scientific names used by taxonomists to
characterize species are related to common names used by society. In food production,
management practices rely on accurate identification of pests due to differences in, for
example, life cyles or susceptibility to pesticides. In food authenticity, modern society
relies on grocery store labels for identification of products rather than hunting or growing
their own food. Many common names, and what species they are used for, may differ
based on geographical location or one common name may apply to several different
described species. Therefore, the authenticity of food products, or the validity of the
market name given on product packaging, is often tied directly to the species contained.
Food regulations are often based not on market names, but on scientific names. Certain
species may be more expensive and regulations are often in place as to what species
can be marketed under a given common name. For example the Canadian Food
Inspection Agency (CFIA) Fish List comprises a list of common market names and the
corresponding species that can be marketed legally under each name. In this way
species identification is integrally linked with food production and food authenticity.
Impact of Food Fraud
Food fraud has been defined as a collective term for the “deliberate and intentional
substitution, addition, tampering, or misrepre- sentation of food, food ingredients, or
food packaging; or false or misleading statements made about a product, for economic
gain.” (Spink and Moyer 2011). These practices have been documented throughout
history (Accum 1820) and the scope of the problem continues to grow as the
globalization of trade increases. Between 2003 and 2005 there was a 250% increase in
seizures of counterfeit food and drink by customs in Europe (OECD 2008). The
adulteration of food products is a serious economic issue and is estimated to cost
businesses between $10 and 15 billion each year (GMA 2010). High profit margins, low
risk of fraud detection and lenient penalties fuel these unethical practices. One
investigator likened olive oil adulteration to the drug trade, with similar profits to cocaine

2
trafficking, but with none of the risks (Mueller 2009). Substituting even small
percentages of products can be very lucrative, fueling continued instances of fraud.
Governments and key stakeholders in the food industry continue to develop regulations
for traceability and authenticity testing, yet these regulations are difficult to enforce
without appropriate analytical methodology and the willingness of stakeholders to
conduct product testing.
The exact terminology for economically motivated adulteration, one aspect of food
fraud, is currently being debated by regulatory bodies. For the purposes of this thesis
the term “food adulteration” is used and includes intentional mislabeling of ingredients,
species, point of origin, or processing methods as well as debasing with a cheaper
material. One common example is species mislabeling. Though economically
motivated, incorrect identification of species present in a product can also impact
lifestyle and consumer safety. For example, sheep and goat milk products are more
expensive than those made with cow’s milk. Adulteration of sheep or goat milk products
with cow’s milk may lead to an allergic reaction in consumers due to allergenic reactions
to the proteins found in cow’s milk (El-Agamy 2007). There may also be cultural or
religious reasons to avoid certain products. For example, Halal products have been
found to contain pork (Nakyinsige et al. 2012). Finally, there can be impacts to
conservation when food is sold illegally. For example, without a means to confirm
identities of fish species, there is no way to validate catches. In this way, endangered or
at risk species may be marketed as an environmentally friendly alternative.
Methods of Species Identification Normally, diagnostic morphological characters are used to identify a species. However,
most of the distinguishing characteristics used to identify species are removed in
processed food products. Since traditional taxonomy is of little use in these cases, other
methods are generally required to authenticate species. Protein-based methods were
once the primary method for food species authentication, however more recently, issues
such as heat denaturation of proteins during processing and differential expression
dependant on tissue type have spurred a move towards DNA-based techniques
(Lockley and Bardsley 2000). These issues are particularly problematic with food

3
samples, which may be heavily processed. Though protein-based analyses continue to
be used in some cases, recent tests focus on the use of DNA for species identification
in food products as it is a more stable molecule.
Methods of species identification using DNA have been extensively reviewed recently
(e.g. Sforza 2013). The techniques most commonly used for species identification in
food products are: restriction fragment length polymorphism (RFLP), species-specific
Polymerase Chain Reaction (PCR), real-time PCR and DNA sequencing. The following
is a brief summary of the major techniques for DNA authentication to determine species
content in food products and their advantages and disadvantages.
Methods for species identification using DNA
Restriction fragment length polymorphisms (RFLP)
RFLP has been the most commonly implemented method for species discrimination in
food. Table 1.1 outlines published uses of PCR-RFLP for varied foods. RFLP usually
starts with PCR amplification of a target region that will allow species discrimination.
This is followed by digestion of the amplicon with restriction enzymes. These enzymes
cut DNA at a specific sequence of nucleotides, generating fragments of DNA with
different sizes from the amplified target region. Analysis via gel electrophoresis
separates these segments on the basis of size, creating a restriction profile. These
profiles differ depending on the species, due to differences in DNA sequence, and can
be compared to a database of known profiles or to a reference standard to identify the
species present. Two major benefits of this method are that the equipment required is
easy to access and use, and that experimental design requires minimal upfront work as
previous knowledge of underlying nucleotide sequences is not always necessary if
universal primers are used for PCR. However, the process of sample preparation and
analysis is lengthy and there are several post-PCR processing steps that increase the
likelihood of error due to failure of a specific step, or sample mix up, or of contamination.
Also, issues with reproducibility call the accuracy of the method into question (Lockley
and Bardsley 2000).
4
Species-specific PCR
Species-specific PCR is another method of species authentication applied to food
products (Table 1.2). In this approach, species-specific primers are designed for a
target DNA sequence that will allow species discrimination. Various sized fragments are
generated with each species-specific primer set and used for species discrimination
after separation on an agarose gel. Compared with RFLP, prior DNA sequence
information is required, but the equipment remains easily accessible and the time for
sample analysis is reduced. Success of this type of testing is also subject to assay
design.
Real-time PCR
Real-time PCR (qPCR) has been introduced more recently as a tool for food
authentication. This method takes species-specific PCR a step further, allowing
quantification of a target. Since measurements are taken during the exponential portion
of PCR, fluorescence emission is directly proportional to the DNA copy number. Various
fluorescent reporter chemistries are available to achieve this. This is in contrast to
conventional PCR, which measures the presence of the target at the end point of the
reaction, after reagents have been depleted and amplification is no longer exponential.
Real-time PCR therefore allows quantification of the level of adulteration in addition to
species identification. Using species-specific primers and/or probes it is possible to use
this method to authenticate species content in food products, as outlined in Table 1.3.
Taqman probes (Figure 1.1) are the most commonly used probe-based chemistry. This
method is based on the use of a probe with a quencher dye on one end and a reporter
dye at the other. When in close proximity, the fluorescent signal from the reporter dye is
masked by the quencher dye. During PCR amplification the probe is cleaved, releasing
the reporter dye and emitting fluorescence which is measured by the instrument.
Different reporter dyes, emitting fluorescence at different wavelengths, can be used.
Some instruments have multiple channels of detection that each monitor a specific
range of wavelengths. By combining probes modified with dyes of different emission
spectra, simultaneous detection of multiple targets in a single reaction can be achieved.
Real-time PCR platforms, though generally more costly than traditional PCR thermal

5
cyclers, can also be portable, allowing on-site analysis. In addition, interpretation of
results is simple and analysis is very rapid in comparison to other methods. Finally,
since there is no post-PCR processing, the possibility of contamination from previous
PCR products is greatly reduced.
DNA Sequencing
DNA sequencing has also been used for species authentication in food. In this
approach, a small region of DNA is amplified using PCR, and then a sequence of the
amplicon is obtained using Sanger sequencing. The sequence is then compared to a
database of sequences to determine the species. Rather than simply authenticating a
sample from a small group of anticipated possibilities, DNA sequencing can identify the
species against all known sequences in the database being used. DNA sequencing has
been applied to identify species in food products directly; however, this method is not
generally suitable for all food products as the ability to detect species in mixtures is
limited. Additionally, the region used may be too long to recover from highly processed
samples (Sforza 2013), unless a smaller subset is targeted (e.g. Hajibabaei et al. 2006).
Despite these limitations, DNA sequencing is of key importance in the design and
success of the aforementioned methods of species identification, particularly the quality
of the reference database used for comparison, or for assay design.
Standardization of gene region
Currently, a handful of different regions have been targeted for DNA-based species
identification in animals and plants. Largely these are mitochondrial or chloroplast
markers, selected for their presence in high copy number, and more rapid rate of
molecular evolution, compared to nuclear DNA. This can be crucial for the analysis of
processed or otherwise degraded samples where only trace amounts of DNA may be
present. The DNA region selected to discriminate species directly affects the success of
the methods discussed above. It must be variable enough to discriminate between
species, yet exhibit low variability within the same species. Standardization of the region
for species identification, coupled with broad taxonomic surveys, would aid in the
development of diagnostic testing for food authentication by allowing tests to be more
broadly applicable across a wide range of taxa. In cases where molecular species

6
identification is needed, a compelling argument can be made for using DNA barcoding,
a species identification method based on sequencing of a short standardized gene
region, as the standard for food analysis.
The DNA barcode region for animals is 658 bp of the mitochondrial cytochrome c
oxidase subunit one (COI) gene (Hebert et al. 2003). For plants, a combination of the
chloroplast maturase K gene (matK) and ribulose-1,5-bisphosphate
carboxylase/oxygenase large subunit rbcL genes are used (CBOL Plant Working Group
2009) and Internal Transcribed Spacer (ITS) has been identified as a standard marker
for fungal identification (Schoch et al. 2012). These regions, like others selected for
species identification, generally exhibit low levels of variability within a species, and
higher levels of variability between species.
DNA barcode sequences available on the Barcode of Life Data System (BOLD;
www.barcodinglife.org, Ratnasingham and Hebert 2007) are accompanied by data that
can be crucial to successful design of assays for species identification. Errors in
common nucleotide databases, like GenBank (Harris 2003) can result in incorrect
identification when using sequencing, and also lead to false positives and false
negatives if used in the for development of other identification assays. The BOLD
database is a useful source of high-quality sequences and corresponding metadata for
the development of DNA-based assays for species differentiation in food products.
Many of these sequences are generated from specimens identified by expert
taxonomists, reducing the likelihood or erroneous identifications. A voucher held in a
collection also makes it possible to confirm identifications at a later date. Additional
information such as geographic location from which the sample was collected, is also
included with each entry. This can help provide both an adequate number of sequences
in general for assay development, and also the option to include individuals from varied
geographic range when selecting sequences from which to develop an assay.
For sequences to be considered a true “BARCODE” sequence, BOLD requires raw
trace files to be submitted. When comparing sequences for species identification using
genetic distance, one or two errors in a DNA sequence may not make a difference in
accurate identification. However, when developing species-specific primers or probes, a

7
single nucleotide difference can affect results, causing false positives or false negatives.
The ability to view trace files avoids inclusion of artificial haplotypes generated from
sequencing error. Standardization of the gene region used allows a wider range of taxa,
and a larger number of target individuals from a wider geographic range to be included
in assay design without upfront sequencing costs associated with obtaining specimens
and generating new sequences each time an assay is developed.
DNA barcoding has been applied across a wide range of taxa and results are publicly
accessible in BOLD. Many of the most commercially important species have already
been targeted, and the continued growth of the database of DNA barcode sequences
will increase the method’s robustness to the identification of adulterated foods. In fact,
the use of DNA barcoding for food authenticity has been recently reviewed (Galimberti
et al. 2013), and the method has been adopted as the official regulatory test for seafood
in the United States (Handy et al. 2011). Additionally, this method can be used to
authenticate herbal products (Newmaster et al. 2013), an area where product
authenticity is often related to the species of plant present. Table 1.4 outlines examples
where DNA barcoding has been used to determine product authenticity.
DNA barcoding has also been applied to the identification of agricultural pests, as
reviewed by Frewin et al. (2013). Pest identification can be very difficult to accomplish
based on morphology, yet accurate classification is critical information for quarantine
purposes and crop management. Therefore, assays designed from DNA barcode
sequences can be used for the identification of species relevant to the complete food
supply chain from crop management to retail products.
Limitations of DNA analysis
Although outside the scope of this review, other DNA-based methods for species
authentication that have been used to a lesser extent include biosensors and
microarrays in addition to next generation sequencing techniques, which may begin to
be applied more commonly to issues relating to food authenticity. DNA can be used for
more than authenticating species as some instances of food adulteration relate to the
geographic origin of the product. In these instances methods such as Amplified
Fragment Length Polymorphism (AFLP) and microsatellites, mainly used to differentiate

8
populations, may be used. Several DNA-based methods, including those discussed
above, are commonly used for the identification of breeds/varieties/cultivars and
Genetically Modified Organisms (GMOs). These are not questions of authenticity at the
species-level, but still benefit from DNA analysis for authentication. These methods
often require a large amount of upfront work to locate and select regions of DNA that
will allow differentiation between populations or breeds/varieties/cultivars.
There are other instances of adulteration that cannot be detected by DNA analysis.
Authentication of organic products, for example cannot be carried out using DNA. Other
analytical methods have been suggested for a small number of these applications,
however they are often unable to clearly identify these attributes (Sforza 2013).
Currently, the best approach for establishing authenticity of these types of products is
rigorous supply chain traceability.
Food Traceability
Regulation EC/178/2002 of the EU General Food Law defines traceability as the ability
to trace and follow food, feed, and ingredients through all stages of production,
processing and distribution. In light of consumer expectations for safe, quality products,
traceability is a major concern for food companies (Hobbs 2006). The ability to track a
product from harvest through transport, storage, processing, distribution and sale is
essential to trace problematic batches to their origins. By swiftly identifying and
removing problematic batches, companies can minimize their impact on consumer
safety as well as minimize costs related to recalls (Golan et al. 2003). Effective
traceability measures also allow companies to identify credence attributes, such as
environmentally friendly production, to the public (Golan et al. 2003, Smith and Furness
2006).
Some governments have implemented traceability regulations to address food safety
concerns. These may pertain to a specific sector (e.g. Japan mandates traceability of
domestic beef) or the regulation of food traceability more generally. For example, the
European Union (Article 18 of the General Food Law), United States (Title III, subtitle A,
section 301 of the Bioterrorism Act) and Canada (Federal-Provincial-Territorial
Framework Agreement on Agricultural and Agri-food Policy for the Twenty-first Century)

9
all have legislation in place regarding food traceability. Guidelines exist to assist in
developing traceability systems. The International Article Number (EAN) has developed
the following documents: Traceability of Fish – Application of EAN.UCC Standards,
Traceability of Beef Guidelines, Fresh Produce Traceability Guidelines, Traceability in
the Supply Chain and Traceability Implementation. The Codex Alimentarius, established
by the World Health Organization and Food and Agricultural Organization of the United
Nations, also has international guidelines for the development of traceability systems.
Currently, these guidelines are provided for voluntary implementation of traceability
within a supply chain. However, there is increasing pressure on exporters to meet
traceability requirements of the receiving country, and as such there is a growing push
towards global standards for food traceability.
The most widely used coding system for product traceability is the International
Numbering Association Universal Code Council (EAN.UCC) system (Smith and Furness
2006). This system provides a sequence of numbers designated to identify a variety of
items, locations and services and includes the familiar Global Trade Identification
Number (GTIN) used to identify trade items. A combination of 8, 12, 13 or 14 numbers
is used for product identification, including a company prefix number, an item reference
number and a check digit (Smith and Furness 2006). This code can be readily
incorporated into different types of data carrier technologies.
Current data carrier technologies include 1D and 2D data barcodes, as well as
radiofrequency identification (RFID) tags (Smith and Furness 2006), as well as external
labeling of information such as product origin on packaging. Barcodes are the most cost
efficient form of storing traceability coding, however they are limited because they
require line of sight for identification (Smith and Furness 2006). RFID tags can be
applied inside any packaging through which radio waves can penetrate. This provides
advantages over barcode tags, but RFID chips are not cost-effective in comparison,
especially for use on low-cost items (Smith and Furness 2006). Additionally, RFID
frequencies are not harmonized worldwide, so tags are not universally readable (Smith
and Furness 2006). The main application of RFID tags is for tracing livestock, like cattle

10
(Smith and Furness 2006). Laser labeling directly onto fruit products has been a recent
technological advancement in food labeling (http://www.laserfood.es).
The above data carrier technologies focus on labeling packages rather than the
products themselves. The main issue with this type of external tagging is the ease with
which a label, or even RFID tag, can be tampered with. This leaves open the
opportunity for fraud. Additionally, it is not possible to track separate ingredients in
mixed products using these methods, as only the final product is tagged. Traceability
could be improved with the use of internal tags used directly in food products.
Summary
For consumers, adulteration can cause economic losses, but also can affect lifestyle
religious choices, and even safety. For cases where adulteration is based on species
substitution, DNA analysis can often provide a means to authenticate samples. The
adoption of standard gene regions from which to design these tests will improve their
development and success at accurately discerning market fraud. The DNA barcode
regions for plants and animals are an ideal choice due to the existence of BOLD, which
provides crucial information including photographs, geographical location and raw trace
files that assist in assay development. Many sequences also have voucher specimens
that can be used for confirmation of identification. Additionally, the range of species
represented in BOLD continues to grow. Notably, the DNA barcode region is ideal for
development of tests to identify species at all stages of the food production and
distribution chain – from agricultural pests to retail stores and restaurants.
When species-level identification is not the concern, other methods that focus on
population differences may be adopted to provide finer identification below the species
level using DNA. In other cases DNA analysis is not helpful in determining authenticity.
These cases include very highly processed foods where endogenous DNA is too
degraded to detect, or cases like determining the authenticity of organic foods, where it
is not applicable. In these situations, proper traceability is the best defense against
adulteration.

11
Current traceability systems still allow opportunities for fraud, mainly due to the use of
external labels which track and authenticate only the package, not the product itself.
Internal traceability tags may improve traceability systems, especially in foods where a
high level of fraud is suspected.
The following chapters will explore DNA-based species identification and product
authenticity methods in the agriculture and food industries. Section one contains results
from studies in which DNA barcoding, and tests derived from DNA barcode sequences,
are used for species identification of agricultural pests and retail products. Identification
of seafood products using DNA barcoding confirms the utility of DNA barcoding in this
application, as well as revealing a continued presence of mislabeling in the North
American market. To explore more cost-effective, portable and rapid methods than
Sanger sequencing, real-time PCR assays designed from DNA barcode sequences for
market sample identification, existing primers and probes were evaluated for salmonid
identification. A more rapid traditional PCR protocol is also proposed. Finally, two real-
time PCR assays targeting pest aphids are developed, exhibiting the potential for field
applications using DNA barcode sequences. This method of identification could lead to
more rapid and accurate implementation of control measures for agricultural pests that
threaten perishable commodities. While section one showcases the applicability of
species identification to food production and authenticity testing, section two
demonstrates a method for traceability and authenticity testing where endogenous DNA
is not available. A proof of concept is presented for the use of an oligonucleotide tags
(ONTs), comprised short synthetic single-stranded DNA fragment, as an internal
traceability tag for food products, including two different methods for tag detection.
This research represents a significant contribution to new knowledge concerning global
food security and integrity as it relates to species identification. By exploring the link
between molecular species recognition and food security, the importance of continued
efforts to understand biodiversity is underscored. Continued research into the patterns
of genetic and geographic diversity within species is crucial not only to understanding
the processes of biological diversification, but also to applied questions of
socioeconomic importance. Moreover, novel use of an oligonucleotide traceability

12
system for food products represents an important evolution in how food products may
be traced and will be of interest to the food industry as a tool that, in combination with
authenticity testing, will help ensure a safe and unadulterated food supply.

13
Table 1.1 Studies employing PCR-RFLP for species authentication in food products.
Target(s) Genetic Marker References
Cattle, sheep, goat, domestic pig, horse, buffalo, chicken, turkey, red deer, moose, antelope, chamois, mouflon, wild boar, and kangaroo
Cytochrome b Meyer et al. 1995
Cattle, sheep, goat, domestic pig, red deer, and sika deer
Cytochrome b Matsunga et al. 1998b
Red deer, fallow deer, roe deer, bison, and hare
Cytochrome b Zimmermann et al. 1998
Cattle, sheep, goat, buffalo, red deer, fallow deer, moose, antelope, gazelle, wildebeest, chamois, Pyrenean ibex, kangaroo, and hare
Cytochrome b Wolf et al. 1999
Domestic pig and wild boar D-loop region Montiel-Sosa et al. 2000
Cattle, sheep, goat, domestic pig, buffalo, duck, chicken, turkey, rabbit, red deer, kangaroo, horse, emu, crocodile, barramundi, cat, dog, salmon, tuna, Nile perch, and John dory
Cytochrome b Partis et al. 2000
Ostrich Cytochrome b Abdulmawjood and Buelte 2002
Wild boar and domestic pig D-loop region Krkoska et al. 2003
Cattle, domestic pig, and goat
12S rDNA Sun and Lin 2003
Cattle, water buffalo, Cytochrome b and Verkaar et al. 2002

14
African buffalo, bison, banteng, gayal, yak, wisent, and zebu
Cytochrome oxidase II
Cattle, goat, sheep, domestic pig, horse, rabbit, ostrich, duck, chicken, turkey, partridge, red deer, roe deer, and wild deer
Cytochrome b Pascoal et al. 2004
Cattle, sheep, goat, red deer, and roe deer
Cytochrome b Pfeiffer et al. 2004
Domestic pig, cattle, sheep, and chicken
Cytochrome b Aida et al. 2005
Cattle, sheep, goat, and buffalo
12S rRNA Girish et al. 2005
Horse, donkey, and their hybrids
Protamine P1 and Cytochrome b
Zhao et al. 2005
Cattle, sheep, goat, red deer, fallow deer, and roe deer
12S rRNA Fajardo et al. 2006
Bovines, porcines, equines, cervids, and birds
Cytochrome b Maede 2006
Buffalo, wildebeest, zebra, gazelle, impala, reedbuck, kongoni, oryx, warthog, and hippopotamus
D-loop region Malisa et al. 2006
Cattle, sheep, goat, chamois, Pyrenean ibex, and mouflon
12S rRNA and D-loop region
Fajardo et al. 2007a
Chicken, duck, turkey, guinea fowl, and quail
12S rRNA Girish et al. 2007
Cattle, domestic pig, horse, chicken, duck, turkey, and red deer
12S rRNA Park et al. 2007

15
Peacock, chicken, and turkey
12S rRNA Saini et al. 2007
Wild boar and domestic pig MC1R Fajardo et al. 2008a
Spotted deer, hog deer, barking deer, sika deer, musk deer, and sambar deer
12S rRNA Gupta et al. 2008
Domestic pig and chicken 12S rRNA Sharma et al. 2008
Chicken, turkey, Muscovy duck, goose, quail, pheasant, red-legged partridge, chukar partridge, guinea fowl, capercaillie, Eurasian woodcock, woodpigeon, and song thrush
12S rRNA and
D-loop region
Rojas et al. 2008, 2009a
Carrle, sheep, and domestic pig
ATP synthase subunit B Natonek-Wisniewska et al. 2009
Red brocket deer, pygmy brocket deer, and gray brocket deer
Cytochrome b Gonzalez et al. 2009
Buffalo, cattle, goat, domestic pig, rabbit chicken, and quail
Cytochrome b Murugaiah et al. 2009
Cattle, goat, sheep, domestic pig, red deer, roe deer, and fallow deer
12S rRNA Bielikova et al. 2010
Beef and pork Cytochrome b Chandrika et al. 2010
Cattle, yak, buffalo, goat, and domestic pig
12S rRNA Chen et al. 2010
Cattle, sheep, goat, domestic pig, horse, rabbit, duck, chicken, pheasant, falcon, wild boar, Chinese
Zinc nuclear finger 238 Kim et al. 2010a

16
water deer, roe deer, Formosan deer, kangaroo, wolf, dog, raccoon, vulture, elephant, and hippopotamus
Chicken, turkey, duck, goose, pheasant, partridge, woodcock, ostrich, quail, and song thrush
Cytochrome b and
12S rRNA
Stamoulis et al. 2010
Cattle, sheep, goat, domestic pig, horse, chicken, turkey, buffalo, deer, dog, sturgeon, and salmon
12S rRNA Wang et al. 2010
Cattle, sheep, goat, and buffalo
12S rRNA Mahajan et al. 2011
Cattle, sheep, domestic pig, chicken, donkey, and horse
Cytochrome b Doosti et al. 2012
Cattle, sheep, domestic pig, chicken, turkey, buffalo, camel, and donkey
Cytochrome oxidase I, COI Haider et al. 2012
Domestic pig Cytochrome b Ali et al. 2011
Anchovies Cytochrome b Santaclara et al. 2006
Anglerfish Cytochrome oxidase I, COI Espineira et al. 2008
Salmonids Cytochrome b Espineira et al. 2009
Salmonids 5S rRNA Carrera et al. 1998,1999
Gadoids 12S and 16S rRNA DiFinizio et al. 2007
Mussels 18s rDNA Santaclara et al. 2006
Cephalopods Cytochrome b Sanataclara et al. 2007

17
Table 1.2. Studies using species-specific PCR to authenticate species in food products.
Target(s) Genetic Marker Reference
Cattle, sheep, goat, domestic pig, horse, and chicken
Cytochrome b Matsunaga et al. 1999
Ostrich and emu Cytochrome b Colombo et al. 2000
Cervid species (spotted deer, Ceylon hogdeer, Ceylon sambhur, and barking deer)
Cytochrome b Rajapaksha et al. 2002
Chicken and turkey Cytochrome b Hird et al. 2003
Buffalo Cytochrome b Rajapaksha et al. 2003
Duck, goose, chicken, turkey, and domestic pig
12S rRNA Rodriguez et al. 2003
Cattle, sheep, goat, and domestic pig
12S rRNA Rodriguez et al. 2004a
Red deer, roe deer, and fallow deer
12S rRNA Fajardo et al. 2007b
Chamois, Pyrenean ibex, and mouflon
D-loop region Fajardo et al. 2007c
Pheasant, quail, guinea fowl, chicken, turkey, duck, and goose
Cytochrome b Stirtzel et al. 2007
Domestic big 12S rRNA Che Man et al. 2007
Bovine, sheep, goat, domestic pig, horse, dog, and cat
Cytochrome b Ilhak and Arslan 2007
Domestic pig, horse, and donkey
ATP synthase subunits 8/6 and NADH hydrogenase subunits 2/5
Kesman et al. 2007
Ducks and Muscovy duck 12S rRNA Martin et al. 2007

18
Cattle, sheep, goat, domestic pig, horse, donkey, red deer, cat, dog, fox, guinea pig, hedgehog, badger, harvest mouse, house mouse, rat, and rabbit
Cytochrome b Tobe et al. 2008
Cattle, domestic pig, horse, and chicken
Cytochrome b Bai et al. 2009
Ruminant, poultry, and pork 16S rRNA and 12S rRNA Ghovvati et al. 2009
Quail, pheasant, partridge, and guinea fowl
12S rRNA Rojas et al. 2009b
Cattle and yak 12S rRNA Yin et al. 2009
Cattle, domestic pig, and chicken
Cytochrome b Velebit et al. 2009
Quail, pheasant, partridge, quinea fowl, pigeon, Eurasian woodcock, and song thrush
D-loop region Rojas et al. 2010a
Domestic pig and poultry Cytochrome b and 12S rRNA
Soares et al. 2010
Buffalo D-loop region Girish et al. 2011
Water buffalo, goat, and sheep D-loop region Karabasanavar et al. 2011a, b, c
Goat D-loop region Kumar et al. 2011
Red-legged partridge, gray partridge, and genus Alectoris (red-legged partridge, chukar partridge, and Barbary partridge species)
12S rRNA Rojas et al. 2011a
Cattle, domestic pig, chicken, and crocodile
Cytochrome b and HADH hydrogenase subunits 5/6
Unajak et al. 2011
Cattle, sheep, goat, and buffalo Cytochrome b Zarringhabaie et al. 2011

19
Buffalo D-loop region Mane et al. 2012
Barley, bread and durum wheat, oat, rye, maize, and rice
Multiple targets Alary et al. 2007

20
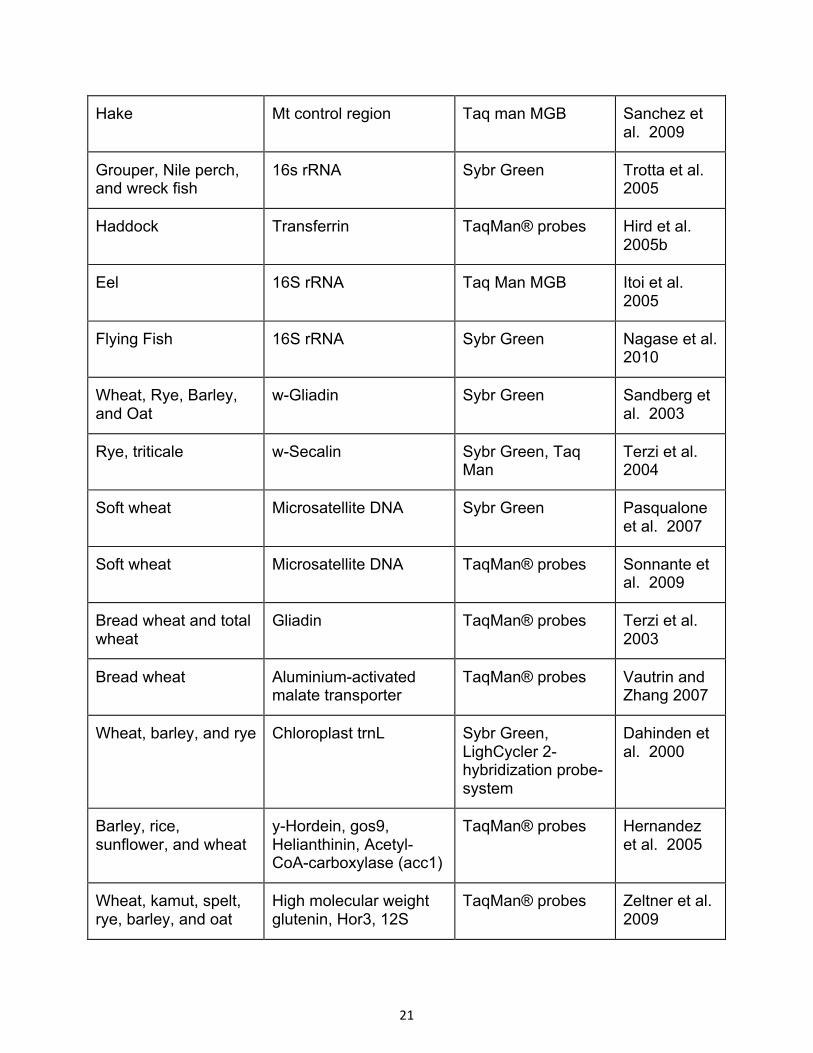
Table 1.3. Studies using real-time PCR to authenticate species in food products.
Species Genetic Marker Real-time Chemistry
References
Cattle Bovine growth hormone TaqMan® probes Brodmann and Moor 2003
Pork Cytochrome b TaqMan® probes Hird et al. 2004
Beef Mt ATPase 8 subunit LighCycler 2-hybridization probe system
Tasara et al. 2005
Beef, pork, chicken, and ruminants
SINE – short interspersed elements
Sybr Green Walker et al. 2003
Beef, pork, chicken, and turkey
B-Actin, Transforming growth factor, Prolactin receptor
TaqMan® probes Köppel et al. 2008
Horse and donkey Cytochrome b TaqMan® probes Chisholm et al. 2005
Beef Cytochrome b TaqMan® probes Lopparelli et al. 2007
Beef 12S rRNA TaqMan® probes Lopez-Calleja et al. 2007b
Goat 12S rRNA TaqMan® probes Lopez-Calleja et al. 2007a
Tuna Cytochrome b TaqMan® probes Lopez and Pardo 2005
Cod ATPase 6 Sybr Green Bertoja et al. 2009
21
Hake Mt control region Taq man MGB Sanchez et al. 2009
Grouper, Nile perch, and wreck fish
16s rRNA Sybr Green Trotta et al. 2005
Haddock Transferrin TaqMan® probes Hird et al. 2005b
Eel 16S rRNA Taq Man MGB Itoi et al. 2005
Flying Fish 16S rRNA Sybr Green Nagase et al. 2010
Wheat, Rye, Barley, and Oat
w-Gliadin Sybr Green Sandberg et al. 2003
Rye, triticale w-Secalin Sybr Green, Taq Man
Terzi et al. 2004
Soft wheat Microsatellite DNA Sybr Green Pasqualone et al. 2007
Soft wheat Microsatellite DNA TaqMan® probes Sonnante et al. 2009
Bread wheat and total wheat
Gliadin TaqMan® probes Terzi et al. 2003
Bread wheat Aluminium-activated malate transporter
TaqMan® probes Vautrin and Zhang 2007
Wheat, barley, and rye Chloroplast trnL Sybr Green, LighCycler 2-hybridization probe-system
Dahinden et al. 2000
Barley, rice, sunflower, and wheat
y-Hordein, gos9, Helianthinin, Acetyl-CoA-carboxylase (acc1)
TaqMan® probes Hernandez et al. 2005
Wheat, kamut, spelt, rye, barley, and oat
High molecular weight glutenin, Hor3, 12S
TaqMan® probes Zeltner et al. 2009

22
seed storage protein
Hazelnut cora1, cora8, cora14 Sybr Green D’Andrea et al. 2011
Hazelnut hsp1 Real-time PCR Piknova et al. 2008
Peanut ara h 2 Real-time PCR Hird et al. 2003b
Peanut ara h 2 Real-time PCR Stephan and Veiths 2004
Peanut ara h 3/4 TaqMan® probes Scaravelli et al. 2008
Walnut jug r2 TaqMan® probes Brezna et al. 2006b
Celery Mannitol Dehydrogenase
TaqMan® probes Hupfer et al. 2007
Celery, mustard, and sesame
Mannitol Dehydrogenase, 2S albumin, sinA
TaqMan® probes Mustorp et al. 2008
White mustard MADS D TaqMan® probes Fuchs et al. 2010
Buckwheat ITS-1 and 5.8S rRNA Sybr Green Hirao et al. 2005
Lupin a-Conglutin, o-Conglutin TaqMan® probes Galan et al. 2010
Lupin and soy tRNA-Met TaqMan® probes Galan et al. 2011
Lupin y-Conglutin Sybr Green Scarafoni et al. 2009
Lupin rDNA 18s-5.8s internal transcribed spacer
TaqMan® probes Demmel et al. 2008

23
Olive cultivars Microsatellite DNA Sybr Green Breton et al. 2004
Orange, blueberry, strawberry, and pineapple
Anthocyanidine synthase and/or 5s rRNA
Sybr Green, Eva Green, Taq Man
Palmieri et al. 2009
Tomato, Potato Metallo carboxy-peptidase inhibitor
TaqMan® probes Hernandez et al. 2003
Acacia, broom, citrus, clover, heather, eucalyptus, lavender, linden, oak, olive, rape, rockrose, rosemary, sunflower, and sweet chestnut
adh1, Actin, adh1, Actin, Leafy/Floricauly, hmg, Nitrate reductase, Phenylalanine ammonia-lyase, ole e 10, lipase 1, DXR, adh1, Profilin, ypr 10; PAL
TaqMan® probes Laube et al. 2010
Pea legS TaqMan® probes Ramos-Gomez et al. 2008
Pea Chloroplast trnL-trnF spacer
TaqMan® probes Brezna et al. 2006a
Wasabi Myrosinase TaqMan® probes Eugster et al. 2011
Non-basmati Rice bad2 TaqMan® probes Lopez 2008
Bovine and swine GMP phosphodiesterase and ryanodin
TaqMan® probes Laube et al. 2003
Cattle Control region SYBR® green Sawyer et al. 2003
Cattle, sheep, domestic pig, chicken, and turkey
Cytochrome b TaqMan® probes Dooley et al. 2004
Horse and donkey Cytochrome b TaqMan® probes Chisholm et al. 2005
Cattle, sheep, Cytochrome b TaqMan® probes Lopez-

24
domestic pig, chicken, turkey, and ostrich
Andreo et al. 2005
Duck 12S rRNA TaqMan® probes Rodriguez et al. 2004b
Domestic pig 12S rRNA TaqMan® probes Rodriguez et al. 2005
Cattle, domestic pig, horse, and kangaroo
Cytochrome b SYBR® green Lopez-Andreo et al. 2006
Mallard and Muscovory duck
Cytochrome b TaqMan® probes Hird et al. 2005a
Cattle, sheep, domestic pig, chicken, goat, duck, and turkey
GMP phosphodiesterase
TaqMan® probes Laube et al. 2007
Cattle, sheep, domestic pig, horse, and chicken
Cytochrome b TaqMan® probes Tanabe et al. 2007
Cattle, sheep, domestic pig, horse, chicken, and turkey
Cytochrome b TaqMan® probes Jonker et al. 2008
Red deer, fallow deer, and roe deer
12S rRNA SYBR® green Fajardo et al. 2008b
Chamois and Pyrenean ibex
D-loop SYBR® green Fajardo et al. 2008c
Pheasant and quail Cytochrome b TaqMan® probes Chisholm et al. 2008a
Chamois and Pyrenean ibex
D-loop TaqMan® probes Fajardo et al. 2009b
Quail, pheasant, partridge, guinea fowl, pigeon, Eurasian woodcock, and song thrush
12S rRNA TaqMan® probes Rojas et al. 2010b

25
Domestic pig Cytochome b SYBR® green Farrokhi and Jafari 2011
Cattle, sheep, domestic pig, and horse
Beta-actin, growth hormone receptor, and prolactin receptor
TaqMan® probes Koppel et al. 2011
Domestic pig and wild boar
MC1R TaqMan® probes Mayer and Hochegge 2011
Ostrich 12S rRNA SYBR® green TaqMan® probes
Rojas et al. 2011b
Capercaillie 12S rRNA SYBR® green
TaqMan® probes
Rojas et al. 2011c
Domestic pig Cytochrome b Molecular beacon Yusop et al. 2011
Domestic pig Cytochrome b TaqMan® probes Ali et al. 2012b
Cattle, sheep, domestic pig, chicken, and turkey
Cytochrome b and 16S rRNA
TaqMan® probes Camma et al. 2012
Common pigeon, woodpigeon, and stock pigeon
12S rRNA TaqMan® probes Rojas et al. 2012
Ruminant and poultry 16S rRNA-tRNA and 12S rRNA
SYBR® green Sakalr and Abasiyanik 2012
Lepus species Cytochrome b EVA® green Santos et al. 2012
Durum wheat Puroindoline-b TaqMan® probes Alary et al. 2002

26
Table 1.4. DNA barcoding for species identification and authentication of food and herbal medicines.
Application Reference
Seafood market survey Wong and Hanner 2008
Catfish identification Carvalho et al. 2011
Catfish identification Wong et al. 2011
Seafood market survey Ardura et al. 2010
Pufferfish identification Cohen et al. 2009
Shark market survey Barbuto et al. 2010
Seafood market survey Filonzi et al. 2010
Seafood market survey Hanner et al. 2011
Tuna sushi Lowenstein et al. 2010
Indian marine fishes Lakra et al. 2011
Canadian Pacific fishes Steinke et al. 2009
Commercial fishes of South Africa Cawthorn et al. 2011
Nigerian freshwater fish Nwani et al. 2011
Catfish Santos and Quilang 2011
Salmonids Rasmussen et al. 2009
Billfishes Hanner et al. 2011
Bushmeat Eaton et al. 2010
Antelope Bityanyi et al. 2011
Bushmeat Dalton and Kotze 2011

27
Olive oil and adulerants Kumar et al. 2011
Tea market survey Stoeckle et al. 2011
Lamiacaea and adulterants Guo et al. 2011
Dendrobium species Asahina et al. 2010
Astragalus Guo et al. 2010
Lamiacaea De Mattia et al. 2011
Poisonous plants Bruni et al. 2010
Sabia parviflora and its adulterants Sui et al. 2010.
Fabacae Gao et al. 2010
Herbal product market survey Newmaster et al. 2013

28
Figure 1.1. Taqman probe chemistry. A: After denaturation, the temperature is lowered and the Taqman probe binds to the complimentary segment of DNA on the target. At this point, the presence of the quencher dye (red) masks the fluorescence emission from the reporter dye (green). Primers (blue) then bind as cooling continues. B. During the extension step, the temperature is raised again to 72 ˚C and DNA polymerase (yellow) extends the primer sequence to form a segment of DNA complimentary to the target. C. As DNA polymerase encounters the Taqman probe, the probe is cleaved, separating the quencher from the reporter dye. The reporter dye emits fluorescence that can be measured by the instrument. In this way, a signal is only generated when target DNA is present in a sample and fluorescence is also proportional to DNA concentration.
A
B
C

29
Section 1: The Use of Endogenous DNA for Species-Specific Identification for Authentication of Agricultural Pests or Food Products Chapter 2: Seafood Market Survey Using DNA Barcoding
Building on existing methods, a seafood market survey was conducted using DNA barcoding to identify market samples. High school students across Ontario participated in this large-scale citizen science project. Introduction
Food fraud is an issue of socioeconomic concern globally. Substitution or mislabeling of
species is one form of fraud. It has obvious economic implications to consumers when a
lower-cost product is labeled as one with a higher value. There can also be health
implications as different species have varying levels of heavy metals (Lowenstein et al.
2010) and nutritional value (Weaver et al. 2008), or may even be toxic (Cohen et al.
2009). Consumers may also make choices to purchase sustainable species of seafood,
however, at-risk species can be marketed as sustainable alternatives in some cases
(e.g.. Wong and Hanner 2008; Barbuto et al. 2010). Public awareness of these issues is
growing. Consumers demand high-quality, authentic and environmentally sustainable
products. Seafood consumption is also on the rise. With globalization of trade, it can be
difficult to track and authenticate seafood products, creating the possibility for
misrepresentation of products, both intentionally and unintentionally. To combat this,
regulatory bodies must utilize new methods for authenticity testing.
DNA barcoding is a method for species identification that takes advantage of
differences in the DNA sequence of a standard gene region in order to identify species
(Hebert et al. 2003). By genetically profiling expert-identified reference specimens, the
resulting “look-up table” can be used to identify an unknown sample by its DNA barcode
(via the Barcode of Life Data System or BOLD; Ratnasingham and Hebert (2007). This
approach is particularly useful when diagnostic morphological characters are removed,
for example during seafood processing. Since 2008, this method has been gaining in
popularity as a rapid and accurate method for species identification of seafood products.

30
In 2011, it was adopted by the United States Food and Drug Administration (FDA) as
the primary method of regulatory control of seafood products (Handy et al. 2011).
DNA barcoding has been used in several market studies (Wong and Hanner 2008,
Hanner 2011, Miller and Marianai 2010, Cline 2012, Barbuto et al. 2012, Alba et al.
2010, Filonzi et al. 2010, Carvalho et al. 2011). These studies have continued to shed
light on instances of fraud found in the seafood industry around the world. Additionally,
the media coverage of instances of food fraud has further empowered citizens to make
informed decisions about their seafood consumption. To further encourage citizen
involvement, a large-scale seafood market survey was developed. In partnership with
Let’s Talk Science, a national not-for-profit organization dedicated to science outreach,
high school teachers in Ontario, Canada, were provided with the tools to use DNA
barcoding to identify seafood products gathered by high school students from their local
grocery stores to determine if any mislabeling had occurred.
Methods
Sample Collection
High school teachers from the Let’s Talk Science network were invited to participate in
the market survey. After signing up, teachers were given instructions on sample
collection in the form of a lesson plan that could be shared with students. To increase
interest, supplementary lessons covering aspects of the seafood supply chain and DNA
barcoding were also provided online at
http://www.explorecuriocity.org/Community/ActionProjects/MarketSurvey.aspx. This
included a list of market names to limit the types of seafood purchased in order to
streamline collection and analysis. The following market names were suggested:
salmon, bass, snapper, tilapia, basa, shark, halibut, haddock, cod, yellowtail, catfish,
pickerel, whitefish, perch, orange roughy, sole and pollock. We also received samples
with the following market names: swordfish, rockfish, mussel, yellowtail, walleye, flying
fish roe, artificial crab, Alaskan snow crab, eel, rainbow trout, and monkfish. Products
were required to be fresh or fresh frozen only rather than processed.

31
After creating a sampling plan in class to minimize overlap in the species collected and
stores visited, students went to a local store to purchase their seafood products.
Teachers provided, from the lesson plan materials, data collection sheets for students to
fill out for each sample. We provided each teacher with 1.5mL microcentrifuge tubes,
each with a unique sample ID number. Small (~ 2 cm3) tissue subsamples of each
product were collected by students, and deposited into a unique pre-labeled vial and
preserved using 95% ethanol.
DNA Barcoding
Samples were shipped to the Biodiversity Institute of Ontario for analysis using standard
DNA barcoding protocols (http://ccdb.ca/resources.php) and C_FishF1t1/C_FishR1t1
primers (Ivanova et al. 2007). Failures, those sequences where a DNA barcode could
not be obtained due to failed PCR, were amplified and sequenced again using AquaF2
(Prosser unpublished)/C_FishR1T1 primers. Results of DNA barcoding, along with
collection data sent by students, were entered into the Barcode of Life Data System
(BOLD; www.barcodinglife.org) online database.
Species Identification
DNA barcodes were entered into the BOLD identification tool to determine a species-
level match. Sequence similarity of 98% or higher was determined to be a match. If the
sequence could not be identified using BOLD, an NCBI BLAST search of GenBank was
used.
The species name determined from the DNA barcode was then compared to the market
name using the Canadian Food Inspection Agency (CFIA) fish list. If the market name
from the sample package was listed under the species name obtained from BOLD on
the CFIA fish list, the sample was considered correctly labeled. If not, or if the species
name was not found on the CFIA Fish List, this was considered mislabeling. In cases
where the common name could not be identified for a scientific name using the CFIA
Fish List, Fish Base global database (http://www.fishbase.org) was used to assign a
common name.

32
Results and Discussion
A total of 322 samples with complete data sheets were submitted for sequencing. DNA
barcodes were obtained from 294/322samples (91%). Full-length barcodes were
obtained from 265 samples and a further 29 samples yielded shorter mini-barcodes. All
but one barcode sequence had a match in BOLD of at least 98%. The closest match to
LTSMS619 from GenBank was Shewanella baltica at 86%.
In total, 70/295 samples (24%) were identified as potentially mislabeled using the CFIA
Fish List as a guide (Table 2.1). This level of mislabeling is similar to that found in
previous market surveys (Wong and Hanner 2008, Hanner 2011, Marko et al. 2004,
Miller and Marianai 2010, Cline 2012, Barcuto et al. 2012, Alba et al. 2010, Filonzi et al.
2010, Carvalho et al. 2011). High levels of mislabeling were found in red snapper
(80%), whitefish (75%) and shark (100%) samples. Snapper (71%) and bass (53%) also
had high levels of mislabeling. We found between 25% and 50% mislabeling in sole,
perch and tuna and those samples listed in the “other” category. No specific species
seem to be consistently substituted for any of these market names.
Of the 70 cases of suspected mislabeling, 32 were straightforward examples where the
species determined with DNA barcoding was found on the CFIA Fish List and did not
match the market name listed on the product. Tilapia (Oreochromis sp.) was
substituted for red snapper and cod. Tilapia is cheaper than both cod and red snapper,
and substitution might be considered a case of economic fraud. However, substitution
with farmed fish, such as tilapia, may have other unintended consequences to human
health. These may also contain environmental contaminants such as heavy metals and
carcinogenic chemicals from the fish farming process (Sapkota et al. 2008). This type of
contamination can be monitored, but only if the species is known and the product is
labeled accurately, emphasizing the link between species authentication and food
safety.
Another example in this category was labeled bass but was identified as Dissostichus
mawsoni, Antarctic toothfish. Although this species has not yet been assessed by the
International Union for Conservation of Nature (ICUN), there has been concern about
the effect of industrial fishing on the Antarctic toothfish in the Ross Sea on not only
33
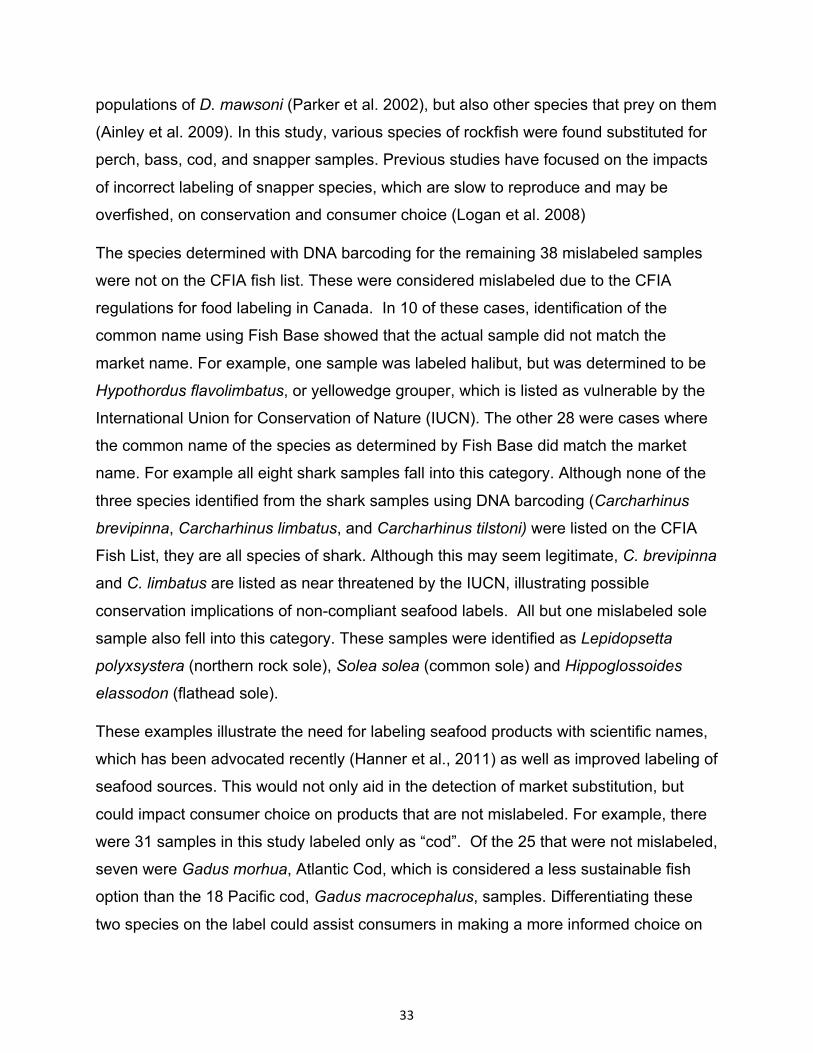
populations of D. mawsoni (Parker et al. 2002), but also other species that prey on them
(Ainley et al. 2009). In this study, various species of rockfish were found substituted for
perch, bass, cod, and snapper samples. Previous studies have focused on the impacts
of incorrect labeling of snapper species, which are slow to reproduce and may be
overfished, on conservation and consumer choice (Logan et al. 2008)
The species determined with DNA barcoding for the remaining 38 mislabeled samples
were not on the CFIA fish list. These were considered mislabeled due to the CFIA
regulations for food labeling in Canada. In 10 of these cases, identification of the
common name using Fish Base showed that the actual sample did not match the
market name. For example, one sample was labeled halibut, but was determined to be
Hypothordus flavolimbatus, or yellowedge grouper, which is listed as vulnerable by the
International Union for Conservation of Nature (IUCN). The other 28 were cases where
the common name of the species as determined by Fish Base did match the market
name. For example all eight shark samples fall into this category. Although none of the
three species identified from the shark samples using DNA barcoding (Carcharhinus
brevipinna, Carcharhinus limbatus, and Carcharhinus tilstoni) were listed on the CFIA
Fish List, they are all species of shark. Although this may seem legitimate, C. brevipinna
and C. limbatus are listed as near threatened by the IUCN, illustrating possible
conservation implications of non-compliant seafood labels. All but one mislabeled sole
sample also fell into this category. These samples were identified as Lepidopsetta
polyxsystera (northern rock sole), Solea solea (common sole) and Hippoglossoides
elassodon (flathead sole).
These examples illustrate the need for labeling seafood products with scientific names,
which has been advocated recently (Hanner et al., 2011) as well as improved labeling of
seafood sources. This would not only aid in the detection of market substitution, but
could impact consumer choice on products that are not mislabeled. For example, there
were 31 samples in this study labeled only as “cod”. Of the 25 that were not mislabeled,
seven were Gadus morhua, Atlantic Cod, which is considered a less sustainable fish
option than the 18 Pacific cod, Gadus macrocephalus, samples. Differentiating these
two species on the label could assist consumers in making a more informed choice on

34
their seafood consumption. This possibility is made even easier with the use of mobile
apps for iPhone and Android designed to help consumers determine the sustainability of
a given species (e.g. Seafood Watch; seafoodwatch.org).
Conclusion
DNA barcoding continues to be a useful tool in detection of market substitution in
seafood. This survey revealed instances of possible economic fraud in addition to
occurrences affecting conservation and health. These substitutions affect consumers
economically as well as socially by impacting health and lifestyle choices. Increased
consumer awareness of these practices, in combination with accurate means of
identifying fraud, such as DNA barcoding, may help discourage seafood mislabeling.
Citizen science projects like this one serve to improve public awareness of not only the
incidence and impact of food fraud, but also improve understanding of the scientific
tools being employed to combat it. We encourage continued involvement of
communities in similar studies, particularly in partnership with the scientific community.
35
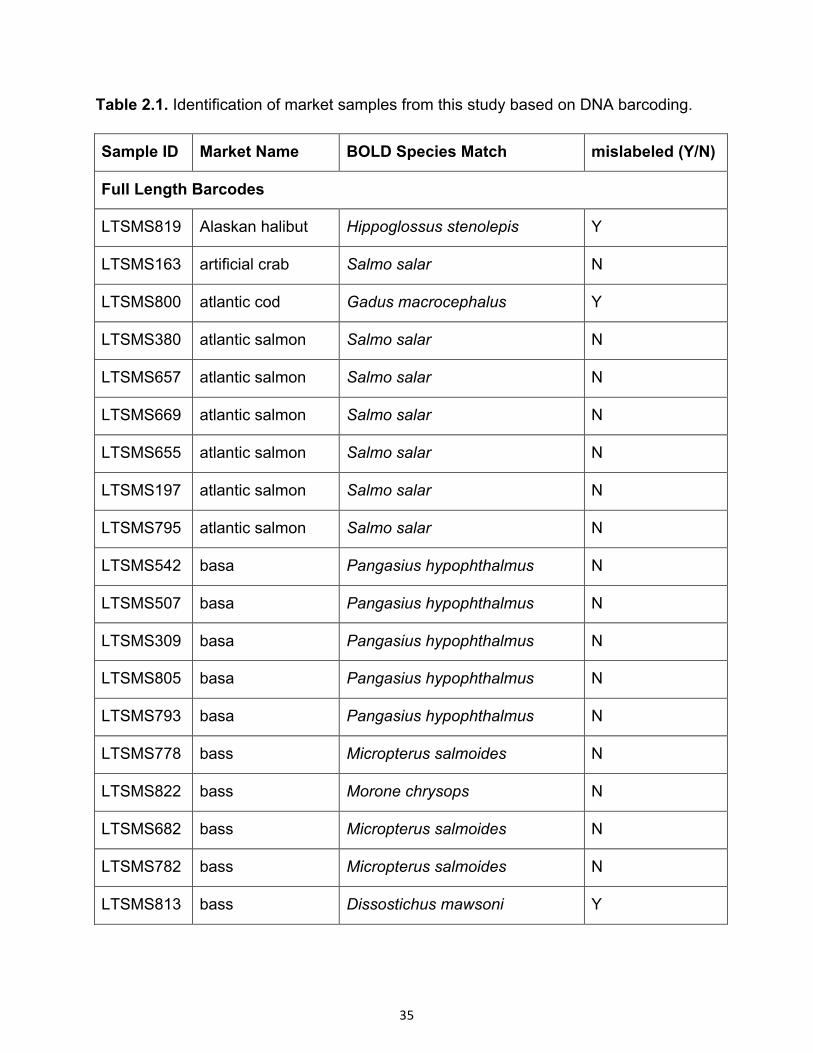
Table 2.1. Identification of market samples from this study based on DNA barcoding.
Sample ID Market Name BOLD Species Match mislabeled (Y/N)
Full Length Barcodes
LTSMS819 Alaskan halibut Hippoglossus stenolepis Y
LTSMS163 artificial crab Salmo salar N
LTSMS800 atlantic cod Gadus macrocephalus Y
LTSMS380 atlantic salmon Salmo salar N
LTSMS657 atlantic salmon Salmo salar N
LTSMS669 atlantic salmon Salmo salar N
LTSMS655 atlantic salmon Salmo salar N
LTSMS197 atlantic salmon Salmo salar N
LTSMS795 atlantic salmon Salmo salar N
LTSMS542 basa Pangasius hypophthalmus N
LTSMS507 basa Pangasius hypophthalmus N
LTSMS309 basa Pangasius hypophthalmus N
LTSMS805 basa Pangasius hypophthalmus N
LTSMS793 basa Pangasius hypophthalmus N
LTSMS778 bass Micropterus salmoides N
LTSMS822 bass Morone chrysops N
LTSMS682 bass Micropterus salmoides N
LTSMS782 bass Micropterus salmoides N
LTSMS813 bass Dissostichus mawsoni Y

36
LTSMS703 bass Stenotomus chrysops Y
LTSMS762 bass Dissostichus eleginoides Y
LTSMS219 blue cod Micromesistius australis N
LTSMS845 catfish Ictalurus punctatus N
LTSMS400 catfish Ictalurus punctatus N
LTSMS264 catfish Ictalurus punctatus N
LTSMS463 catfish Ictalurus punctatus N
LTSMS812 catfish Ictalurus punctatus N
LTSMS858 catfish Ictalurus punctatus N
LTSMS522 catfish Ictalurus punctatus N
LTSMS341 catfish Ictalurus punctatus N
LTSMS833 catfish Ictalurus punctatus N
LTSMS823 catfish Ictalurus punctatus N
LTSMS625 catfish Ictalurus punctatus N
LTSMS737 catfish Ictalurus punctatus N
LTSMS476 catfish Ictalurus punctatus N
LTSMS776 catfish Ictalurus punctatus N
LTSMS759 catfish Ictalurus punctatus N
LTSMS671 catfish Ictalurus punctatus N
LTSMS038 catfish Ictalurus punctatus N
LTSMS809 catfish Ameiurus nebulosus Y
LTSMS301 catfish Ictalurus furcatus Y

37
LSMS401 catfish Ameiurus melas Y
LTSMS325 Chilean sea bass Hippoglossus stenolepis Y
LTSMS332 Chilean sea bass Hippoglossus stenolepis Y
LTSMS895 cod Gadus morhua N
LTSMS157 cod Gadus macrocephalus N
LTSMS502 cod Gadus morhua N
LTSMS412 cod Gadus morhua N
LTSMS894 cod Gadus macrocephalus N
LTSMS702 cod Gadus macrocephalus N
LTSMS718 cod Gadus macrocephalus N
LTSMS358 cod Gadus macrocephalus N
LTSMS777 cod Gadus macrocephalus N
LTSMS198 cod Gadus macrocephalus N
LTSMS673 cod Gadus morhua N
LTSMS768 cod Gadus macrocephalus N
LTSMS448 cod Gadus morhua N
LTSMS505 cod Gadus macrocephalus N
LTSMS880 cod Gadus macrocephalus N
LTSMS772 cod Gadus morhua N
LTSMS838 cod Gadus macrocephalus N
LTSMS692 cod Gadus macrocephalus N
LSMS854 cod Gadus macrocephalus N
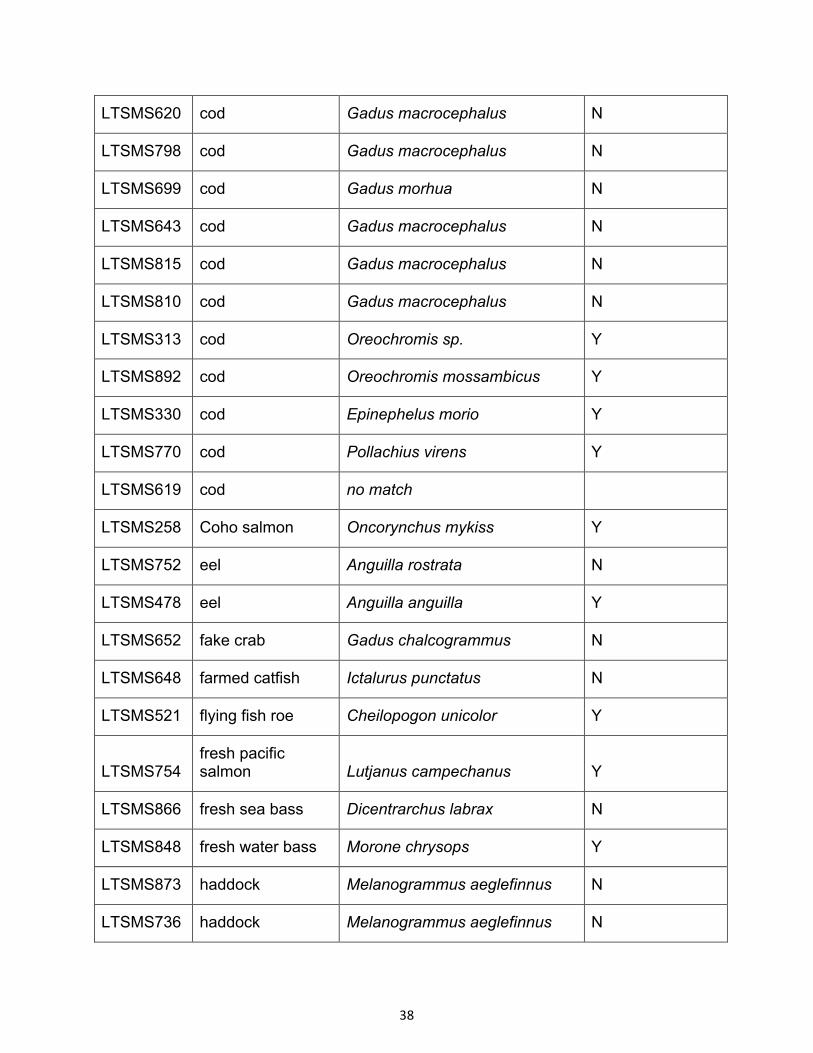
38
LTSMS620 cod Gadus macrocephalus N
LTSMS798 cod Gadus macrocephalus N
LTSMS699 cod Gadus morhua N
LTSMS643 cod Gadus macrocephalus N
LTSMS815 cod Gadus macrocephalus N
LTSMS810 cod Gadus macrocephalus N
LTSMS313 cod Oreochromis sp. Y
LTSMS892 cod Oreochromis mossambicus Y
LTSMS330 cod Epinephelus morio Y
LTSMS770 cod Pollachius virens Y
LTSMS619 cod no match
LTSMS258 Coho salmon Oncorynchus mykiss Y
LTSMS752 eel Anguilla rostrata N
LTSMS478 eel Anguilla anguilla Y
LTSMS652 fake crab Gadus chalcogrammus N
LTSMS648 farmed catfish Ictalurus punctatus N
LTSMS521 flying fish roe Cheilopogon unicolor Y
LTSMS754 fresh pacific salmon Lutjanus campechanus Y
LTSMS866 fresh sea bass Dicentrarchus labrax N
LTSMS848 fresh water bass Morone chrysops Y
LTSMS873 haddock Melanogrammus aeglefinnus N
LTSMS736 haddock Melanogrammus aeglefinnus N

39
LTSMS352 haddock Melanogrammus aeglefinnus N
LTSMS839 haddock Melanogrammus aeglefinnus N
LTSMS735 haddock Melanogrammus aeglefinnus N
LTSMS490 haddock Melanogrammus aeglefinnus N
LTSMS803 haddock Melanogrammus aeglefinnus N
LTSMS417 haddock Melanogrammus aeglefinnus N
LTSMS148 haddock Melanogrammus aeglefinnus N
LTSMS806 haddock Melanogrammus aeglefinnus N
LTSMS492 haddock Melanogrammus aeglefinnus N
LTSMS640 haddock Melanogrammus aeglefinnus N
LTSMS705 haddock Melanogrammus aeglefinnus N
LTSMS278 haddock Melanogrammus aeglefinnus N
LTSMS701 haddock Melanogrammus aeglefinnus N
LTSMS560 haddock Melanogrammus aeglefinnus N
LTSMS344 haddock Melanogrammus aeglefinnus N
LTSMS125 haddock Melanogrammus aeglefinnus N
LTSMS641 haddock Melanogrammus aeglefinnus N
LTSMS745 haddock Melanogrammus aeglefinnus N
LTSMS760 haddock Melanogrammus aeglefinnus N
LTSMS872 haddock Melanogrammus aeglefinnus N
LTSMS897 haddock Melanogrammus aeglefinnus N
LTSMS790 haddock Melanogrammus aeglefinnus N

40
LTSMS199 haddock Melanogrammus aeglefinnus N
LTSMS286 haddock Melanogrammus aeglefinnus N
LTSMS408 haddock Melanogrammus aeglefinnus N
LTSMS602 halibut Hippoglossus stenolepis N
LTSMS204 halibut Hippoglossus stenolepis N
LTSMS645 halibut Hippoglossus stenolepis N
LTSMS280 halibut Hippoglossus stenolepis N
LTSMS644 halibut Hippoglossus stenolepis N
LTSMS458 halibut Hippoglossus stenolepis N
LTSMS622 halibut Hippoglossus stenolepis N
LTSMS788 halibut Hippoglossus stenolepis N
LTSMS236 halibut Hippoglossus stenolepis N
LTSMS845 halibut Hippoglossus stenolepis N
LTSMS727 halibut Hippoglossus stenolepis N
LTSMS590 halibut Hyporthodus flavolimbatus Y
LTSMS844 live water bass Morone chrysops Y
LTSMS023 mackerel Scomber scombrus N
LTSMS090 mackerel Scomber scombrus N
LTSMS165 mackerel Scomber scombrus N
LTSMS255 monkfish Lophius americanus N
LTSMS273 mussel Mytilus trossulus Y
LTSMS761 north atlantic haddock
Melanogrammus aeglefinnus N

41
LTSMS262 orange roughy Hoplostethus atlanticus N
LTSMS244 orange roughy Hoplostethus atlanticus N
LTSMS190 orange roughy Hoplostethus atlanticus N
LTSMS885 pacific cod Gadus macrocephalus N
LTSMS821 pacific halibut Hippoglossus stenolepis N
LTSMS883 pacific halibut Melanogrammus aeglefinnus Y
LTSMS555 pacific salmon Oncorynchus gorbuscha N
LTSMS758 pacific salmon Oncorynchus gorbuscha N
LTSMS792 pacific snapper Sebastes melanops Y
LTSMS187 pacific snapper Sebastes serranoides Y
LTSMS874 perch Perca flavescens N
LTSMS331 perch Sebastes viviparus Y
LTSMS108 pickerel Sander vitreus N
LTSMS711 pickerel Sander vitreus N
LTSMS721 pickerel Sander vitreus N
LTSMS716 pickerel Sander vitreus N
LTSMS881 pickerel Sander vitreus N
LTSMS724 pickerel Sander vitreus N
LTSMS336 pickerel Sander vitreus N
LTSMS410 pickerel Sander vitreus N
LTSMS741 pickerel Sander vitreus N
LTSMS691 pickerel Sander vitreus N

42
LTSMS504 pickerel Sander vitreus N
LTSMS153 pickerel Sander vitreus N
LTSMS887 pollock Gadus chalcogrammus N
LTSMS472 pollock Gadus chalcogrammus N
LTSMS390 pollock Gadus chalcogrammus N
LTSMS725 pollock Gadus chalcogrammus N
LTSMS802 pollock Gadus chalcogrammus N
LTSMS863 pollock Gadus chalcogrammus N
LTSMS710 pollock Gadus chalcogrammus N
LTSMS864 pollock Gadus chalcogrammus N
LTSMS899 pollock Pollachius virens N
LTSMS661 pollock Gadus chalcogrammus N
LTSMS418 pollock pollachius pollachius Y
LTSMS688 rainbow trout Oncorynchus mykiss N
LTSMS252 red snapper Lutjanus campechanus N
LTSMS875 red snapper Rhomboplites aurorubens Y
LTSMS305 red snapper Lutjanus synagris Y
LTSMS285 red snapper Oreochromis sp. Y
LTSMS842 red snapper Lutjanus synagris Y
LTSMS857 red snapper Oreochromis sp. Y
LTSMS781 red snapper Sebastes viviparus Y
LTSMS423 rockfish Sebastes flavidus N

43
LTSMS461 salmon Salmo salar N
LTSMS171 salmon Salmo salar N
LTSMS150 salmon Salmo salar N
LTSMS436 salmon Salmo salar N
LTSMS635 salmon Salmo salar N
LTSMS624 seabass Dicentrarchus labrax N
LTSMS817 shark Carcharhinus brevipinna Y
LTSMS683 shark Carcharhinus brevipinna Y
LTSMS528 shark Carcharhinus limbatus Y
LTSMS826 shark Carcharhinus limbatus Y
LTSMS814 shark Carcharhinus tilstoni Y
LTSMS862 shark Carcharhinus tilstoni Y
LTSMS811 shark Carcharhinus tilstoni Y
LTSMS748 snapper Lutjanus campechanus N
LTSMS784 snapper Lutjanus campechanus N
LTSMS670 snapper Sebases aleutianus Y
LTSMS552 snapper Sebastes melanops Y
LTSMS751 sole Limanda aspera N
LTSMS801 sole Limanda aspera N
LTSMS828 sole Limanda aspera N
LTSMS696 sole Limanda aspera N
LTSMS695 sole Limanda aspera N

44
LTSMS708 sole Limanda aspera N
LTSMS375 sole Limanda aspera N
LTSMS871 sole Lepidopsetta bilineata N
LTSMS681 sole Limanda aspera N
LTSMS697 sole Microstommus pacificus N
LTSMS791 sole Limanda aspera N
LTSMS860 sole Lepidopsetta bilineata N
LTSMS459 sole Limanda aspera N
LTSMS623 sole Lepidopsetta bilineata N
LTSMS783 sole Lepidopsetta bilineata N
LTSMS856 sole Parophrys vetulus N
LTSMS734 sole Limanda aspera N
LTSMS307 sole Lepidopsetta polyxystera Y
LTSMS647 sole Lepidopsetta polyxystera Y
LTSMS726 sole Lepidopsetta polyxystera Y
LTSMS474 sole Solea solea Y
LTSMS878 sole Lepidopsetta polyxystera Y
LTSMS473 sole Lepidopsetta polyxystera Y
LTSMS859 sole Hippoglossus platessoides Y
LTSMS888 sole Solea solea Y
LTSMS730 swordfish Xiphias gladius N
LTSMS365 swordfish Xiphias gladius N

45
LTSMS765 tilapia Oreochromis sp. N
LTSMS816 tilapia Sarotherodon galilaeus N
LTSMS601 tilapia Oreochromis sp. N
LTSMS796 tilapia Oreochromis niloticus N
LTSMS064 tilapia Oreochromis mossambicus N
LTSMS414 tilapia Oreochromis niloticus N
LTSMS267 tilapia Oreochromis mossambicus N
LTSMS247 tilapia Oreochromis sp. N
LTSMS194 tilapia Oreochromis sp. N
LTSMS271 tilapia Oreochromis sp. N
LTSMS388 tilapia Oreochromis sp. N
LTSMS455 tilapia Oreochromis mossambicus N
LTSMS034 tuna Thunnus alalunga N
LTSMS491 tuna Thunnus albacares N
LTSMS585 tuna Thunnus alalunga N
LTSMS556 tuna Thunnus obesus N
LTSMS581 walleye Sander vitreus N
LTSMS847 water bass Morone chrysops Y
LTSMS832 white bass Morone chrysops N
LTSMS679 white snapper Pagrus pagrus Y
LTSMS756 white tuna Thunnus tonggol Y
LTSMS890 whitefish Coregonus clupeaformis N

46
LTSMS728 whitefish Morone chrysops Y
LTSMS489 whitefish Gadus macrocephalus Y
LTSMS849 whitefish Sebastes proriger Y
LTSMS128 wild pacific salmon
Ochorhynchus keta Y
LTSMS898 wild pollock Gadus chalcogrammus N
LTSMS900 wild sole Limanda aspera N
LTSMS621 yellow perch Perca flavescens N
LTSMS497 yellow perch Perca flavescens N
LTSMS333 yellow perch Perca flavescens N
LTSMS698 yellowtail Seriola quinqueradiata Y
LTSMS215 haddock Melanogrammus aeglefinus N
LTSMS237 haddock Melanogrammus aeglefinus N
LTSMS295 sole Lepidopsetta polyxystra Y
LTSMS310 haddock Melanogrammus aeglefinus N
LTSMS394 haddock Melanogrammus aeglefinus N
LTSMS468 Alaskan pollock Gadus chalcogrammus N
LTSMS506 sockeye salmon Oncorhynchus nerka N
LTSMS536 tilapia Oreochromis niloticus N
LTSMS543 Alaskan pollock fillet
Gadus chalcogrammus N
LTSMS545 basa Pangasius hypophthalmus N
LTSMS593 black tilapia Oreochromis urolepis Y

47
LTSMS606 sockeye salmon Oncorhynchus nerka N
LTSMS653 wild sockeye salmon
Oncorhynchus nerka N
LTSMS771 pickerel Sander vitreus N
LTSMS840 Alaskan snow crab
Gadus chalcogrammus Y
LTSMS851 pacific pink salmon
Oncorhynchus gorbuscha N
Mini Barcodes
LTSMS471 sole Hippoglossoides elassodon Y
LTSMS166 sole Lepidopsetta polyxystra Y
LTSMS750 shark Carcharhinus brevipinna Y
LTSMS804 pickerel Sander vitreus N
LTSMS487 pickerel Sander vitreus N
LTSMS316 pickerel Sander vitreus N
LTSMS161 pickerel Sander vitreus N
LTSMS419 pickerel Sander vitreus N
LTSMS434 cod Sebastes viviparus Y
LTSMS599 halibut Hippoglossus hippoglossus N
LTSMS605 halibut Hippoglossus stenolepis N
LTSMS179 halibut Hippoglossus stenolepis N
LTSMS457 halibut Hippoglossus stenolepis N
LTSMS382 halibut Hippoglossus stenolepis N
LTSMS659 pacific halibut Hippoglossus stenolepis N

48
LTSMS834 orange roughy Hoplostethus atlanticus N
LTSMS477 orange roughy Hoplostethus atlanticus N
LTSMS098 red snapper Sebastes melanops Y
LTSMS855 red snapper Lutjanus campechanus N
LTSMS368 haddock Hippoglossus stenolepis Y
LTSMS877 tilapia Oreochromis mossambicus N
LTSMS043 tilapia Oreochromis mossambicus N
LTSMS289 ocean perch Sebastes viviparus Y
LTSMS642 ocean perch Sebastes viviparus Y
LTSMS111 tuna Sebastes flavidus Y
LTSMS367 sole Parophrys vetulus N
LTSMS618 sole Parophrys vetulus N
LTSMS184 sole Lepidopsetta bilineata N
LTSMS302 sole Lepidopsetta bilineata N

49
Chapter 3. Application of DNA Barcode Sequences for Identifying Salmonid Species of Commercial Interest
Though the DNA barcoding market survey outlined in Chapter 2 represents one method
of accurate seafood identification, DNA barcoding is not well suited to detect multiple
species in mixtures, and is not always suitable for processed products. Additionally, the
process may be lengthy. Using DNA barcode sequences to develop real-time PCR and
rapid conventional PCR protocols capable of identifying individual species within
mixtures has been proposed as an alternative to DNA barcoding for certain applications.
Two such methods are evaluated in this chapter.
This chapter consists of edited excerpts representing the work completed primarily by Naaum at the University of Guelph from: Rasmussen Hellberg, R.S., Naaum, A.M., Handy, S.M., Hanner, R.H, Deeds, J.R., Yancy HF and Morrissey MT. 2011. Interlaboratory Evaluation of a Real-Time Multiplex Polymerase Chain Reaction Method for Identification of Salmon and Trout Species in Commercial Products. J. Ag. Food Chem. 59: 876-884, as well as original work completed by Naaum.
Introduction
Salmonids represent an important commercial commodity for both the United States
(Voorhees 2008) and Canada (DFO 2009). Seven species are commonly sold; two
farmed species: Atlantic salmon (Salmo salar) and rainbow (steelhead) trout
(Oncorhynchus mykiss) and five wild species, commonly referred to as Pacific salmon:
Chinook salmon (Oncorhynchus tshawytscha), sockeye salmon (Oncorhynchus nerka),
coho salmon (Oncorhynchus kisutch), chum salmon (Oncorhynchus keta), and pink
salmon (Oncorhynchus gorbuscha). Though these species look similar, especially after
processing, they are sold at different market rates due to varying supply and demand,
as well as competition between farmed and wild species (Knapp et al. 2007). This
difference in market price provides incentive for species substitution.
DNA barcoding can be a powerful tool in detecting market substitution, however, it still
requires relatively time-consuming methods using costly equipment. Furthermore, it is
not suitable for detection of multiple species in mixed samples and the 650 base pair
fragment required can be difficult to recover from highly processed samples.
Using the extensive DNA barcode sequence data available on BOLD, multiplex primers

50
and probes were developed to differentiate the seven commercially important salmonid
species (Rasmussen Hellberg et al. 2010). Primers were designed for traditional PCR,
and primer and probes sets were designed for real-time PCR. These assays targeted a
shorter species-specific region of the 658bp DNA barcode sequence for each species,
and allowed for multiplex detection of species in mixtures either by real-time PCR or
post-PCR gel electrophoresis in the case of traditional PCR primers. The shorter target
region allowed better identification for processed products where DNA may be
degraded (e.g. Pardo and Perez-Villareal 2004).
The objective of this study was two-fold. First, although Rasmussen Hellberg et al.
(2010) included a small selection of market samples, further evaluation of the published
primers and probes for real-time PCR was warranted. In this study, 80 market samples
collected in both the US and Canada were analyzed using the existing primer and probe
sets to determine their efficacy in identifying market samples. Two other labs also
analyzed the same samples, forming a small inter-laboratory evaluation, published in
2011 (Rasmussen Hellberg et al. 2011). Secondly, the conventional PCR primers were
repurposed to develop a more rapid protocol in single-plex, allowing easier
interpretation of results.
Methods
Real-time PCR Evaluation
Sample Collection and Preparation
A total of 80 commercial salmon and trout products representing a variety of species
and processing methods were obtained from retail outlets in Canada and the United
States in November 2009. Forty products were collected from 9 locations in Oregon and
Washington (U.S.A) and the other 40 products were collected from 8 locations in
Ontario (Canada). Each product was assigned a random three-digit number, and only
the collecting laboratory was aware of the species declaration linked to each product.
Tissue samples from each product were subsampled into 2 mL tubes and preserved in
95% ethanol. Products with increased susceptibility to species mixing (e.g. canned and

51
retort-packed salmon, salmon burgers, and frozen salmon dinners) were individually
blended with up to 30 mL of sterile water for at least 2 min prior to subsampling.
Reference DNA of known concentrations and the corresponding expected cycle
threshold values (Ct) as determined previously (Rasmussen Hellberg et al. 2010) for
each of the target species were obtained from the Food Innovation Center, Oregon
State University in order to optimize the baseline and threshold settings for use on a
new instrument. Reference tissue samples of the seven commercial salmon and trout
species were also obtained as positive controls for DNA extraction and real-time PCR.
These reference samples were verified for accuracy of species identification in a
previous study with DNA barcoding (Rasmussen Hellberg et al. 2009).
DNA Extraction and PCR Preparation
DNA was extracted using the DNeasy Blood and Tissue Kit (Qiagen, Valencia, CA) with
overnight lysis and elution in 60-100 µL of elution buffer. A negative control with no
tissue was included in each DNA extraction and subsequent PCR. Nucleic acid
concentrations were determined using a NanoDrop spectrophotometer. Extracted DNA
samples were adjusted to 20-30 ng/µL for use in real-time PCR. TaqMan minor groove
binder (MGB) probes and PCR primers used in this study are described in Rasmussen
Hellberg et al. (2010). These primers and probes target species-specific regions of the
DNA barcode in all seven commercially important salmon and trout species in North
America, as well as a universal region of cytochrome b for a positive control. All probes
and degenerate primers were synthesized by Applied Biosystems (Foster City, CA), and
nondegenerate primers were synthesized by TriLink Biotechnologies (San Diego, CA).
Real-Time Multiplex PCR
Real-time PCR was conducted on a StepOnePlus Real-Time PCR System (Applied
Biosystems). All reactions contained 12.5 µL of 2X QuantiTectMultiplex PCR No ROX
Master Mix (Qiagen), 0.10-0.60 µM final concentration of primers, 0.10-0.60 µM final
concentration of TaqMan MGB probes (Applied Biosystems), 40-60 ng of template
DNA, and sterile water for a total reaction volume of 25 µL. Each sample was amplified
with all seven species-specific primers and probes, along with the universal primers and

52
probe set in three different multiplex reactions: one triplex set targeting S. salar, O. keta,
and O. tshawytscha; one duplex set targeting O. nerka and O. kisutch; and one duplex
set targeting O. gorbuscha and O. mykiss. The universal set was run separately for
each sample. Cycling conditions, primer and probe details, and multiplex sets are
described in Rasmussen Hellberg et al. (2010).
All real-time PCR settings were optimized for species identification using reference DNA
from each of the target species. The established baseline setting was 3-15 cycles and
established thresholds were 5.5 x 10³ (FAM), 3.5 x 10³ (VIC), and 1.5 x 10³ (NED)
fluorescent units. The cycle threshold (Ct) value, defined as the cycle at which the
fluorescence signal crosses the threshold, was recorded for each sample. A Ct value
below 25 in fresh/frozen (uncooked) or heat-treated (partially or fully cooked) samples
or a Ct value below 30 in heat-sterilized (canned or retort-packed) samples was used to
identify species in food products, as recommended previously (Rasmussen Hellberg et
al. 2010). A no-template PCR control was included alongside all reactions.
Any samples found to contain substituted species or exhibiting secondary signals of Ct
< 30 were examined further to verify the results. Fresh/frozen or heat-treated samples
that exhibited a Ct value between 25 and 30 were subjected to repeat DNA extraction
and real-time PCR. These tests were carried out in duplicate, and a Q-test was used for
the rejection of outliers, as described in Smith et al. (2003).
Conventional PCR
Samples of sockeye, Atlantic and pink salmon were collected from markets and
restaurants. Species identifications were verified using DNA barcoding. The Xytogen
Animal Extraction Kit was used according to manufacturer guidelines.
Reactions were carried out in 20 µL volumes with 0.4 µL Phire Taq polymerase (Fisher
Scientific), 0.4 µL dNTPs (Bio Basics Inc., Markham, Ontario, Canada), 4 µL reaction
buffer, 1 µL DNA, and primer concentrations as outlined in (Rasmussen Hellberg et al.
2010). Primer sequences were described in (Rasmussen Hellberg et al. 2010), and
synthesized by Integrated DNA Technologies (Iowa, U.S.A). Optimized cycling
conditions were 98 ˚C for 30 seconds followed by 30 cycles of 98 ˚C for 5s, 59 ˚C for 5s

53
and 72 ˚C for 10s, and finally 72 ˚C for 1min. Eight PCR reactions were run for each
individual sample – one for each species-specific set of primers and one for the
universal primer set. Agarose gel electrophoresis and visualization of the gel was
carried out as described in Rasmussen Hellberg et al. 2010, with SYBR Safe dye (Life
Technologies) substituted for ethidium bromide.
Results and Discussion
Real-time PCR
Reference Samples
The real-time multiplex PCR method allowed for detection of each target species in
reference DNA samples. The use of reference DNA samples was found to be essential
for the initial optimization of threshold and baseline settings. Reference tissue samples
that were provided as positive controls for DNA extraction and real-time multiplex PCR
were also detected below expected cutoff values, with one exception; the O. keta
reference sample showed an elevated Ct value (Ct=27.7). The universal Ct value for
this sample was also high (27.3). Elevated Ct values (Ct =25-30) were previously found
more frequently for reference tissue samples of O. keta compared to other species
(Rasmussen Hellberg et al. 2010).
Analysis of Commercial Products
A total of 80 salmon and trout products were tested using real-time multiplex PCR
(Table 3.1). The items chosen represent many of the product types available in North
America, including fresh/frozen fillets, frozen salmon dinners and burgers, smoked
salmon and trout, salmon jerky, canned salmon, and retort-packed smoked salmon.
Overall, there were 28 fresh/frozen (uncooked) products, 29 heat-treated (partially or
fully cooked) products, and 23 heat-sterilized (canned or retort-packed) products. The
species present could be identified in 79 of the 80 products (98.8%).
The one product that could not be identified was hot-smoked and retort-packed Alaskan
salmon (sample 991). A Ct value below 30 cycles could not be obtained for this sample
from any of the multiplex sets. The universal Ct value for this product was also above

54
30, indicating the sample may be heavily degraded, or the possible presence of PCR
inhibitors. Two cases of species substitution (samples 958 and 752) and two cases of
mixed-species samples (samples 266 and 733) were identified. These products are
discussed in detail in later sections. The majority (75%) of fresh/frozen products labeled
“O. keta or O. gorbuscha” were identified as O. gorbuscha, and the remaining products
were identified as O. keta. There were 10 fresh/frozen or heat-treated products
purchased in the United States that were labeled “salmon” with no species declaration,
and testing with real-time multiplex PCR indicated that 80% contained either O. keta or
O. gorbuscha. Oncorhynchus keta and O. gorbuscha have the lowest values among the
commercial salmon species, with average 2008 ex-vessel prices of U.S. $1.17 and U.S.
$0.64 per kg, respectively (Voorhees et al. 2008). Thus, it is not surprising that they are
the main species present in generically labeled salmon products.
Species Substitution
Species substitution was detected in 2 of the 79 samples (2.5%) that could be identified
at the species level. One product was a cold-smoked item sold at a seafood counter
(sample 958) that did not have a species label but was verbally declared to be farmed
O. tshawytscha. This product was determined to be S. salar. The other substituted
product (sample 752) was a smoked and canned item labeled O. kisutch that was
determined to be O. keta. Both of these cases represent substitution of a lower value
species for a higher value species. For example, in 2008 the average ex-vessel price for
O. tshawytscha was U.S. $7.19/kg compared to an average import price for S. salar of
U.S. $5.57/kg, and the average ex-vessel price of O. kisutch (U.S. $2.66/kg) was more
than twice that for O. keta (Voorhees et al. 2008, NMFS 2009).
Mixed-Species Samples
Two products were found to contain multiple species on the basis of the real-time
multiplex PCR results. Sample 266, a cold-smoked product labeled “salmon”, was found
to contain O. keta as the primary species and O. tshawytscha as the secondary
species, whereas sample 733, a canned product labeled O. gorbuscha, was found to
contain O. gorbuscha as the primary species and O. keta as the secondary species.

55
Delayed Secondary Signals
There were twelve samples that originally exhibited secondary signals between Ct = 25-
30. Although acceptable based on a Ct = 25 cutoff for a primary signal, a secondary
signal of Ct <30 had not previously been observed in lightly processed samples
(Rasmussen Hellberg et al. 2010). These signals were eliminated after repeat real-time
PCR or after repeat DNA extraction. These secondary signals were likely caused by the
presence of a low level of secondary species present due to trace contamination during
real-time PCR reaction setup or DNA extraction. This suggests that a cutoff value of Ct
< 25 for fresh/frozen and heat-treated samples is appropriate, allowing for species
identifications that are consistent with previously established methods while minimizing
false-positive signals from trace contamination.
Conventional PCR
Results from conventional PCR using the newly optimized protocol successfully
identified all three species tested. Agarose gel electrophoresis showed bands of 205
base pairs for each species in the positive control lane, 143 base pairs for pink salmon,
219 base pairs for Atlantic salmon, and 183 base pairs for sockeye salmon, as expected
based on Rasmussen Hellberg et al. (2010). Typical results are shown in Figure 3.1. No
bands were observed for any non-target primer sets in any of the samples tested.
Splitting each primer pair into a single reaction, although increasing the cost per sample
slightly, allows for more rapid interpretation. These primer sets can be run on pre-cast
gels to observe presence/absence of bands, rather than having to interpret band sizes.
Conclusions
The real-time multiplex PCR assay tested in this study is a rapid, sensitive, and reliable
method for identification of salmon and trout species in commercial products. Test
results revealed the ability of this assay to identify species in a range of product types,
including 96% of the heat sterilized products tested. The results of this study are also
promising with regard to the low level of species substitution detected in salmon and
trout products (2.5%). However, these products were collected from retail stores, and
substitution of salmon products has been found to be more common in restaurant

56
samples (Cline 2012). This method may be applied in regulatory settings as a rapid and
high-throughput screening tool for testing commercial salmon and trout products. The
traditional PCR primers developed by Rasmussen Hellberg et al. (2010) were also
shown to be successful in a more rapid single-plex analysis, allowing for more rapid
screening than the original multi-plex assay. This study also illustrates the high potential
to make use of the large volume of reference sequences in the Barcode of Life
database for the development of more rapid, simple and cost-effective assays targeting
commonly substituted seafood species.

57
Table 3.1. Samples analyzed in this study using real-time PCR. Market names and cooking methods were collected from sample labels. Assigned species were those detected using qPCR.
ID Declared market name Cooking method Species assigned
803 Pink salmon canned Pink
624 Pink salmon canned Pink
589 Wild pink salmon canned Pink
741 Sockeye salmon canned Sockeye
590 Red pacific sockeye salmon canned Sockeye
408 Atlantic salmon canned Atlantic
104 Pink salmon canned Pink
890 Sockeye salmon smoked Sockeye
363 Wild pacific salmon (pink or chum)
frozen raw Pink
424 Pink or chum salmon other [frozen dinner (raw frozen)]
Pink
829 Pink salmon canned Pink
276 Sockeye salmon canned Sockeye
609 Atlantic salmon fresh/frozen Atlantic
922 Rainbow trout fresh/frozen Rainbow
789 Atlantic salmon smoked Atlantic
484 Atlantic salmon fresh/frozen Atlantic
445 Alaskan pink salmon or alaskan chum salmon
frozen raw Pink
192 Pink salmon frozen raw Pink

58
426 Wild alaskan sockeye salmon frozen raw Sockeye
501 Atlantic salmon other [frozen dinner (frozen
raw)] Atlantic
176 Wild sockeye salmon smoked Sockeye
142 Wild pacific salmon (pink or chum)
frozen raw Chum
842 Chum salmon frozen raw Chum
903 Rainbow trout fresh/frozen (whole) Rainbow
127 Wild pacific salmon (pink or chum)
frozen raw Chum
673 Wild pacific salmon (pink or chum)
frozen raw Pink
373 Wild pacific salmon (chum) frozen raw Chum
345 Pink salmon canned Pink
380 Sockeye salmon canned Sockeye
871 Pacific coho salmon smoked Coho
260 Alaskan sockeye salmon smoked Sockeye
255 Pacific salmon (pink or chum) frozen raw Pink
725 Atlantic salmon fresh/frozen Atlantic
904 Pink salmon canned Pink
384 Atlantic salmon smoked Atlantic
537 Sockeye salmon canned Sockeye
536 Sockeye salmon smoked Sockeye
338 Atlantic salmon smoked Atlantic

59
212 Coho salmon smoked Coho
117 Rainbow trout fresh/frozen Rainbow
135 Sockeye salmon Canned Sockeye
752 Coho salmon Smoked (can-packed) Chum
407 Pink salmon Canned Pink
568 King salmon Other (jerky) Chinook
873 King salmon Other (jerky) Chinook
244 Atlantic salmon Hot-smoked Atlantic
583 Chum salmon fresh/frozen Chum
266 "salmon" Cold-smoked (nova) Chum and Chinook
718 Sockeye salmon Canned Sockeye
733 Pink salmon Canned Pink and Chum
218 Sockeye salmon Hot-smoked (packed in retort
pouch) Sockeye
958
Unlabeled, but when asked, the salespersion said it was "farmed Chinook salmon"
Cold-smoked Atlantic
636 "salmon" Other (jerky) Chum
894 n/a Other (jerky) Chum
382 Chinook salmon Canned Chinook
715 Coho salmon fresh/frozen Coho
980 "salmon" Frozen raw Pink
833 Coho salmon Hot-smoked Coho
991 Pink salmon Hot-smoked, packed in retort Undiagnosable

60
pouch
168 Sockeye salmon fresh/frozen Sockeye
147 Coho salmon fresh/frozen Coho
578 Steelhead trout Fresh/frozen Rainbow
517 Atlantic salmon Frozen raw Atlantic
948 Pink and or chum salmon "Parfried in soybean or canola
oil" Pink
717 Sockeye salmon Frozen raw Sockeye
412 Atlantic salmon Canned Atlantic
383 "salmon" Frozen raw Pink
808 "salmon" Hot-smoked Chum
422 "salmon" cold-smoked Atlantic
888 Atlantic salmon Cold-smoked Atlantic
822 King salmon Hot-smoked Chinook
855 Keta salmon Frozen raw Chum
836 Keta salmon Hot-smoked Chum
415 Atlantic salmon fresh/frozen Atlantic
843 Sockeye salmon Hot-smoked Sockeye
978 "salmon" Hot-smoked Coho
279 Sockeye salmon cold-smoked Sockeye
911 "salmon" Hot-smoked Chum
856 "salmon" Cold-smoked (nova) Chum
196 Pink salmon Grilled, packed in retort-pouch Pink

61
Figure 3.1. Typical results after agarose gel electrophoresis of single-plex traditional PCR for identification of salmonid species. Results from sockeye salmon are shown. All eight species-specific primers were tested. Bands were present for sockeye salmon primers (lane 9, 183bp) and the universal primer set (lane 2, 205bp). No bands were present for non-specific primers (lanes 3-8).
Universal
Sockeye
Ladder
200bp

62
Chapter 4: Application of DNA Barcode Sequences for Differentiation of Pest Aphid Species Using Real-time and Conventional PCR The development of other tests using DNA barcode sequences has several benefits for
certain applications in the food and agricultural sectors. Real-time PCR was
successfully employed for salmonid identification in Chapter 3. Chapter 4 focuses on
another application where rapid identification is crucial. This chapter consists of a
combination of the following two published papers dealing with development of real-time
PCR assays for identification of pest aphids, with the addition of a direct visualization
method for soybean aphid identification.
Naaum, A.M., Foottit, R.G., Maw, H.E.L. and Hanner, R. 2012. Differentiation between Aphis pomi and Aphis spiraecola using multiplex real-time PCR based on DNA barcode sequences. J. Appl. Entomol. 136, 704-710.
and
Naaum, A.M., Foottit, R.G., Maw, H.E.L. and Hanner, R. 2012. Real-time PCR for identification of the soybean aphid Aphis glycines Matsumara. J. Appl. Entomol. In press.
Apple Aphid Identification
The green apple aphid (Aphis pomi De Geer 1783) and the spirea aphid (Aphis
spiraecola Patch 1914) are pests of apples in North America (Foottit et al. 2006). They
play a role in disease transmission (Blackman and Eastop 2000), and affect healthy
growth of their hosts (Kaakeh et al 1993). Existing management regimes to effectively
control these pests differ significantly due to varying susceptibility of each species to
common pesticides (Lowery et al. 2005, 2006), and differences in their life-cycles
(Foottit et al. 2009). Therefore, accurate identification of the species present is essential
to pest control. However, the identification process is complicated due to the
morphological similarity between these two species. As a result, confusion between A.
pomi and A. spiraecola often occurs (Blackman and Eastop 2000; Foottit et al. 2009).
Soybean Aphid Identification
The soybean aphid, Aphis glycines Matsumura, is an invasive pest of soybean crops.
Since its arrival in North America in 2000 to 2003, A. glycines had spread to 20 states

63
and three provinces (Ragsdale et al. 2004) and by 2009 was found in 30 states
(Ragsdale et al. 2011). There is a risk of further spread through the U.S and South
America (Venette and Ragsdale 2004; Ragsdale et al. 2011). Populations can change
quickly, doubling in less than two days under ideal conditions (McCornack et al. 2004).
Economic loss from this pest can occur due to direct feeding damage and disease
transmission (Blackman and Eastop 2000). Evidence suggests that effects on
photosynthesis in soybean can occur even at low densities of A. glycines (Macedo et al.
2003).
Due to the potential economic impact of this pest, including continued spread, early
identification and management is critical for crop protection. However, morphological
identification can be complicated due to complex life cycles, morphological plasticity and
similarity to other species that share the same hosts. In North America, A. glycines and
Aphis nasturtii Kaltenbach are difficult to distinguish on the shared primary
(overwintering) hosts, Rhamnus species (Voegtlin et al. 2004). A polyphagous aphid,
Aphis gossypii Glover, is morphologically similar to A. glycines and may also occur on
both soybean and buckthorn. Other species related to A. gossypii occur on Rhamnus in
Asia and Europe (Blackman and Eastop 1994).
PCR Approaches
Molecular techniques, such as DNA barcoding, may compliment visual identification in
cases where species are morphologically similar. DNA barcoding of the 5’ end of the
mitochondrial cytochrome C oxidase I (COI) gene for species identification (Hebert et al.
2003) has been shown to differentiate species of Aphididae (Foottit et al. 2008; Lee et
al. 2011). This method also allows for identification of immature individuals, including
eggs (Shufran and Puterka 2011). DNA sequence data has been used to distinguish
soybean aphid from related aphids on Rhamnus (Kim et al 2010). In addition, the ability
to identify immature forms is especially important for soybean aphids, as adults are not
always found upon initial colonization of a soybean field (Ragsdale et al. 2004).
Molecular methods also allow detection of eggs on overwintering hosts. Although DNA
barcoding represents an important step towards improved pest identification, the lack of

64
portability can still present an obstacle to rapid implementation of pest management. A
simpler, field-ready form of molecular identification is becoming increasingly desirable.
Real-time PCR has been used for pest insect identification (Huang et al. 2010; Walsh et
al. 2005; Yu et al. 2005), including aphids (Naaum et al. 2012). This method is quicker,
and yields results that are easier to interpret than DNA barcoding. An additional benefit
is that portable platforms exist, allowing these assays to be run in the field. Paired with
simple extraction techniques, it has been demonstrated that the entire process of
molecular identification, including DNA extraction, can be performed in the field
(Tomlinson et al. 2005). Rapid, non-destructive DNA extraction techniques for
arthropods (Castalanelli et al. 2010) allow for complete analysis from sample to
identification in the field for insect pests, while preserving the sample as a voucher for
further morphological analysis.
This study describes two real-time PCR assays for pest aphid identification in cases
where morphological identification can be augmented with molecular techniques. A
method of direct visualization of conventional PCR product with primers developed for
A. glycines is also demonstrated.
Materials and Methods
Multiplex PCR Primer and Probe Design
Species-specific primers and TaqMan probes were developed using 690 COI barcode
sequences from 338 species in the publically available BOLD project “Barcoding the
Aphididae”. These sequences were derived from individuals collected over a wide
geographical range. Primer and probe design was based on all unique haplotypes from
this project. Haplotype analysis was carried out using the haplotype variation tool at
ibarcode.org. In total, 209 haplotypes were used for primer and probe design. Primers
and probes (Table 4.1) were developed using AlleleID (version 7.7, Premier Biosoft
International, Palo Alto, California, U.S.A). The A. pomi –specific probe was tagged at
the 5’ end with the fluorescent reporter tetrachloro-6-carboxyfluorescein (TET) and at
the 3’ end with Black Hole Quencher-1 (BHQ-1) quenching dye. The A. spiraecola-
specific probe was tagged with the fluorescent reporter 6-carboxyfluorescein (FAM) at

65
the 5’ end, and BHQ-1 at the 3’ end. The A. glycines probe was tagged with FAM at the
5’ and BHQ-1 at the 3’ end. Optimization of probe and primer concentrations and
cycling conditions was carried out according to the guidelines set by Cepheid for the
Smart Cycler II System (SmartNote 6.2; http://www.cepheid.com/systems-and-
software/smartcycler-system/).
Species Selection and Sample Collection
A number of species of various degrees of relatedness to the target species were
selected for specificity testing, following the classification scheme of Remaudière and
Remaudière (1997). The selected species are: other species of genus Aphis (A.
coreopsidis (Thomas), A. craccivora Koch, A. fabae Scopoli, A. farinose Gmelin, A.
glycines Matsumura, A. gossypii Glover, A. helianthi Monell in Riley and Monell, A.
hyperici Monell in Riley and Monell, A. illinoisensis Shimer, A. impatientis Thomas, A.
lugentis Williams, A. maculatae Oestlund, A. nasturtii Kaltenbach, A. neilliae Oestlund,
A. neogillettei Palmer, A. nerii Boyer de Fonscolombe, A. oestlund Gillettei, A. rubicola
Oestlund, A. varians Patch); other members of the tribe, Aphidini (Braggia eriogoni
(Cowen ex Gillette and Baker), Sanbornia juniperi Pergande ex Baker); representatives
of the related tribe Macrosiphini of the subfamily, Aphidinae (Acyrthosiphon pisum
(Harris), Aulacorthum solani (Kaltenbach), Lipaphis pseudobrassicae (Davis),
Macrosiphum rosae (Linnaeus), Myzus ascalonicus Doncaster, Myzus persicae
(Sulzer), and Sitobion avenae (Fabricius)); and a representative of the distantly related
subfamily, Eriosomatinae (Eriosoma lanigerum (Hausmann), which shares the same
host plant as the target species). All specimens collected were stored in 95% ethanol.
Detailed collection data is given in Table 4.2. Voucher specimens for these collections
were deposited in the Canadian National Collection of Insects (Agriculture and Agri-
Food Canada, Ottawa).
DNA Extraction
For the apple aphid assay, DNA extraction was carried out on individual aphids using
the DNeasy Blood and Tissue Kit (Qiagen, Mississauga, Ontario, Canada) according to
manufacturer guidelines with the following exception: elutions were done in 100 µL of
elution buffer, and passed through the extraction column twice. Concentrations were

66
determined using a Nanodrop 8000 spectrophotometer (Thermo Scientific, Wilmington,
Delaware, U.S.A) and ranged from 4.28 ng/µL – 112.3 ng/µL depending on the species
of aphid. For the soybean aphid assay, DNA extraction was carried out on individual
aphids using the XytXtract Insect (ANDE) extraction kit (Xytogen, Perth, Australia)
according to manufacturer guidelines. DNA concentration was determined using a
Nanodrop 8000 spectrophotometer and ranged from 65 ng/µL to 475 ng/µL. Template
DNA was first adjusted to 50 ng/µL for optimization of the assays. Subsequent tests
utilized DNA directly from the reaction in order to test the ability to successfully identify
target species successfully without first measuring DNA concentration.
Apple Aphid Real-time Multiplex PCR
Primer and probe sets for A. pomi and A. spiraecola (Integrated DNA Technologies,
Coralville, Iowa, U.S.A) were combined in a multiplex assay. Reactions were carried out
in 25 µL volumes containing sterile water, 5 µL template DNA, each forward primer at a
concentration of 0.3 µM, each reverse primer at a concentration of 0.5 µM and each
probe at a concentration of 0.1 µM. OmniMix HS lyophilized master mix (Cepheid,
Sunnyvale, California, U.S.A) was used according to manufacturer guidelines. PCR
cycling conditions were as follows: an initial step of 95°C for 120s, followed by 40 cycles
of 94°C for 11s, 60°C for 40s and 72°C for 25s. Fluorescence readings were taken at
the annealing step of each cycle. All reactions were carried out on the SmartCycler II
platform (Cepheid, Sunnyvale, California, U.S.A). A no-template control (NTC) was
included with each run. The cycle threshold (Ct) value was determined as the number of
cycles at which the fluorescence reading exceeded the detection threshold. If no signal
was observed, a Ct value of 40 was assigned. The multiplexed set was tested using
DNA from 10 individuals of each of the two target species and DNA from 3 individuals of
each of the species selected for background testing. To determine the ability of the
multiplex assay to detect both species simultaneously, DNA admixtures containing the
following ratios of A. pomi: A spiraecola were tested: 50:50, 80:20, 90:10, 20:80 and
10:90.
67
Soybean Aphid Real-time PCR
Reactions were carried out in 25 µL volumes containing sterile water, 5 µL template
DNA, forward and reverse primers at a concentration of 0.3 µM and 0.5 µM
respectively, probe at a concentration of 0.1 µM, and OmniMix HS lyophilized master
mix (Cepheid, Sunnyvale, California, U.S.A.) according to manufacturer guidelines.
PCR cycling conditions were as follows: an initial step of 95 ˚C for 120s, followed by 40
cycles of 94 ˚C for 11s, 60 ˚C for 40s and 72 ˚C for 25s. Fluorescence readings were
taken at the annealing step of each cycle. All reactions were carried out on the
SmartCyclerII platform. The number of cycles required for fluorescence to exceed the
threshold (cycle threshold, Ct) was recorded for each sample. The default threshold of
30 was used. If no signal was observed, a Ct of 40 was recorded. Ten individuals from
the target species were tested. Three individuals from each of the other species
selected were also tested.
Sensitivity and Linearity
Standard curves were generated from 10-fold serial dilutions of target species DNA
from 10 ng/µL to 1 pg/µL to determine the linear range, detection limits, and efficiency of
the assays. Efficiency was calculated based on the slope of the standard curve
according to the formula Efficiency = -1+10(-1/slope).
Direct Visualization
Traditional PCR was optimized for detection of A. glycines using the same primers used
in real-time PCR. Each 20 µL reaction contained forward and reverse primers at a
concentration of 0.4 µM. The remaining master mix components were as suggested in
the manufacturer instructions for Phire Taq (Thermo Scientific). Thermocycling
conditions were 98 ˚C for 30s, followed by 30 cycles of 98 ˚C for 5s, 60 ˚C for 5s and 72
˚C for 5s, followed by a final hold of 72 ˚C for 1min. Rather than visualizing PCR product
using gel electrophoresis, a method where presence of product could be visually
confirmed was employed. Immediately after PCR, 1 µL of Gel Green (Biotium, Hayward,
CA), diluted 10X, was added to each tube. PCR tubes were placed in a GelDoc imager

68
for visualization. Three individuals of the target species, A. glycines, and two other
species commonly occurring on soybeans, A. gossypii and A. nasturtii, were tested.
Results
Apple Aphid Differentiation
Standard curves of the TET and FAM fluorescence channels for the multiplexed primer
and probe set showed linear range from 10ng/µL to 1pg/µL for both target species, with
a detection limit of 1pg/µL (Figure 4.1). Efficiencies were over 99% for each
fluorescence channel in the multiplex assay, and r2 values for standard curves were
0.999. The FAM fluorescence channel showed a signal for A. spiraecola between
Ct=17.21-19.7 and the TET fluorescence channel showed a signal for A. pomi between
Ct=17.66-21.16. Signals were only observed in either fluorescence channel for 3 of the
29 non-target species: In the TET fluorescence channel a signal for Aphis rubicola
between Ct = 26.66-40 was observed and in the FAM fluorescence channel signals
were observed at Ct = 36.86 – 40 for Aphis neogillettei and Ct = 38.45-40 for Aphis
coreopsidis. No false-negatives were observed in this study, and no signal was
observed for any no-template controls. The assay was also able to successfully detect
both species in DNA admixtures with as low as 10% of the DNA belonging to one of the
two targets.
Soybean Aphid Identification
Signals were observed in the FAM fluorescence channel for A. glycines between
Ct=19.81-25.72, and for Aphis oestlundi between Ct=30.75-32.51. None of the other
non-target species produced a signal. No false negatives were observed in this study
and no signal was observed for any no-template “blank” controls. The standard curve
(r2=0.994) showed a linear range of 120 ng/µL-0.12 ng/µL, a detection limit of 0.012
ng/µL and efficiency of 110% (Figure 4.2).
The direct visualization method clearly differentiated between A. glycines and other
aphid species found on soybean (A. gosypii and A. nasturtii). The fluorescence
observed was similar between NTC and non-target species, with the target species
clearly differentiated (Figure 4.3).
69
Discussion
Using aphid sequences available in BOLD, real-time multiplex PCR assays were
designed to: 1) successfully differentiated Aphis pomi from Aphis spiraecola and 2)
accurately identify A. glycines. A method of direct visualization for soybean aphid
identification was also described.
The apple aphid assay was specific to the target species. Though some cross-
amplification was observed with a small percentage of non-target species in the apple
aphid assay, these were all observed at Ct >35. Only one species out of the 29 tested
gave a signal under Ct = 35, and therefore could cause a false positive in routine
analysis. The use of a cutoff value of Ct = 25 to indicate a positive result from target
species would circumvent this issue. The highest Ct value observed for Aphis pomi was
below this suggested cutoff (Ct = 21.16) and the lowest Ct value for Aphis rubicola
observed in this study (Ct = 26.6) still remained above the suggested cutoff. The
suitability of the cutoff could be confirmed with analysis of more individuals of Aphis
rubicola during validation of this assay. A Ct cutoff value of 25 is unlikely to cause
confusion between weak false-positive signals and weak signals due to low DNA
concentration of targets, as this value corresponds to a DNA concentration of the target
species of less than 0.1 pg/µL according to the standard curve, which is over 40 times
less concentrated than the lowest concentration obtained from DNA extraction from a
single aphid observed in this study. Furthermore, in practice this deficiency is not likely
to be a problem since such a test is likely to be applied only in situations in which aphid
species that are likely to give a false positive result do not occur. For example, in the
current context, only other aphid species that are likely to be found on apple need be
considered.
For the target species, a 100% correlation between the morphologically-assigned
species and the species identified using real-time PCR was observed indicating the
method could replace or confirm morphological identification of adults, with the added
benefit of being applicable to egg and immature forms. The wide range of DNA
concentrations used in this study did not appear to impact the ability to identify the
target species from single individuals.

70
It was possible to detect both species simultaneously, suggesting that extraction of
multiple aphids at once will not affect the ability to detect one or both of these species in
the resulting mixture, reducing the cost per individual aphid identification.
Though the PCR protocol takes under 1 hour, the lysis step in the extraction protocol
adds time to the identification process. However, this processing time could be greatly
reduced with the adoption of more rapid extraction methods (e.g.. Hunter et al. 2008,
Castalanelli et al. 2010) to obtain results much more quickly. These methods would
reduce extraction time from several hours including lysis, to approximately 30 minutes.
The soybean aphid real-time PCR assay proved to be an accurate method of identifying
A. glycines, correlating with the morphological identification in 100% of trials. This
indicates that this method could be used to augment morphological identification of this
species. Cross-amplification was only observed for one non-target species, with Ct
values always exceeding 30. The largest Ct for any A. glycines individual was 25.72.
Therefore the use of a Ct=30 cutoff for positive identification of A. glycines can be used
to avoid incidence of false positives. Given that no DNA amplification was observed for
any of the other 26 non-target species, we also conclude that the assay is specific
enough to differentiate A. glycines from closely related species, including two species
with which it shares hosts: A. gossypii and A. nasturtii. Therefore, rapid identification of
the soybean aphid is possible on either it’s primary or secondary host.
The ANDE DNA extraction method takes just thirty minutes to complete, and requires
only that the solution be heated to 95 ˚C to obtain DNA (Castalanelli et al. 2010). This
simple, rapid method can therefore be carried out in the field using a heating block of
any kind, including the real-time PCR platform itself. This improves on previous studies
where DNA extraction proved to be a practical limitation to field identification of pests
with real-time PCR (e.g. Naaum et al. 2012). Additionally, the non-destructive nature of
the extraction provides a means for adult specimens to be recovered for independent
morphological analysis and/or archiving.
The A. glycines primers were also successfully used to develop a method of directly
visualizing traditional PCR product for identification of this species. For those individuals
tested, this was able to clearly differentiate this species from other species commonly

71
found on soybean. This method is suitable for use with a portable UV light for direct
identification in the field with very little equipment or expertise required.
Conclusion
All known haplotypes of the target species, as well as sequences from other aphid
species known to feed on apples and soybeans in North America were used in the in
silico design of primers and probes published here. However it will be important for
future studies to focus on the practical confirmation of the specificity of these primers
and probes. Though further optimization and validation of these results is necessary,
the data presented here show that these real-time PCR assays are an effective
approach to complement current methods of aphid species identification on apple and
soybean. This study also confirms the utility of DNA barcode sequences as a resource
for designing probes and primers for real-time PCR assays to distinguish between
morphologically similar species. As BOLD continues to grow, and more pest species
and their close relatives are referenced, comparable assays could be designed to do
the same for other morphologically similar pairs or small groups of species.
With rapid identification available, appropriate pest management regimes can be put
into place almost immediately. This also allows on-site identification of pests of potential
quarantine significance, for example at border crossings, which help mitigate the spread
of pests like the soybean aphid. The use of the portable Smart Cycler II system, or
direct visualization, makes on-site analysis a possibility. Due to the simplicity of assay
and the ease with which results can be interpreted, identification of specimens can be
carried out by non-specialists after limited training with high confidence in the results.
Lyophilizing all reagents in the appropriate concentrations for sale in commercial kits
would further reduce the likelihood of human error.

72
Table 4.1. Sequences of species-specific oligonucleotides used in this study and amplicon length 5’-3’. All primers and probes target portions of the Aphis glycines COI DNA barcode region.
Aphis pomi Aphis spiraecola Aphis glycines
Forward TGCCCAGATATATCTTTCC GAGCAATTAATTTTATTTGTACA GGATGTCCAGATATATCTTTTC
Reverse CCTGTTCCTGTTCCATTA GCTAGAACTGGTAGAGA CCTGTTCCTGTTCCATTA
Probe TET-AGATTCTGATTATTACCGCCTTCACT -BHQ1
6FAM-TTAAATCAAATCCCACTATTTCCATG-BHQ1
6FAM-AGATTCTGATTATTGCCACCTTCATT-BHQ1
Amplicon length 110 base pairs 130 base pairs 113 base pairs

73
Table 4.2. Collection information for aphid specimens used in this study.
Species Sample Identifier Locality Latitude Longitude Date Host Aphidinae: Aphidini
Aphis coreopsidis (Thomas)
CNC#HEM049398 USA: Georgia: Sirman
31.100 -82.961 2002/06/04 Baccharis halimifolia
Aphis craccivora Koch
CNC#HEM050467 Guam: Barrigada
13.509 144.832 2003/02/26 Spondias purpurea
Aphis fabae Scopoli
CNC#HEM057623 Canada: British Columbia: Sutton Pass
49.280 -125.355 2007/08/22 Rumex sp.
Aphis farinosa J.F. Gmelin
CNC#HEM057573 Canada: British Columbia: Kitamaat Village
53.981 -128.650 2007/08/18 Salix discolor
Aphis glycines Matsumura
CNC#HEM052292 Canada: Quebec: Sainte-Anne-des-Plaines
45.775 -73.828 2004/07/21 Glycine max
Aphis gossypii Glover
CNC#HEM007420 Canada: Ontario: Wolf Island
44.208 -76.259 1993/05/22 Hibiscus sp.
Aphis helianthi Monell
CNC#HEM057205 Canada: Manitoba: Burntwood River
55.755 -97.843 2007/07/21 Cicuta sp.
Aphis hyperici Monell
CNC#HEM049278 USA: North Carolina: Rainbow Springs
35.093 -83.556 2002/05/30 Hypericum prolificum
Aphis illinoisensis Shimer
CNC#HEM049338 USA: Tennessee: Tallassee
35.552 -84.091 2002/06/01 Vitis sp.
Aphis impatientis Thomas
CNC#HEM070495 Canada: Ontario: Ottawa
45.386 -75.704 2010/08/31 Impatiens capensis
Aphis lugentis Williams
CNC#HEM049241 USA: North Carolina: Buck Creek
35.086 -83.616 2002/05/30 Senecio plattensis
Aphis maculatae Oestlund
CNC#HEM057479 Canada: Ontario:
47.863 -83.906 2007/07/30 Populus tremuloides

74
Prairie Bee River
Aphis nasturtii Kaltenbach
CNC#HEM007709 Canada: Ontario: Packenham
45.341 -76.291 1994/06/05 Rhamnus cathartica
Aphis neilliae Oestlund
CNC#HEM070027 Canada: Ontario: Pitopiko River
49.769 -84.773 2010/07/09 Physocarpus opulifolius
Aphis neogillettei Palmer
CNC#HEM070051 Canada: Ontario: Dryden
49.786 -92.810 2010/07/10 Cornus stolonifera
Aphis nerii Boyer de Fonscolombe
CNC#HEM009682 Canada: Ontario: Ottawa
45.377 -75.655 1994/10/08 Asclepias syriaca
Aphis oestlundi Gillette
CNC#HEM070326 Canada: Ontario: Ottawa
45.371 -75.733 2010/08/20 Oenothera biennis
Aphis pomi DeGeer
CNC#HEM039309 Canada: Ontario: Yonge Mills
44.506 -75.835 2001/07/12 Malus domestica
Aphis rubicola Oestlund
CNC#HEM070500 Canada: Ontario: Ottawa
45.386 -75.704 2010/08/31 Rubus idaeus ssp. strigosus
Aphis sedi Kaltenbach
n/a Canada: Ontario: Guelph
43.532 -80.225 2012/06/08 Hyotelephium telephium
Aphis spiraecola Patch
CNC#HEM033926 Canada: British Columbia: Penticton
49.473 -119.583 2000/05/27 Spiraea sp.(ornamental)
Aphis varians Patch
CNC#HEM057244 Canada: Manitoba: Odei River
55.994 -97.357 2007/07/22 Epilobium angustifolium
Braggia eriogoni Cowen
CNC#HEM033259 Canada: British Columbia: Williams Lake
51.973 -122.666 2000/07/20 Eriogonum heracloides
Hyalopterus pruni (Geoffroy)
CNC#HEM061299 Canada: Ontario: Port Colbourne
42.930 -79.252 2008/06/26 Phragmites australis
Sanbornia juniperi Pergande
CNC#HEM069879 USA: Colorado: Drake
40.450 -105.386 2010/06/23 Juniperus scopularum

75
Aphidinae: Macrosiphini
Acyrthosiphon pisum (Harris)
CNC#HEM070514 Canada: Ontario: Ottawa
45.033 -75.902 2010/09/05 Coronilla varia
Aulacorthum solani (Kaltenbach)
CNC#HEM056959 Canada: Ontario: Malakoff
45.111 -75.788 2007/07/10 Thalictrum sp.
Lipaphis pseudobrassicae (Davis)
CNC#HEM070511 Canada: Ontario: Ottawa
45.033 -75.902 2010/09/04 Erucastrum gallicum
Macrosiphum rosae (Linnaeus)
CNC#HEM070223 Canada: Ontario: Ottawa
45.389 -75.708 2010/08/10 Rosa sp.
Myzus ascalonicus Donscaster
CNC#HEM061938 Canada: British Columbia: Langley
49.100 -122.600 2008/05/07 Agoseris aurantiaca
Myzus persicae (Sulzer)
KSP 24 USA: Washington: Prosser
46.257 -119.729 Solanum tuberosum
Sitobion avenae (Fabricius)
CEF colony Canada: Manitoba: Winnipeg
49.883 -97.150 1995/08/15 Poaceae
Eriosomatinae Eriosoma lanigerum Hausmann
CNC#HEM007886 Canada: Nova Scotia: Wentworth
45.633 -63.432 1994/08/07 Malus domestica

76
Figure 4.1. Linearity of multiplex assay for A. pomi (TET; r2 = 0.999, slope = -3.319) and A. spiraecola (FAM; r2 = 0.999, slope = -3.331). Standard curves are generated from 10-fold serial dilutions of A.pomi or A. spiraecola DNA from 10 ng/µL to 1 pg/µL. Ct values shown are an average of three replicates per concentration.

77
Figure 4.2. Standard curve for A. glycines (r2 = 0.994, slope = -0.325), generated from 10-fold serial dilutions of target DNA from 120 ng/µL-0.12 ng/µL. Ct values shown are an average of three replicates per concentration.
-‐1.5
-‐1
-‐0.5
0
0.5
1
1.5
2
2.5
26 29 32 36
Log DNA Concentration
FAM Ct Value

78
Figure 4.3. Direct visualization assay for identification of A. glycines. Tube one contains A. glycines DNA, tube 2 A. gossypii, and tube 3 A. nasturtii. Tube 4 is a no-template control.
1 2 3 4

79
Section 2: The Use of Synthetic DNA for Food Product Traceability: Apple Juice Case Study At times, endogenous species-specific DNA cannot provide the information required for
authenticity or traceability purposes. In these cases, methods like those in Section 1
cannot be employed. Instead, traceability can provide important information about the
origins of a product and its ingredients. This section shows proof of concept for the use
of an oligonucleotide traceability tag for food products and two possible detection
methods.
Introduction to Synthetic Tagging Food fraud is a serious socio-economic issue evolving new dimensions of complexity as
industrialization and globalization of trade increases. It has been estimated that
adulteration costs businesses $10-15 billion each year (Grocery Manufacturers
Association 2010). The high profit margin, and low risk of detection fuel the continuation
of these unethical practices. In addition to economic loss, adulteration can impact the
lifestyle and health of consumers. For example lifestyle and religious choices can be
affected when products are mislabeled as vegetarian, organic, or Kosher. Adulteration
also raises health concerns when adulterants may contain allergens or other harmful
substances (e.g. sulfites).
Consumers expect that their purchases are safe, and that they are getting an authentic
product, and are willing to pay for that assurance (Hobbs 2003, Hobbs et al. 2005,
Hobbs 2006). Traceability is a key factor for food authentication and safety. The ability
to track a product throughout the supply chain allows swift removal of problematic
batches. Effective traceability measures also allow companies to better market the
credence attributes, such as environmental sustainability, or geographical origin, to
consumers. Governments and key stakeholders in the food industry continue to develop
regulations for traceability and authenticity testing (Hobbs 2006), yet these regulations
are difficult to enforce due to supply chain complexity.
Current traceability methods rely on external tags such as barcode labels and Radio
Frequency Identification (RFID) tags. Although they enhance supply chain

80
management, these external tags can be tampered with, and allow whole-product
substitution to go unnoticed. An additional complication is that individual ingredients in
manufactured goods cannot be traced independently with conventional tags, as only the
final product is labeled. This limitation also applies to stealth product tagging
approaches, like those offered by Microtrace (http://www.microtracesolutions.com/),
which tags a final product rather than individual ingredients.
The use of an internal traceability marker in the product itself would make tampering
more difficult, allowing better assurance that consumers are getting a safe, authentic
product. Individual ingredients in a manufactured product can also be tagged. Tagging
products with a synthetic oligonucleotide marker for traceability purposes is one method
that has been used to track luxury goods and electronics. Applied DNA Sciences
(http://www.adnas.com) is one company based in New York that tags products with
unique DNA for downstream authenticity testing. Oligonucleotide tagging has not,
however, been applied to food products.
Custom oligonucleotides of any sequence can be easily manufactured synthetically.
The individual nucleotides can be coded, and that proprietary and unique code linked to
represent a particular company, date, or batch, much as a numerical barcode would be.
Short fragments of DNA, like these oligonucleotides, are stable over time in many pH
and temperature conditions, making them an ideal traceability marker for food products.
Another benefit to oligonucleotide tags is that they can be detected by a variety of
methods that may be tailored to industry demands.
The following two chapters describe the conceptual development of oligonucleotide
traceability tags and their addition to food products, in addition to tag detection using
two different methods: real-time PCR and electrochemical impedance spectroscopy,
demonstrating the feasibility of using oligonucleotide tags for enhanced supply chain
traceability of foods and ingredients. In addition to the development of two methods of
tag detection, the stability of the tag over time, and its ability to withstand processing
were investigated.
81
Chapter 5: Real-time PCR Approach for Oligonucleotide Tag Detection Introduction Broadly applied for detection of food-borne pathogens, real-time PCR has been
introduced relatively recently as a tool for authentication of food by identifying the
species present in a product. As reviewed recently (Rodríguez-Lázaro 2013), this
method has been used successfully to authenticate a variety of foods including but not
limited to, meat, dairy and cereals. Real-time PCR allows monitoring of DNA
concentration at each amplification cycle via fluorescence detection that is directly
proportional to the DNA copy number. This allows for quantification of a target molecule.
In this case, quantification of the oligonucleotide tag would allow for traceability as well
as simultaneous detection of debasing of a tagged product with an adulterant.
Methods
Tag Design and Synthesis
Random oligonucleotides were generated and then screened using GenBank for
homology to known sequences that may occur in food or beverages. From those with
no match, a 76 base pair sequence was selected. M13 tails were added to this
sequence to facilitate generation of double stranded tag from the single stranded
oligonucleotide using universal primers. The complete tag (Figure 5.1) was 102 base
pairs long, representing the upper limit of synthetic oligonucleotide synthesis. The
oligonucleotide was purchased from IDT (Integrated DNA Technologies, Coralville, IA,
U.S.A). A double stranded oligonucleotide tag (ONT) was generated from the single
stranded oligonucleotide using traditional PCR. The thermocyler program was as
follows: 94 ˚C for 2 min, 34 cycles of 30s at 94 ˚C, 40s at 52 ˚C and 1 min at 72 ˚C and
a final extension of 72 ˚C for 10 min. The concentration of double stranded tag was
determined using a Nanodrop 8000 spectrophotometer (Thermo Scientific, Wilmington,
Delaware, U.S.A).
Detection in Apple Juice
The ONT was added to apple juice (no name®, Loblaws Inc., Toronto, Canada), and
molecular grade water in serial dilutions between concentrations of 1200 pg/µL –

82
0.00012 pg/µL. Subsequent detection was attempted after DNA extraction using real-
time PCR, as described in detail below, on three different days using three different
batches of ONT. Negative controls with no ONT added were included as well as no-
template controls. Two different extraction methods were tested, as detailed below.
Simulated Laboratory Scale Apple Juice Processing
The ability of the tag to withstand complex food processing conditions of time,
temperature, multiple enzymatic steps and filtration was estimated using a simulated
apple juice processing protocol, developed in partnership with SunRype Products Ltd
(Kelowna, BC). This laboratory scale process included approximations of all the
commercial steps employed in apple juice production. Two golden delicious apples
were blended together with 10 mL of sterile molecular grade water in a blender on
puree setting. The ONT was added in concentrations of 1200 pg/µL – 12 pg/µL to 15 g
of the apple puree. No ONT was added to the control samples. Mash enzyme was
added and was mixed using a stir bar and plate for 90 minutes. The mash was then
vacuum filtered through VWR 417 filter paper. The first aliquot was taken for analysis at
this stage (stage 1). The filtered juice was then heated to 90 ˚C and then held at this
temperature for 1 minute. Another aliquot was taken for analysis at this stage (stage 2).
Samples were cooled at room temperature until they reached 50 ˚C, and pectinase and
amylase were added. Dosage rates for enzymes used are not provided due to their
proprietary nature. The sample was then incubated at 50 ˚C for 90 minutes in a water
bath. A third aliquot was taken for analysis after this step (stage 3). The resulting
mixture was then vacuum filtered through VWR 413 filter paper. A final sample was
taken for analysis (stage 4). Real-time PCR was used to determine if the tag could be
detected at each stage of the process (see details below). Laboratory scale apple juice
processing was repeated three times with three separate batches of ONT generated
from the single stranded oligonucleotide.
Shelf-life Study
To determine the stability of the ONT over time, a shelf-life study was conducted. The
ONT was added to apple juice concentrate at concentrations between 1200 pg/µL-0.12
pg/µL. The tagged concentrate was stored at 4 ˚C. Samples were removed after 2

83
weeks, 6 weeks and 10 weeks and stored at -20C for future analysis. Real-time PCR
was used after DNA extraction of samples, as described below, to determine if the tag
could still be detected after storage.
DNA Extraction
Two extraction methods were used for water and apple juice samples. The first was
Qiagen DNeasy Blood and Tissue Kit. Extractions were carried out according to the
manufacturer protocol, with the following modifications: for apple juice samples, 200 µL
of apple juice was used. The lysis step was omitted and samples were eluted in 100 µL
of elution buffer. The second extraction method involved spotting 15 µL of liquid sample
onto FTA Elute cards (GE Healthcare Biosciences, Pittsburgh, PA, U.S.A.) and allowing
the card to dry. The samples were spotted in approximately the centre of the sample
circles. After drying, a 3mm punch was taken from approximately the centre of the
sample circle. DNA extraction was then carried out on the punch according to
manufacturer instructions.
Real-time PCR
Primers and probes were designed using AlleleID (version 7.7; Premier Biosoft
International, Palo Alto, CA, U.S.A) and ordered from IDT. Sequences for all
oligonucleotides used can be found in Table 5.1. All real-time PCR reactions were
carried out in the SmartCycler II platform (Cepheid, Sunnyvale, CA, U.S.A) using default
background and threshold settings. Optimization of the assay, including primer and
probe concentrations, was carried out according to guidelines for the Smart Cycler II
System (SmartNote 6.2; http://www.cepheid.com/systems-and-software/smartcycler-
system/). The final protocol was as follows: initial denaturing step at 94 ˚C for 120s,
followed by 40 cycles of 94 ˚C for 11s, 60 ˚C for 40s and 72 ˚C for 25s. Reactions were
carried out in 25 µL volumes with a final concentration of primers and probe of 0.6 µM
and 0.2 µM respectively. OmniMix Master Mix (Cepheid) was used according to
manufacturer guidelines. A no template control (NTC) was included with each run.

84
Results and Discussion
Tag Detection in Apple Juice
Using real-time PCR, the ONT tag was successfully detected at concentrations from
1200 pg/µL – 0.0012 pg/µL in water and apple juice using both DNA extraction methods
(Table 5.2). Although the limit of detection was 0.0012 pg/µL after extraction using the
DNeasy kit, the linear range was observed to be between 1200 pg/µL – 0.12 pg/µL with
both the DNeasy kit and the FTA cards (Figure 5.2 and Figure 5.3). Standard curves
showed higher coefficients of determination of using the extractions done with DNeasy
kit than those done from samples spotted onto FTA cards (r2=0.998 and 0.993
respectively). Efficiency, calculated based on the slope of the standard curve was
92.31% after the DNeasy extraction and 98.03% with the FTA card extraction. Both
methods were shown to be suitable for detection of the tag over a broad range of
concentrations. The FTA card extraction represents a simpler method of extraction,
which may be more suitable for applications or industries where tag quantification, and
therefore detection of debasing, is not a high priority. However, based on the variability
in Ct values observed with the use of the FTA card extractions (standard deviations
from 0.09-1.74), the DNeasy extraction kit is more suitable for quantification purposes.
These instances of higher variation are likely due to the variability in sample placement
on the card, as well as the location from which the punch is taken. Standard deviations
between samples of the same concentration were 0.11-0.45 using the DNeasy kit. The
MIQE guidelines (Bustin et al. 2009) recommend that a fresh batch of template should
be prepared when a shift in Ct between 0.5-1 is detected in points on the calibration
curve, suggesting that standard deviations of less than 0.5 between different batches of
ONT indicate potential for quantification purposes. No NTC samples had a Ct below 30.
The average Ct for NTC samples in all real-time PCR experiments was 38.39. The
lowest Ct observed in a NTC was 30.60.
Simulated Apple Juice Processing
A lab-scale simulation showed that the ONT could be detected even after apples
underwent all processing steps (Table 5.3). Although some increase in Ct values was
observed from the beginning of processing to the end, suggesting some loss of target,

85
the ONT was detected at each stage of processing when added in concentrations from
1200 pg/µL - 12 pg/µL. These results show that the oligonucleotide tag used in these
experiments could be added at any stage of apple juice processing as it was still
detected in the final product. Apple juice processing involves heating, filtration,
enzymatic treatments and mechanical breakdown (e.g. shearing). The ability to detect
ONT after treatment with this wide range of processing steps suggests it is suitable for
use in most foods or natural health products. If necessary, further stability may be
achieved by ONT encapsulation which has been employed for other food ingredients
(Desai and Park 2005). The wide disparity between Ct values for samples of the same
concentration suggests that if quantification is required, the tag should be added post-
production, for example at the packing stage, if possible.
Tag Stability
Tag detection in apple juice concentrate was possible for all concentrations of ONT
tested with Ct values shown in Table 5.4. The linear range was determined to be
between 1200 pg/µL – 0.12 pg/µL (Figure 5.4). Reaction efficiency as calculated from
the slope of the standard curve was 100.46% and standard deviations between samples
of the same concentration ranged from 0.08-0.98. This higher variability is likely due to
the difficulty in accurately measuring small volumes of the viscous apple juice
concentrate. For quantification purposes, tagged concentrate may be diluted to single
strength (e.g. 11.5 ˚Brix) before tag detection is attempted. However, Ct values
remained similar over 10 weeks of incubation at 4 ˚C (Table 5.4), suggesting that the
tag was stable over time and could successfully be used for traceability of apple juice
concentrate directly, without dilution, if quantification of adulteration is important.

86
Table 5.1. List of oligonucleotides used in real-time PCR tag detection
Oligonucleotide (5’ – 3’) Sequence
Forward Primer GTGTGAATCACTTGCTC
Reverse Primer ACAGCTATGACCTTTCC
Probe FAM –CAAGCAACCATACAAGAACTTATATCG –BHQ1
M13 Forward Primer TGTAAAACGACGGCCAGT
M13 Reverse Primer CAGGAAACAGCTATGAC
Amplicon Size 82 bp

87
Table 5.2. Comparison of results of tag detection in apple juice from FTA and Qiagen Blood and Tissue Kit extraction methods.
Concentration of tag
Average Ct values (FTA)
Standard Deviation
Average Ct values (Qiagen)
Standard Deviation
1200 pg/µL 15.78 1.58 11.80 0.19
120 pg/µL 18.39 1.70 15.19 0.11
12 pg/µL 22.44 1.05 18.44 0.44
1.2 pg/µL 26.21 1.74 22.07 0.45
0.12 pg/µL 28.71 0.09 25.96 0.37

88
Table 5.3. Tag detection after lab-simulated apple juice processing.
Concentration of tag
Average Ct value stage one
Standard Deviation
Average Ct value stage two
Standard Deviation
Average Ct value stage three
Standard deviation
Average Ct value stage four
Standard Deviation
1200 pg/µL 16.01 2.50 19.33 0.98 19.05 2.57 19.44 2.65
120 pg/µL 19.72 2.21 23.03 1.29 22.01 1.56 22.20 1.94
12 pg/µL 22.26 0.79 26.35 0.55 25.01 1.84 26.86 1.55

89
Table 5.4. Results of shelf-life testing. Changes in Ct values were recorded after ten weeks of storage at 4 ˚C.
Concentration of tag
Initial Ct values
Ct values after 2 weeks
Ct values after 6 weeks
Ct values after 10 weeks
Standard Deviation
1200 pg/µL 12.16 12.22 12.11 12.04 0.08
120 pg/µL 15.17 14.59 14.33 15.60 0.57
12 pg/µL 17.83 18.07 18.11 18.85 0.44
1.2 pg/µL 22.87 21.81 21.28 23.46 0.98
0.12 pg/µL 24.51 25.83 24.88 26.39 0.86

90
Figure 5.1. Oligonucleotide tag. In blue is the 76 base-pair unique region flanked by M13 ends (yellow). In red is the Taqman probe and in green are the sequence-specific primers designed for use in real-time PCR
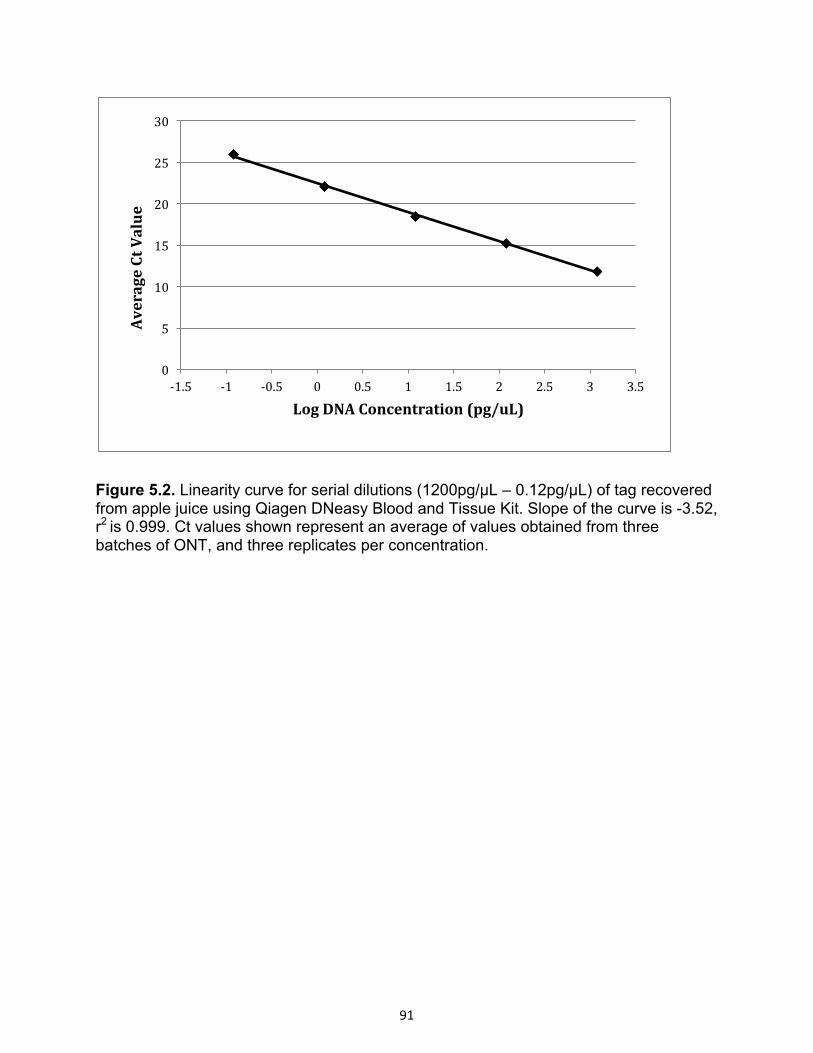
91
Figure 5.2. Linearity curve for serial dilutions (1200pg/µL – 0.12pg/µL) of tag recovered from apple juice using Qiagen DNeasy Blood and Tissue Kit. Slope of the curve is -3.52, r2 is 0.999. Ct values shown represent an average of values obtained from three batches of ONT, and three replicates per concentration.
0
5
10
15
20
25
30
-‐1.5 -‐1 -‐0.5 0 0.5 1 1.5 2 2.5 3 3.5
Average Ct Value
Log DNA Concentration (pg/uL)

92
Figure 5.3. Linearity curve for serial dilutions (1200pg/µL – 0.12pg/µL) of tag recovered from apple juice using FTA extraction cards. Slope of the curve is -3.37, and r2=0.993. Ct values shown represent an average of values obtained from three batches of ONT, and three replicates per concentration.
0
5
10
15
20
25
30
35
-‐1.5 -‐1 -‐0.5 0 0.5 1 1.5 2 2.5 3 3.5
Average Ct Value
Log DNA Concentration (pg/uL)

93
Figure 5.4. Linearity curve for serial dilutions (1200 pg/µL – 0.12 pg/µL) of tag recovered from apple juice concentrate. Slope of the curve is -3.51, r2 is 0.998. Ct values shown represent results of the initial baseline phase of the shelf-life testing.
0
5
10
15
20
25
30
-‐1.5 -‐1 -‐0.5 0 0.5 1 1.5 2 2.5 3 3.5
Average Ct Value
Log DNA Concentraion (pg/uL)
94
Chapter 6: Electrochemical Impedance Spectroscopy Approach When ONT quantification is not a primary concern, alternate detection methods to real-
time PCR for tag detection could be employed. For example, Electrochemical
Impedance Spectroscopy (EIS) can be used for detection of DNA in various biosensing
applications (Lidsat and Schafer 2008) but this has never been shown in food products.
In this study, EIS was used to recover a synthetic oligonucleotide from apple juice,
demonstrating a second possible method of ONT detection (Figure 6.1).
Methods
Chemicals and materials
All aqueous solutions were prepared with deionized water produced by a Millipore Milli-
Q™ water purification system. Sodium perchlorate (anhydrous) was purchased from
Alfa Aesar (Ward Hill, MA, U.S.A). Zinc perchlorate hexahydrate was obtained from
Aldrich (Milwaukee, WI, U.S.A). Potassium ferrocyanide trihydrate and EDTA were
from EM Science (Darmstadt, Germany). Tris (tris hydroxymethyl 1-aminomethane,
ultrapure) was from BMD (Indianapolis, IN, U.S.A). Sulfuric (95- 98%) and perchloric
(70%) acids were from Caledon Laboratory Chemicals (Georgetown, ON, Canada).
Prior to use, apple juice (no name®, Loblaws Inc., Toronto, Canada) was adjusted to pH
8.0 by addition of Tris buffer (0.5 M, pH 10.5).
Oligonucleotides
Oligonucleotides used in EIS tag detection were obtained from BioCorp DNA Inc.
(Dollard-des-Ormeaux, Quebec, Canada) and were of HPLC purity. Oligonucleotides
were resuspended in 20 mM Tris-ClO4 (pH 8.6) and 1 mM EDTA to a concentration of
100 µM by incubating at 65°C for 10 minutes. The following oligonucleotides were used
in this study:
1: HO-(CH2)6-S-S-(CH2)6-5’-CAAGTGATTCACACTCAAGTACTGG-3’
2: 5'-CCAGTACTTGAGTGTGAATCACTTG-3'
3: 3’-GCG-AGG-TAG-GGG-TTG-TTT-GAA-5’

95
Disulfide-labeled capture strand (1) was used to prepare DNA modified sensor
electrodes, and was designed as complimentary to the tag sequence (Strand 2). Strand
2 was the target strand used to tag the apple juice and was a 25 base pair segment of
the oligonucleotide tag designed for use with real-time PCR (Naaum et. al.,
unpublished). Strand 3 corresponds to chicken (Gallus gallus) CYTbos1 primer
sequence and was used as a negative control (Pascoal et al. 2005) to ensure that any
changes in the observed impedance were due to binding of complimentary tag, rather
than the presence of non-specific nucleotides in solution.
Sensor electrodes
Sensor electrodes used in this work were custom made. Briefly, 100 µm dia. gold
electrodes were obtained by placing 100 µm dia. Au wire (99.998%, Premion, Alfa
Aesar, MA, U.S.A) into a low melting point glass capillary 1.5/0.84 mm OD/ID (World
Precision Instruments, Inc., FL, U.S.A) that was sealed at one end. Next, the Au wire
was sealed under high vacuum (Model 17 High Vacuum Pump, Labconco, MO, U.S.A)
using a propane torch. The tip of the sealed glass capillary was then polished flat to
expose the Au disk. The surface of the electrode was polished using rotating alumina
lapping discs (3.0, 0.3 µm, World Precision Instruments, Inc., FL, U.S.A). The resulting
electrodes were then evaluated under an optical microscope and tested by performing
cyclic voltammetry. Before modification, electrodes were cleaned electrochemically by
cycling the potential applied to the electrode between the onset of hydrogen and oxygen
evolution in 1 M H2SO4. Next, electrode surface area was estimated for each individual
electrode before it was placed in the capture strand suspension. Surface area was
calculated by integration of oxide stripping peak observed in 1 M H2SO4 and assumption
that a charge of 482 µC/cm2 is required to strip the monolayer of oxygen (Oesch and
Janata 1983). Using this procedure, Au disk electrodes with roughness factor of less
than two were obtained. Immediately after cleaning, electrodes were rinsed with copious
amounts of water and incubated in 100 mM suspension of the capture strand where
they were incubated for 48 hours to facilitate formation of films consisting of dsDNA and
hydroxyalkyl groups tethered to the gold surface.

96
Instrumentation and electrochemical measurements
All electrochemical measurements were carried out under ambient conditions (without
removal of dissolved oxygen) using CompactStat - Electrochemical Interface &
Impedance Analyzer (Ivium Technologies B.V., Eindhoven, The Netherlands). A
standard three-electrode cell was used with the 100 µm Au disk electrode serving as the
working electrode, a platinum wire (5 cm length, 0.25 mm dia., 99.9%, Alfa Aesar, MA,
U.S.A) as the auxiliary electrode, and a Ag/AgCl reference electrode (CH Instruments,
TX, U.S.A) that was connected to the electrochemical cell via a homemade agar salt
bridge (1 M KNO3). The electrochemical cell was housed in a grounded Faraday cage
to minimize environmental interference. All measurements were performed in 20 mM
Tris-ClO4 (pH 8.6) containing 1 mM K4Fe(CN)6/K3Fe(CN)6 as a depolarizer and 50 mM
NaClO4 as a supporting electrolyte. The mean electrode potential, Emean, was held at the
half wave potential of the [Fe(CN)6]4+/[Fe(CN)6]3+ redox couple, Emean = 0.22 V. EIS
measurements were carried out for frequencies ranging from 10 kHz to 0.1 Hz and
excitation amplitude Vamp = 20 mV.
Model System and Tag Detection
A model system was generated by comparison of EIS values for unmodified electrodes
and electrodes modified with strand 1 before and after incubation for two hours in buffer
solution containing the target strand 2 (50 µM). Detection of the tag was determined by
comparison of EIS values for electrodes modified with strand 1 before and after
incubation for two hours in either untagged apple juice or apple juice tagged with strand
2 (50 µM). Apple juice tagged with strand 3 was used as a control to ensure changes in
EIS values were due to complementary binding of DNA.
Nature of Apple Juice-Sensor Interactions
In an attempt to explain the effects observed on impedance after sensor electrode
incubation in untagged apple juice, the effect of metal ions on tag detection was tested
by incubation of sensor electrodes modified with strand 1 before and after incubation
with zinc solution (0.3 mM), and after subsequent incubation with buffer solution tagged
with strand 2(50 µM).

97
Sensor Reuse
The ability to reuse the sensor electrodes was determined by measuring impedance of
a sensor electrode modified with strand 1 before and after incubation with buffer
solution tagged with strand 2 (50 µM) and comparing these to impedance observed
after subsequent dehybridization in Tris buffer at pH 10.5 for one hour, and
rehybridization in tagged buffer solution.
Results and Discussion
Tag detection in model system
Evaluation of the DNA sensor system was carried out under model conditions using a
series of electrochemical impedance spectroscopy measurements. Figure 6.2 shows
typical impedance spectra (Nyquist plot) observed for the unmodified gold electrode, the
sensor electrode modified with capture strand 1, and the sensor electrode following
incubation with the tagged buffer solution containing strand 2.
The impedance data (Figure 6.2) was interpreted with the help of equivalent circuit
analysis. A proposed equivalent circuit, which was used to model experimentally
observed behavior, is shown in Figure 6.3. Rs represents the solution resistance and is
determined by supporting electrolyte concentration. Qdl is the Constant Phase Element
(CPE) used to account for the frequency dispersion of the double-layer capacitance of
the DNA modified electrode. Impedance of the constant phase element is given by the
following relationship ZQ = 1/(Q(j⋅ω)n, where Q is the frequency-independent constant
relating to the redox properties of the surface, j = -11/2, ω is the angular frequency, and
the exponent n arises from the slope of logZ vs. logf (−1 ≤ n ≤ 1). For n = 0, the CPE
behaves as a pure resistance, n = 1 CPE behaves as a pure capacitor, and for n = 0.5
CPE corresponds to Warburg impedance which is associated with the mass transport
due to the diffusion of ions at the electrode/solution interface (Barsoukov & MacDonald,
2005; Brug, Van den Eeden, Sluyters-Rehbach, & Sluyters, 1984). Rf is the resistance
of the DNA film. Rct represents the charge-transfer resistance related to the faradaic
process, [Fe(CN)6]3- + e ⇄ [Fe(CN)6]4-. Qmt is the constant phase element used to

98
account for the non-ideal behavior of the mass transport impedance arising from the
diffusion of the depolarizer towards the sensor surface.
Predicted impedance spectra are shown in Figure 6.2 as solid lines and estimated
values of equivalent circuit elements are summarized in Table 6.1. Modeling was not
carried out for bare Au electrodes as this is a qualitatively different system than sensor
electrodes and therefore the equivalent circuit proposed in Figure 6.3 could not be used.
Clearly modification of the electrode surface with the DNA recognition film resulted in
noticeable increase of the system impedance in comparison to the bare Au electrode.
This is not surprising because electrostatic repulsion between surface confined ssDNA
and depolarizer hinders the [Fe(CN)6]3- + e ⇄ [Fe(CN)6]4- redox process that occurs at
the electrode surface. Importantly, incubation of the sensor electrode in the buffer
solution containing 50 mM tag results in further increase of the overall system
impedance as electrostatic repulsion between the sensor surface and redox probe
increases upon hybridization between the capture strand and the tag. This is also
reflected by an increase of Rct from 630 (88) Ω⋅cm2 to 855 (79) Ω⋅cm2 and an increase
in Rf from 1287 (117) Ω⋅cm2 to 1401 (162) Ω⋅cm2. Moreover, it is worth noting that the
character of CPE associated with mass transport changes from slightly capacitive, n =
0.58 (0.05), to almost ideal Warburg impedance behavior, n = 0.49 (0.06), while the
character of CPE associated with double layer capacitance remains unchanged upon
hybridization.
Tag detection in apple juice
Sensor electrodes modified with strand 1 were employed to detect the oligonucleotide
tag (strand 2) directly in the apple juice sample. However, when the sensor electrode
was incubated in the tagged apple juice, a negligible change in the impedance
characteristics of the system was observed (data not shown). This loss of sensitivity
towards the tag was likely caused by the interference of the complex apple juice matrix.
Conditioning of the sensor electrode in buffered apple juice prior to incubation with
tagged apple juice eliminated this issue. Figure 6.4 shows a set of impedance data
obtained for the sensor electrode before incubation, after incubation in untagged
buffered apple juice and after subsequent incubation in tagged apple juice. This change

99
in impedance was not observed for electrodes incubated with strand 3, indicating that
the change in impedance was related to the binding of complimentary DNA to the
capture strand.
In order to gain a better understanding of the effect of apple juice on sensor response,
the system was evaluated in terms of the equivalent circuit shown in Figure 6.3, and the
resulting numerical values of the individual circuit elements are summarized in Table
6.1. Theoretical impedance spectra are shown in Figure 6.4 as solid lines. It is evident
that exposure of the sensor to the apple juice lowers its overall impedance in
comparison to pre-exposure values. This is also reflected by decrease in Rs from 1287
(117) to 1022 (86) and decrease in Rct from 630 (88) to 428 (75). Subsequent sensor
incubation in tagged apple juice increases the sensor impedance, Rs from 1022 (86) to
1202 (102) and Rct from 428 (75) to 583 (81). These changes in system impedance
suggest that when the DNA sensor is exposed to the tagged apple juice two
simultaneous processes take place. (1) a hybridization event, which increases the
system impedance and (2) an interaction of the apple juice constituents with the sensor
surface, which lowers the overall impedance. These results imply that for reliable
detection of the tag in apple juice, it is necessary to conduct the sample measurement
using a sensor electrode that has first been conditioned in untagged apple juice.
Nature of apple juice – sensor interactions
Additional experiments were conducted with the purpose of elucidating the nature of
interactions between apple juice and the sensor electrode. Apple juice is a complex
mixture of carbohydrates, organic acids, minerals, and other chemical compounds.
(Eisele and Drake 2005, Paredes et al. 2006; Suárez-Luque et al. 2006). For instance,
typical apple juice contains 0.26 mg/L Zn2+ (Paredes et al., 2006) and 0.89 mg/L Mg2+
(Suárez-Luque et al., 2006). It is known that certain bivalent metal ions can interact with
DNA and affect its electrical properties (Matsui et al. 2009; Oliveira et al. 2008; Yang et
al., 2009). To investigate the effect of metal ions on impedance measurements, the
sensor electrode was incubated in Tris containing 0.3 mM ZnClO4. Figure 6.5 shows
impedance data obtained for the a sensor electrode modified with strand 1 after 2 hours

100
incubation in 0.3 mM ZnClO4, and following incubation (2 hours) in buffered apple juice
tagged with strand 2 at a concentration of 50 mM.
Incubation of the sensor electrode in the presence Zn2+ (Figure 6.5) mimics the effect
observed in the case of apple juice (Figure 6.4). The presence of Zn ions results in a
decrease in system impedance. Moreover, subsequent exposure to the DNA tag results
in an increase in the overall impedance. This suggests that impedance drop caused by
sensor exposure to the apple juice is likely caused by the presence of metal ions.
Sensor reuse
Normally, each sensor electrode must be cleaned, polished and re-incubated with
modified DNA for 48 hours in between each new hybridization process. This is a time
consuming step, and reuse of the sensor electrode is therefore desirable. Similar EIS
values to those initially observed for an unmodified electrode were observed after
dehybridization (Figure 6.6). Subsequent rehybridization of the target DNA to the sensor
electrode modified with the capture strand was also demonstrated (Figure 6.6). The
resulting equivalent circuit analysis of the experimental data shown in Figure 6.6 is
summarized in Table 6.1.
These results suggest that the DNA sensor electrodes may be reused at least once, but
that the sensor recycling procedure introduces some loss of reproducibility as the
standard deviation associated with Rct circuit element increases from 79 to 132 Ω⋅cm2.
Thermal dehybridization, which was also investigated, resulted in the loss of the capture
strand from the electrode surface. Nevertheless, potential for the sensor to be reused is
demonstrated, but further optimization of the sensor recycling procedure is required.
The ability to reuse the sensor electrodes without having to clean, polish and modify in
between measurements streamlines the process and could help in the
commercialization of this method for oligonucleotide tag detection.

101
Table 6.1. Values of the equivalent circuit elements for the DNA sensor electrode
estimated after different incubation steps.
Rs
(Ω⋅cm2)
Qdl
(µS⋅sn/cm2)
ndl Rf
(Ω⋅cm2)
Rct
(Ω⋅cm2)
Qmt
(µS⋅sn/cm2)
nmt
sensa 0.8
(0.1)
4.4 (0.9)
10-5
0.90
(0.03)
1287
(117)
630
(88)
6.5 (0.9)
10-4
0.58
(0.05)
sens+tagb 0.8
(0.1)
3.7 (0.7)
10-5
0.90
(0.02)
1401
(162)
855
(79)
8.1 (0.7)
10-4
0.49
(0.06)
sens(a.j.)c 0.9
(0.1)
5.7 (1.5)
10-5
0.88
(0.02)
1022
(86)
428
(75)
8.5 (1.6)
10-4
0.53
(0.11)
sens(a.j.)+tagd 0.8
(0.1)
5.1 (1.3)
10-5
0.90
(0.02)
1202
(102)
583
(81)
8.0 (2.2)
10-4
0.49
(0.12)
sens(re)e 0.8
(0.1)
4.76 (0.8)
10-5
0.89
(0.02)
1285
(148)
659
(121)
6.7 (0.2)
10-4
0.55
(0.08)
sens(re)+tagf 0.9
(0.1)
4.2 (0.5)
10-5
0.89
(0.01)
1412
(195)
795
(132)
7.9 (1.4)
10-4
0.48
(0.18)
Values in parentheses represent SD for 5 replicates of different electrodes. a represents “fresh” sensor electrode b represents electrode after 2 hours incubation in 50 mM tag in Tris c represents electrode after 2 hours incubation in buffered apple juice d represents electrode after 2 h incubation in buffered apple juice and subsequent 2 h incubation in tagged apple juice e represents recycled electrode (2 hours incubation in 50 mM tag and subsequent dehybridization) f represents recycled electrode after 2 hours incubation in 50 mM tag in Tris

102
Figure 6.1. Overview of oligonucleotide tag recovery from beverages using electrochemical impedance spectroscopy. (a) A gold electrode is incubated in a solution containing disulfide labeled capture strands, complementary to the oligonucleotide tag. (b) The capture strands self-assemble into a film on the surface of the electrode, and the electrochemical impedance of the modified electrode is measured. The electrode is then incubated in any beverage containing the oligonucleotide tag. (c) The two complementary strands hybridize, changing the electrochemical impedance of the electrode. If no tag is present, then no change in impedance is observed.

103
Figure 6.2. Typical Nyquist plots (imaginary component of the impedance, -Z”, vs real
component of the impedance, Z’) obtained for an unmodified Au electrode (×), a sensor
electrode modified with capture strand (strand 1) (◇) and a sensor electrode after
incubation in buffer solution tagged with strand 2 for 2 hours (○). The data points
represent experimental data observed in 20 mM Tris-ClO4 (pH 8.6), 50 mM NaClO4 and
1 mM K4Fe(CN)6/K3Fe(CN)6, and the solid lines correspond to the theoretical spectra.
Experimental conditions: Emean = 0.22 V, fmin = 10 kHz, fmax = 0.1 Hz, Vamp = 20 mV.

104
Figure 6.3. Equivalent circuit model representing the apatamer sensor and used to
obtain theoretical impedance spectra. Rs is the solution resistance, Qdl is the constant
phase element accounting for frequency dispersion of the double layer capacitance, Rf
is the resistance of the recognition film, Rct is the charge transfer resistance and Qmt is
the constant phase element representing non-ideal mass transfer behavior.

105
Figure 6.4. Typical Nyquist plots obtained for a sensor electrode modified with strand 1
(◇), sensor electrode incubated for 2 hours in buffered apple juice (△), followed by 2
hours sensor incubation in apple juice tagged with strand 2 (○). The data points
represent experimental data observed in 20 mM Tris-ClO4 (pH 8.6), 50 mM NaClO4 and
1 mM K4Fe(CN)6/K3Fe(CN)6, and the solid lines correspond to the theoretical spectra.
Experimental conditions: Emean = 0.22 V, fmin = 0.1 Hz, fmax = 10 kHz, Vamp = 20 mV.

106
Figure 6.5. Typical Nyquist plots obtained for a sensor electrode modified with strand 1
(◇), sensor electrode incubated for 2 hours in buffer containing 3 mM Zn2+ (△), followed
by 2 hours sensor incubation apple juice solution tagged with strand 2 at a
concentration of 50 mM tag in apple juice (○). The data points represent experimental
data observed in 20 mM Tris-ClO4 (pH 8.6), 50 mM NaClO4 and 1 mM
K4Fe(CN)6/K3Fe(CN)6, and the solid lines correspond to the theoretical spectra.
Experimental conditions: Emean = 0.22 V, fmin = 0.1 Hz, fmax = 10 kHz, Vamp = 20 mV.

107
Figure 6.6. Nyquist plots obtained for sensor electrode modified with strand 1 (◇),
sensor electrode incubated for 2 hours in Tris-buffer (pH 8.6) containing 50 mM tag (○),
sensor after dehybridization for 1 hour in Tris-buffer (pH 10.5) (◆) and subsequent
incubation in Tris-buffer (pH 8.6) containing 50 mM tag (●). The data points represent
experimental data recorded in 20 mM Tris-ClO4 (pH 8.6), 50 mM NaClO4 and 1 mM
K4Fe(CN)6/K3Fe(CN)6, and the solid lines correspond to the theoretical spectra.
Experimental conditions: Emean = 0.22 V, fmin = 0.1 Hz, fmax = 10 kHz, Vamp = 20 mV.

108
Synthetic Tagging Conclusions In section two, a novel DNA based food tagging technology is described, coupled with
two different detection methods. Using real-time PCR the potential to quantify tag
concentration for detection of debasing has been shown. The various processing
methods employed in the creation of apple juice represent many of those employed by
the food industry. Therefore, the successful detection of the ONT in the laboratory-
produced tagged apple juice suggests that this tag could be used in a wide range of
food and natural health products for traceability purposes. Shelf-life studies also show
this tag was stable for a minimum of 10 weeks in apple juice concentrate. Further
studies will need to be undertaken to evaluate if and how ONTs bind to container
materials and how exposure to light may affect their stability to ensure changes in tag
concentration observed can be attributed to adulteration rather than other factors.
This research focused on ONT addition to aqueous solutions. Encapsulation of the ONT
may provide added stability in hydrophilic solution, and also allow the addition of the
ONT to hydrophobic liquids such as oils, as well as dry products. The ability to add
ONT to oils would be highly beneficial as they are often adulterated (Moore et al. 2012).
For dried products, natural health products and pharmaceuticals, ONT may be bound to
sugar spheres, which are common carriers for bioactives for pharmaceuticals. These
methods of encapsulation will be the focus of continued studies.
The use of electrochemical impedance spectroscopy for the detection of a synthetic
oligonucleotide from apple juice was also clearly demonstrated. Recent breakthroughs
in detecting single-nucleotide mismatches using EIS (e.g. Kafka et al. 2008) suggest
that this method has the potential to differentiate tags with similar sequences. Further
studies will focus on optimizing this assay for reduced hybridization time, testing for
detection of longer oligonucleotide tags and determining the lower limits of tag
concentration necessary for accurate detection. In addition further tests of the
reproducibility of this method in other types of food products will be necessary to
confirm its utility in multicomponent systems.
In both cases of detection, the use of an internal traceability tag has shown potential for
commercial use as a fraud deterrent, or to help companies communicate increased

109
traceability measures to their consumers. Though traceability using ONTs will certainly
require further optimization and validation by independent laboratories before reaching
the market, it is certain to serve as a valuable tool in a move towards improving
detection of fraudulent products and consumer safety.

110
Chapter 7. Summary and Recommendations Food Authenticity
The methods of species identification described here serve not only as improved tools
for crop management and food authenticity, but also illustrate the link between species
identification and the food and agriculture industries and the close relationship between
basic and applied research in this area. Species identification is of key importance in
these fields, and continued improvements using DNA analysis will provide more
accurate, rapid and cost-effective means for conducting socio-economically important
biological identifications.
DNA barcode sequences in BOLD are a logical source for design of these assays due
to the presence of vouchered specimens, metadata, and original sequence trace files.
Of particular importance when designing primers and probes based on polymorphisms
for species identification is the ability to access the original trace files, as these data are
not typically available in other databases. A full characterization of the haplotypes of a
given species is necessary for accurate primer and probe design to minimize false
positives or false negatives arising from unique haplotypes with differences in primer or
probe regions. In the case of haplotypes found from only one individual, the trace file
can be consulted to determine the accuracy of the sequence, thereby eliminating
unnecessary complications in primer/probe design arising from the inclusion of artifacts
of sequencing error rather than biological variants. The metadata available with DNA
barcode sequences can and should be used to determine the geographic coverage of
individuals to ensure the appropriate geographic regions have been adequately
represented in assay design.
The utility of BOLD for development of PCR-based methods for species identification is
clear. However, development of guidelines for sampling can only serve to improve the
design and accuracy of these tests. When using Sanger sequencing to identify a
sample the presence of all possible haplotypes is not crucial. Since matches are made
by genetic distance, a close match will still be returned even if the unknown sample is a
new haplotype of the same species, likely allowing accurate identification. However,
with PCR based methods, a haplotype that was not considered during primer/probe

111
design may result in erroneous conclusions. Therefore sampling effort to assess
geographic and genetic variants is directly linked to the success of any primer or probe
developed for species identification. The genetic and geographic diversity of the target
species, as well as closely related species, should be clearly articulated for assay
design, a feature that is omitted from most published studies summarized in Chapter 1.
Representation of individuals covering the full range of haplotypic diversity is ideal, yet
few studies dealing with the generation of species-specific real-time PCR assays
provide information on the number of individuals or geographic coverage of the
sequences used for the development of primers and probes. This is possibly due to the
lack of sampling guidelines on how to adequately ensure haplotype diversity coverage.
The issue of determining appropriate sample sizes must be addressed for better
accuracy of real-time PCR assays meant to provide biological identifications. This is
particularly important in applied cases where results must fit within existing regulatory
framework that may provide little room for error. One previous study looking at
haplotype occurrence in lake trout estimates that a sample size of 59 individuals would
be required for 95% confidence that all haplotypes from a population were represented
in a sample (Grewe et al. 1993). For regulatory purposes, a higher confidence may be
required. According to the same formula, 99% confidence would require 459 individuals.
This may provide a theoretical basis for sampling, but actual requirements may differ
between different taxa and for different applications, depending upon such factors as
gene choice, rates of molecular evolution, population structure and gene flow.
For some applications, minimal sampling may be sufficient. This is especially true for
studies where multiple gene regions are sequenced and haplotype coverage is not of
primary concern. When the number of gene regions is limited, such as with DNA
barcoding, haplotype coverage becomes more important. DNA barcoding guidelines
suggest between five and ten individuals per species be sampled (ibol.org). This is
usually sufficient to make identifications using a genetic distance based approach.
However, as discussed above, haplotype diversity is of particular concern when
developing primers and probes for real-time PCR. Continued addition of DNA barcode
sequences will improve the utility of assay developed from sequences deposited in

112
barcode libraries. A study of existing sequences is necessary to help inform guidelines
for sampling to ensure success of downstream applications of the database.
The salmonid DNA barcodes used to develop the oligonucleotides evaluated in Chapter
1 were generated from many individuals of each species. However, haplotype
accumulation curves showed a plateau in the number of haplotypes only for those
species in which more than 60 individuals were sampled (Figure 7.1). Although this has
not had a practical impact on primer or probe success for identifying species in the
market samples tested to date, adequate coverage of the population, and saturation of
haplotype accumulation, is an ideal worth exploring when developing real-time PCR
based identification tools. This example illustrates the need for standard sampling
guidelines, which are currently lacking. Although the number of individuals per species
used was much higher than numbers usually seen in DNA barcoding studies, complete
haplotype coverage may not have been achieved. These guidelines will be especially
important for assays that may be implemented in regulatory settings. In cases where
deep sampling effort is not possible, for example if the species in question is very rare,
samples should be tested via a secondary method such as DNA sequencing or RFLP,
to confirm real-time PCR identification for high-impact cases.
The socioeconomic impact of the tests outlined in this thesis is evident. Species
identification for pests and seafood products can lead to improved crop and fisheries
management. These tests, combined with adequate traceability methods help limit
impact to consumers from purchase and consumption of adulterated products and
contribute not only to detection but also to deterrence and prevention of food fraud.
Since DNA barcoding has been applied to a wide range of species found in food
products (Galimberti et al. 2013), similar tests can be developed for a wide range of
sectors of the food industry such as meat, dairy, grains, allergens and more. Using data
available in BOLD, questions of authenticity related to species identification can be
addressed for a variety of applications.
Food Traceability
External traceability tags are vulnerable to removal or tampering. External traceabilty or
authenticity features also have an inherent weakness in that they trace and/or

113
authenticate the package and not the product. Internal tagging adds a further dimension
of protection against fraud because the authentication is of the product. By using an
internal synthetic oligonucleotide tag (ONT) to aid traceability, companies can better
track products and protect their consumers and their brand from the effects of
adulterated or fraudulent products by determining presence of the tag in a manner
similar to detecting species in the above examples.
Results presented here show that an ONT is stable over time, and can still be detected
after intensive processing using a case study of apple juice. Used in fish brine, the ONT
can be used to trace smoked fish products as well (Naaum et al. unpublished results).
These data suggest that a wide variety of other food and natural health products may
make use of this tagging principle for improved traceability.
Species mislabeling has been found in natural health products (e.g. Newmaster et al.
2013), and therefore this may represent a market where oligonucleotide tagging may be
valuable. Initial measurements of response to the new traceability system for ginseng
has suggested that consumers would be willing to pay for improved traceability using
this type of tag (Lilavanichakul and Boecker, 2013). Therefore, encapsulation of the tag
for use in dried products like ginseng may expand the commercial utility of this method.
Improved traceability measures are necessary not only to comply with changing
policies, but also to ensure consumer safety and maintain brand image. The recent
horse meat scandal, in which horse meat was identified as an illegal and unannounced
adulterant in products labeled as beef, has been extensively covered by the media.
Stories like this, and other highly publicized incidences of food adulteration,
demonstrate a need to continue the advancement of traceability technology. The role of
molecular techniques to enhance knowledge of species, and the genetic variation both
within and between them, is crucial for subsequent pest management and regulation of
food ingredients.

114
0 10 20 30 40
24
68
10
Oncorhynchus gorbuscha
Specimens Sampled
Uni
que
Hap
loty
pes
0 50 100 150 200
24
68
1012
Oncorhynchus tshawytscha
Specimens Sampled
Uni
que
Hap
loty
pes
Figure 7.1. Haplotype accumulation curves representing random sampling of individuals of Oncorhynchus tshawytscha and Oncorhynchus gorbuscha from the BOLD project “Salmonid Species North America”, with the number of haplotypes counted after each sample. Error bars represent repeat sampling (n=100).

115
References Abdulmawjood, A., and Buelte, M. 2002. Identification of ostrich meat by restriction fragment length polymorphism (RFLP) analysis of cytochrome b gene. J. Food Sci. 67, 1688-1691.
Accum, F.C. 1820. A treatise on adulterations of food, and culinary poisons. Retrieved from http://www.gutenberg.org/etext/19031
Aida, A.A., Che Man, Y.B., Wong, C.M.V.L., Raha, A.R., and Son, R. 2005. Analysis of raw meats and fats of pigs using polymerase chain reaction for Halal authentication. Meat Sci. 69, 47-52.
Ainley, D.G. and Siniff, D.B. 2009. The importance of Antarctic toothfish as prey of Weddell seals in the Ross Sea. Antarctic. Science. 21, 317-327.
Alary, R., Serin, A., Duviau, M.P., Joudrier, P., and Gautier, M-F. 2002. Quantification of common wheat adulteration of durum wheat pasta using Real-time quantitative polymerase chain raction (PCR). Cereal Chem. 79, 553-558.
Alary, R., Buissonade, C., Joudrier, P., and Gautier, M.F. 2007. Detection and discrimination of cereal and leguminous species in chestnut flour by duplex PCR. Eur. Food. Res. Technol. 225, 427-434.
Ali, M.E., Hashim, U., Mustafa, S., and Che Man, Y.B. 2011. Swine-specific PCR-RFLP assay targeting mitochondrial cytochrome b gene for semiquantitative detection of pork in commercial meat products. Food Anal. Methods. 5, 613-623.
Ali, M.E., Hasim, U., Dhani, T.S., Mustafa, S., Man, Y.B.C., and Latif, M.A. 2012b. Analysis of pork adulteration in commercial burgers targeting porcine-specific mitochondrial cytochrome b gene by TaqMan probe real-time polymerase chain reaction. Food Anal. Methods. 5, 784-794.
Ardura, A., Pola, I.G., Ginuino, I., Gomes, V. and Garcia-Vasquez, E. 2010. Application of barcoding to Amazonian commercial fish labelling. Food Res. Int. 43, 1549-1552.
Asahina, H., Shinozaki, J., Masuda, K., Morimitsu, Y., and Satake, M. 2010. Identification of medicinal Denrobium species by phylogenetic analyses using matK and rbcL sequences. J. Nat. Med. 64, 133-138.
Bai, W., Xu, W., Huang, K., Yuan, Y., Cao, S., and Luo, Y. 2009. A novel common primer multiplex PCR (CP-M-PCR) method for the simultaneous detection of meat species. Food Control 20, 366-370.
Barbuto, M., Galimberti, A., Ferri, A., Labra, M., Malandra, R., Galli, P. and Casiraghi, M. 2010. DNA barcoding reveals fraudulent substitutions in shark sefood products: The Italian case of “palombo” (Mustelus spp.). Food Res. Int. 43, 376-381.
Barsoukov, E., and MacDonald, R. 2005. Impedance Spectroscopy: Theory, Experiment, and Applications, 2nd Edition.

116
Berjota, G., Giaccone, V., Carraro, L., Mininni, A., and Cardazzo, B. 2009. A rapid and high-throughput real-time PCR assay for species identification: application to stockfish sold in Italy. Eur. Food Res. Technol. 229, 191-195.
Bielikova, M., Pangall, D., and Turna., J. 2010. Polymerase chain reaction-restriction fragment length polymorphism (PCR-RFLP) as a molecular discrimination tool for raw and heat-treated game and domestic animal meats. J. Food Nutr. Res. 49, 134-139.
Bitanyi, S., Bjornstad, G., Ernest, E.M., Nesje, M., Kusiluka, L.J., Keyyu, J.D., Mdegela, R.H., and Roed, K.H. 2011. Species identification of Tanzanian antelopes using DNA barcoding. Mol. Ecol. Res. 11, 442-449.
Blackman, R.L. and Eastop, V.F. 1994. Aphids on the World’s Trees: An Identification and Information Guide. CAB International, Wallingford, UK.
Blackman, R.L. and Eastop VF. 2000. Aphids on the World’s Crops: An Identification and Information Guide. 2nd Edition. John Wiley and Sons Limited, Chichester.
Breton, C., Claux, D., Metton, I., Skorski, G., and Berville, A. 2004. Comparative study of methods for DNA preparation from olive oil samples to identify cultivar SSR alleles in commercial oil samples: possible forensic applications. J. Agric. Food Chem. 52, 531-537.
Brezna, B., Hudecova, L., and Kuchta, T. 2006a. Detection of pea in food by real-time polymerase chain reaction (PCR). Eur. Food Res. Technol. 222, 600-603.
Brezna, B., Hudecova, L., and Kuchta, T. 2006b. A novel real-time polymerase chain reaction (PCR) method for the detection of walnuts in food. Eur. Food Res. Technol. 223, 373-377.
Brodmann, P.D., and Moor, D. 2003. Sensitive and semi-quantitative TaqMan real-time polymerase chain reaction systems for the detection of beef (Bos Taurus) and the detection of the family Mammalia in food and feed. Meat Sci. 65, 599-607.
Brug, G. J., Van den Eeden, A. L. G., Sluyters-Rehbach, M., and Sluyters, J. H. 1984. The analysis of electrode impedances complicated by the presence of a constant phase element. J. Electroanal. Chem., 176, 275-295.
Bruni, H., De Mattia, F., Galimberti, A., Galasso, G., Banfi, E., Casiraghi, M., and Labra. M. 2010. Identification of poisonous plants by DNA barcoding approach. Int. J. Legal Med. 124, 595-603.
Bustin, S.A., Benes, V., Garson, J.A., Hellemans, J., Huggett, J., Kubista, M., Mueller, R., Nolan, T., Pfaffl, M.W., Shipley, G.L., Vandesompele, J., and Wittwer, C.T. 2009. The MIQE Guidelines: Minimum Information for Publication of Quantitative Real-Time PCR Experiments. doi:10.1373/clinchem.2008.112797
Camma, C., Di Domenico, M., and Monaco, F. 2012. Development and validation of fast Real-Time PCR assays for species identification in raw and cooked meat mixtures. Food Control 23, 400-404.

117
Carrera, E., et al. 2000. Differentiation of smoked Salmo salar, Oncorhuncus mykiss, and Brama raii using the nuclear marker 5S rRNA. Int. J. Food Sci. Tech. 35, 401-406.
Carvalho, D.C., Neto, D.A.P., Brasil, B.S.A.F., and Oliviera, D.A.A. 2011. DNA barcoding unveils a high rate of mislabelling in a commercial freshwater catfish from Brazil. Mit. DNA. 22, 97-105.
Castalanelli, M.A., Severtson, D.L., Brumley, C.J., Szito, A., Foottit, R.G., Grimm, M., Munyard, K. and Groth, D.M. 2010. A rapid non-destructive DNA extraction method for insects and other arthropods. J. Asia Pacific Entomol. 13, 243-248
Cawthorn, D., Steinman, H.A., and Witthuhn, R.C. 2011. Establishment of a mitochondrial DNA sequence database for the identification of fish species commercially available in South Africa. Mol. Ecol. Res. 11, 979-991.
CBOL Plant Working Group. 2009. A DNA barcode for land plants. Proc. Natl. Acad. Sci. 106, 12794-12797.
Chandrika, M., Maimunah, M., Zainon, M.N., and Son, R. 2010. Identification of the species origin of commercially available processed food products by Mitochondrial DNA analysis. Int. Food Res. J., 17, 867-876.
Che Man, Y., Aida, A.A., Raha, A.R., and Son, R. 2007. Identification of pork derivatives in food products by species-specific polymerase chain reaction (PCR) for halal verification. Food Control. 18, 885-889.
Chen, S.Y., Liu, Y.P., and Yao, Y.G. 2010. Species authentication of commercial beef jerky based on PCR-RFLP analysis of the mitochondrial 12S rRNA gene. J. Genet. Genomics. 37, 763-769.
Chisholm, J., Conyers, C., Booth, C., Lawley, W., and Hird, H. 2005. The detection of horse and donkey using real-time PCR. Meat Sci. 70, 727-732.
Chisholm, J., Sanchez, A., Brown, J., and Hird, H. 2008. The development of species-specific real-time PCR assays for the detection of pheasant and quail in food. Food Anal. Methods. 1, L190-194.
Cline, E. 2012. Marketplace substitution of Atlantic salmon for Pacific salmon in Washington State detected by DNA barcoding. Food Res. Int. 45, 388-393.
Cohen, N.J., Deeds, J.R., Wong, E.S., Hanner, R.H., Yancy, H.F., White, K.D., Thompson, T.M., Wahl, M., Pham, T.D., Guichard, F.M., Huh, I., Austin, C., Dizikes, G., and Gerber, G.I. 2009. Public health response to puffer fish (tetrodotoxin) poisoning from mislabelled product. J. Food Protect. 72, 810-817.
Colombo, F., Viacava, R., and Giaretti, M. 2000. Differentiation of the species ostrich (Struthio camelus) and emu (Dromaius novaehollandiae) by polymerase chain reaction using an ostrich-specific primer pair. Meat Sci. 56, 15-17.
Dalton, D.L. and Kotze, A. 2011. DNA barcoding as a tool for species identification in three forensic wildlife cases in South Africa. Forensic Sci. Int. 207: e51-e54.

118
S Kumar, T Kahlon, and S Chaudhary. 2011. A rapid screening for adulterants in olive oil using DNA barcodes. Food Chem. 127, 1335-1341.
D’andrea, M., Codsson, J.D., Locatelli, M., Garino, C., Cereti, E., and Alorio, M. 2011. Validating allergen coding genes (Cor a 1, Cor a 8, Cor a 14) as target sequences for hazelnut detection via real-time PCR. Food Chem. 124, 1164-1171.
Dahindin, I., Stadler, M., Luthy. J., and Pauli, U. 2000. Evaluation of real-time PCR to detect coeliac-toxic components and comparison to the ELISA method analysing 35 baby food samples. Mitt. Lebensm. Hyg. 91, 723-732.
De Mattia, F., Bruni, I., Galimberti, A., Cattaneo, F., Casiraghi, M. and Labra, M. 2011. A comparative study of different DNA barcoding markers for the identification of some members of Lamiacaea. Food Res. Int. 44, 693-702.
Demmel, A., Hupfer, C., Ilg Hampe, E., Busch, U., and Engel, K.-H. 2008. Development of a real-time PCR for the detection of lupine DNA (Lupinus species) in foods. J. Agric. Food Chem. 56, 4328-4332.B
Desai, K.G.H., and Park, H.J. 2005. Recent Developments in Microencapsulation of Food Ingredients. Dry. Technol., 23, 1361-1394.
DFO. Fisheries and Oceans Canada. http://www.dfo-mpo.gc.ca (accessed Dec 1, 2009).
Di Finizio, A., Guerriero, G., Russo, G.L., and Ciarcia, G. 2007. Identification of gadoid species (Pisces, Gadidae) by sequencing and PCRRFLP analysis of mitochondrial 12S and 16S rRNA gene fragments. Eur. Food Res. Technol. 225, 337-344.
Dooley, J.J., Paine, K.E., Garret, S.D., and Brown, H.M. 2004. Detection of meat species using TaqMan real-time PCR assays. Meat Sci. 68, 431-438.
Doosti, A., Dehkordi, P.G., and Rahimi, E. 2012. Molecular assay to fraud identification of meat. J. Food Sci. Technol. DOI:10.1007/s13197-011-0456-3.
Eaton, M.J., Meyers, G.L., Kolokotronis, S., Leslie, M.S., Martin, A.P., and Amato, G. 2010. Barcoding bushmeat: molecular identification of Central African and South American harvested vertebrates. Conserv. Genet. 11, 1389-1404.
Eisele, T. A. and Drake, S. R. 2005. The partial compositional characteristics of apple juice from 175 apple varieties. J. Food Comp. Anal. 18, 213-221.
El-Agamy, E.I. 2007. The challenge of cow milk protein allergy. Small Ruminant Res. 68, 64-72.
Eugster, A., Murmann, P., Borer, M., and Kaenzig, A. 2011. A real-time polymerase chain reaction (PCR) method for the detection of wasabi (Eutrema wasabi) in foods. Eur. Food Res. Technol. 232, 929-934.
Farjardo, V., Gonzalez, I., Lopez-Calleja, I., Martin, I., Hernandez, P.E., Garcia, T., and Martin, R. 2006. PCR-RFLP authentication of meats from red deer (Cervus elaphus),

119
fallow deer (Dama dama), roe deer (Capreolus capreolus), cattle (Bos Taurus), sheep (Ovis areis) and goat (Capra hircus). J. Agric. Food Chem. 54, 1144-1150.
Farjardo, V., Gonzalez, I., Lopez-Calleja, I., Martin, I., Rojas, M., Pavon, M.A., Hernandez, P.E., Garcia, T., and Martin, R. 2007a. Analysis of Mitochondrial DNA for authentication of meats from chamois (Rupicapra rupicapra), Pyrenean ibex (Capra pyrenaica) and mouflon (Ovis ammon) by polymerase chain reaction-restriction fragment length polymorphism. J. AOAC. Int. 90, 179-186.
Farjardo, V., Gonzalez, I., Lopez-Calleja, I., Martin, I., Rojas, M., Hernandez, P.E., Garcia, T., and Martin, R. 2007b. Identification of meats from red deer (Cervus elaphus), fallow deer (Dama dama), and roe deer (Capreolus capreolus) using polymerase chain reaction targeting specific sequences from the mitochondrial 12S rRNA gene. Meat Sci. 76, 234-240.
Farjardo, V., Gonzalez, I., Lopez-Calleja, I., Martin, I., Rojas, M., Hernandez, P.E., Garcia, T., and Martin, R. 2007c. PCR identification of meats from chamois (Rupicapra rupicapra), Pyrenean ibex (Capra pyrenaica) and mouflon (Ovis ammon) targeting specific sequences from the mitochondrial D-loop. Meat Sci. 76, 644-652.
Farjardo, V., Gonzalez, I., Martin, I., Rojas, M., Hernandez, P.E., Garcia, T., and Martin, R. (2008a) Differentiation of European wild boar (Sus scrofa scrofa) and domestic swine (Sus scrofa domestica) meants by PCR analysis targeting the mitochondrial D-loop and the nuclear melanocortin receptor 1 (MC1R) genes. Meat Sci. 78, 314-322.
Farjardo, V., Gonzalez, I., Martin, I., Rojas, M., Hernandez, P.E., Garcia, T., and Martin, R. (2008b) Real-time PCR for detection of red deer (Cervus elaphus), fallow deer (Dama dama), and roe deer (Capreolus capreolus) in meat mixtures. Meat Sci. 79, 289-298.
Farjardo, V., Gonzalez, I., Martin, I., Rojas, M., Hernandez, P.E., Garcia, T., and Martin, R. (2008c) Real-Time PCR for quantitative detection of chamois (Rupicapra rupicapra) and Pyrenean ibex (Capra pyrenaica) in meat mixtures. J. AOAC. Int. 91, 103-111.
Farjardo, V., Gonzalez, I., Martin, I., Rojas, M., Hernandez, P.E., Garcia, T., and Martin, R. 2009b. A LightCycler TaqMan PCR assay for quantitative detection of chamois (Rupicapra rupicapra) and Pyrenean ibex (Capra pyrenaica) in meat mixtures. Int. J. Food Sci .Technol. 44, 1997-2004.
Farrokhi, R., and Jafari Joozani, R. 2011. Identification of pork genome in commercial meat extracts for Halal authentication by SYBR green I real-time PCR. Int. J. Food Sci. Technol. 21, 408-421.
Filonzi, L., Chiesa, S., Vaghi, M., and Marzano, F.N.. 2010. Molecular barcoding reveals mislabelling of commercial fish products in Italy. Food Res. Int. 43, 1383-1388.
Foottit, R.G., Halbert, S.E., Miller, G.L., Maw, E. and Russell, L.M. 2006. Adventive Aphids (Hemiptera : Aphididae) of America North of Mexico. P. Entomol. Soc. Wash. 108, 583-610.

120
Foottit, R.G., Maw, H.E.L., Von Dohlen, C.D. and Hebert, P.D.N. 2008. Species identification of aphids (Insecta: Hemiptera: Aphididae) through DNA barcodes. Mol. Eco. Res. 8, 1189-1201.
Foottit, R.G., Lowery, D.T., Maw, H.E.L, Smirle, M.J. and Lushai, G. 2009. Identification, distribution and molecular characterization of the apple aphids Aphis pomi and Aphis spiraecola (Hemiptera : Aphididae : Aphidinae). Can. Entomol. 141, 478-495.
Fuchs, M., Cichna-Markl, M., and Hochegger, R. 2010. Development and validation of a real-time PCR method for the detection of white mustard (Sinapis alba) in foods. J. Agric. Food Chem. 58, 11193-11200.
Frewin, A., Scott-Dupree, C. and R Hanner. 2013. DNA barcoding for plant protection: applications and summary of available data for arthropod pests. CAB. Rev. 8, 1-13.
Galan, A.G., Brohee, M., Scaravelli. E., van Hengel, A., and Chassaigne, H. 2010. Development of real-time PCR assays for the detection of lupin residues in food products. Eur. Food Res. Technol. 230, 597-608.
Galan, A.M.G., Brohee, M., De Andrade Silva, E., Van Hengel, A.J., and Chassaigne, H. 2011. Development of a real-time PCR method for the simultaneous detection of soya and lupin mitochondrial DNA as markers for the presence of allergens in processed food. Food Chem.127, 834-841.
Galimberti, A., De Mattia, F., Losa, A., Bruni, I., Federici, S., Casiraghi, M., Martellos, S., and Labra, M. 2013. DNA barcoding as a new tool for food traceability. Food Res. Int. 50, 55-63.
Gao, T., Sun, Z., Yao, H., Song, J., Zhu, Y., Ma, X., and Chen, S. 2010. Identification of Fabacae plants using the DNA barcode matK. Planta Med. 77, 92-94.
Ghovvati, S., Nassiri, M.R., Mirhoseini, S.Z., Heravi Moussavi, A., and Javadmanesh, A. 2009. Fraud Identification in industrial meat products by multiplex PCR assay. Food Control. 20, 96-699.
Girish, P.S., Anhaneyulu, A.S.R., Viswas, K.N., Shivakumar, B.M., Anand, M., Patel, M., and Sharma, B. 2005. Meat species identification by polymerase chain reaction-restriction fragment length polymorphism (PCR-RFLP) of mitochondrial 12S rRNA gene. Meat Sci. 70, 107-112.
Girish, P.S., Anhaneyulu, A.S.R., Viswas, K.N., Santhosh, F.H., Bhilegaonkar, K.N., Agarwal, R.K., Kondaiah, N., and Nagappa, K. 2007. Polymerase chain reaction-restriction fragment length polymorphism of mitochondrial 12S rRNA gene: A simple method for identification of poultry meat species. Vet. Res. Comm. 31, 447-455.
Girish, P.S., Haunshi, S., Vaithiyanathan, S., Rajitha, R., and Ramakrishna, C. 2011. A rapid method for authentication of Buffalo (Bubalus bubalis) meat by Alkaline Lysis method of DNA extraction and species specific polymerase chain reaction. J. Food. Sci. and Technol. DOI:10.1007/s13197-011-0230-6.

121
Golan, E., Krissoff, B., Kuchler, F., Nelson, K., Price, G., and Calvin, L. 2003. Traceability for food safety and quality assurance: mandatory systems miss the mark. Current Agric. Food Resour. Issues. 4, 27-35
Gonzalez, S., Maldonado, J.E., Ortega, J., Talarico, A.C., Bidegaray-Batista, L., Garcia, J.E., and Duarte, J.M.B. 2009. Identifiaction of the endangered small red brocket deer (Mazama bororo) using noninvasive genetic techniques (Mammalia; Cervidae). Mol. Ecol. Resour. 9, 754-758.
Grocery Manufacturer’s Association. 2010. Consumer Product Fraud: Deterrence and Detection. Available at: http://www.gmabrands.com/publications/index.cfm.
Guo, H.Y, Wang, W.W., Yang, N., Guo, B.L., Zhang, S., Yang, R.J., Yuan, Y., Yu, J.L., Hu, S.N., Sun, Q.S., and Yu, J. 2010. DNA barcoding provides distinction between Radix Astragali and its adulterants. Sci. China Life Sci. 53, 992-999.
Guo, X., Wang, X., Su, W., Zhang, G., and Zhou, R. 2011. DNA barcodes for discriminating the medicinal plant Scutellaria baicalensis (Lamiaceae) and its adulterants. Biol. Phar. Bull. 34, 1198-1203.
Gupta, A.R., Patra, R.C., Das, D.K., Gupta, P.K., Swarup, D., and Saini, M. 2008. Sequence characterization and polymerase chain reaction-restriction fragment length polymorphism of the Mitochondrial DNA 12S rRNA gene provides a method for species identification of Indian deer. Mit. DNA. 19, 394-400.
Grewe, P.M., C.C. Krueger, C.F. Ayuadro, E. Bermingham, H.L. Kincaid, and B. May. 1993. Mitochondrial DNA variation among lake trout (Salvelinus namaycush) strains stocked into Lake Ontario. Can. J. Fish Aquat. Sci. 50, 2397-2403.
Grocery Manufacturers Association. 2010. Available online at: http://www.gmaonline.org/issues-policy/product-safety/food-and-product-safety/supply-chain-and-supplier-safety/consumer-product-fraud/
Haider, N., Nabulsi, I., and Al-Safadi, B. 2012. Identification of meat species by PCR-RFLP of the mitochondrial COI gene. Meat Sci. 90, 490-493.
Hajibabaei, M., Smith, M.A., Janzen, D.H., Rodriguez, J.J., Whitfield, J.B., Hebert, P.D.N. 2006. A minimalist barcode can identify a specimen whose DNA is degraded. Mol. Ecol. Notes. 6, 959-964.
Handy, S.M., Deeds, J.R., Ivanova, N.V., Hebert, P.D.N., Hanner, R., Ormos, A., Weigt, L.A., Moore, M., and Yancy, H.F. 2011. A single laboratory validated method for the generation of DNA barcodes for the identification of fish for regulatory compliance. J. AOAC. Int. 94, 201-210.
Hanner, R., Becker, S., Ivanova, N.V., and Steinke, D. 2011. FISH-BOL and seafood identification: Geographically dispersed case studies reveal systemic market substitution across Canada. Mit. DNA. 22, 106-122
Hanner, R., Floyd, R., Bernard, A., Collette, B.B., and Shivji, M. 2011. DNA barcoding of billfishes. Mit. DNA. 22, 27-36.

122
Harris, J.D. 2003. Can you bank on GenBank? Trends Ecol. Evol. 18, 317-319.
Hebert, P.D.N., Cywinska, A., Call, S.L., DeWaard, J.R. 2003. Biological identifications through DNA barcodes. Proc. R. Soc. of Lond. B. 270, 313-321.
Hernandez, M., Ferrando, A., Esteve, T., Salomeprat, P.P., and Pla, M. 2003. Real-time and conventional polymerase chain reaction systems based on the metallo-carboxypeptidase inhibitor gene for specific detection and quantification of potato and tomato in processed food. J. Food Protect. 66, 1063-1070.
Hernandez, M., Esteve, T., and Pla, M. 2005. Real-time polymerase chain reaction based assays for quantitative detection of barley, rice, sunflower, and wheat. J. Agric. Food Chem., 53, 7003-7009.
Hirao, T., Imai, S., Sawada, H., and Kato, H. 2006. A novel PCR method for quantification of buckwheat by using a unique internal standard material. J. Food Protect. 69, 2478-2486.
Hird, H., Chisholm, J., and Brown, J. 2005a. the detection of commercial duck species in food using a single probe-multiple species-specific primer real-time PCR assay. Eur. Food Res. Technol. 221, 559-563.
Hird, H., Goodier, R., and Hill, M. 2003a. Rapid detection of chicken and turkey in heated meat products using the polymerase chain reaction followed by amplicon visualisation with vista green. Meat Sci. 65, 1117-1123.
Hird, H., Goodier, R., Schneede, K., Boltz, C., Chisholm, J., Lloyd, J, and Popping, B. 2004. Truncation of oligonucleotide primers confers specificity on real-time polymerase chain reaction assays for food authentication. Food Addit. and Contam. 21, 1035-1040.
Hird, H.J., Hold, G.L., Chisholm, J., Reece, P., Russell, V.J., Brown, J., Goodier, R., and MacArthur, R. 2005b. Development of a method for the quantification of haddock (Melanogrammus aeglefinus) in commercial products using real-time PCR. Eur. Food Res. Technol. 220, 663-637.
Hird, H.J., Lloyd, J., Goodier, R., Brown, J., and Reece, P. 2003. Detection of peanut using real-time polymerase chain reaction. Eur. Food Res. Technol. 217, 265-268.
Hobbs, J.E. 2006. Liability and traceability in agri-food supply chains. Retrieved from http://www.springerlink.com/content/p4p5g01g286766g2/.
Huang, K.S., Lee, S.E., Yeh, Y., Shen, G.S., Mei, E. and Change, C.M. 2010. Taqman real-time quantitative PCR for identification of western flower thrip (Frankliniella occidentalis) for plan quarantine. Biol. Lett. 6, 555-557.
Hunter, S.J., Goodall, T.I., Walsh, K.A., Owen, R. and Day, J.C. 2008. Nondestructive DNA extraction from blackflies (Diptera: Simuliidae): retaining voucher specimens for DNA barcoding projects. Mol. Ecol. Resour. 8, 56-61.
Hupfer, C., Waiblinger, H.U., and Busch, U. 2007. Development and validation of a real-time PCR detection method for celery in food. Eur. Food Res.Technol. 225, 329-335.

123
Hobbs, J.E. 2004. Information Asymmetry and the Role of Traceability Systems. Agribusiness, 20, 397-415.
Ilhak, O., and Arslan, A. 2007. Identification of meat species by polymerase chain reaction (PCR) technique. Turk. J. Vet. Anim. Sci. 31, 159-163.
Itoi, S., Nakaya, M., Kaneko, G., Kondo, H., Sezaki, K., and Watabe, S. 2005. Rapid identification of eels Anguilla japonica and Anguilla anguilla by polymerase chain reaction with single nucleotide polymorphism-based specific probes. Fisheries Sci. 71, 1356-1364.
Ivanova NV, Zemlak TS, Hanner RH, Hebert PDN 2007. Universal primer cocktails for fish DNA barcoding. Mol. Ecol. Notes. 7, 544-548.
Jonker, K.M., Tilburg, J.J.H.C., Hagele, G.H., and De Boer, E. 2008. Species Identification in meat products using real-time PCR. Food Addit. Contam. Part A Chem. Anal. Control Expo. Risk Assess. 25, 527-533.
Kaakeh, W., Pfeiffer, D.G. and Marini, R.P. 1993. Effect of Aphis spiraecola and A. pomi; (Homoptera : Aphididae) on the growth of young apple trees. Crop Prot. 12, 141-147.
Kafka, J., Panke, O., Abendroth, B. and Lisdat, F. 2008. A label-free DNA sensor based on impedance spectroscopy. Electrochim. Acta. 53, 7467-7474.
Karabasanavar, N.S., Singh, S.P., Umpathi, V., Girish, P.S., Shbannavar, S.N., and Kumar, D. 2011a. Authentication of carabeef (water buffalo, Bubalus bubalus) using highly specific polymerase chain reaction. Eur. Food Res. and Technol. 233, 985-989.
Karabasanavar, N.S., Singh, S.P., and Umpathi, V. 2011b. Identification of goat meat using highly species-specific polymerase chain reaction. J. Food Qual. 34, 42-149.
Karabasanavar, N.S., Singh, S.P., Umpathi, V., Kumar, D., Patil, G., and Shebannavar, S.N. 2011c. A highly specific PCT assay for identification of raw and heat treated mutton (Ovis aries). Small Ruminant Res. 100, 153-1158.
Kesmen, Z., Sahin, F., and Yetim, H. 2007. PCR assay for the identification of animal species in cooked sausages. Meat Sci. 77, 649-653.
Kim, H., Hoelmer, K.A., Lee, W., Kwon, Y.D. and Lee, S. 2010. Molecular and Morphological Identification of the Soybean Aphid and Other Aphis Species on the Primary Host Rhamnus davurica in Asia. Ann. Entomol. Soc. Am. 103, 532-543.
Kim, W., Kim, S., Choi, H., Truong, N.D., Kim, J.H., Xiao, R., Park, K.L., Seo, K., Lee, H., Kim, B.S., Yoo, M.H., and Park, C. 2010a. Discrimination of animal species using polymorphisms of the nuclear gene zinc finger protein 238. J. Anim. Sci. Technol. 52, 91-96.
Knapp, G., Roheim, C., Anderson, J. The Great Salmon Run: Competition Between Wild and Farmed Salmon. World Wildlife Fund: Washington, DC, 2007.

124
Koppel, R., Ruf, J., Zimmerli, F., and breitenmoser, A. 2008. Multiplex real-time PCR for the detection and quantification of DNA from beef, pork, chicken, and turkey. Eur. Food Res. Technol. 227, 1199-1203.
Koppel, R., Ruf, J., and Rentsch, J. 2011. Multiplex real-time PCR for the detection and quantification of DNA from beef, pork, horse, and sheep. Eur. Food Res. Technol. 232, 151-155.
Krkoska, L., Nebola, M., Steinhauserova, I., Obroska, I., and Ernst, M. 2003. Using the PCR-RFLP method. Fleischwirtschaft Int. 2, 39-42.
Kumar, D., Singh, S.P., Singh, R., and Karabasanavar, N.S. 2011. A highly specific PCR assay for identification of goat (Capra hicus) meat. Small Ruminant Res. 97, 76-178.
Kumar, S., Kahlon, T., and Chaudhary, S. 2011. A rapid screening for adulterants in olive oil using DNA barcodes. Food Chem. 127, 1335-1341.
Lakra, W.S., Verma, M.S., Goswami, M., Lal, K.K., Mohindra, V., Punia, P., Gopalakrishnan, A., Singh, K.V., Ward, R.D., and Hebert, P. 2011. DNA barcoding Indian marine fishes. Mol. Ecol. Resour. 11, 60-71.
Laube, I., Hird, H., Brodmann, P., Ullmann, S., Schone-Michling, M., Chisholm, J., and Broll, H. 2010. Development of primer and probe sets for the detection of planet species in honey. Food Chem. 118, 979-986.
Laube, I., Spiegelberg, A., Butschke, A., Zagon, J., Schauzu, M., Kroh, L., and Broll, H. 2003. Methods for the detection of beef and pork in foods using real-time polymerase chain reaction. Int. J. Food Sci. and Technol. 38, 111-118.
Laube, I., Zagon, J., and Broll, H. 2007. Quantitative determination of commercially relevant species in foods by real-time PCR. Int. J. Food Sci. and Technol. 42, 336-341.
Lee, W., Kim, H., Lim, J., Choi, H.R., Kim, Y., Kim, Y.S., Ji, J.Y., Foottit, R.G. and Lee, S. 2011. Barcoding aphids (Hemiptera: Aphididae) of the Korean Peninsula: updating the global data set. Mol. Ecol. Resour. 11, 32-37.
Lilavanichakul, A and Boecker, A. 2013. Consumer Acceptance of a New Traceability Technology: A Discrete Choice Application to Ontario Ginseng. IFAMR. 16, 25-50.
Lisdat, F. and Schafer, D. 2008. The use of electrochemical impedance spectroscopy for biosensing. Anal. Bioanal. Chem. 391, 1555-1567.
Lockley, A.K. and Bardsley, R.G. 2000. DNA-based methods for food authentication. Trends Food Sci. Technol. 11, 67-77
Logan, C.A., Alter, S.E., Haupt, A.J., Tomalty, K., and Palumbi, S.R. 2008. An impediment to consumer choice: Overfished species are sold as Pacific red snapper. Biol. Conserv. 141, 1591-1599.

125
Lopez-Andreo, M., Lugo, L., Garrido-Pertierra, A., Prieto, M.I., and Puyet, A. 2005 Identification and quantitation of species in complex DNA mixtures by real-time polymerase chain reaction. Anal. Biochem. 339, 73-82.
Lopez-Andreo, M., Lugo, L., Garrido-Pertierra, A., and Puyet, A. 2006. Evaluation of post-polymerase chain reaction melting temperature analysis for meat species identification in mixed DNA samples. J. Agric Food Chem. 54, 7973-7978.
Lopez-Calleja, I., Gonzalez, I., Fajardo, V., Martin, I., Hernandez, P.E., Garcia, T., and Martin, R. 2007a. Quantitative detection of goats’ milk in sheep’s milk by real-time PCR. Food Control. 18, 1466-1473.
Lopez-Calleja, I., Gonzalez, I., Fajardo, V., Martin, I., Hernandez, P.E., Garcia, T., and Martin, R. 2007b. Real-time TaqMan PCR for quantitative detection of cows’ milk in ewes’ milk mixtures. Int. Dairy J. 17, 729-736.
Lopez, I., and Pardo, M.A. 2005. Application of relative quantification TaqMan real-time polymerase chain reaction technology for the idntification and quantification of Thunnus alalunga and Thunnus albacares. J. Agric. Food Chem. 53, 4554-4560.
Lopez, S.J. 2008. TaqMan based real-time PCR method for quantitative detection of basmati rice adulteration with non-basmati rice. Eur. Food Res. Technol. 227, 619-622.
Lopparelli, R.M., Cardazzo, B., Balzan, S., Giaccone, V., and Novelli, E. 2007. Real-time TaqMan polymerase chain reaction detection and quantification of cow DNA in pure water buffalo mozzarella cheese: Method validation and its application on commerical samples. J. Agric. Food Chem. 55, 3429-3434.
Lowenstein, J.H., Burger, J., Jeitner, C.W., Amato, G., Kolokotronis, S., and Gochfeld, M. 2010. DNA Barcodes reveal species-specific mercury levels in tuna sushi that pose a health risk to consumers. Biol. Lett. 6, 692-695.
Lowery, D.T., Smirle, M.J., Foottit, R.G. and Beers, E.H. 2006. Susceptibilities of apple aphid and spirea aphid collected from apple in the Pacific Northwest to selected insecticides. J. Econ. Entomol. 99, 1369-1374.
Lowery, D.T., Smirle, M.J., Foottit, R.G., Zurowski, C.L. and Peryea, E.H. 2005. Baseline susceptibilities to imidacloprid for green apple aphid and spirea aphid (Homoptera : Aphididae) collected from apple in the Pacific Northwest. J. Econ. Entomol. 98, 188-194.
Maede, D. 2006. A strategy for molecular species detection in meat and meat products by PCR-RFLP and DNA sequencing using mitochondrial and chromosomal genetic sequences. Eur. Food Res. Technol. 224, 209-217.
Macedo, T.B., Bastos, C.S., Higley, L.G., Ostlie, K.R. and Madhavan, S. 2003. Photosynthetic responses of soybean to soybean aphid (Homoptera: Aphididae) injury. J. Econ. Entomol. 96, 188-193.
Madani, M., Sabbotin, S.A. and Mocru, M. 2005. Quantitative detection of the potato cyst nematode Giobodera pallida, and the beet cyst nematode Heterodera schachtii, using real-time PCR with SYBR green I dye. Mol. Cell. Probe. 19, 81-86.

126
Mahajan, M.V., Gadekar, Y.P., Dighe, Kokane, R.D., and Bannalikar, A.S. 2011. Molecular detection of meat animal species targeting MT 12S rRNA gene. Meat Sci. 88, 23-27.
Malisa, A.L., Gwakisa, P., Balthazary, S., Wasser, S.L., and Mutayoba, B.M. 2006. The potential of Mitochondrial DNA markers and polymerase chain reaction-restriction fragment polymorphism for domestic and wild species identification. Afr. J. Biotechnol. 5, 1588-1593.
Mane, B.G., Mendiratta, S.K., Tiwari, A.K., and Bhilegaokar, K.N. 2012. Detection of the adulteration of meat and meat products with buffalo meat emplying polymerase chain reaction assay. Food Anal. Methods. 5, 296-300.
Marko, P.B., Lee, S.C., Rice, A.M., Gramling, J.M., Fitzhenry, T.M., McAlister, J.S., Harper, G.R. and Moran, A.L. 2004. Mislabelling of a depleted reef fish. Nature. 430, 309-310.
Martin, I., Garcia, T., Fajardo, V., Lopez-Calleja, I., Rojas, M., Hernandez, P.E., Gonzalez, I., and Martin, R. 2007. Mitochondrial markers for the detection of four duck species and the specific identification of Muscovy duck in meat mixtures using the polymerase chain reaction. Meat Sci. 76, 721-729.
Matsui, H., Toyota, N., Nagatori, M., Sakamoto, H. and Mizoguchi, K. 2009. Infrared spectroscopic studies on incorporating the effect of metallic ions into a M-DNA double helix. Phys. Rev. B. 79, 235201/235201-235201/235208.
Matsunaga, T., Chikuni, K., Tanabe, R., Muroya, S., Nakai, K., Shibata, K., Yamada, J., and Shinmura, Y. 1998b. Determination of mitochondrial cytochrome b gene sequence for red deer (Cervus elaphus) and the differentiation of closely related red deer meats. Meat Sci. 49, 379-385.
Matsunaga, T., Chikuni, K., Tanabe, R., Muroya, S., Shibata, K., Yamada, J., and Shinmura, Y. 1999. A quick and simple method for the identification of meat species and meat products by PCR assay. Meat Sci. 51, 143-148.
Mayer, W., and Hochegger, R. 2011. Discrimination of two alleles of the melanocortin receptor 1 gene to discern European wild boar (Sus scrofa scrofa) and domestic pig (Sus scrofa domestica) in meat products by real-time PCR. Eur. Food Res. Technol. 232, 687-692.
McCornack, B.P., Ragsdale, D.W. and Venette, R.C. 2004. Demography of soybean aphid (Homptera: Aphididae) at summer temperatures. J. Econ. Entomol. 97, 854-861.
Meyer, R., Hofelen, C., Luthy, J., and Candrian, U. 1995. Polymerase chain reaction-restriction fragment polymorphism analysis: a simple method for species identification in food. J. AOAC. Int. 78, 1542-1551.
Miller, D.D. and Marianai, S. 2010. Smoke, mirrors, and mislabeled cod: Poor transparency in the European seafood industry. Front Ecol. Env. 8, 517-521.

127
Moore, J. C., Spink, J. S. and Lippus, M. 2012. Development and Application of a Database of Food Ingredient Fraud and Economically Motivated Adulteration from 1980 to 2010. J. Food Sci. 77, R118-R226.
Montiel-Sosa, J.f., Ruiz-Pesini, E., Montoya, J., Rocales, P., Lopez-Perez, M.J., and Perez-Martos, A. 2000. Direct and highly species-specific detection of pork meat and fat in meat products by PCR amplification of Mitochondrial DNA. J. Agric. Food Chem. 48, 2829-2832.
Mueller, T. 2009. Slippery Business. New Yorker. 83, 38-45.
Murugaiah, C., Noor, Z.M., Mastakin, M., Bilung, L.M., Selamat, J., and Radu, S. 2009. Meat species identification and Halal authentication analysis using Mitochondrial DNA. Meat Sci. 83, 438-443.
Mustorp, S., Engdahl-Axelsson, C., Svensson, U., and Holck, A. 2008. Detection of celery (Apium graveolens), mustard, (Sinapis alba, Brassica juncea, Brassica nigra) and sesame (Sesamum indicum) in food by real-time PCR. Eur. Food Res. Technol. 226, 771-778.
Naaum, A.M., Foottit, R.G., Maw, H.E.L. and Hanner, R. 2012. Differentiation between Aphis pomi and Aphis spiraecola using multiplex real-time PCR based on DNA barcode sequences. J. Appl. Entomol. 136, 704-710.
Nagase, M., Yi, R., Hidaka, F., Maeta, K., Aimi, T., Yamaguchi, T., Suginaka, K., and Morinaga, T. 2010. Quantification of relative flying fish past content in the processed seafood ago-noyaki using real-time PCR. Fisheries Sci. 76, 885-892.
Nakyinsige, K., Man Y.B.C. and Sazil, A.Q. 2012. Halal authenticity issues in meat and meat products. Meat Sci. 91, 207-214.
Natonek-Wisniewska, M., and Slota, E. 2009. A mew method for species identification of poultry based on 12S-rRNA fragment polymorphism. Ann. Anim. Sci. 9, 127-132.
Newmaster, S.G., Grguric, M, Shanmughanandhan, D., Ramalingam, S. and S. Ragupathy. 2013. DNA detects contamination and substitution in North American herbal products. BMC. Med. DOI: 10.1186/10.1186/1741-7015-11-222.
Nwani, C.D., Becker, S., Braid, H.E., Ude, E.F., Okogwu, O.I., Hanner, R. 2011. DNA barcoding discriminates freshwater fishes from southeastern Nigeria and provides river system-level phylogeographic resolution within some species. Mit. DNA. 22, 43-51.
NMFS. NOAA Fisheries: Office of Science and Technology. Imports and exports of fishery products annual summary, 2009. Current Fisheries Statistics No. 2009-2, http://www.st.nmfs.noaa.gov/st1/ publications.html (accessed May 2010).
Oesch, U. and Janata, J. 1983. Electrochemical study of gold electrodes with anodic oxide films. I. Formation and reduction behavior of anodic oxides on gold. Electrochim. Acta. 28, 1237-1246.

128
Oliveira, S. C. B., Corduneanu, O. and Oliveira-Brett, A. M. 2008. In situ evaluation of heavy metal-DNA interactions using an electrochemical DNA biosensor. Bioelectrochem. 72, 53-58.
Organisation of Economic Cooperation and Development. 2008. The Economic Impact of Counterfeiting and Piracy. Available at: www.oecd.org/sti/counterfeiting
Palmieri, L., Bozza, E., and Giongo, L. 2009. Soft fruit traceability in food matrices using real-time PCR. Nutrients. 1, 316-328.
Paredes, E., Maestre, S. E., Prats, S. and Todolí, J. L. 2006. Simultaneous Determination of Carbohydrates, Carboxylic Acids, Alcohols, and Metals in Foods by High-Performance Liquid Chromatography Inductively Coupled Plasma Atomic Emission Spectrometry. Anal. Chem. 78, 6774-6782.
Pardo, M.A. and Perez-Villareal, B. 2004. Identification of commercial canned tuna species by restriction site analysis of mitochondiral DNA products obtained by nested primer PCR. Food Chem. 86, 143-150.
Park, J.K., Shin, K.H., Shin, S.C., Chung, K.Y., and Chung, E.R. 2007. Identification of meat species using species-specific PCR-RFLP fingerprint of mitochondrial 12S rRNA gene. Korean J. Food Sci. An. 27, 209-215.
Parker, R.W., Paige, K.N. and DeVries, A.L. 2002. Genetic variation among populations of the Antarctic toothfish” evolutionary insights and implications for conservation. Polar Biol. 25, 256-261.
Partis, L., Croan, D., Guo, Z., Clark, R., Coldham, T., and Murby, J. 2000. Evaluation of DNA fingerprinting method for determining the species origin of meat. Meat Sci. 54, 369-376.
Pascoal, A., Prado, M., Castro, J., Cepeda, A., and Barros-Velazquez, J. 2004. Survey of authenticity of meat species in food products subjected to different technological processes, by means of PCR-RFLP analysis. Eur. Food Res. Technol. 218, 306-312.
Pascoal, A., Prado, M., Calo, P., Cepeda, A. and Barros-Velazquez, J. 2005. Detection of bovine DNA in raw and heat-processed foodstuffs, commercial foods and specific risk materials by a novel specific polymerase chain reaction method. Eur. Food Res. Technol. 220, 444-450.
Pasqualone, A., Montemurro, C., Grinn-Gofron, A., Sonnante, G., and Blanco, A. 2007. Detection of soft wheat in semolina and durum wheat bread by analysis of DNA microsatellites. J. Agric. Food Chem. 55, 3312-3318.
Pfeiffer, I., Burger, J., and Brenig, B. 2004. Diagnositic polymorphisms in the mitochondrial cytochrome b gene allow discrimination between cattle, sheep, goat, roe buck and red deer by PCR-RFLP. Genetics. 5,30-35.
Piknova, L., Pangallo, D., and Kuchta, T. 2008. A novel real-time polymerase chain reaction (PCR) method for the detection of hazelnuts in food, Eur. Food Res. Technol. 226, 1155-1158.
129
Ragsdale, D.W., Voeftlin, D.J. and O’Neil, R.J. 2004. Soybean Aphid Biology in North America. Annal Entomol. Soc. Am. 97, 204-208.
Ragsdale, D.W., Landis, D.A., Brodeur, J., Heimpel, G.E. and Desneux, N. 2011. Ecology and management of the soybean aphid in North America. Annu. Rev. Entomol. 56, 375-399.
Rajapaksha, W.R.A.K.J., Thilakaratne, I.D.S.I.P., Chandrasiri, A.D.N., and Niroshan, T.D. 2002. Development of PCR assay for differentiation of some important wild animal mean of Sri Lanka. J. Vet. Med. B. 49, 322-324.
Rajapaksha, W.R.A.K.J., Thilakaratne, I.D.S.I.P., Chandrasiri, A.D.N., and Niroshan, T.D. 2003. Development of PCR assay for identification of buffalo meat. Asian Austral. J. Anim. 16, 1046-1048.
Ramos-Gomez, S., Lopez-Enriquez, L., Caminero, C., and Hernandez, M. 2008. Pea detection in food and feed samples by a real-time PCR method based on a specific legumin gene that allows diversity analysis. J. Agric. Food Chem. 56, 11098-11104.
Ramussen Hellberg, R.S., Naaum, A.M., Handy, S.M., Hanner, R.H, Deeds, J.R., Yancy HF and Morrissey MT. 2011. Interlaboratory Evaluation of a Real-Time Multiplex Polymerase Chain Reaction Method for Identification of Salmon and Trout Species in Commercial Products. J. Agric. Food Chem. 59, 876-884.
Rasmussen Hellberg, R. S., Morrissey, M. T., Hanner, R. H. 2010. A multiplex PCR method for the identification of commercially important salmon and trout species (Oncorhynchus and Salmo) in North America. J. Food Sci. 75, C595-C606.
Rasmussen,R. S., Morrissey,M.T., and Hebert, P.D.N. 2009. DNA barcoding of commercially important salmon and trout species (Oncorhynchus and Salmo) from North America. J. Agric. Food Chem. 57, 8379-8385.
Ratnasingham, S., andHebert P.D.N. 2007. BOLD: The Barcode of Life Data System (www.barcodinglife.org). Mol. Ecol. Notes. 7, 355-364.
Rebijeth, K.B., Asokan, R., Krishna, V., Krishna Kumar, N.K. and Ramamurthy, V.V. 2012. Development of species-specific markers and molecular differences in mitochondrial and nuclear DNA sequences of Aphis gossypii and Myzus persicae (Hemiptera: Aphididae). Fla. Entomol. 95, 674-682.
Remaudière, G. and Remaudière, M. 1997. Catalogue des Aphididae du monde/ Catalogue of the world's Aphididae. Homoptera Aphidoidea. INRA Editions. Versailles.
Rodríguez-Lázaro, D. 2013. Real-time PCR in food science: current technology and applications. Norfolk, UK: Caister Academic Press.
Rodriguez, M.A., Garcia, T., Gonzalez, I., Asensio, L., Hernandez, P.E., and Martin, R. 2004a. PCR identification of beef, sheep, goat, and pork in raw and heat-treated meat mixtures. J. Food Protect. 67, 172-177.

130
Rodriguez, M.A., Garcia, T., Gonzalez, I., Asensio, L., Hernandez, P.E., and Martin, R. 2004b. Quantitation of mule duck in goose foie gras using TaqMan real-time polymerase chain reaction. J. Agric. Food Chem. 52, 1478-1483.
Rodriguez, M.A., Garcia, T., Gonzalez, I., Hernandez, P.E., and Martin, R. 2005. TaqMan real-time PCR for the detection and quantification of pork in meat mixtures. Meat Sci. 70, 113-120.
Rojas, M., Gonsalez, I., Fajardo, V., Martin, I., Hernandez, P.E., Garcia, T., and Martin, R. (2008) Polymerase chain reaction-restriction fragment length polymorphism authentication of raw meats from game birds. J.AOAC. Int. 91, 1416-1422.
Rojas, M., Gonsalez, I., Fajardo, V., Martin, I., Hernandez, P.E., Garcia, T., and Martin, R. 2009a. Identification of raw and heat-processed meats from game bird species by polymerase chain reaction-restriction fragment length polymorphism of the mitochondrial D-loop region. Poultry Sci. 88, 669-679.
Rojas, M., Gonsalez, I., Fajardo, V., Martin, I., Hernandez, P.E., Garcia, T., and Martin, R. 2009b. Authentication of meats from quail (Coturnix coturnix), pheasant (Phasianus colchicus), partridge (Alectoris spp), and guinea fowl (Numida meleagris) using polymerase chain reaction rargeting specific sequences from the 12S rRNA gene. Food Control. 20, 896-902.
Rojas, M., Gonsalez, I., Pavon, M.A., Pegels, N., Hernandez, P.E., Garcia, T., and Martin, R. (2010a) Polymerase chain reaction assay for verifying the labeling of meat and commercial meat products from game birds targeting specidic sequences from the mitochondrial D-loop region. Poultry Sci. 89, 1021-1032.
Rojas, M., Gonsalez, I., Pavon, M.A., Pegels, N., Lago, A., Hernandez, P.E., Garcia, T., and Martin, R. 2010b. Novel TaqMan real-time polymerase chain reaction assay for verifying the authenticity of meat and commercial meat products from game birds. Food Addit. Contam. 27, 749-763.
Rojas, M., Gonsalez, I., Pavon, M.A., Pegels, N., Lago, A., Hernandez, P.E., Garcia, T., and Martin, R. 2011a. Mitochondrial and nuclear markers for the authentication of partridge meat and the specific identification of red-legged partridge meat products by polymerase chain reaction. Food Addit. Contam. 90, 211-222.
Rojas, M., Gonsalez, I., Pavon, M.A., Pegels, N., Hernandez, P.E., Garcia, T., and Martin, R. 2011b. Application of real-time PCR assay for the detection of ostrich (Struthio camelus) mislabelling in meat products from the retail market. Food Control. 22, 523-531.
Rojas, M., Gonsalez, I., Pavon, M.A., Pegels, N., Lago, A., Hernandez, P.E., Garcia, T., and Martin, R. 2011c. Development of real-time PCR assay to control illegal trade of meat from protected capercaillie species (Tetrao urogallus). Forensic Sci. Int. 210, 133-138.
Rojas, M., Gonsalez, I., Hernandez, P.E., Garcia, T., and Martin, R. 2012. Authentication of meat and commercial meat products from common pigeon (Columba

131
livia), woodpigeon (Columba palumbus) and stock pigeon (Columba oenas) using TaqMan real-time PCR assay. Food Control. 23, 369-376.
Saini, M., Das. D.K., Dhara, A., Swarup, D., Yadav, M.P., and Gupta, P.K. 2007. Charaterisation of peacock (Pavo cristatus) mitochondrial 12S rRNA sequence and its use in differentiation from closely related poultry species. Brit. Poultry Sci. 48, 162-166.
Sakalr, Q., and Abasiyanik, M.F. 2012. The development of duplex real-time PCR based on SYBR Green fluorescence for rapid identification of ruminant and poultry origins in foodstuff. Food Chem.130, 1050-1054.
Sanchez, A., Quinteiro, J., Rey-Mendez, M., Perez-Martin, R.I., and Sotelo, C.G. 2009. Identification of European hake species (Merluccius merluccius) using real-time PCR. J. Agric. Food Chem. 57, 3397-3403.
Sandberg, M., Lundberg, L., Ferm, M., and Malmheden Yman, I. 2003. Real-time PCR for the detection and discrimination of cereal contamination in gluten free foods. Eur. Food Res. Technol. 217, 344-349.
Santaclara, F.J., Espineira, M., and Vieites, J.M. (2007) Molecular detection of Xenostrobus secures and Mytillus galloprovincialis larvae in Galician coast (Spain). Marine Biotechn. 9, 722-732.
Santaclara, F.J., Espineira, M. and Vieites, J.M. 2007. Genetic Ideidntifcation of Squids (Families Ommastrephidae and Loliginidae) by PCR-RFLP and FINS methodologies. J. Agric. Food Chem. 55, 9913-9920.
Santos, B.S. and Quilang, J.P. 2011. DNA barcoding of Arius species (Siluriformes: Airriae) in Laguna de Bay, Philippines using the cytochrome C oxidase subunit I gene. J. Philipp. Agric. Sci. 94, 205-210.
Santos, C.G., Melo, V.S., Amaral, J.S., Estevinho, L., Oliveira, M.B.P.P., and Mafra, I. 2012. Identification of hare meat by species-specific marker of mitochondrial origin. Meat Sci. 90, 836-841.
Sapkota, A., Sapkota, A. R., Kucharski, M., Burke, J., McKenzie, S., Walker, P. and Lawrence, R. 2008. Aquaculture practices and potential human health risks: Current knowledge and future priorities. Env. Int. 34, 1215-1226.
Sawyer, J., Wood, C., Shanahan, D., Gout, S., and McDowell, D. (2003) Real-time PCR for quantitative meat species testing. Food Control 14, 579-583.
Scarafoni, A., Ronchi, A., and Duranti, M. (2009). A real-time PCR method for the detection of quantification of lupin flour in wheat flour-based matrices. Food Chem. 115, 1088-1093.
Scaravelli, E., Brohee, M., Marchelli, R., and van Hengel, A. 2008. Development of three real-time PCR assays to detect peanut allergen residue in processed food products. Eur. Food Res. Technol. 227, 857-869.
Schoch, C.L., Seifert, K. A., Huhndorf, S., Robert, V., Spouge, J.L., Levesque, C.A., Chen, W., and Fungal Barcoding Consortium. 2012 Nuclear ribosomal internal

132
transcribed spacer (ITS) region as a universal DNA barcode marker for Fungi. Proc. Natl. Acad. Sci. 109, 6241-6246.
Sforza, S. 2013. Food Authentication using Bioorganic Molecules. DEStech Publications, Lancaster, Pennsylvania.
Sharma, N., Thind, S.S., Girish, P.S., and Sharma, D. 2008. PCR-RFLP of 12S rRNA gene for meat speciation. J. Food Sci. Technol. 45, 353-355.
Shufran, K.A. and Puterka, G.J. DNA Barcoding to Identify All Life Stages of Holocyclic Cereal Aphids(Hemiptera: Aphididae) on Wheat and Other Poaceae. 2011. Annal. Entomol. Soc. Am. 104, 39 DOI: 10.1603/AN10129
Singer, G.A.C. and Hajibabaei M. 2009. iBarcode.org: web-based molecular biodiversity analysis. BMC. Bioinformatics. 10, S14.
Smith, I. and Furness, A. 2006. Improving traceability in food processing and distribution. Woodhead Publishing Limited. Cambridge, England.
Smith, J. S. Evaluation of analytical data. In Food Analysis, 3rd ed.; Nielsen, S. S., Ed.; Kluwer Academic/Plenum Publishers: New York, 2003; pp 51-63.
Soares, S., Amaral, J.S., Mafra, I., and Oliveira, M.B.P.P. 2010. Quantitative detection of poultry meat adulteration with pork by a duplex PCR assay. Meat Sci. 85, 531-536.
Spink, J., and Moyer, D.C. Defining the Public Health Threat of Food Fraud. J. Food Sci. 76, R157-R163.
Steinke, D., Zemlak, T.S., Boutillier, J.A., and Hebert P.D.N. 2009. DNA barcoding of Pacific Canada’s fishes. Mar. Biol. 156, 2641-2647.
Sonnante, G., Montemurro, C., Morgese, A., Sabetta, W., Blanco, A., and Pasqualone, A. 2009. DNA microsatellite region for a reliable quantification of soft wheat adulteration in durum wheat-based foodstuffs by real-time PCR. J. Agric. Food Chem. 57, 10199-10204.
Stamoulis, P., Stamatis, C., Sarafidou, T., and Mamuris, Z. 2010. Development and application of molecular markers for poultry meat identification in food chain. Food Control. 21, 1061-1065.
Stephan, O., and Vieths, S. 2004. Development of a real-time PCR and a sandwich ELISA for detection of potentially allergenic trace amounts of peanut (Arachis hypogaea) in processed foods, J. Agric. Food Chem. 52, 3754-3760.
Stirtzel, S., Andree, S., Seuss-Baum, I., and Schwagele, F. 2007. Authentification of the most common poultry species by means of PCR. Fleischwirtschaft. 87, 86-89.
Suárez-Luque, S., Mato, I., Huidobro, J. F. and Simal-Lozano, J. 2006. Rapid capillary zone electrophoresis method for the determination of metal cations in beverages. Talanta. 68, 1143-1147.
Sun, Y.L., and Lin, C.C. 2003. Establishment and application of a fluorescent polymerase chain reaction- restriction fragment length polymorphism (PCR-RFLP)

133
method for identifying porcine, caprine, and bovine meats. J. Agric. Food Chem. 51, 1771-1776.
Sui, X., Huang, Y., Ting, Y., Guo, Y., and Long, C. 2010. Molecular authentication of the ethnomedicinal plant Sabia parviflora and its adulterants by DNA barcoding technique. Planta Med. 77, 492-496.
Stoeckle, M.Y., Gamble, C.C, Kirpekar, R., Young, G., Ahmed, S., and Little, D.P. 2011. Commercial teas highlight plant DNA barcode identification successes and obstacles. Sci. Rep. doi:10.1038/srep00042.
Tanabe, S., Hase, M., Yano, T., Sat, M., Fujimura, T., and Akiyama, H. 2007. A real-time quantitative PCR detection method for pork, chicken, beef, mutton, and horseflesh in foods. Biosci. Biotechnol. Biochem. 71, 3131-3135.
Tasara, T., Schumacher, S., and Stephan, R. 2005. Conventional and real-time PCR-based approaches for molecular detection and quantitation of bovine species material in edible gelatin. J. Food Protect. 68, 2420-2426.
Terzi, V., Malnati, M., Barbanara, M., Stanca, A.M., and Faccioli, P. 2004. Development of analytical systems based on real-time PCR for Triticum species-specific detection and quantitation of bread wheat contamination in semolina and pasta. J. Cereal Sci. 38, 87-94.
Terzi, V., Infascelli, F., Tudisco, R., Russo, G., Stanca, A.M., and Faccoli, P. 2004. Quantitative detection of Secale Cereali by real-time PCR amplification. Lebensm. Wiss. u-Technol. 37, 239-246.
Tobe, S.S., and Linacre, A.M.T. 2008. A multiplex assay to identify 18 European mammal species from mixtures using the mitochondrial cytochrome b gene. Electrophoresis. 29, 340-347.
Tomlinson, J.A., Boonham, N., Hughes, K.J.D., Griffin, R.L. and Barker, I. 2005. On-site DNA extraction and real-time PCR for detection of Phytophthora ramorum in the field. Appl. Environ. Microbiol. 71, 6702-6710.
Trotta, M., Shonhuth, S., Pepe, T., Cortesi, M.L., Puyet, A., and Bautista, J.M. 2005. Multiplex PCR method for use in real-time PCR for identification of fish fillets from grouper (Epinephelus and Myceteroperca species) and common substitute species. J. Agric. Food Chem. 53, 2039-2045.
Unajak, S., Meesawat, Pa, Anyamaneeratch, K., Anuwareepong, D., Srikulnath, K, and Choowongkomon, K. 2011. Identification of species (meat and blood samples) using nested-PCR analysis of Mitochondrial DNA. Afr. J. Biotech. 10, 5670-5676.
Vautrin, S., and Zhang, D. 2007. Real-time polymerase chain reaction assay for endogenous reference gene for specific detection and quantification of common wheat-derived DNA (Triticum aestivum L.). J. AOAC. Int. 90, 794-801.
Venette, R.C. and Ragsdale, D.W. 2004. Assessing the invasion by soybean aphid (Homoptera: Aphididae): where will it end? Annal. Entomol. Soc. Am. 97, 219-226.

134
Verkaar, E.L.C., Nijman, I.J., Boutaga, K., and Lenstra, J.A. 2002. Differentiation of cattle species in beef by PCR-RFLP of mitochondrial and satellite DNA. Meat Sci. 60, 365-369.
Vigalys, R. 2003. Taxonomic misidenfication in public DNA databases. New Phytol. 160, 4-5.
Voorhees, D. V. Fisheries of the United States, 2008; National Marine Fisheries Service, Office of Science and Technology: Silver Spring, MD, 2009.
Walker, J.A., Hughes, D.A., Anders, B.A., Shewale, J., Sinha, S.K.,and Batzer, M.A. 2003. Quantitative intra-short interspersed element PCR for species-specific DNA identification. Anal. Biochem. 316, 259-269.
Walsh, K., Boonham, N., Barker, I. and Collins, D.W. 2005. Development of a sequence-specific real-time PCR to the melon thrips Thrips palmi (Thysan., Thripidae). J. Appl. Entomol. 129, 272-279.
Wang, Q., Zhang, X., Zhang, H.Y., Zhang, J., Chen, G.Q., Zhao, D.H., Ma, H.P., and Liao, W.J. 2010. Identification of 12 animal species meat by T-RFLP on the 12s rRNA gene. Meat Sci. 85, 265-269.
Weaver, K.L., Ivester, P., Chilton, J.A., Wilson, M.D., Pandey, P. and Chilton, F.L. 2008. The Content of Favorable and Unfavorable Polyunsaturated Fatty Acids Found in Commonly Eaten Fish. J. Am. Diet. Assoc.108, 1178-1185.
Wolf, C., Rentsch, J., and Hubner, P. 1999. PCR-RFLP analysis of Mitochondrial DNA: a reliable method for species identification. J. Agric. Food Chem. 47, 1350-1355.
Wong, E. and Hanner, R. 2008. DNA barcoding detects market substitution in North American seafood. Food Res. Int. 41, 828-837
Wong, L.L., Peatman, E., Lu, J., Kucuktas, H., He, S., Zhou, C., Na-nakorn, U., and Liu, Z. 2011. DNA barcoding of catfish: species authentication and phylogenetic assessment. PLOS One. 6, e17812. doi: 10.1371/journal.pone.0017812
Wu, Y., Chen, Y., Ge, Y., Wang, J., Xu, B., Huang, W., and Yuan, F. 2008. Detection of olive oil using the Evagreen real-time PCR method. Eur. Food Res. Technol. 227, 1117-1124.
Wu, Y., Zhang, H., Han, J., Wang, B., Wang, W., Ju, X., and Chen, Y. 2011. PCR-CE-SSCP applied to detect cheap oil blended in olive oil. Eur. Food Res. Technol. 233, 313-324.
Yang, H., McLaughlin, C. K., Aldaye, F. A., Hamblin, G. D., Rys, A. Z., Rouiller, I. and Sleiman, H. F. 2009. Metal-nucleic acid cages. Nat. Chem. 1, 390-396, S390/391-S390/318.
Yin, R.H., Bai, W.L., Wang, J.M., Wu, C.D., Dou, Q.L., Yin, R.L., He, J.B., and Luo, G.B. 2009. Development of an assay for rapid identification of meat from yak and cattle using polymerase chain reaction technique. Meat Sci. 83, 38-44.

135
Yu, D., Chen, Z., Zhang, R. and Yin, W. 2005. Real-time qualititative PCR for the inspection and identification of Bactrocera phillippinensis and Bactrocera occipitalis (Diptera : Tephritidae) using SYBR green assay. Raffles B. Zool. 53, 73-78.
Yusop, M.H.M., Mustafa, S., Che Man, Y.B., Omar, A.R., and Mokhtar, N.F.K. 2011. Detection of raw pork targeting porcine-specific mitochondrial cytochome b gene by molecular beacon probe real-time polymerase chain reaction. Food Anal. Methods 5, 422-429.
Zarringhabaie, G.E., Pirany, N, and Javanmard, A. 2011. Molecular traceability of the species origin of meats using multiplex PCR. Afr. J. Biotech. 10, 16461-16465.
Zeltner, D., Glomb, M.A., and Maede, D. 2009. Real-time PCR systems for the detection of the gluten-containing cereals wheat, spelt, kamut, rye, barley and oat. Eur. Food Res. Technol. 228, 321-330.
Zimmermann, S., Zehner, R., and Mebs, D. 1998. Identification of animal species in meat samples by DNA-analysis. Fleischwirtschaft 78, 530-533
Zhao, C.J., Han, G.C., Qin, Y.H., and Wu, C.H. 2005. Differentiating among horse (Equus caballus), donkey (Equus asinus) and their hybrids with combined analysis of nuclear and mitochondrial gene polymorphism. J. Anim. Breed Genet. 122, 285-288.