novel risk based assessment of pressure vessels integrity
TRANSCRIPT
Tehnički vjesnik 25, 3(2018), 803-807 803
ISSN 1330-3651 (Print), ISSN 1848-6339 (Online) https://doi.org/10.17559/TV-20170829144636 Original scientific paper
Novel Risk Based Assessment of Pressure Vessels Integrity
Tamara GOLUBOVIĆ, Aleksandar SEDMAK, Vesna SPASOJEVIĆ BRKIĆ, Snežana KIRIN, Ivan RAKONJAC
Abstract: New methodology for risk based approach to integrity assessment of pressure vessels has been introduced. Namely, the risk matrix has been defined with consequence taken as usual, whereas probability has been separated into two, emphasizing effects of human factor and material defects. Toward this end, the failure assessment diagram (FAD) has been used here as a simple engineering tool to estimate probability of the failure due to material defects. Probability of failure due to human factor has been estimated according to the survey performed (with operators and managers) in the firm where pressure vessel is located and operated. With consequence estimated according to the simple standard procedure or by using more complex procedures (API 581, RIMAP), the novel risk based structural assessment has been completed. As an example, cylindrical storage tanks for compressed air are analysed. Keywords: pressure vessel; risk based approach; structural integrity assessment; survey 1 INTRODUCTION
Pressure vessels represent critical welded constructions from the point of view of eventual failure and possible catastrophic consequences. Even though probability of failure is very low, at least based on previous experience, risk is still not negligible, having in mind consequences, as explained in [1-2]. Risk based approach is often explained by the risk matrix, Fig. 1, using the simple definition of risk (product of probability and consequence). Even in that case, there are different options, some of them recently introduced [3-8], which turned out to be efficient and useful engineering tool, especially for managers when they have to make difficult decisions. Anyhow, simple methods do not provide precise solutions generally speaking. Contrary to that, more complicated ones (e.g. API procedure, [9, 10], or its European competitor, RIMAP, [11], both based on empirical rules), provide more precise solutions, but usually require too much effort and time.
Consequence category
VL L IM H VH
Prob
abili
ty c
ateg
ory VH Medium High High Very high Very high
H Low Medium High High Very High
M Low Medium Medium High High
L Very low Low Medium Medium High
VL Verylow Very low Low Medium Medium Figure 1 Risk matrix
Therefore, here we present yet another relatively
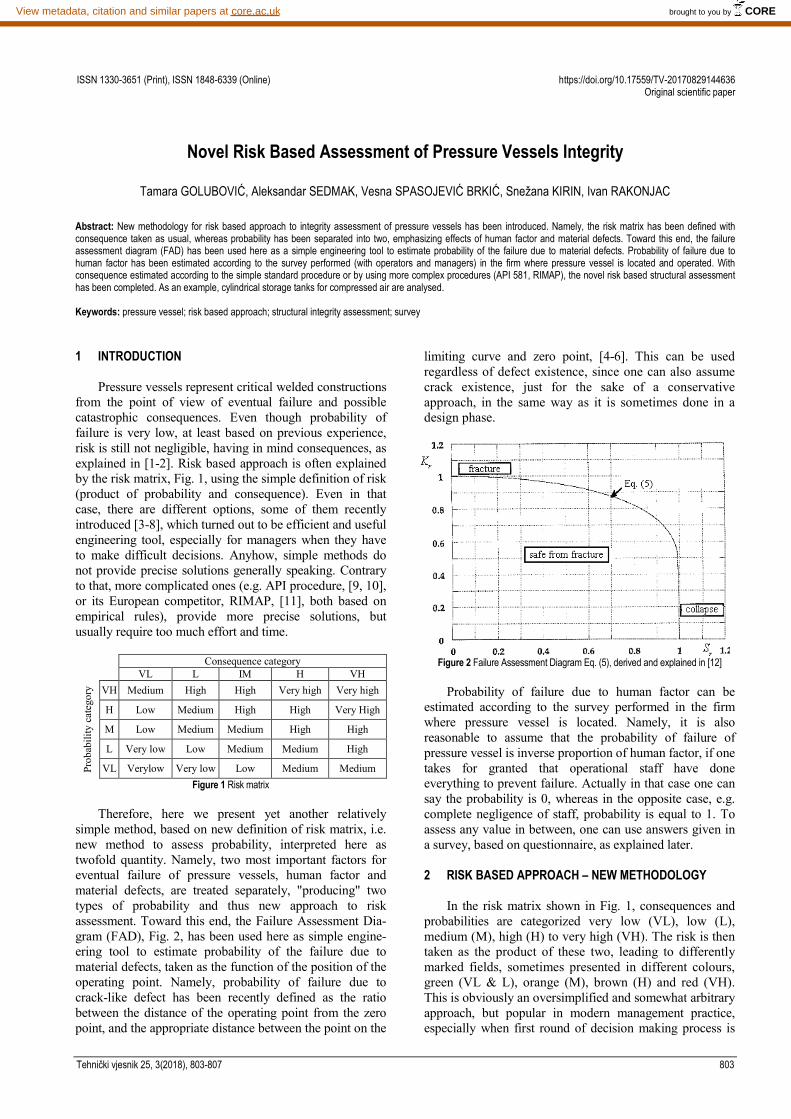
simple method, based on new definition of risk matrix, i.e. new method to assess probability, interpreted here as twofold quantity. Namely, two most important factors for eventual failure of pressure vessels, human factor and material defects, are treated separately, "producing" two types of probability and thus new approach to risk assessment. Toward this end, the Failure Assessment Dia-gram (FAD), Fig. 2, has been used here as simple engine-ering tool to estimate probability of the failure due to material defects, taken as the function of the position of the operating point. Namely, probability of failure due to crack-like defect has been recently defined as the ratio between the distance of the operating point from the zero point, and the appropriate distance between the point on the
limiting curve and zero point, [4-6]. This can be used regardless of defect existence, since one can also assume crack existence, just for the sake of a conservative approach, in the same way as it is sometimes done in a design phase.
Figure 2 Failure Assessment Diagram Eq. (5), derived and explained in [12]
Probability of failure due to human factor can be
estimated according to the survey performed in the firm where pressure vessel is located. Namely, it is also reasonable to assume that the probability of failure of pressure vessel is inverse proportion of human factor, if one takes for granted that operational staff have done everything to prevent failure. Actually in that case one can say the probability is 0, whereas in the opposite case, e.g. complete negligence of staff, probability is equal to 1. To assess any value in between, one can use answers given in a survey, based on questionnaire, as explained later. 2 RISK BASED APPROACH – NEW METHODOLOGY
In the risk matrix shown in Fig. 1, consequences and
probabilities are categorized very low (VL), low (L), medium (M), high (H) to very high (VH). The risk is then taken as the product of these two, leading to differently marked fields, sometimes presented in different colours, green (VL & L), orange (M), brown (H) and red (VH). This is obviously an oversimplified and somewhat arbitrary approach, but popular in modern management practice, especially when first round of decision making process is
brought to you by COREView metadata, citation and similar papers at core.ac.uk
Tamara GOLUBOVIĆ et al.: Novel Risk Based Assessment of Pressure Vessels Integrity
804 Technical Gazette 25, 3(2018), 803-807
going on. Anyhow, since pressure vessels failures often have very heavy consequences, including fatalities, ecology disasters and doom day scenario for a firm, this problem certainly requires more complex analysis and more precise quantification of consequence and probability.
Table 1 List of questions used in this research No Question 1 I mostly report only major problems to my superiors 2 My company does not have a precisely defined system according to
which we are informed about lessons learned during failures and accidents.
3 When taking over my shift, there is an exact procedure to which I must comply, related to obtaining of all the necessary information from the previous shift.
4 When I am working under pressure, (breaking through deadlines and suffering financial losses), managers who communicate with us are fully focused on finishing our tasks as quickly as possible and do not warn us about following safety procedures.
5 In my company, we often discuss process safety and managers ask for our opinions on the matter.
6 I am fully aware of hazards for each individual material and equipment we are working with in the company.
7 The subject of process safety is rarely discussed in meetings with the superiors.
8 When missing deadlines and facing financial losses, our following of processes and process safety procedures is affected in the following way: 1. All procedures are entirely and strictly followed regardless of the
circumstances 2. Most procedures are followed regardless of the delay, although
some smaller rules may be overlooked 3. Assessments are made about what can be skipped and what can
be finished in a safe way 4. The priority is to get the job done, while it is assumed that we will
do everything we can to follow the main procedures 5. No attention is paid to the procedures if the deadlines are
significantly missed, the only thing that is important is to finish as soon as possible.
9 Established rules about working hours and overtime are not always followed.
10 During non-routine repairs we are always informed about hazards related to such work.
11 During non-routine operations or repairs, following activities take place in our company: 1. One of the superiors supervises the work from beginning to end. 2. One of the superiors is in charge of monitoring the operation from
beginning to the end only if operation is regarded as highly risky, and if not, we just inform superiors how the repair is advancing.
3. All non-routine repairs are monitored by the superiors from beginning to the end, but they do not have to be necessarily present and check them personally.
4. We performn on-routine operations on our own, but must inform the superiors of any major steps that we undertake.
5. We perform non-routine operations on our own and are responsible for finishing them properly
12 Incidents or “near misses” that occur during maintenance are always thoroughly analyzed and we are involved in this analysis.
13 Competences that were required from us in order to get the job are being checked after a given period of time spent working in the company.
14 We sometimes perform tasks for which we are not competent. 15 We undergo regular trainings for responding in the case of
emergency (wherein we learn specific hazards related to our workplaces, how to identify them, how to act when we identify them and what kind of emergency response plan should be used in case of an accident).
16 There are frequent drills during which the cases of emergancy are simulated and all employees participate in them.
17 Whenever a process changes, or a new one is introduced, all employees undergo training about the hazards related to that process.
18 There is a defined procedure for carrying out detailed investigations after an accident or failure happens in the company.
Regarding consequence, instead of descriptive and somewhat arbitrary estimation based on several parameters (health, safety, environment, business, security), one can use technical data for a given pressure vessel (e.g. p, V, T, operating medium). In this way standard classification can be provided, from 0 to 4, naturally leading to five levels of consequence, defined in the risk matrix.
Regarding probability, as already explained, it is separated into two major affecting factors, material defects and human factor. In the case of crack-like defects there is already new, interesting concept, based on fracture mechanics approach, applied recently for large spherical storage tank [6] and cylindrical pressure vessel [8], using the FAD to assess structural integrity of a cracked component. The basic concept of FAD is to evaluate ratios between the stress intensity factor and fracture toughness (Y coordinate), which can be interpreted as the probability of brittle fracture, and between the local stress and its critical value (X coordinate), which can be interpreted as the probability of plastic collapse, Fig. 2. The point defined by these two coordinates is either in the safe or in the unsafe region, which are separated by the limit curve. Probability of failure can be estimated in the same way, as the ratio of the distance from the point to zero point and the distance from the corresponding point at the limit curve and zero point.
Finally, as already explained, probability of failure due to human factor can be estimated according to the survey, based on questionnaire given in Tab. 1. Toward this end, especially designed questionnaire has been used to perform a survey in a number of firms running pressure vessels in everyday practice. Selected questions are presented in Tab. 1, whereas the complete questionnaire is presented and analysed in [13]. 3 CASE STUDY – CYLINDRICAL PRESSURE VESSEL
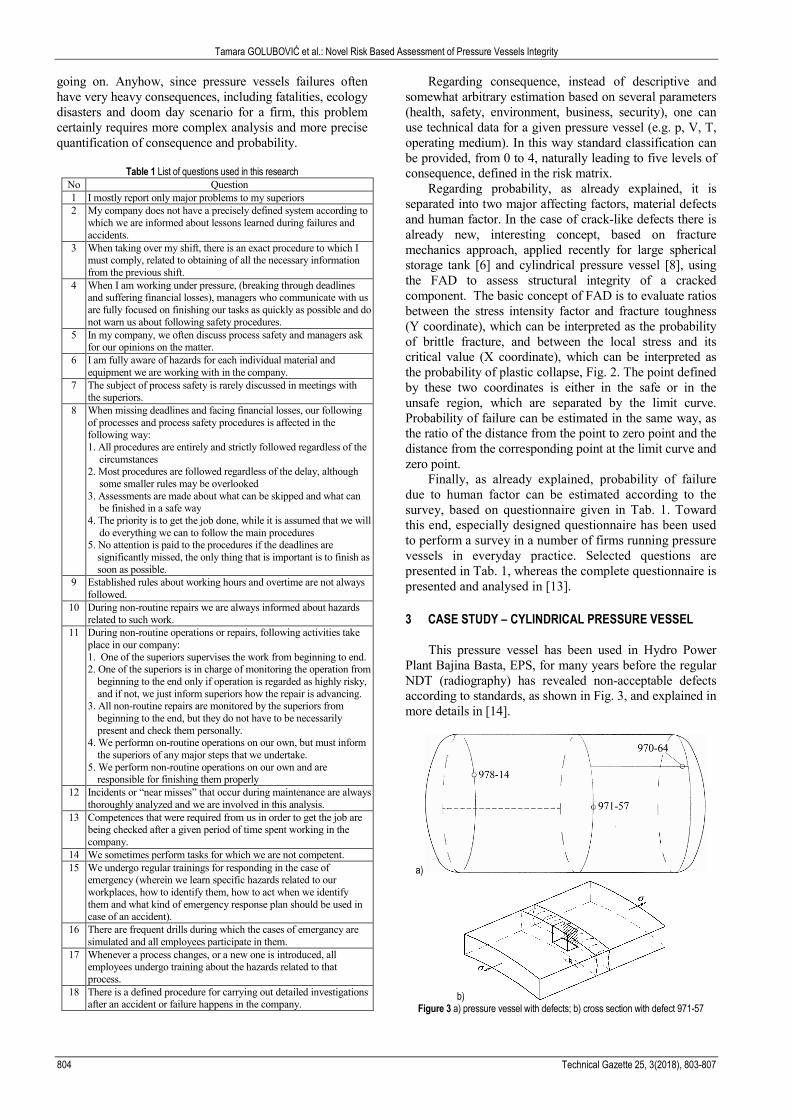
This pressure vessel has been used in Hydro Power
Plant Bajina Basta, EPS, for many years before the regular NDT (radiography) has revealed non-acceptable defects according to standards, as shown in Fig. 3, and explained in more details in [14].
a)
b) Figure 3 a) pressure vessel with defects; b) cross section with defect 971-57
Tamara GOLUBOVIĆ et al.: Novel Risk Based Assessment of Pressure Vessels Integrity
Tehnički vjesnik 25, 3(2018), 803-807 805
Consequence in this case is simple to evaluate because of the fact that eventual failure would cause catastrophic consequences, or in the best case, chaos, [15], but most probably fatalities as well. Therefore, it could be only VH consequence, even though contained medium is not harmful, i.e. toxic.
To evaluate probability due to material defects, one of three most dangerous has been picked up, namely defect 971-57, which has been identified as the lack of fusion, and is represented here as a through crack, Fig. 3b to enable conservative approach and simple 2D analysis, at the same time, using the following data: - Geometry: thickness t = 50 mm, diameter D = 2075
mm; - Material: high strength low alloyed (HSLA) steel: Reh
= 500 MPa, RM = 650 MPa; KIc= 1580 MPa√mm - Crack geometry: length 10 mm, circumferential weld
–lack of fusion; - Loading: maximum pressure p = 8.1 MPa, residual
stress σR = 175 MPa – maximum value transverse to the weld, in heat-affected-zone (HAZ). There is no data about post-weld-heat-treatment (PWHT), so the maximum possible value of residual stress, according to experience, has been applied, [14].
- Curvature effect is negligible (t/D = 50/2075 ≈ 0.025). Having this in mind, the stress intensity factor is
calculated as follows: KI = σ√πa; where σ is remote stress (σ = pR/2t + σR) = 259 MPa, a is crack half-length (5 mm): KI = (pR/2t + σR)√πa = 1026 MPa√mm, being 65% of KIc.
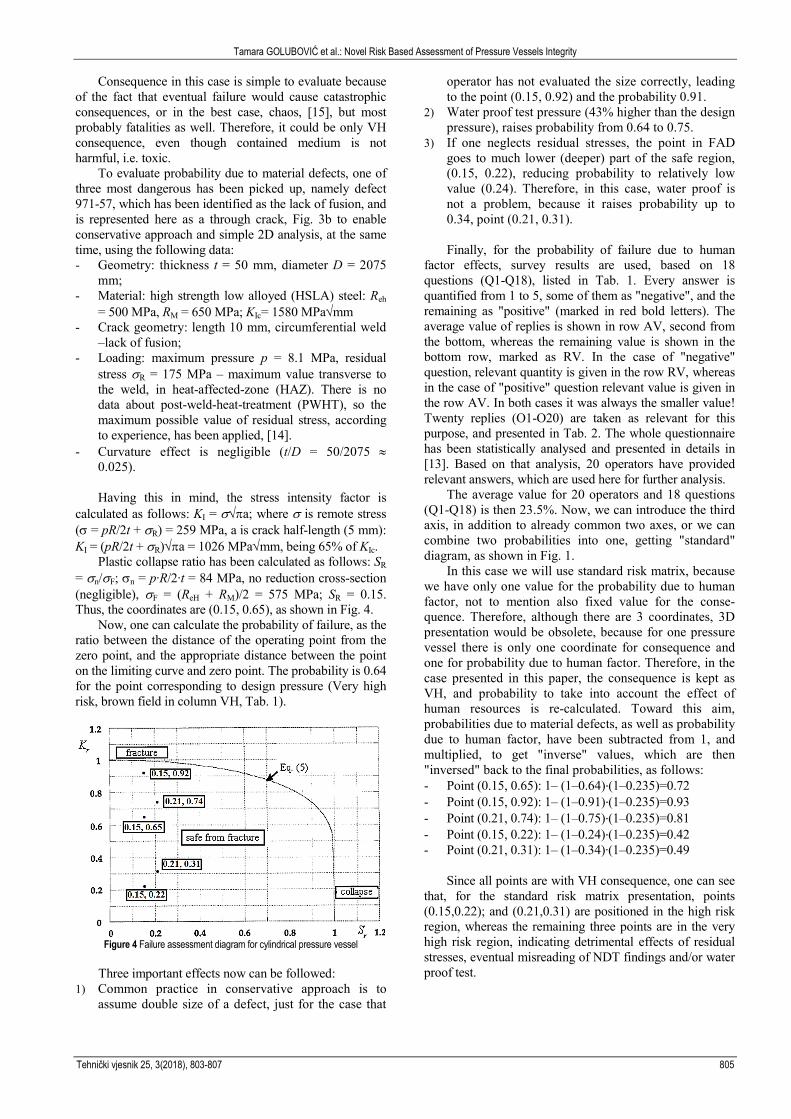
Plastic collapse ratio has been calculated as follows: SR = σn/σF; σn = p∙R/2∙t = 84 MPa, no reduction cross-section (negligible), σF = (ReH + RM)/2 = 575 MPa; SR = 0.15. Thus, the coordinates are (0.15, 0.65), as shown in Fig. 4.
Now, one can calculate the probability of failure, as the ratio between the distance of the operating point from the zero point, and the appropriate distance between the point on the limiting curve and zero point. The probability is 0.64 for the point corresponding to design pressure (Very high risk, brown field in column VH, Tab. 1).
Figure 4 Failure assessment diagram for cylindrical pressure vessel
Three important effects now can be followed:
1) Common practice in conservative approach is to assume double size of a defect, just for the case that
operator has not evaluated the size correctly, leading to the point (0.15, 0.92) and the probability 0.91.
2) Water proof test pressure (43% higher than the design pressure), raises probability from 0.64 to 0.75.
3) If one neglects residual stresses, the point in FAD goes to much lower (deeper) part of the safe region, (0.15, 0.22), reducing probability to relatively low value (0.24). Therefore, in this case, water proof is not a problem, because it raises probability up to 0.34, point (0.21, 0.31).
Finally, for the probability of failure due to human
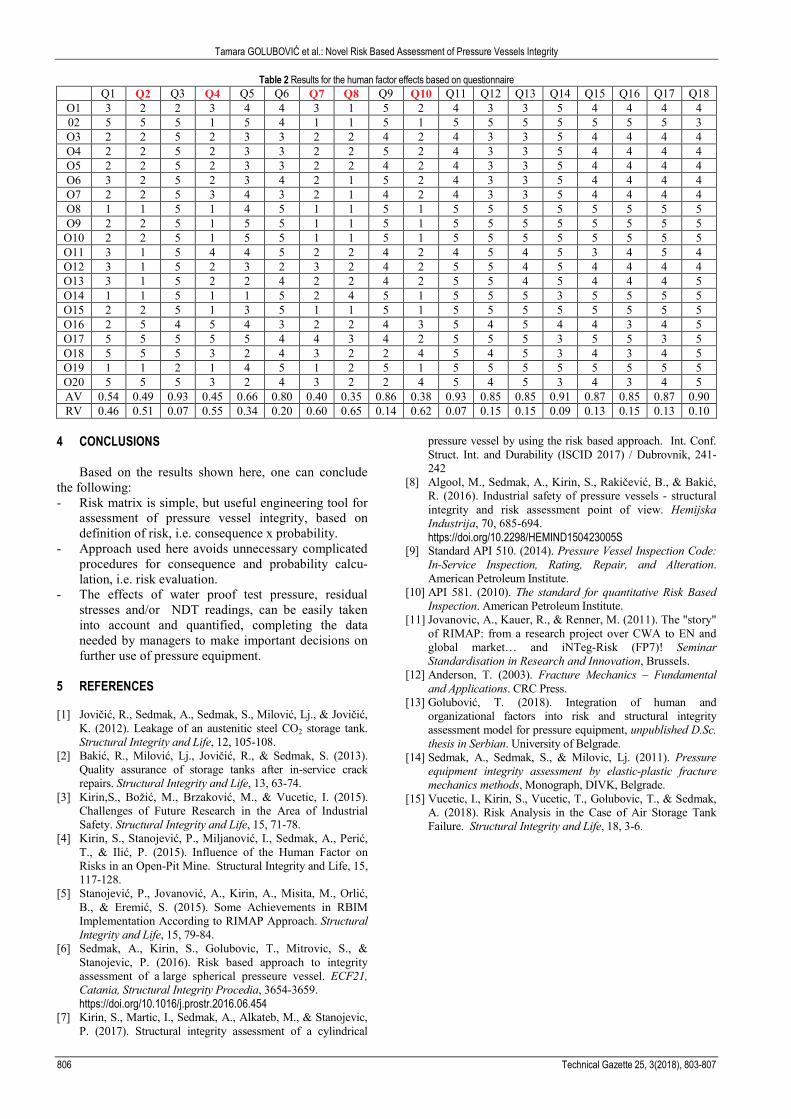
factor effects, survey results are used, based on 18 questions (Q1-Q18), listed in Tab. 1. Every answer is quantified from 1 to 5, some of them as "negative", and the remaining as "positive" (marked in red bold letters). The average value of replies is shown in row AV, second from the bottom, whereas the remaining value is shown in the bottom row, marked as RV. In the case of "negative" question, relevant quantity is given in the row RV, whereas in the case of "positive" question relevant value is given in the row AV. In both cases it was always the smaller value! Twenty replies (O1-O20) are taken as relevant for this purpose, and presented in Tab. 2. The whole questionnaire has been statistically analysed and presented in details in [13]. Based on that analysis, 20 operators have provided relevant answers, which are used here for further analysis.
The average value for 20 operators and 18 questions (Q1-Q18) is then 23.5%. Now, we can introduce the third axis, in addition to already common two axes, or we can combine two probabilities into one, getting "standard" diagram, as shown in Fig. 1.
In this case we will use standard risk matrix, because we have only one value for the probability due to human factor, not to mention also fixed value for the conse-quence. Therefore, although there are 3 coordinates, 3D presentation would be obsolete, because for one pressure vessel there is only one coordinate for consequence and one for probability due to human factor. Therefore, in the case presented in this paper, the consequence is kept as VH, and probability to take into account the effect of human resources is re-calculated. Toward this aim, probabilities due to material defects, as well as probability due to human factor, have been subtracted from 1, and multiplied, to get "inverse" values, which are then "inversed" back to the final probabilities, as follows: - Point (0.15, 0.65): 1‒ (1‒0.64)∙(1‒0.235)=0.72 - Point (0.15, 0.92): 1‒ (1‒0.91)∙(1‒0.235)=0.93 - Point (0.21, 0.74): 1‒ (1‒0.75)∙(1‒0.235)=0.81 - Point (0.15, 0.22): 1‒ (1‒0.24)∙(1‒0.235)=0.42 - Point (0.21, 0.31): 1‒ (1‒0.34)∙(1‒0.235)=0.49
Since all points are with VH consequence, one can see
that, for the standard risk matrix presentation, points (0.15,0.22); and (0.21,0.31) are positioned in the high risk region, whereas the remaining three points are in the very high risk region, indicating detrimental effects of residual stresses, eventual misreading of NDT findings and/or water proof test.
Tamara GOLUBOVIĆ et al.: Novel Risk Based Assessment of Pressure Vessels Integrity
806 Technical Gazette 25, 3(2018), 803-807
Table 2 Results for the human factor effects based on questionnaire Q1 Q2 Q3 Q4 Q5 Q6 Q7 Q8 Q9 Q10 Q11 Q12 Q13 Q14 Q15 Q16 Q17 Q18
O1 3 2 2 3 4 4 3 1 5 2 4 3 3 5 4 4 4 4 02 5 5 5 1 5 4 1 1 5 1 5 5 5 5 5 5 5 3 O3 2 2 5 2 3 3 2 2 4 2 4 3 3 5 4 4 4 4 O4 2 2 5 2 3 3 2 2 5 2 4 3 3 5 4 4 4 4 O5 2 2 5 2 3 3 2 2 4 2 4 3 3 5 4 4 4 4 O6 3 2 5 2 3 4 2 1 5 2 4 3 3 5 4 4 4 4 O7 2 2 5 3 4 3 2 1 4 2 4 3 3 5 4 4 4 4 O8 1 1 5 1 4 5 1 1 5 1 5 5 5 5 5 5 5 5 O9 2 2 5 1 5 5 1 1 5 1 5 5 5 5 5 5 5 5 O10 2 2 5 1 5 5 1 1 5 1 5 5 5 5 5 5 5 5 O11 3 1 5 4 4 5 2 2 4 2 4 5 4 5 3 4 5 4 O12 3 1 5 2 3 2 3 2 4 2 5 5 4 5 4 4 4 4 O13 3 1 5 2 2 4 2 2 4 2 5 5 4 5 4 4 4 5 O14 1 1 5 1 1 5 2 4 5 1 5 5 5 3 5 5 5 5 O15 2 2 5 1 3 5 1 1 5 1 5 5 5 5 5 5 5 5 O16 2 5 4 5 4 3 2 2 4 3 5 4 5 4 4 3 4 5 O17 5 5 5 5 5 4 4 3 4 2 5 5 5 3 5 5 3 5 O18 5 5 5 3 2 4 3 2 2 4 5 4 5 3 4 3 4 5 O19 1 1 2 1 4 5 1 2 5 1 5 5 5 5 5 5 5 5 O20 5 5 5 3 2 4 3 2 2 4 5 4 5 3 4 3 4 5 AV 0.54 0.49 0.93 0.45 0.66 0.80 0.40 0.35 0.86 0.38 0.93 0.85 0.85 0.91 0.87 0.85 0.87 0.90 RV 0.46 0.51 0.07 0.55 0.34 0.20 0.60 0.65 0.14 0.62 0.07 0.15 0.15 0.09 0.13 0.15 0.13 0.10
4 CONCLUSIONS
Based on the results shown here, one can conclude
the following: - Risk matrix is simple, but useful engineering tool for
assessment of pressure vessel integrity, based on definition of risk, i.e. consequence x probability.
- Approach used here avoids unnecessary complicated procedures for consequence and probability calcu-lation, i.e. risk evaluation.
- The effects of water proof test pressure, residual stresses and/or NDT readings, can be easily taken into account and quantified, completing the data needed by managers to make important decisions on further use of pressure equipment.
5 REFERENCES [1] Jovičić, R., Sedmak, A., Sedmak, S., Milović, Lj., & Jovičić,
K. (2012). Leakage of an austenitic steel CO2 storage tank. Structural Integrity and Life, 12, 105-108.
[2] Bakić, R., Milović, Lj., Jovičić, R., & Sedmak, S. (2013). Quality assurance of storage tanks after in-service crack repairs. Structural Integrity and Life, 13, 63-74.
[3] Kirin,S., Božić, M., Brzaković, M., & Vucetic, I. (2015). Challenges of Future Research in the Area of Industrial Safety. Structural Integrity and Life, 15, 71-78.
[4] Kirin, S., Stanojević, P., Miljanović, I., Sedmak, A., Perić, T., & Ilić, P. (2015). Influence of the Human Factor on Risks in an Open-Pit Mine. Structural Integrity and Life, 15, 117-128.
[5] Stanojević, P., Jovanović, A., Kirin, A., Misita, M., Orlić, B., & Eremić, S. (2015). Some Achievements in RBIM Implementation According to RIMAP Approach. Structural Integrity and Life, 15, 79-84.
[6] Sedmak, A., Kirin, S., Golubovic, T., Mitrovic, S., & Stanojevic, P. (2016). Risk based approach to integrity assessment of a large spherical presseure vessel. ECF21, Catania, Structural Integrity Procedia, 3654-3659. https://doi.org/10.1016/j.prostr.2016.06.454
[7] Kirin, S., Martic, I., Sedmak, A., Alkateb, M., & Stanojevic, P. (2017). Structural integrity assessment of a cylindrical
pressure vessel by using the risk based approach. Int. Conf. Struct. Int. and Durability (ISCID 2017) / Dubrovnik, 241-242
[8] Algool, M., Sedmak, A., Kirin, S., Rakičević, B., & Bakić, R. (2016). Industrial safety of pressure vessels - structural integrity and risk assessment point of view. Hemijska Industrija, 70, 685-694. https://doi.org/10.2298/HEMIND150423005S
[9] Standard API 510. (2014). Pressure Vessel Inspection Code: In-Service Inspection, Rating, Repair, and Alteration. American Petroleum Institute.
[10] API 581. (2010). The standard for quantitative Risk Based Inspection. American Petroleum Institute.
[11] Jovanovic, A., Kauer, R., & Renner, M. (2011). The "story" of RIMAP: from a research project over CWA to EN and global market… and iNTeg-Risk (FP7)! Seminar Standardisation in Research and Innovation, Brussels.
[12] Anderson, T. (2003). Fracture Mechanics – Fundamental and Applications. CRC Press.
[13] Golubović, T. (2018). Integration of human and organizational factors into risk and structural integrity assessment model for pressure equipment, unpublished D.Sc. thesis in Serbian. University of Belgrade.
[14] Sedmak, A., Sedmak, S., & Milovic, Lj. (2011). Pressure equipment integrity assessment by elastic-plastic fracture mechanics methods, Monograph, DIVK, Belgrade.
[15] Vucetic, I., Kirin, S., Vucetic, T., Golubovic, T., & Sedmak, A. (2018). Risk Analysis in the Case of Air Storage Tank Failure. Structural Integrity and Life, 18, 3-6.
Tamara GOLUBOVIĆ et al.: Novel Risk Based Assessment of Pressure Vessels Integrity
Tehnički vjesnik 25, 3(2018), 803-807 807
Contact information:
Tamara GOLUBOVIĆ, Assistant University of Belgrade, Faculty of Mechanical Engineering, Kraljice Marije 16, 11120 Belgrade, Serbia E-mail: [email protected]
Aleksandar SEDMAK, Prof. PhD University of Belgrade, Faculty of Mechanical Engineering, Kraljice Marije 16, 11120Belgrade, Serbia E-mail: [email protected]
Vesna SPASOJEVIĆ-BRKIĆ, Prof. PhD University of Belgrade, Faculty of Mechanical Engineering, Kraljice Marije 16, 11120 Belgrade, Serbia E-mail: vspasojević@mas.bg.ac.rs
Snežana KIRIN, PhD Innovation Centre of Faculty of Mechanical Engineering, Belgrade Kraljice Marije 16, 11120 Belgrade, Serbia E-mail: [email protected]
Ivan RAKONJAC, PhD EDUKONS University, Novi Sad, Faculty of Project and Innovation Management, Bože Jankovića 14, Voždovac, 11000 Belgrade, Serbia E-mail: [email protected]