novel ultrafine fe(c) precipitates strengthen
TRANSCRIPT

1
Novel Ultrafine Fe(C) Precipitates Strengthen
Transformation Induced Plasticity Steel
G. K. Tirumalasetty 1,2*, C.M. Fang2, Q. Xu2, J. Jansen2, J. Sietsma3,
M.A. van Huis4,2, H.W. Zandbergen2
1 Materials innovation institute (M2i), Mekelweg 2, 2628 CD Delft, The Netherlands
2 Kavli Institute of Nanoscience, Delft University of Technology,
Lorentzweg 1, 2628 CJ Delft, The Netherlands
3Department of Materials Science and Engineering, Delft University of Technology,
Mekelweg 2, 2628 CD Delft, The Netherlands
4Soft Condensed Matter, Debye Institute for Nanomaterials Science, Utrecht
University, Princetonplein 5, 3584 CC Utrecht, The Netherlands
*Corresponding author:
Address: Kavli Institute of Nanoscience,
Delft University of Technology,
Lorentzweg 1, 2628 CJ Delft,
The Netherlands
Email: [email protected].
Tel./ fax: +31 15 2781536 / +31 15 2786600
2
Abstract
A transmission electron microscopy (TEM) study was conducted on nanoprecipitates
formed in Ti microalloyed TRIP assisted steels, revealing the presence of Ti(N),
Ti2CS, and a novel type of ultra-fine Fe(C) precipitates. The matrix/precipitate
orientation relationships, sizes and shapes were investigated in detail. The ultrafine,
disc-shaped Fe(C) precipitates have sizes of 2-5 nm and possess a hexagonal close
packed (hcp) crystal structure with lattice parameters a = 5.73 ± 0.05 Å, c = 12.06 ±
0.05 Å. They are in a well-defined Pitsch Schrader (P-S) orientation relationship with
the basal plane of the precipitate parallel to the [110] habit plane of the surrounding
body centred cubic (BCC) ferritic matrix. Detailed analysis of precipitate distribution,
orientation relationship, lattice mismatch, and inter-particle spacing suggest that these
ultrafine precipitates contribute considerably to the strengthening of these steels.
Keywords: TRIP assisted steel, iron carbides, precipitation, and transmission electron
microscopy

3
1. Introduction
Ever increasing demands of automotive industries for steels possessing higher
strengths and enhanced ductility have led to the development of TRIP assisted steels.
The improved mechanical properties in these materials are attributed to composite
deformation of microstructural environments consisting of phases like ferrite,
austenite, bainite and martensite [1]. During deformation, the austenite grains in these
steels undergo both rotations and transformations to martensite whereby the onset of
necking is postponed, leading to improved ductility in these steels through the
TRansformation Induced Plasticity (TRIP) effect [2]. While the tensile strength of
TRIP steels is typically between 600 to 800 MPa, TRIP steels with higher tensile
strengths, in excess of 800 MPa, are becoming increasingly important for automotive
applications considering the high demands on weight reduction and safety
requirements [3].
This level of strength can be achieved by ferritic grain size refinement in combination
with dispersion strengthening. In general, microalloying is adopted for this purpose by
using elements such as Nb, V or Ti [4]. It is well known that transition metals like Nb,
V or Ti have the tendency to interact with interstitial elements such as C and N,
forming precipitates [5,6,7]. Among Nb, V and Ti, Ti is thermodynamically the first
element to precipitate during solidification. This element effectively bonds with
nitrogen and produces Ti(N) at higher temperatures [5] and it can also result in
formation of several complex Ti containing compounds in ferrite [8]. In order to
understand the precipitation sequence and to determine the possible contribution to
effective strengthening of these steels, a detailed characterization of these nanoscale
compounds is essential.
4
Therefore, the aim of present work is to carry out a thorough investigation of
precipitates formed in Ti microalloyed TRIP steel using transmission electron
microscopy (TEM) and to analyze their structural properties in relation to precipitation
hardening. As will be shown in detail below, we found various types of precipitates:
Ti(N), Ti2CS, and Fe(C), whereby the latter one to our best knowledge has not been
reported before. Below we first discuss the experimental procedure in Section 2, and
continue with optical microscopy and TEM results in Section 3. In Sections 3.2-3.5, a
detailed analysis is given of the size, shape, and crystal structures of the precipitates,
and the orientation relationships with the surrounding ferritic matrix. In Section 3.6
strengthening mechanisms are discussed and the Orowan-Ashby model is used to make
a quantitative estimate of the additional contribution of the ultrafine Fe(C) precipitates
to the strengthening.
2. Experimental Procedure
The chemical composition of the investigated Al alloyed TRIP assisted steel with Ti
micro-additions is listed in Table 1. These steels are produced on an industrial hot dip
galvanising line using a conventional intercritical annealing cycle followed by cooling
to around 400-460°C, isothermal holding it at this temperature and finally cooling it
to room temperature. The rolled TRIP steel sheets were cut into slices along the
Normal Direction (ND)-Transverse Direction (TD) plane and the microstructures of
the specimens were studied by optical microscopy (OM). The specimen preparation
for optical examination involved a stepped etching procedure as suggested by De et
al. [9]. The samples for transmission electron microscopy (TEM) were mechanically
pre-thinned along the ND-TD plane using SiC paper. Thin foils were prepared by

5
twin-jet electropolishing using a solution of 100 ml perchloric acid and 300 ml
butanol in 500 ml methanol at 20 V and a temperature of –200C. The conventional
TEM analysis was carried out using a Philips CM30T and a Philips CM200 both
operating at 200 kV. Both Selected Area Diffraction (SAD) and Nano Diffraction
(ND) were employed to study the nano-sized precipitates in this steel. High-resolution
transmission electron microscopy (HRTEM) and Energy dispersive X-ray
spectroscopy (EDX) of the samples were carried out in a FEI Tecnai F20ST/STEM
microscope with an EDAX analysis system operating at a voltage of 200 kV.
3. Results and Discussion
It has long been recognized that addition of microalloying additions can significantly
alter the ferritic grain size as well as the final microstructure. Therefore, we first
discuss briefly the general microstructure.
3.1 Light microscopic analysis of microstructures
The microstructure of investigated steels is shown in Figure 1, in which the large
brown areas represent ferrite, and the greyish blue areas represent bainite. Retained
austenite is etched white, while the martensite grains present off-white tone in the
optical micrograph [9]. The fractions of retained austenite, ferrite martensite and
bainite in Fig 1 were quantified using Image Analyser. The retained austenite
constitutes 9.5% and martensite, bainite ferrite constitute 1.2%, 19.9% and 62% while
the remaining 7.4% of the area fraction is due to the grain boundaries. It can be seen
from Figure 1 that the average ferrite grain size of this steel is about 8 mµ , which is
large in comparison with Nb alloyed TRIP steel having an average ferritic grain size
6
of 5 mµ [6]. Furthermore, the fractions of austenite are considerably higher than Nb
microalloyed TRIP steel [6].
3.2 TEM analysis
Detailed TEM analysis was performed to characterize the various precipitates found
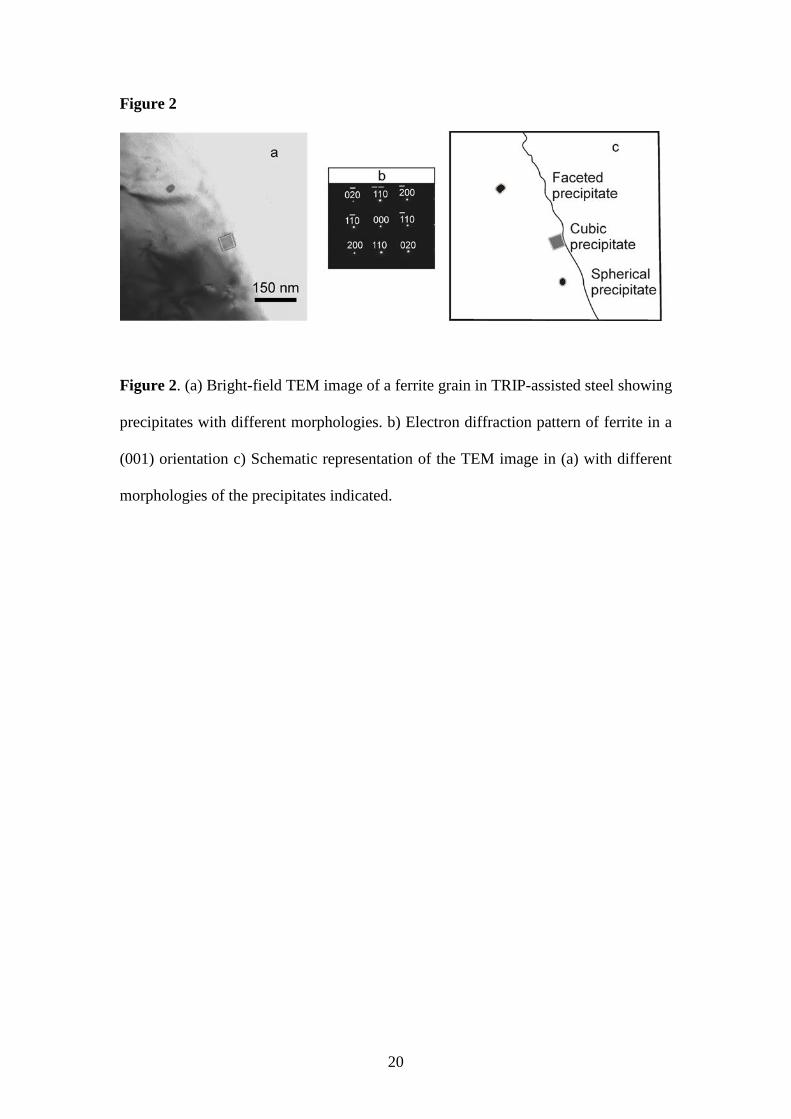
in this steel. Figure 2a shows a ferrite grain in a (001) orientation as identified by
electron diffraction in Figure 2b. The ferrite grain contains precipitates with different
sizes and morphologies: a) precipitates with cubic morphology and a size range of 70-
120 nm, b) faceted precipitates with a size range of 40-70 nm and c) spherical
precipitates with a size range of 20-100 nm as shown in the schematic representation
in Figure 2c. In addition (d), ultrafine disc shaped precipitates with a size range of 2-5
nm are also seen in Figure 2a. These four (cubic, faceted, spherical and disc) types of
precipitates (Ti(N), Ti(N), Ti2CS, and ultrafine Fe(C)) are subsequently discussed
below.
3.3 Analysis of precipitates containing Ti and N
As observed in Figure 2a there are precipitates with cubic and faceted morphologies
in the ferritic matrix. They are distributed throughout the steel and possess wide size
dispersions. EDX analysis was carried out to identify the chemical composition. From
the elemental analysis shown in Table 2 it is evident that both the cubic and faceted
precipitates contain high concentrations of Ti and N. With the EDX analysis, minor
contributions from Al, Si, Mn and Fe also appear in these precipitates since the EDX
signal in TEM comes not only from the precipitate but also from the matrix phase
surrounding the precipitate, as a large part of the sample is hit by stray electrons. In
addition, in general there is a contribution of the matrix material on top of and beneath

7
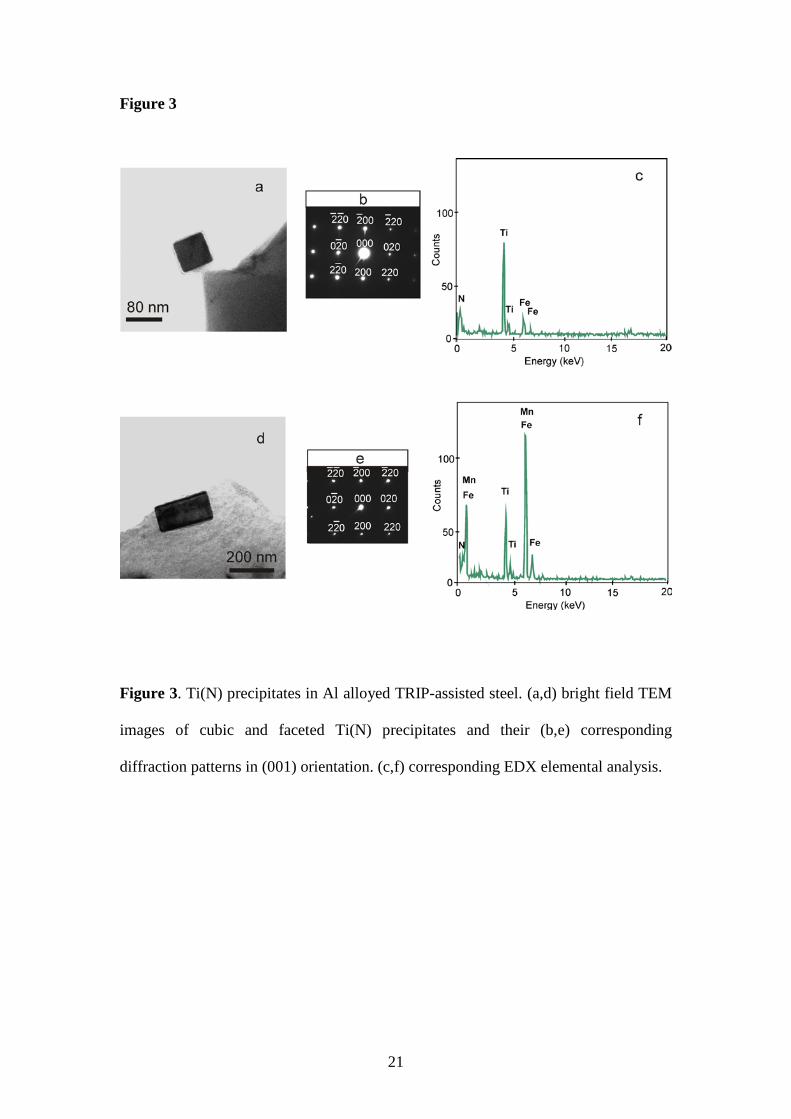
the precipitate. The cubic precipitate shown in Figure 3a is at the edge of the
electropolished area and has very little matrix on top of or beneath it, and thus the
spurious Fe signal is relatively low in comparison to that of the faceted precipitates.
Interestingly, the cubic shaped precipitates showed a higher N content than the
faceted precipitates. In order to assess the crystal structure and possible orientation
relationships with the matrix, nano diffraction was performed. Figure 3b and Figure
3d show diffraction patterns of cubic shaped precipitates and faceted shaped Ti(N)
precipitates in (100) orientations. Both these precipitates were identified to have the
face centred cubic (FCC) crystal structure. The lattice parameter of cubic precipitates
was a = 4.5 ± 0.05 Å while in case of faceted precipitates the observed lattice
parameter was a = 4.3 ± 0.05 Å. The measured lattice spacings of faceted precipitates
are very close to that of the well-known TiN crystal structure [10], whereas the cubic
shaped precipitates showed a slightly larger lattice parameter. These differences may
be caused by different N contents [11]. The Ti(N) precipitates were found in random
orientations and had no preferred orientation relationship with the surrounding ferrite
matrix.
It is well known that precipitation of TiN occurs in two temperatures regimes: during
solidification of the steel, and in supersaturated austenite after solidification. Coarse
TiN precipitates are formed at liquid iron temperatures of about 1540°C during
solidification [5]. In solidified steel, during δ-γ (austenite) transformation (around
1400°C), the coarse TiN precipitates undergo enhanced dissolution, leading to Ti
enrichment in δ-γ solid solution. At temperatures between 1400 and 1200°C,
precipitation of smaller TiN and Ti2CS precipitates takes place in supersaturated
austenite [5]. Since annealing of steels takes place at about 900-950°C and given that
both TiN and Ti2CS have higher dissolution temperatures, they are expected to pin the
8
grain boundaries, thereby limiting the recrystallization and grain growth process
during hot rolling, leading to refinement of the final ferritic grain size [12].
3.4 Analysis of precipitates containing Ti,C and S
Apart from the Ti(N) precipitates there are also spherical particles which are observed
within the ferritic matrix as observed in Figure 4. EDX analysis in Table 3 shows that
these precipitates have much higher concentrations of Ti and S than the surrounding
ferrite matrix. Ti and S concentrations of 6.93 and 1.59 at% respectively, were found
in the precipitates, while these elements could not be detected in the matrix. Analysis
of the d-spacings of the nano diffraction patterns showed that they are in good
agreement with well-known Ti2CS phase [13] having a hexagonal close packed
(HCP) structure.
3.5 Analysis of precipitates containing Fe and C
It is well established that Ti microalloying can result in precipitation of stable TiC
precipitates having a cube-on-cube Burgers relationship with the surrounding ferrite
matrix. Surprisingly, no TiC precipitates were observed in ferrite in the present study.
Instead, a new type of ultrafine precipitate was observed having a well defined
orientation relationship with the ferritic matrix. To the best of our knowledge, such
precipitates have not been reported before, and a thorough TEM investigation was
carried out on these precipitates. The Selected Area Diffraction (SAD) pattern with
ferrite in (110) projection showed Fe(C) precipitates with (0001) orientation as seen in
Figure 5a. A dark-field recording using the [ 40]22 reflection in the (0001) projection
of precipitates is shown in Figure 5b. Here, all the precipitates that have the same
orientation are visible. Furthermore, one can see in Figure 5b also the size distribution

9
of precipitates to be within a size range of 2–5 nm. The shape of the observed
precipitates in Figure 5b (in particular in the thinner sections at the edge) and the
streaking of precipitate reflections seen in the SAD pattern in Figure 5a, indicate that
these precipitates have disc shaped morphologies, which is also confirmed by the
STEM image in Figure 6 that is discussed below.
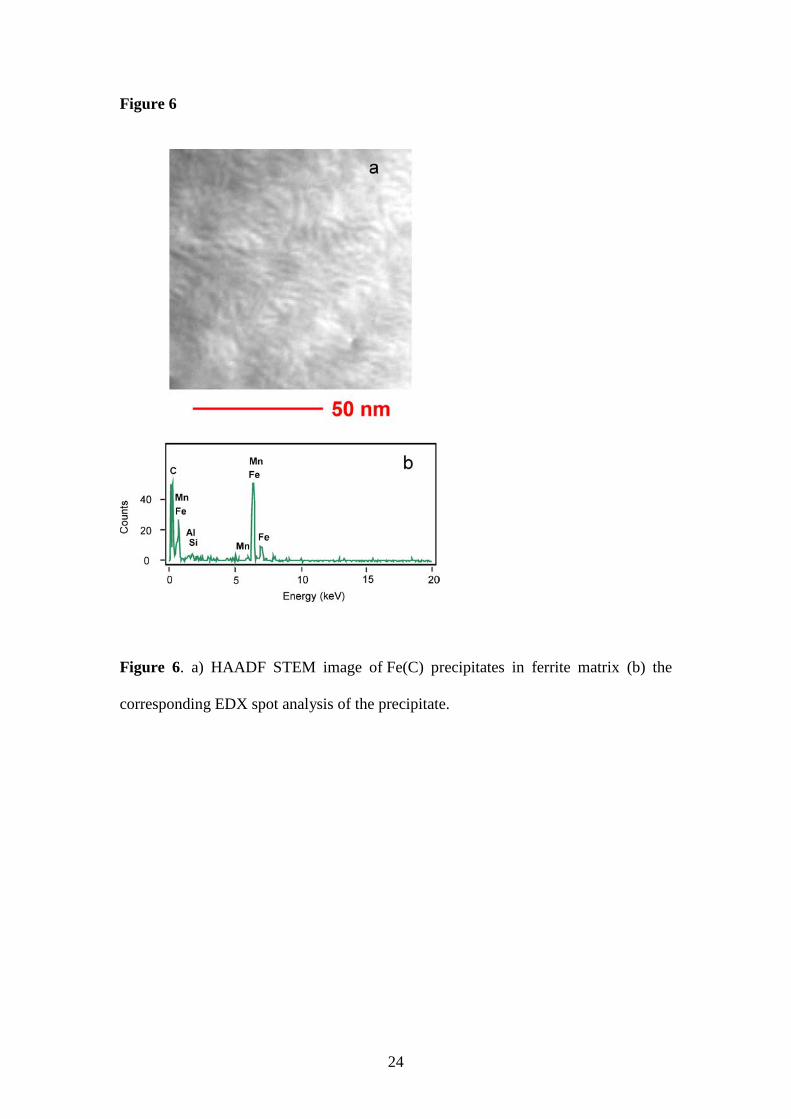
Since the precipitates are very small, Z-contrast imaging using high angle annular
dark field (HAADF) scanning transmission electron microscopy (STEM) was carried
out. In the HAADF detector, electrons are collected that are not Bragg scattered and
HAADF images show little or no diffraction effects, as their intensity is
approximately proportional to Z2. Figure 6a shows the STEM-HAADF image of the
precipitates in (0001) orientation and the neighbouring ferrite matrix aligned along the
(110) orientation. It is evident from this image that there are no significant differences
in contrast between the precipitates and the surrounding matrix. Energy Dispersive X-
ray spectroscopy (EDX) analysis was also carried out on several of these precipitates.
The corresponding EDX map in Figure 6b clearly shows higher concentrations of Fe
and C, indicating a FeX(C)Y type of precipitate.
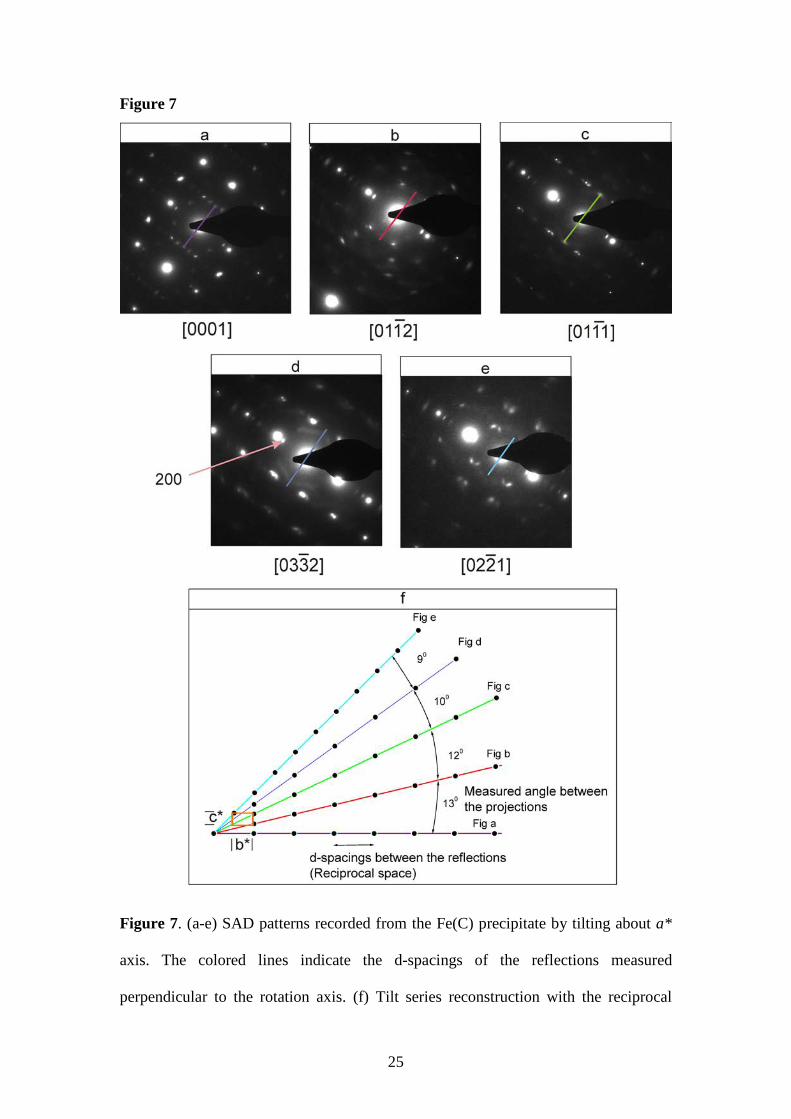
Unit cell reconstruction of precipitates was carried out using tilt series reconstruction
from selected area diffraction (SAD) patterns. The precipitate was rotated about the
a* axis and a set of diffraction patterns was recorded. A total of five diffraction
patterns were taken along this rotation axis as shown in Figures 7a-7e, allowing a
reconstruction of the unit cell. Figure 7f shows the unit cell reconstruction in
reciprocal space. It follows that these precipitates have a hexagonal lattice. The lattice
parameters of the precipitate in real space were calculated using the d spacing of α-Fe

10
(ferrite) for calibration. The unit cell parameters of the precipitate phase are a = 5.73
± 0.05 Å, b = 5.73 ± 0.05 Å, c = 12.06 ± 0.05 Å with α = 900, β = 900 and γ =1200.
Iron carbide with such a unit cell has hitherto not yet been reported (see table S1 of
the Supporting Information for a list of all iron carbides [14-22] reported in literature).
Given the size of the a-b plane and that the approximate Fe-Fe bond distances is about
2.5 Å, it is highly likely that the structure is composed of layers stacked along the c
axis whereby there are 4 Fe atoms in stacked layer. The length of the c axis indicates a
stacking of 6 Fe layers. Given the hexagonal symmetry, ABABAB and ABCABC
stacking are the most simple and most likely ones. Since the 200 reflection is strong in
all diffraction patterns like those in Figures 7a-7e, the ABCABC stacking can be
excluded.
The orientation relationship of these Fe(C) precipitates with respect to the ferritic
matrix was investigated. All the diffraction patterns with ferrite in (110) projection
show Fe(C) precipitates with (0001) orientation as seen in Figure 8. Further, the
reflections in [002] of ferrite overlap with [2 20]4 of Fe(C). Thus these Fe(C)
precipitates exhibit a definite Pitsch Schrader (P-S) orientation relationship with the
ferrite matrix:
(110) α-Fe // (0001) Fe(C) (1)
[001] α-Fe // [1 10]2 Fe(C) (2)
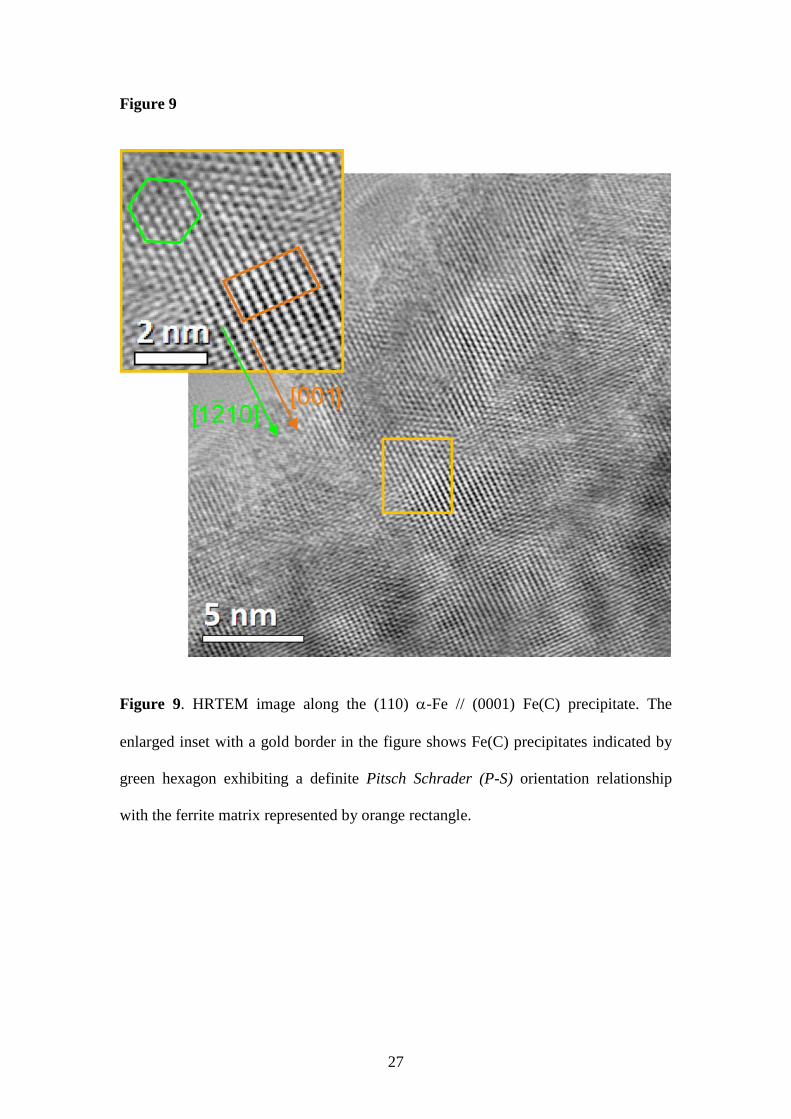
Figure 9 shows a HRTEM image with all Fe(C) precipitates oriented along the (0001)
axis when the surrounding α-Fe matrix is oriented along the (110) projection. Thus
the observed Fe(C) precipitates within this steel are found to agree with this
orientation relationship and hence can be considered as a general feature of Fe(C) /α-
Fe precipitate-matrix relationship.

11
Epsilon carbides were observed previously by Jack [23] with a similar orientation
relationship, however the unit cell parameters of the Jack carbides (in particular the c
parameter) differ substantially from the Fe(C) precipitates found in the present study.
Now the question arises as to why such a new Fe(C) precipitate is observed in this
particular steel. A comparison of the papers on precipitation of carbides from ferrite
shows that new precipitates can be formed as a result of particular heat treatments.
For instance, until 1952, it was assumed that cementite (Fe3C) was the only iron
carbide that would form directly from supersaturated ferrite [24]. This viewpoint was
supported by kinetic measurements performed by Dijkstra [25] and Wert [26] on the
precipitation of carbon from quenched iron containing about 0.02 wt. % carbon,
which gave no indication of the existence of any metastable phase prior to the
formation of cementite. In contrast with these reports, in 1952 Tsou et al. [27] used
electron diffraction to reveal the existence of ε-carbide (Fe2.4C) in iron containing
0.026 wt.% carbon. Investigations by Bosewell [28] in 1958 confirmed these
observations and showed that both carbides could be precipitated from super-saturated
solid solution in α-iron. According to Bosewell, cementite precipitates in α-iron
during aging above 200°C, whereas aging at lower temperatures will result in the
formation of ε-carbide. Although Bosewell’s observations are well established over
the years, Leslie et al.’s [29] observations showed that prolonged aging of their steels
led to precipitate diffraction patterns that are not compatible with the lattice spacings
of well known ε-carbide and cementite nor of Fe(C) precipitate reported in this paper.
From the above literature on iron carbides and our work presented here, it is expected
that the occurrence of such new carbides in this steel could be a consequence of
temperature and time of the given heat treatment.

12
3.6 Role of precipitates in strengthening of the steel
An overall objective of the steel industry is to enhance the strength of steel by
increasing the strength of the ferrite phase through precipitation hardening. It is
therefore important to understand the contribution of the above-mentioned
precipitates to effective strengthening of the steels. Table 4 summarizes the size
ranges, orientation relationship and crystal structures of precipitates found in this
steel. Both Ti(N) and Ti2CS could be very effective in pinning austenitic grain
boundaries [5,18] at elevated temperature during the hot rolling process, as explained
above in Section 3.3. On the one hand this could result in reducing the ferritic grain
size (grain refinement strengthening), leading to enhancement of yield strength and
toughness. On the other hand, the Fe(C) precipitate, which has the highest number
density per unit volume and a small or anisotropic lattice mismatch, is expected to act
as an obstacle to dislocation movement, raising the overall strength of the steel. There
are two well-known mechanisms by which the precipitates can retard the motion of
dislocations. The precipitates may be cut by the dislocations, or the precipitates resist
cutting so that the dislocations are forced to bypass them through the so-called
Orowan mechanism [30]. The mechanism that requires the least energy will be the
relevant one for obstructing the dislocation motion. Considering that iron carbides are
generally hard and thus resist cutting [31], the Orowan mechanism is most likely the
dominant mechanism.
In that case, the contributions of Fe(C) precipitates towards strengthening can be
predicted using Orowan-Ashby model as presented by Gladman [32]:
10.8 ln(1630 )pf d
dσ = (3)

13
where σp represents the precipitation strengthening increment in MPa, f is the volume
fraction of precipitate, and d is the mean particle diameter in μm.
This model has been shown previously to give very reasonable quantitative estimation
for the precipitation strengthening potential of nano sized carbonitride particles in
microalloyed steels [33,34]. From Figure 5b, it can be seen in that Fe(C) precipitates
(in particular at the edge of the specimen) have an average diameter of 3×10⁻³ μm and
an approximate thickness of 1×10⁻³ μm. From these numbers, an average volume of
the disc-shaped precipitates can be calculated. The volumetric precipitate fraction can
then be estimated as follows. Within a circular area having a diameter of 20×10−3 μm
as indicated in Figure 5b, approximately 40 Fe(C) precipitates are counted. Estimating
the thickness of the TEM sample at about 200×10−3 μm, it follows that the volumetric
fraction is 45×10−4. This results in a contribution of 383 MPa to strengthening of
ferrite according to the above model. Since the steel has 62% area fraction of ferrite
according to the image analyser/ light microscopic observations as discussed in
section 3.1, the precipitates could result in a potential contribution of 237 MPa to
strengthening of this steel.
Additionally, from the experimentally determined lattice parameter of Fe(C) the
lattice mismatch was calculated in three mutually perpendicular directions as shown
in Table 5. Here the lattice mismatch is calculated with ferrite (α-Fe) as a reference,
η=|(dFe(C) −dα-Fe)/dα-Fe |. In two directions, [001]α-Fe // [1 10]2 Fe(C) and [ 10]1 α-
Fe // [0001] Fe(C), there is a good fit with a very small lattice mismatch (0.0 ±
1.1%). The lattice mismatch along the third direction is 22.3%, suggesting that there
is considerable strain in one direction, and little strain in the other two directions, i.e.

14
the precipitates are semi-coherent. A comparison was made with iron carbides that
were observed previously in ferrite, i.e. Fe3C and Fe2.4C, with the orientation
relationships suggested in the literature [29, 35]. From Table 5 it is clear that the
observed Fe(C) precipitates are more likely to effectively strengthen steels than the
well-known Fe3C and Fe2.4C phases. Furthermore, it is well known that slip occurs
along {110}, {112} and {123} planes in ferrite. Hence, from the above P-S
relationship, it is expected that dislocations of (110) type can effectively be pinned by
Fe(C) precipitates resulting in enhanced strengthening of these steels. The above
results are undoubtedly of great importance in tailoring the TRIP steels for optimizing
mechanical properties. Further, a significant number of ferrite-based steels can
strongly benefit from these results.
4. Conclusions
In this work we have investigated nano-sized precipitates in Ti microalloyed
multiphase steel. Two types of Ti(N) precipitates were observed with cubic and
faceted morphologies. The faceted precipitates were found in the size range 40-70 nm
and the cubic precipitates were found in the size range of 70-120 nm. The cubic
precipitates were found with higher nitrogen concentrations and exhibited slightly
larger lattice parameters than the faceted TiN precipiates. Additionally, spherical
shaped Ti2CS precipitates were found with sizes ranging from 20 to 100 nm. Both the
cubic and faceted Ti(N) precipitates and Ti2CS precipitates were found in random
orientations with the neighbouring ferrite matrix. A novel iron carbide precipitate was
observed in all ferrite grains. The Fe(C) precipitates have sizes ranging from 2 to 5
nm and exhibited disc shaped morphologies. All the Fe(C) precipitates showed a well-
defined Pitsch Schrader (P-S) orientation relationship with the neighbouring ferrite

15
matrix. From the precipitate size, inter-particle spacing and lattice misfit calculations
the newly observed Fe(C) precipitates are seen to possess significant potential in
enhancing the strength of these steels.
Acknowledgements
This research was carried out under project number MC5.06280a in the framework of
the Research Program of the Materials innovation institute M2i (www.m2i.nl). The
authors would like to thank V. Svechnikov for the TEM sample preparation and E.
Peekstok for his help with light microscopic examination, M. Neklyudova for
HRTEM analysis, and Dr. D.N. Hanlon (Tata Steel RDT) for providing the material
for this study and for fruitful discussions.
References
[1] Bhadeshia HKDH. ISIJ Int 2002; 42(9): 1059–1060.
[2] Tirumalasetty GK, van Huis MA, Kwakernaak C, Sietsma J, Sloof WG,
Zandbergen HW. Acta Mater 2012; 60: 1311–1321.
[3] Sakuma Y. Proc. of Int. Conf. on Advanced High Strength Sheet Steels for
Automotive Applications, CO, Association for Iron & Steel Technology, 2004, p.
11–18.
[4] Honeycombe RWK. Met and Mat Trans A 1976; 7A: 915.
[5] Soto R, Saikaly W, Bano X, Issartel C, Rigaut G, Chara A. Acta Mater 1999; 47( 12):
3475-81.
[6] Tirumalasetty GK, van Huis MA, Fang CM, Xu Q, Tichelaar FD, Hanlon DN,
Sietsma J, Zandbergen HW. Acta Mater 2011; 59: 7406–7415.
[7] Dunlop GL, Carlsson CJ, Frimodig G. Met Trans A 1978; 9 (2): 261-266.
[8] Craven AJ, He K, Garvie LAJ, Baker TN. Acta Mater 2000; 48: 3857–3868.
[9] De AK, Speer JG, Matlock DK. Adv. Mater Proc 2003; 161: 27–30.
[10] Aigner K, Lengauer W, Rafaja D, Ettmayer P. J Alloys Compd 1994; 215: 121.
16
[11] Kim W, Park JS, Suh CY, Cho SW, Lee S, Sohn IJ. Mater. Trans 2009; 50: 2897–
2899.
[12] Saikaly W, Bano X, Issartel C, Rigaut G, Charrin L, Charai A. Met and Mat
Trans A 2001; 32 (8): 1939-1948.
[13] Kulkarni SR, Selva Vennila R, Phatak NA, Sexena SK, Zha CS, Raghy TEl,
Barsoum MW, Luo W, Ahuja R. J Alloys Compu 2008; 448: L1.
[14] Fasiska EJ and Jeffrey GA. Acta Crystal 1965; 19: 463-471.
[15] Hirotsu Y and Nagakura S. Acta Metall 1972; 20, 645-655.
[16] Lv ZQ, Sun SH,Jiang P, Wang, BZ, Fu WT. Comp Mater Sc 2008; 42: 692-697.
[17] Herbstein EH and Snyman JA. Inorganic Chem 1964; 3: 894-896.
[18] Fang CM, van Huis MA, Zandbergen HW. Phys Rev B 2009; 90: 224108.
[19] Retief JJ. Powd Diff 1999; 14: 130-132.
[20] du Plessis HE, de Villiers JPR, Kruger GJ, Steuwer A, Brunelli M. J of Synchr
Rad 2011; 18: 266-271.
[21] Fang CM, van Huis MA, Sluiter MHF, Zandbergen HW. Acta Mater 2010; 58:
2968-2977.
[22] Nagakura S and Toyoshima M. Trans of the Jap Inst of Met 1979; 20: 100-110.
[23] Jack KH. J Iron Steel Inst 1951; 170: 248-55.
[24] Roberts CS, Averback BL, Cohen M. Trans Amer Soc Met 1953; 45: 576.
[25] Dijkstra LJ. J Metals 1949; 1: 252.
[26] Wert CA. J Appl. Phys 1949; 20: 943.
[27] Tsou A, Nutting J, Menter JW. J Iron Steel Inst 1952; 172: 163.
[28] Boswell FWC. Acta Cryst Camb 1958; 11: 51.
[29] Leslie WC, Fisher RM, Sen N. Acta Metall 1959; 7 (9): 632-644.
[30] Dieter GE, Mechanical Metallurgy, third ed., New York: McGraw-Hill; 1988.
[31] Taran YuN and Novik VI. Met Sci and Heat Treatment 1971; 13 (10): 818-820.
[32] Gladman T. The Physical Metallurgy of Microalloyed Steels, The Institute of
Materials. London; 1997.
[33] Gladman T, Holmes B, McIvor ID. Iron and Steel Institute. London; 1971: 68.
[34] Sobral MDC, Mei PR, Kestenbach HJ. J Nanoscience and Nanotechnology
2010; 10 (2): 1235-1240.
[35] Bagaryatski YA. Dokl Akad Nauk SSSR 1950; 73: 1161.

17
Tables
Table 1: Chemical composition (wt. %) of Al alloyed TRIP-assisted steel with Ti
micro addition.
Table 2: EDX analysis of the TiN precipitates with cubic and faceted morphologies.
A. Cubic Ti(N) Precipitate Element wt. % wt% error at. %
N 29.94 2.03 59.92 Ti 58.98 1.49 34.51 Fe 11.07 0.73 5.56
Total 100.00 - 100.0 B. Faceted Ti(N) precipitate
Element wt. % wt% error at. % N 4.92 1.62 16.61 Ti 20.63 0.59 20.36 Fe 74.44 1.19 63.02
Total 100.00 - 100.0
Table 3: EDX analysis of the Ti2CS precipitate and the ferrite matrix next to the
precipitate
C Mn Si Al Cr Ti V P S N
0.187 1.620 0.350 0.917 0.020 0.009 0.003 0.087 0.003 <0.0001
A. Precipitate Element wt. % wt% error at. %
C 20.12 2.2 53.05 S 1.61 0.38 1.59 Ti 10.48 0.69 6.93 Fe 67.79 1.98 38.44
Total 100.00 - 100.0 B. Ferrite matrix
Element wt. % wt% error at. % C 3.35 1.15 13.68 Al 1.41 0.31 2.56 Mn 1.39 0.36 1.24 Fe 93.85 1.21 82.52
Total 100.00 - 100.0

18
Table 4: Summary of precipitates observed in Al alloyed TRIP-assisted steel.
Observed precipitates
Morphology Size ranges (nm)
Crystal structure
Lattice parameters
(Å)
Orientation Relationship with Ferrite
Ti(N) Cubic 70-120 FCC a = 4.5 ± 0.05 No
Ti(N) Faceted 40-70 FCC a = 4.3 ± 0.05 No
Ti2CS Spherical 20-100 HCP a = 3.2 ± 0.05 c = 11.2 ± 0.05
No
Fe(C) Disc 2-5 HCP a = 5.73 ± 0.05 c = 12.06 ± 0.05
Yes
Table 5: Experimentally obtained lattice parameters and calculated lattice mismatch
in between values for α-Fe and Fe(C), Fe3C, Fe2.4C precipitates.
Lattice parameter Fe(C) (HCP) a = b = 5.73 ± 0.05 Å
c = 12.06 ± 0.05 Å
θ-Fe3C (Orthorhombic) a = 5.10 Å
b = 6.77 Å
c = 4.54 Å
ε-Fe2.4C (HCP) a = b = 4.76 Å
c = 4.35 Å
α-Fe (BCC) a = 2.86 Å
Lattice mismatch [001]α-Fe // [1 10]2 Fe(C) η = 0.0 %
[ 10]1 α-Fe // [10 0]1 Fe(C) η = 22.3 %
[ 10]1 α-Fe // [0001] Fe(C) η = 0.0 %
[0 1]1 α-Fe // [100] Fe3C η = 20.61%
[211]α-Fe // [001] Fe3C η = 3 %
[011]α-Fe // [0001] Fe2.4C η = 6.37 %
[ 01]1 α-Fe // [10 1]1 Fe2.4C η = 3.3 %

19
Figures
Figure 1
Figure 1. Optical microstructure of Al alloyed TRIP-assisted steel with Ti micro
addition.
20
Figure 2
Figure 2. (a) Bright-field TEM image of a ferrite grain in TRIP-assisted steel showing
precipitates with different morphologies. b) Electron diffraction pattern of ferrite in a
(001) orientation c) Schematic representation of the TEM image in (a) with different
morphologies of the precipitates indicated.
21
002
Figure 3
Figure 3. Ti(N) precipitates in Al alloyed TRIP-assisted steel. (a,d) bright field TEM
images of cubic and faceted Ti(N) precipitates and their (b,e) corresponding
diffraction patterns in (001) orientation. (c,f) corresponding EDX elemental analysis.

22
Figure 4
Figure 4. Ti(C,S) precipitate in Al alloyed TRIP-assisted steel a) bright field TEM
image showing spherical shaped Ti(C,S) precipitate and its b) corresponding
diffraction pattern in (0111) orientation.

23
Figure 5
Figure 5. Fe(C) precipitates in Al alloyed TRIP-assisted steel a) SAD pattern where
the white circle indicates the [2240] reflection of Fe(C). b) Corresponding Dark
field image showing the size distribution of Fe(C) precipitates in ferrite using the
[2240] reflection of Fe(C). The pink circle in the image is used for the estimating
the volume fraction of the Fe(C) precipitates.
24
Figure 6
Figure 6. a) HAADF STEM image of Fe(C) precipitates in ferrite matrix (b) the
corresponding EDX spot analysis of the precipitate.
25
Figure 7
Figure 7. (a-e) SAD patterns recorded from the Fe(C) precipitate by tilting about a*
axis. The colored lines indicate the d-spacings of the reflections measured
perpendicular to the rotation axis. (f) Tilt series reconstruction with the reciprocal

26
lattice points from the series of SAD patterns in figures (a-e) and with the angles
between the projections. The cuboid shows the unit cell of the precipitate in reciprocal
space. Figure d showing 200 reflection of Fe(C) precipitate.
Figure 8
Figure 8. Fe(C) precipitates in Al alloyed TRIP-assisted steel exhibiting a definite
Pitsch Schrader (P-S) orientation relationship with the surrounding ferrite matrix. The
Fe(C) precipitate (green) is in a (0001) projection while α-Fe (orange) is in a (110)
projection. The additional reflections seen in diffraction pattern are due to the
multiple scattering of the electron beam.
27
Figure 9
Figure 9. HRTEM image along the (110) α-Fe // (0001) Fe(C) precipitate. The
enlarged inset with a gold border in the figure shows Fe(C) precipitates indicated by
green hexagon exhibiting a definite Pitsch Schrader (P-S) orientation relationship
with the ferrite matrix represented by orange rectangle.

28
- Supporting Information -
Novel Ultrafine Fe(C) Precipitates Strengthen
Transformation Induced Plasticity Steel
G. K. Tirumalasetty, C.M. Fang, Q. Xu, J. Jansen, J. Sietsma,
M.A. van Huis, H.W. Zandbergen
Table S1: List of known phases and structures of FeXCY.
Phase Space Group
Space Group
Number
Lattice Parameter
a (Å)
Lattice Parameter
b (Å)
Lattice Parameter
c (Å) α( o ) β( o )
γ( o )
θ-Fe3C [14] Pnma 62 5.10 6.77 4.54 90 90 90 η-Fe2C [15] Pnnm 58 4.70 4.31 2.83 90 90 90 ε-Fe2C [16] P63mmc 194 2.99 2.99 4.62 90 90 120 h-Fe7C3 [17] P63mc 186 6.88 6.88 4.54 90 90 120 ο-Fe7C3 [18] Pmcn 62 6.85 11.73 4.51 90 90 90 χ-Fe5C2 [19] C12/c1 15 11.58 4.57 5.05 90 97.74 90 χ-Fe5C2 [20] P1 15 11.56 4.57 5.06 89.99 97.75 90.19 γ-Fe23C6 [21] Fm-3m 225 10.46 10.46 10.46 90 90 90 Fe4C0.63[22] Pmna 53 4.01 4.01 36.67 90 90 90