november 6, 20091 a perspective on the wisconsin economy: past, present, and future this...
TRANSCRIPT
November 6, 2009 1
A Perspective on the Wisconsin Economy:
Past, Present, and Future
This presentation is based on information supplied by the U.S. Bureau Of the Census, U.S. Bureau of Labor Statistics, U.S. Bureau of Economic Analysis, Federal Housing Finance Authority, Federal Reserve Board of Governors, Federal Reserve Bank of Philadelphia, Federal Reserve Bank of New York,
Wisconsin Department of Workforce Development, various divisions of the Wisconsin Department of Revenue. National forecasts are provided by Global Insight, Inc.
Wisconsin Economics Association
November 6, 2009
November 6, 2009 2
About Us• Who We Are
– Division of Research and Policy Analysis consists of 12 professionals: economists, information technology professionals, and policy analysts
• What We Do– Analyze the State and National Economy
• Wisconsin is one of only seven states with a dedicated econometric model to forecast – Results are published quarterly– Metropolitan forecasts annually
• Prepare specialized reports of interest on the state’s economy
– Estimate the State’s General Fund Revenues
– Prepare background analysis on state taxes and local finance
– Cost and analyze state and local tax proposals• Over 300 separate legislative bills • Nearly 75 budget proposals• Many more proposals that survive the “what-if” stage
• Find Our Reports Here– http://www.revenue.wi.gov/report/e.html#economy
November 6, 2009 3
Today’s Discussion
1) The Bad News: The financial crisis brought the US economy to near collapse.
2) The Good News: Recovery is underway.
3) The Bad News: The drop was so deep that full recovery will take years.
4) The Good News: Wisconsin will match or exceed US growth in 2010.
5) Wisconsin fares better than some critics realize.
The US Was In the Midst of a Long Hard Recession
That Was Then…
November 6, 2009 5
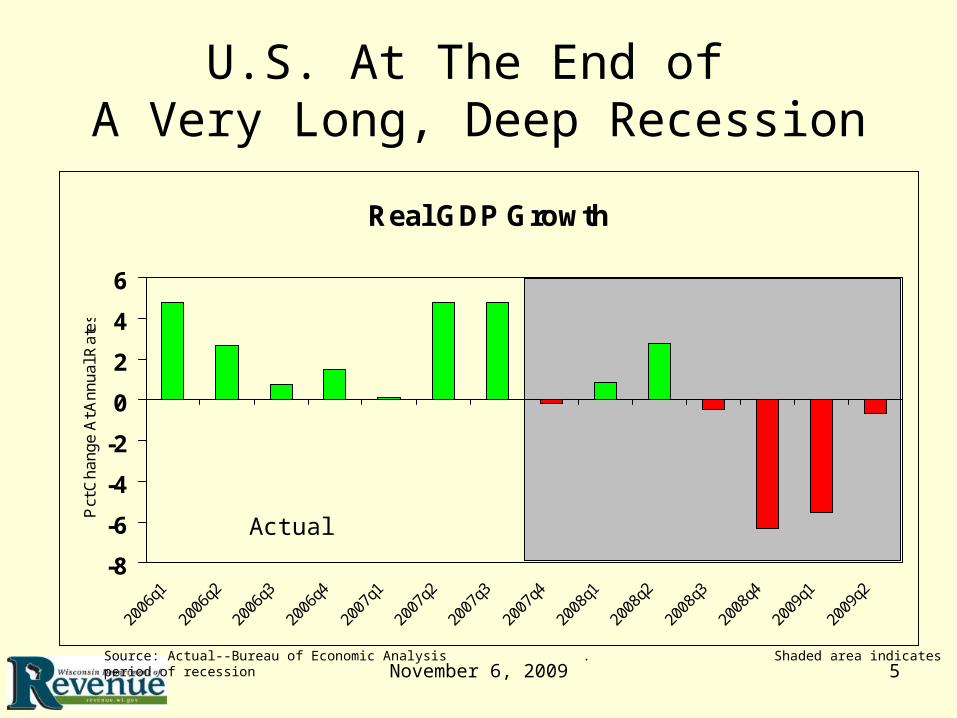
Real GDP Growth
-8
-6
-4
-2
0
2
4
6
2006
q1
2006
q2
2006
q3
2006
q4
2007
q1
2007
q2
2007
q3
2007
q4
2008
q1
2008
q2
2008
q3
2008
q4
2009
q1
2009
q2
Pct
Ch
an
ge
At A
nn
ua
l Ra
tes
U.S. At The End of A Very Long, Deep Recession
Source: Actual--Bureau of Economic Analysis . Shaded area indicates period of recession
Actual
November 6, 2009 6
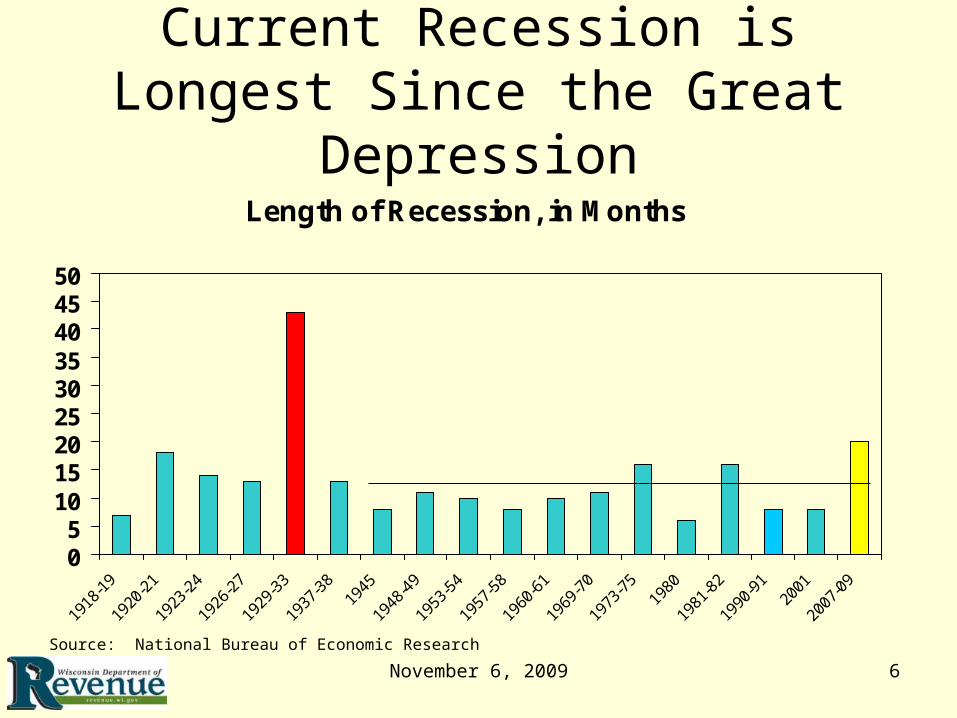
Current Recession is Longest Since the Great Depression
Length of Recession, in Months
05
101520253035404550
1918
-19
1920
-21
1923
-24
1926
-27
1929
-33
1937
-38
1945
1948
-49
1953
-54
1957
-58
1960
-61
1969
-70
1973
-75
1980
1981
-82
1990
-91
2001
2007
-09
Source: National Bureau of Economic Research
November 6, 2009 7
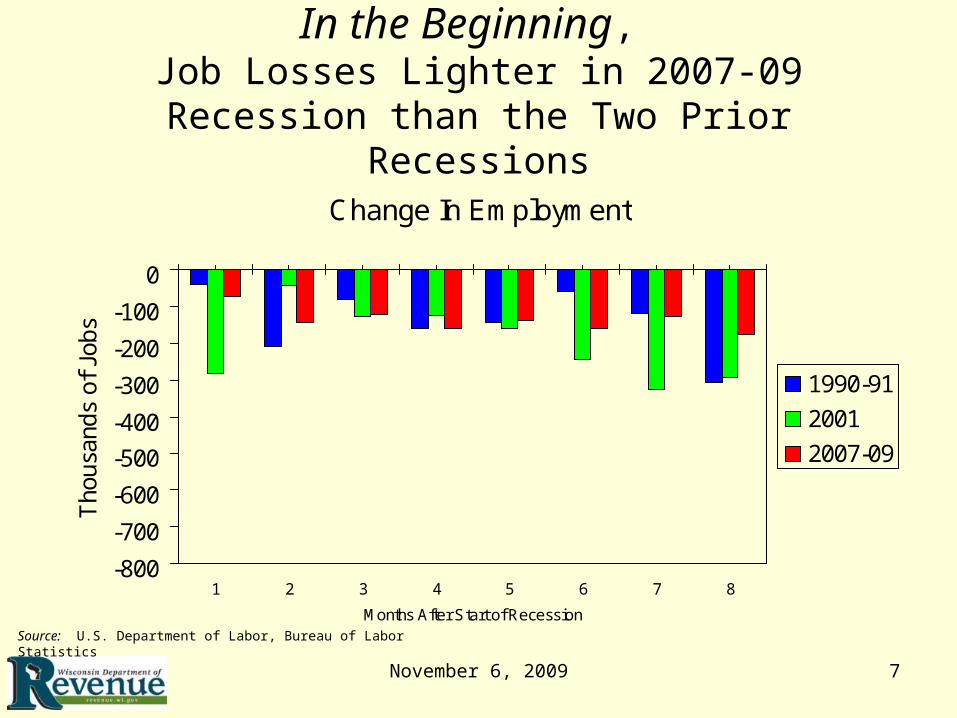
In the Beginning, Job Losses Lighter in 2007-09 Recession than the
Two Prior Recessions
Change In Employment
-800
-700
-600
-500
-400
-300
-200
-100
0
1 2 3 4 5 6 7 8
Months After Start of Recession
Tho
usan
ds o
f Jo
bs
1990-91
2001
2007-09
Source: U.S. Department of Labor, Bureau of Labor Statistics
November 6, 2009 8
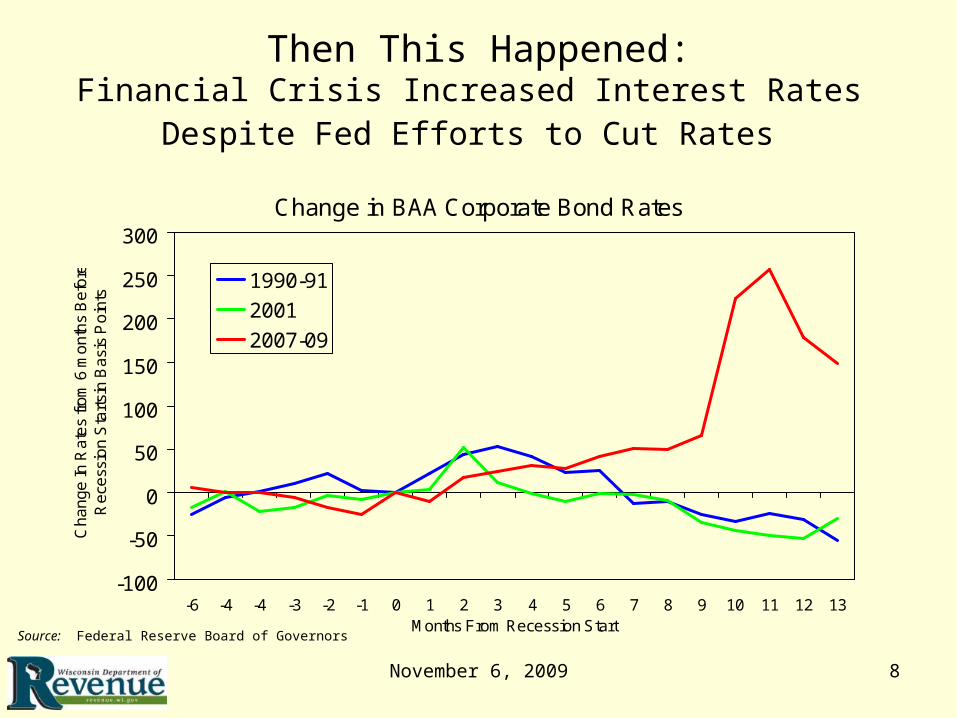
Then This Happened:Financial Crisis Increased Interest Rates
Despite Fed Efforts to Cut Rates
Change in BAA Corporate Bond Rates
-100
-50
0
50
100
150
200
250
300
-6 -4 -4 -3 -2 -1 0 1 2 3 4 5 6 7 8 9 10 11 12 13Months From Recession Start
Ch
an
ge
In R
ate
s fr
om
6 m
on
ths
Be
fore
R
ece
ssio
n S
tart
sin
Ba
sis
Po
ints
1990-91
2001
2007-09
Source: Federal Reserve Board of Governors

November 6, 2009 9
Financial Crisis Comparable to Great Depression Hits Late 2008
Spread Between BAA Corporate Bonds and Long-Term Treasuries
0
1
2
3
4
5
6
-18
-16
-14
-12
-10 -8 -6 -4 -2 0 2 4 6 8 10 12 14
Pre
cent
1929-33
2007-09
Average
November 6, 2009 10
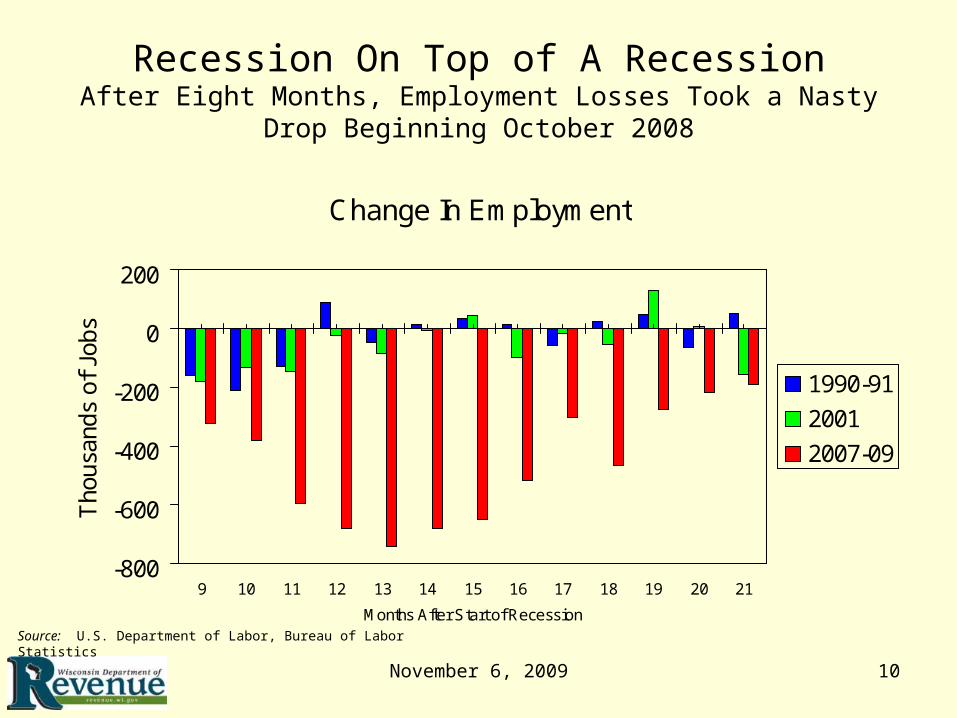
Recession On Top of A RecessionAfter Eight Months, Employment Losses Took a Nasty Drop Beginning
October 2008
Change In Employment
-800
-600
-400
-200
0
200
9 10 11 12 13 14 15 16 17 18 19 20 21
Months After Start of Recession
Tho
usan
ds o
f Jo
bs
1990-91
2001
2007-09
Source: U.S. Department of Labor, Bureau of Labor Statistics

November 6, 2009 11
Wisconsin Lost a Decade of Job Growth in Six Months
3-Month Change in Employment at Annual Rates
-10%
-8%
-6%
-4%
-2%
0%
2%
4%
US
WI
Source: U.S. Bureau of Labor Statistics

November 6, 2009 12
Wisconsin Unemployment More than Doubled
Percent of Labor Force Unemployed, Seasonally Adjusted
9
4.4
2
3
4
5
6
7
8
9
10
11
Jan
1998
Jul 1
998
Jan
1999
Jul 1
999
Jan
2000
Jul 2
000
Jan
2001
Jul 2
001
Jan
2002
Jul 2
002
Jan
2003
Jul 2
003
Jan
2004
Jul 2
004
Jan
2005
Jul 2
005
Jan
2006
Jul 2
006
Jan
2007
Jul 2
007
Jan
2008
Jul 2
008
Jan
2009
US
WI
Source: U.S. Bureau of Labor Statistics
November 6, 2009 13
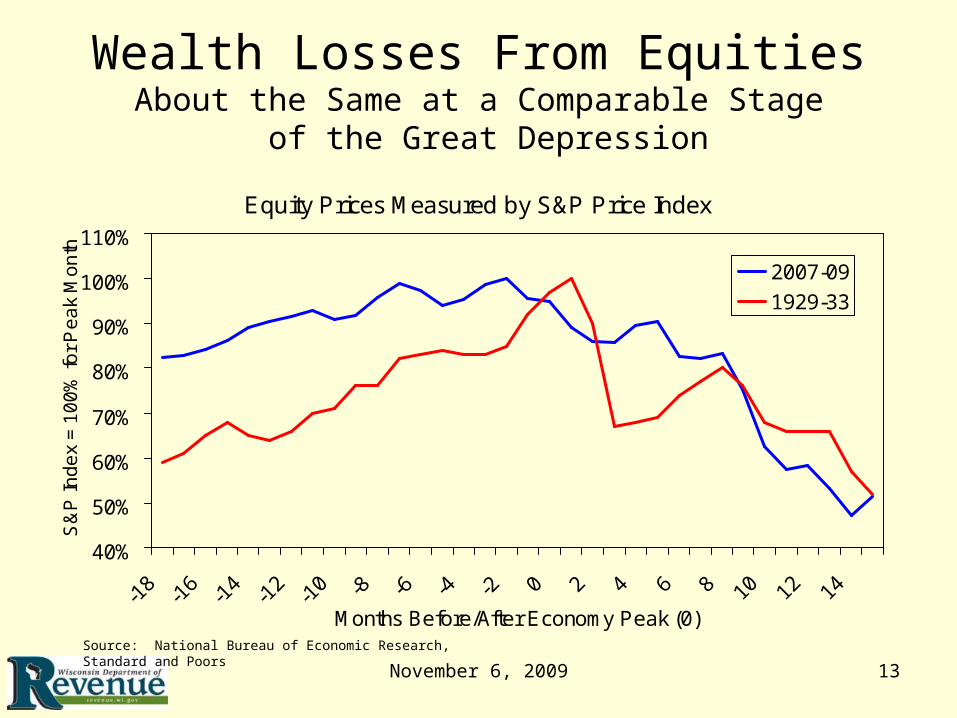
Wealth Losses From EquitiesAbout the Same at a Comparable Stage
of the Great Depression
Equity Prices Measured by S&P Price Index
40%
50%
60%
70%
80%
90%
100%
110%
-18
-16
-14
-12
-10 -8 -6 -4 -2 0 2 4 6 8 10 12 14
Months Before/After Economy Peak (0)
S&
P In
de
x =
10
0%
for
Pe
ak
Mo
nth
2007-09
1929-33
Source: National Bureau of Economic Research, Standard and Poors
November 6, 2009 14
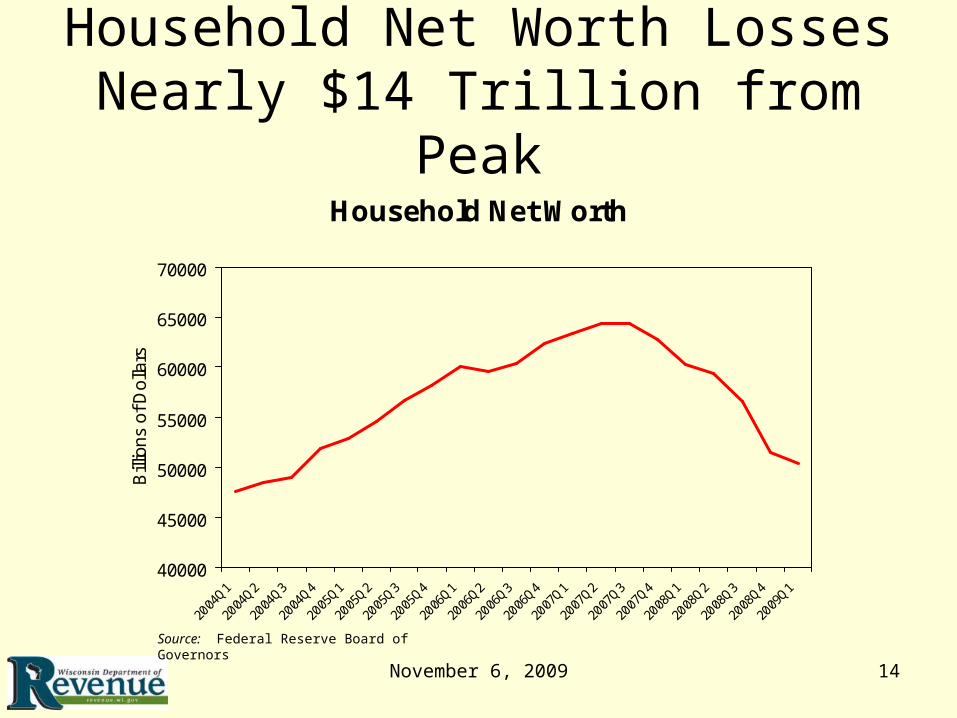
Household Net Worth Losses Nearly $14 Trillion from Peak
Household Net Worth
40000
45000
50000
55000
60000
65000
70000
2004
Q1
2004
Q2
2004
Q3
2004
Q4
2005
Q1
2005
Q2
2005
Q3
2005
Q4
2006
Q1
2006
Q2
2006
Q3
2006
Q4
2007
Q1
2007
Q2
2007
Q3
2007
Q4
2008
Q1
2008
Q2
2008
Q3
2008
Q4
2009
Q1
Bill
ions
of D
olla
rs
Source: Federal Reserve Board of Governors
November 6, 2009 15
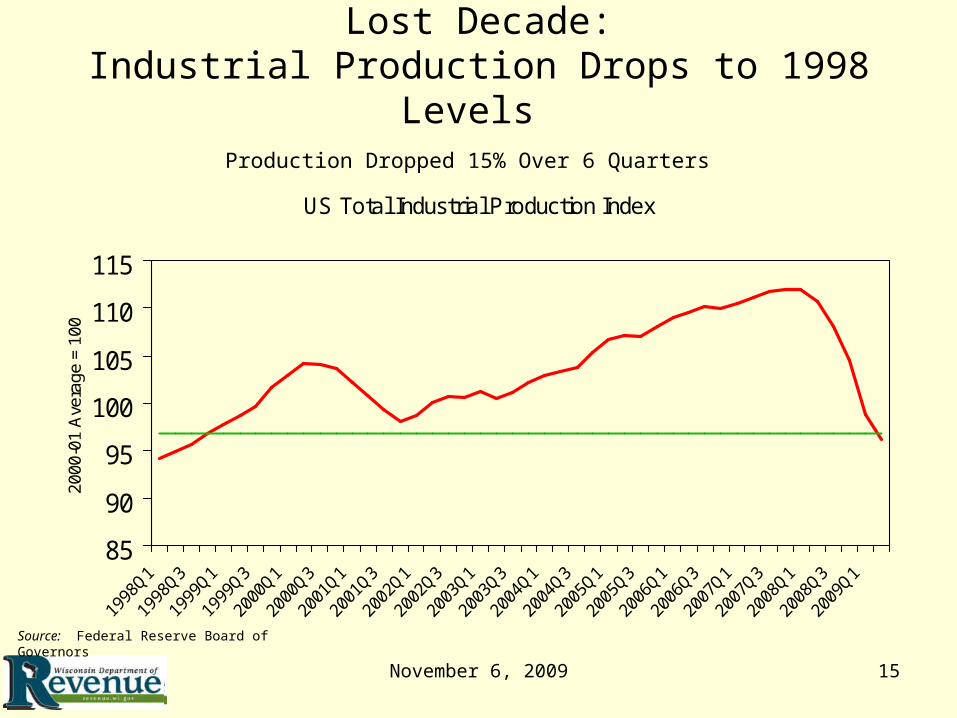
Lost Decade:Industrial Production Drops to 1998 Levels
Production Dropped 15% Over 6 Quarters
US Total Industrial Production Index
85
90
95
100
105
110
115
2000
-01
Ave
rage
= 1
00
Source: Federal Reserve Board of Governors
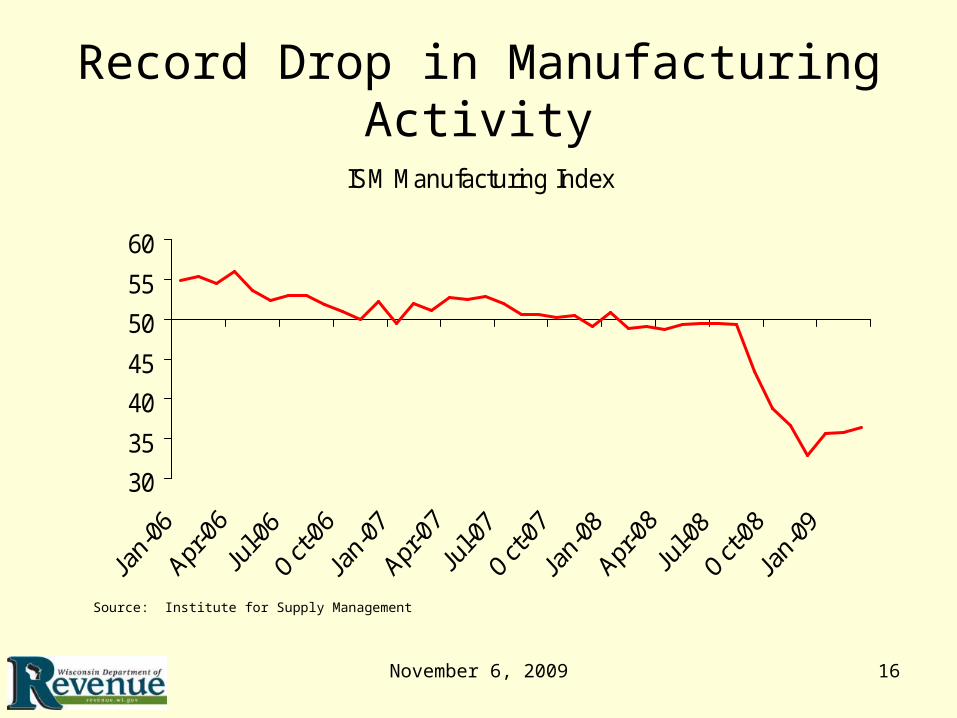
November 6, 2009 16
Record Drop in Manufacturing Activity
ISM Manufacturing Index
30
35
40
45
50
55
60
Source: Institute for Supply Management
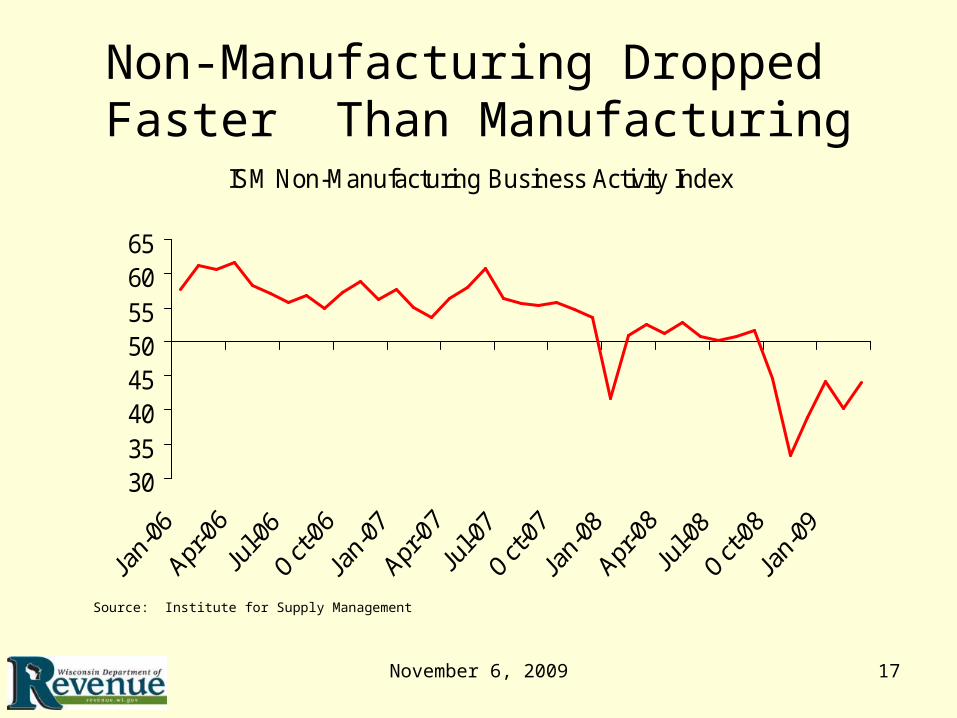
November 6, 2009 17
Non-Manufacturing Dropped Faster Than Manufacturing
ISM Non-Manufacturing Business Activity Index
3035404550556065
Source: Institute for Supply Management

November 6, 2009 18
Kick Them While Their DownHousing Falls 55% in Seven Months
U.S. Housing Starts in Thousands
488
1,078
0
200
400
600
800
1,000
1,200
1,400
1,600
Source: U.S. Bureau of the Census, Construction Statistics
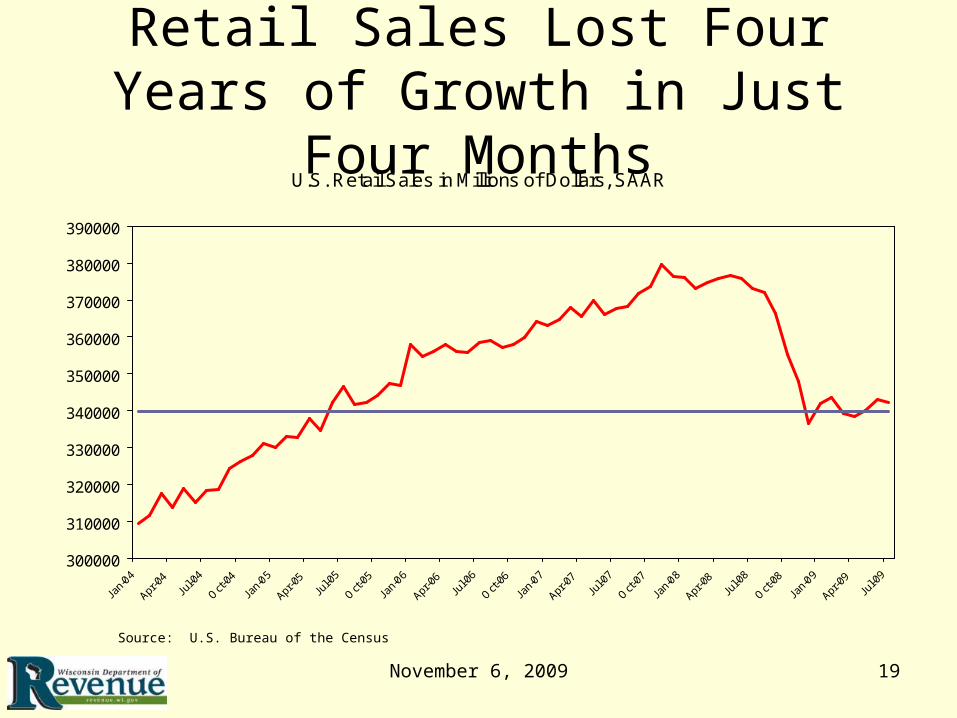
November 6, 2009 19
Retail Sales Lost Four Years of Growth in Just Four Months
U.S. Retail Sales in Millions of Dollars, SAAR
300000
310000
320000
330000
340000
350000
360000
370000
380000
390000
Jan-
04
Apr-0
4Ju
l-04
Oct-
04
Jan-
05
Apr-0
5Ju
l-05
Oct-
05
Jan-
06
Apr-0
6Ju
l-06
Oct-
06
Jan-
07
Apr-0
7Ju
l-07
Oct-
07
Jan-
08
Apr-0
8Ju
l-08
Oct-
08
Jan-
09
Apr-0
9Ju
l-09
Source: U.S. Bureau of the Census

November 6, 2009 20
Wisconsin’s Sales Collections Drop for the First Time Ever in FY2009
Percent Change in Wisconsin Sales Tax Collections
-6%
-4%
-2%
0%
2%
4%
6%
8%
10%
FY1985
FY1986
FY1987
FY1988
FY1989
FY1990
FY1991
FY1992
FY1993
FY1994
FY1995
FY1996
FY1997
FY1998
FY1999
FY2000
FY2001
FY2002
FY2003
FY2004
FY2005
FY2006
FY2007
FY2008
FY2009
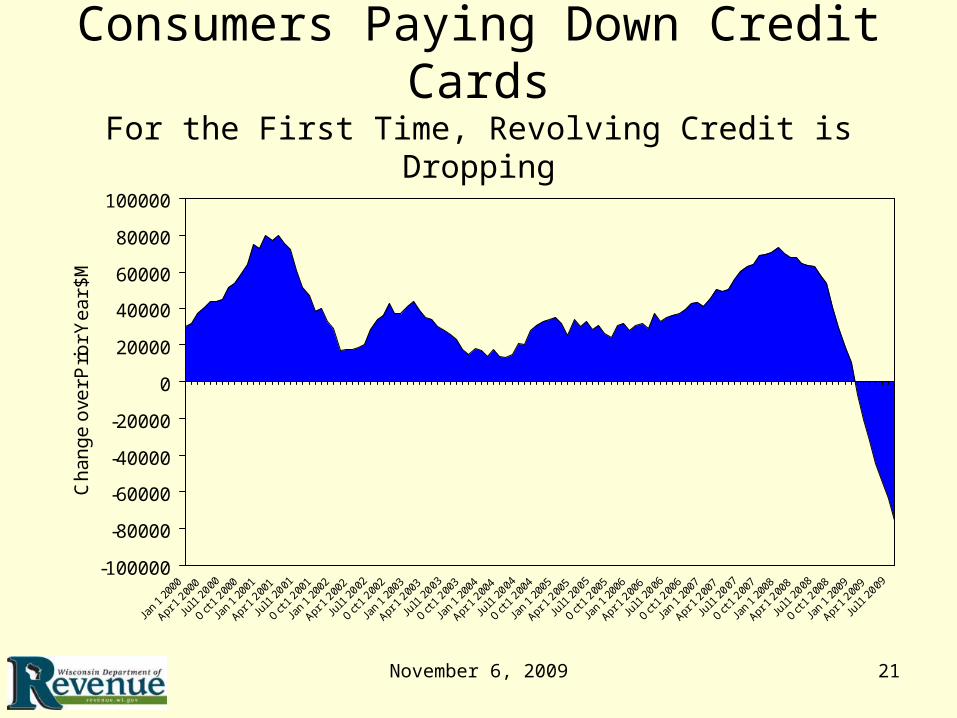
November 6, 2009 21
Consumers Paying Down Credit CardsFor the First Time, Revolving Credit is Dropping
-100000
-80000
-60000
-40000
-20000
0
20000
40000
60000
80000
100000
Jan
1 20
00
Apr 1
200
0
Jul 1
2000
Oct
1 200
0
Jan
1 20
01
Apr 1
200
1
Jul 1
2001
Oct
1 200
1
Jan
1 20
02
Apr 1
200
2
Jul 1
2002
Oct
1 200
2
Jan
1 20
03
Apr 1
200
3
Jul 1
2003
Oct
1 200
3
Jan
1 20
04
Apr 1
200
4
Jul 1
2004
Oct
1 200
4
Jan
1 20
05
Apr 1
200
5
Jul 1
2005
Oct
1 200
5
Jan
1 20
06
Apr 1
200
6
Jul 1
2006
Oct
1 200
6
Jan
1 20
07
Apr 1
200
7
Jul 1
2007
Oct
1 200
7
Jan
1 20
08
Apr 1
200
8
Jul 1
2008
Oct
1 200
8
Jan
1 20
09
Apr 1
200
9
Jul 1
2009
Ch
an
ge
ove
r P
rior
Ye
ar
$M
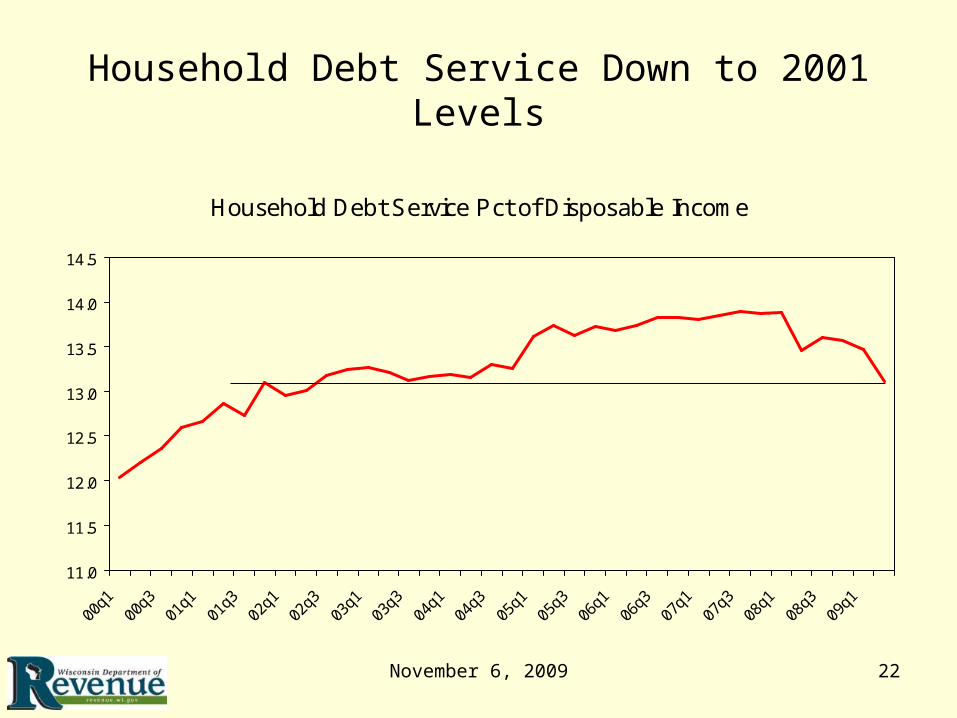
November 6, 2009 22
Household Debt Service Down to 2001 Levels
Household Debt Service Pct of Disposable Income
11.0
11.5
12.0
12.5
13.0
13.5
14.0
14.5
00q1
00q3
01q1
01q3
02q1
02q3
03q1
03q3
04q1
04q3
05q1
05q3
06q1
06q3
07q1
07q3
08q1
08q3
09q1

November 6, 2009 23
Saving More
Change in Net Savings
-300
-200
-100
0
100
200
300
400
200
0-I
200
0-II
200
0-III
200
0-IV
200
1-I
200
1-II
200
1-III
200
1-IV
200
2-I
200
2-II
200
2-III
200
2-IV
200
3-I
200
3-II
200
3-III
200
3-IV
200
4-I
200
4-II
200
4-III
200
4-IV
200
5-I
200
5-II
200
5-III
200
5-IV
200
6-I
200
6-II
200
6-III
200
6-IV
200
7-I
200
7-II
200
7-III
200
7-IV
200
8-I
200
8-II
200
8-III
200
8-IV
200
9-I
200
9-II
200
9-III
Yea
r o
ver
Yea
r C
han
ge
$M
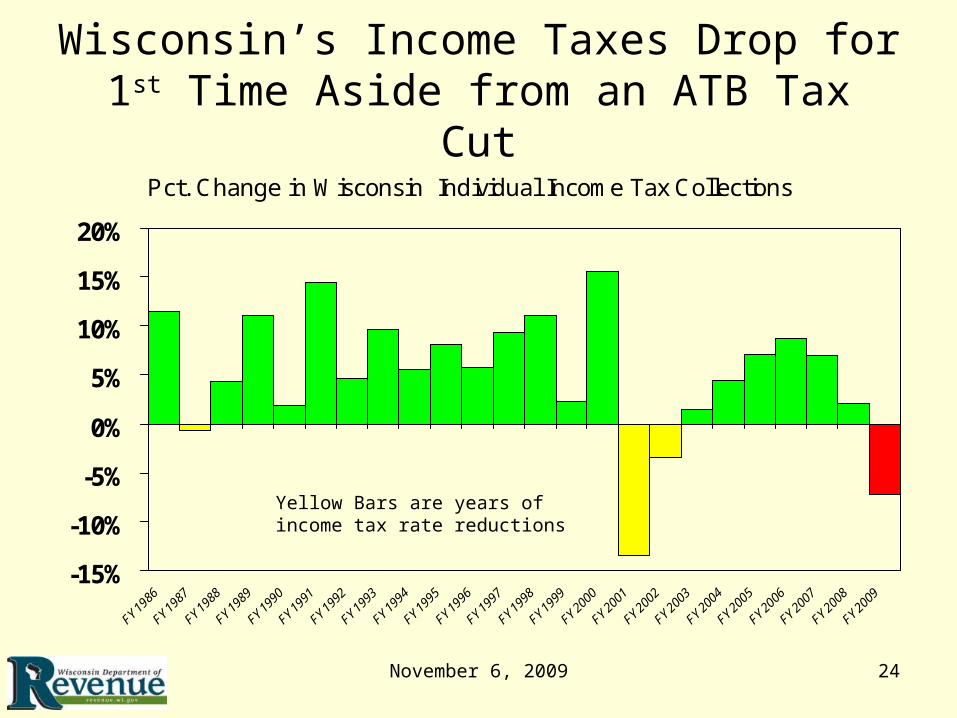
November 6, 2009 24
Wisconsin’s Income Taxes Drop for 1st Time Aside from an ATB Tax Cut
Pct. Change in Wisconsin Individual Income Tax Collections
-15%
-10%
-5%
0%
5%
10%
15%
20%
FY1986
FY1987
FY1988
FY1989
FY1990
FY1991
FY1992
FY1993
FY1994
FY1995
FY1996
FY1997
FY1998
FY1999
FY2000
FY2001
FY2002
FY2003
FY2004
FY2005
FY2006
FY2007
FY2008
FY2009
Yellow Bars are years of income tax rate reductions
Wisconsin Was Not the Epicenter of the Recession

November 6, 2009 26
10 States Set Unemployment Records in 2009But Not Wisconsin
Source: U.S. Bureau of Labor Statistics
State Unemployment RateRelative to State Record High
More than 1% Below Record Level (36)State Record Set in 2009 (10)Within 1% of Record High Aug 2009 (5)
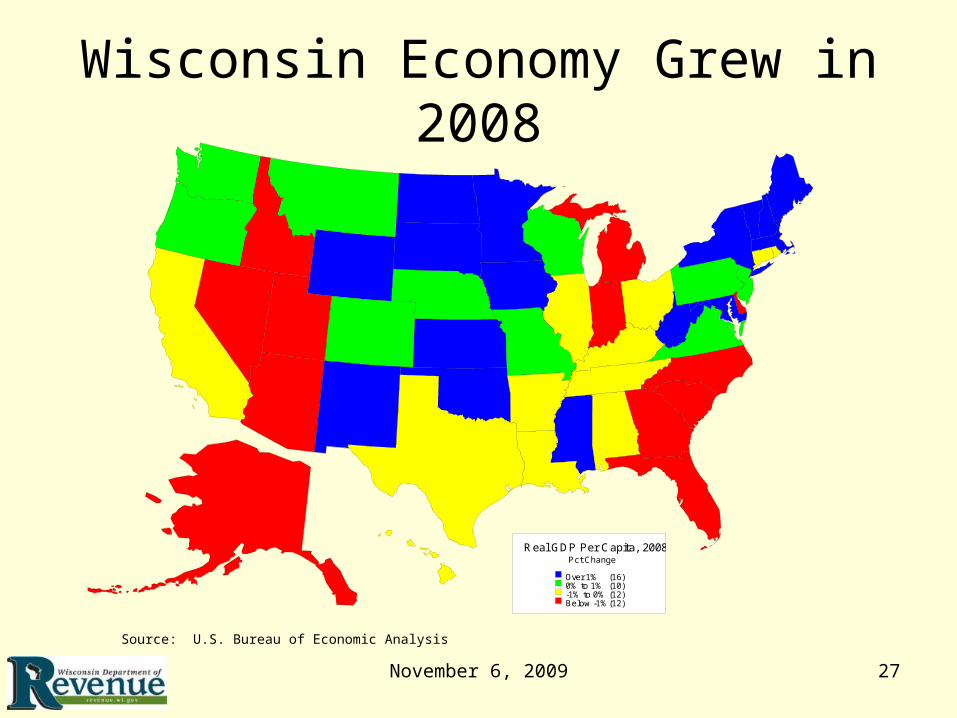
November 6, 2009 27
Wisconsin Economy Grew in 2008
Real GDP Per Capita, 2008Pct Change
Over 1% (16)0% to 1% (10)-1% to 0% (12)Below -1% (12)
Source: U.S. Bureau of Economic Analysis

November 6, 2009 28
2008 Economic GrowthWisconsin Only Great Lakes State to Expand in 2008
Real GDP Per Capita, 2008Pct Change
Over 1% (16)0% to 1% (10)-1% to 0% (12)Below -1% (12)
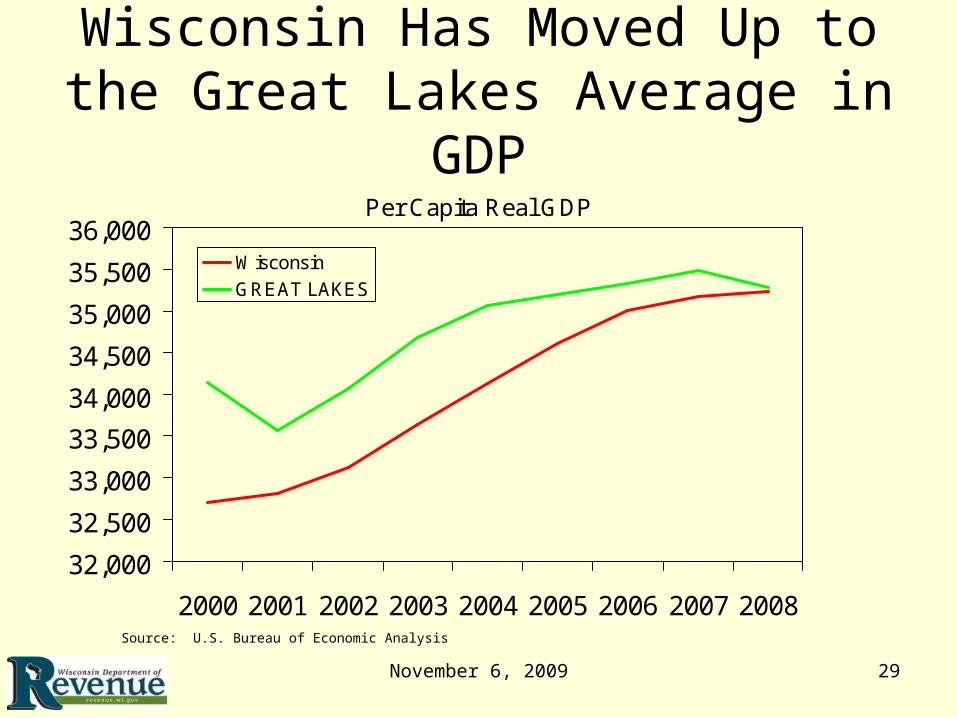
November 6, 2009 29
Wisconsin Has Moved Up to the Great Lakes Average in GDP
Per Capita Real GDP
32,000
32,500
33,000
33,500
34,000
34,500
35,000
35,500
36,000
2000 2001 2002 2003 2004 2005 2006 2007 2008
Wisconsin
GREAT LAKES
Source: U.S. Bureau of Economic Analysis
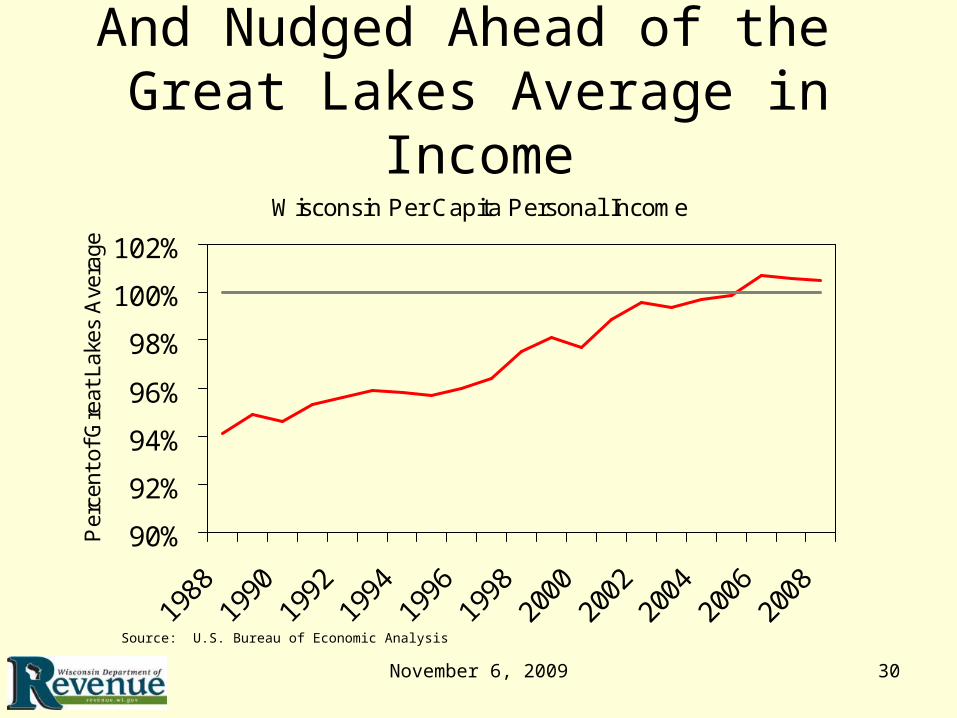
November 6, 2009 30
And Nudged Ahead of the Great Lakes Average in Income
Wisconsin Per Capita Personal Income
90%
92%
94%
96%
98%
100%
102%
1988
1990
1992
1994
1996
1998
2000
2002
2004
2006
2008
Per
cent
of G
reat
Lak
es A
vera
ge
Source: U.S. Bureau of Economic Analysis
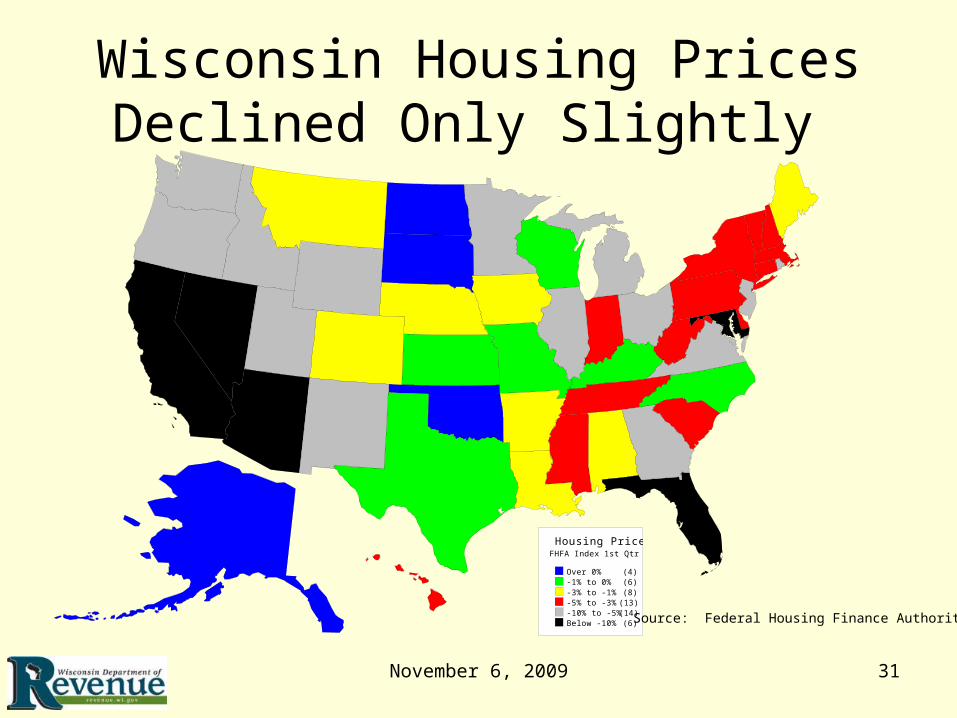
November 6, 2009 31
Wisconsin Housing Prices Declined Only Slightly
Housing PricesFHFA Index 1st Qtr 2009
Over 0% (4)-1% to 0% (6)-3% to -1% (8)-5% to -3% (13)-10% to -5% (14)Below -10% (6) Source: Federal Housing Finance Authority
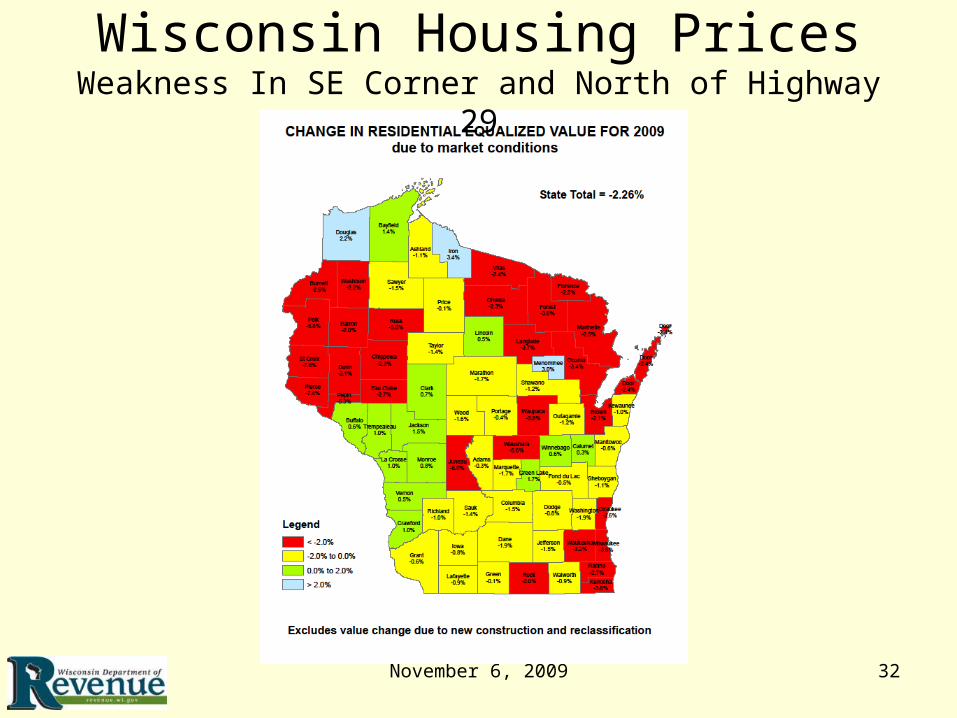
November 6, 2009 32
Wisconsin Housing PricesWeakness In SE Corner and North of Highway 29

This is Now…The Recovery Has Started
November 6, 2009 34
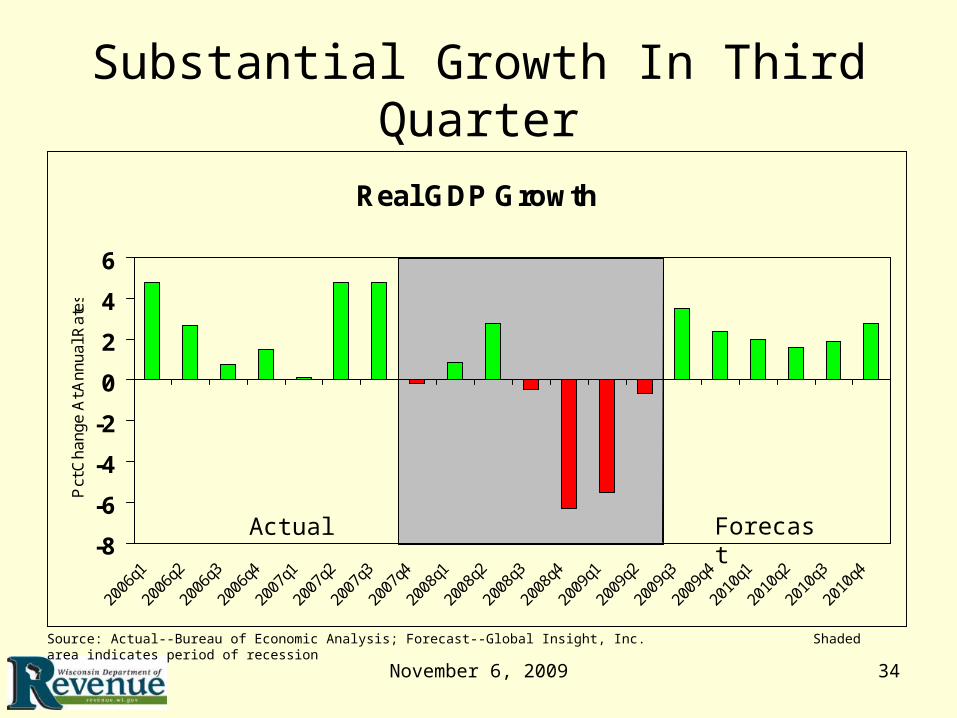
Substantial Growth In Third Quarter
Real GDP Growth
-8
-6
-4
-2
0
2
4
6
2006
q1
2006
q2
2006
q3
2006
q4
2007
q1
2007
q2
2007
q3
2007
q4
2008
q1
2008
q2
2008
q3
2008
q4
2009
q1
2009
q2
2009
q3
2009
q4
2010
q1
2010
q2
2010
q3
2010
q4
Pct
Ch
an
ge
At A
nn
ua
l Ra
tes
Source: Actual--Bureau of Economic Analysis; Forecast--Global Insight, Inc. Shaded area indicates period of recession
Actual Forecast
November 6, 2009 35
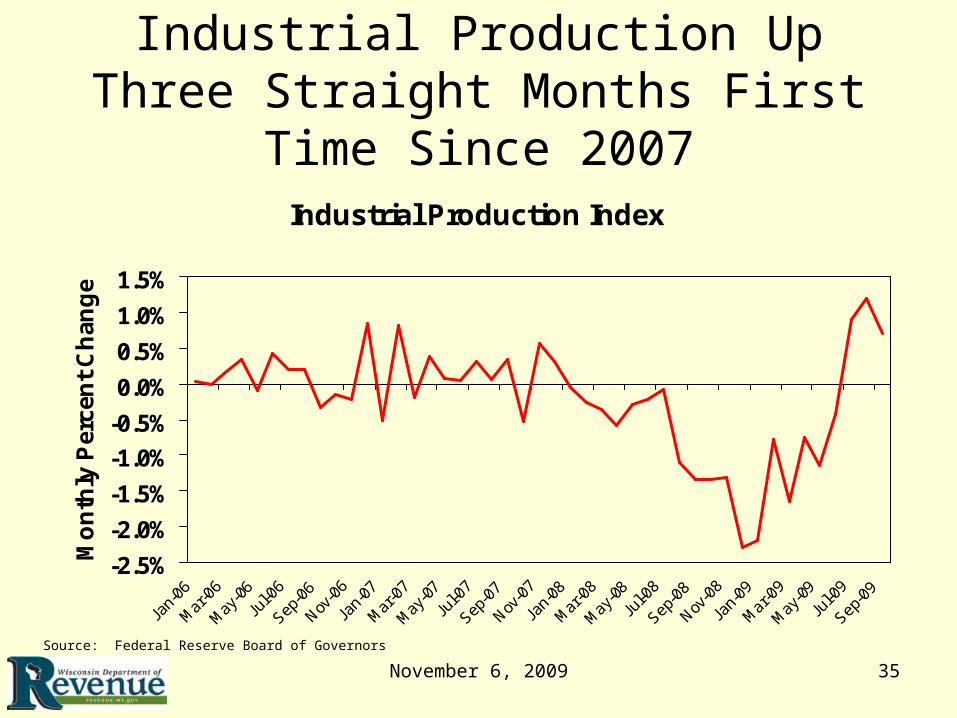
Industrial Production Up Three Straight Months First Time Since 2007
Industrial Production Index
-2.5%
-2.0%
-1.5%
-1.0%
-0.5%
0.0%
0.5%
1.0%
1.5%
Jan-
06
Mar
-06
May
-06
Jul-0
6
Sep-0
6
Nov-0
6
Jan-
07
Mar
-07
May
-07
Jul-0
7
Sep-0
7
Nov-0
7
Jan-
08
Mar
-08
May
-08
Jul-0
8
Sep-0
8
Nov-0
8
Jan-
09
Mar
-09
May
-09
Jul-0
9
Sep-0
9
Mo
nth
ly P
erce
nt
Ch
ang
e
Source: Federal Reserve Board of Governors

November 6, 2009 36
Manufacturing Moves To Recovery
ISM Manufacturing Index
30
35
40
45
50
55
60
Source: Institute for Supply Management
November 6, 2009 37
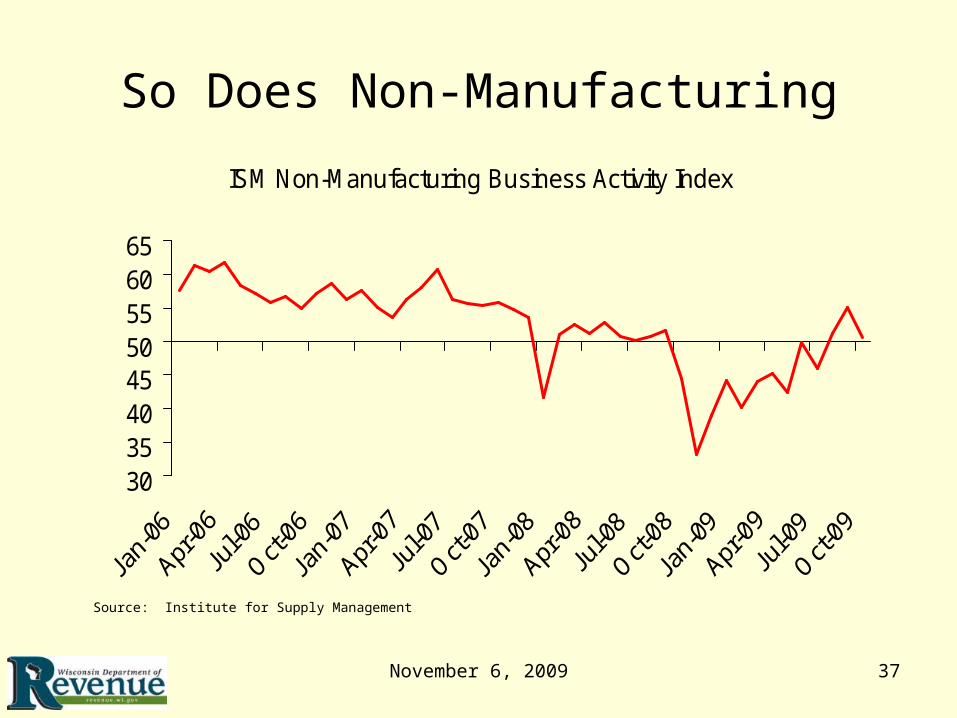
So Does Non-Manufacturing
ISM Non-Manufacturing Business Activity Index
3035404550556065
Source: Institute for Supply Management
November 6, 2009 38
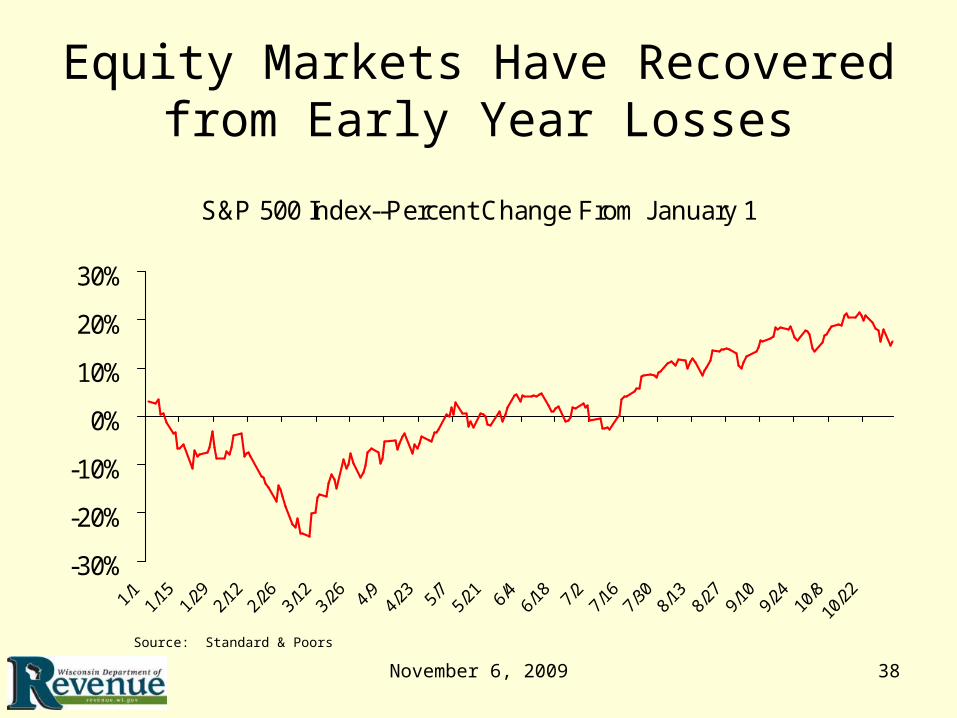
Equity Markets Have Recovered from Early Year Losses
S&P 500 Index--Percent Change From January 1
-30%
-20%
-10%
0%
10%
20%
30%
Source: Standard & Poors

November 6, 2009 39
Household Net Worth Increased in 2009 2nd Quarter
Household Net Worth
40000
45000
50000
55000
60000
65000
70000
2004
Q1
2004
Q2
2004
Q3
2004
Q4
2005
Q1
2005
Q2
2005
Q3
2005
Q4
2006
Q1
2006
Q2
2006
Q3
2006
Q4
2007
Q1
2007
Q2
2007
Q3
2007
Q4
2008
Q1
2008
Q2
2008
Q3
2008
Q4
2009
Q1
2009
Q2
Bill
ions
of D
olla
rs
Source: Federal Reserve Board of Governors
November 6, 2009 40
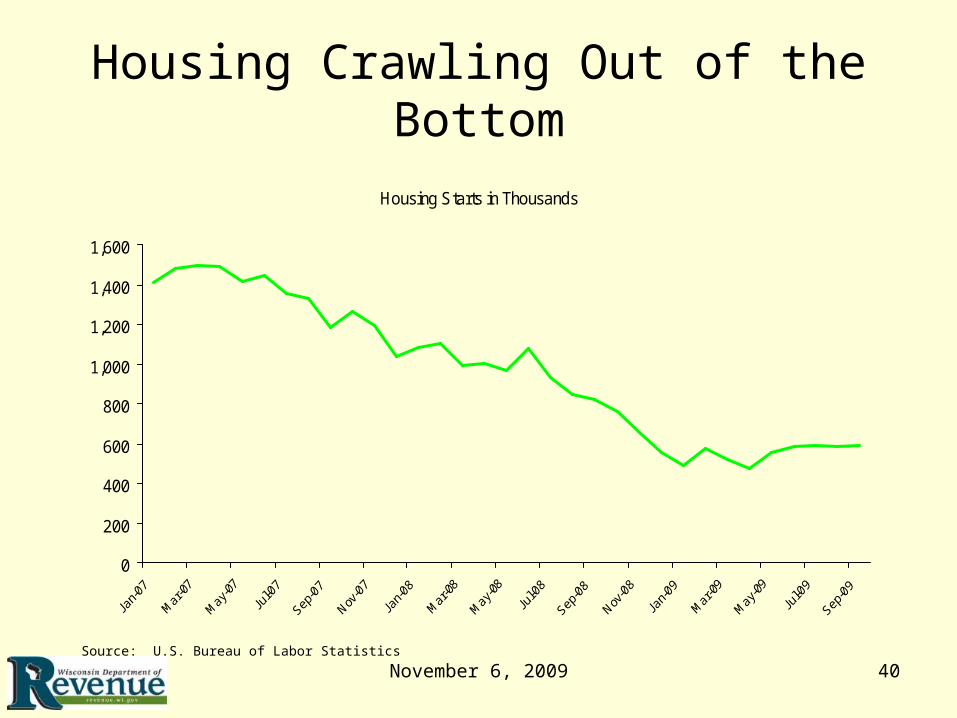
Housing Crawling Out of the Bottom
Housing Starts in Thousands
0
200
400
600
800
1,000
1,200
1,400
1,600
Source: U.S. Bureau of Labor Statistics
November 6, 2009 41
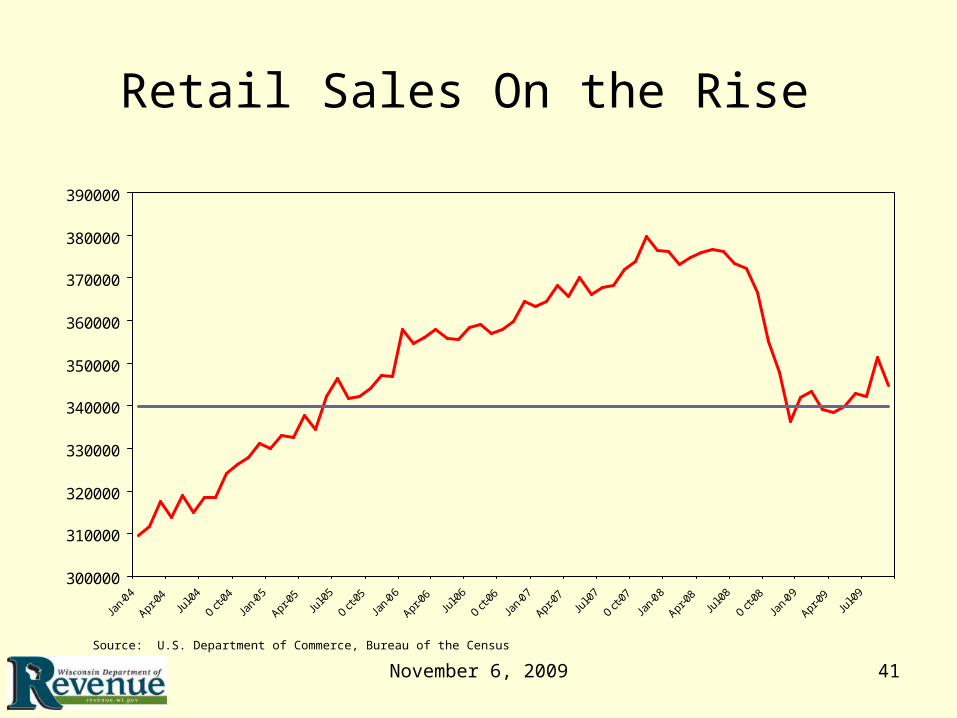
Retail Sales On the Rise
300000
310000
320000
330000
340000
350000
360000
370000
380000
390000
Jan-
04
Apr-0
4Ju
l-04
Oct-
04
Jan-
05
Apr-0
5Ju
l-05
Oct-
05
Jan-
06
Apr-0
6Ju
l-06
Oct-
06
Jan-
07
Apr-0
7Ju
l-07
Oct-
07
Jan-
08
Apr-0
8Ju
l-08
Oct-
08
Jan-
09
Apr-0
9Ju
l-09
Source: U.S. Department of Commerce, Bureau of the Census
November 6, 2009 42
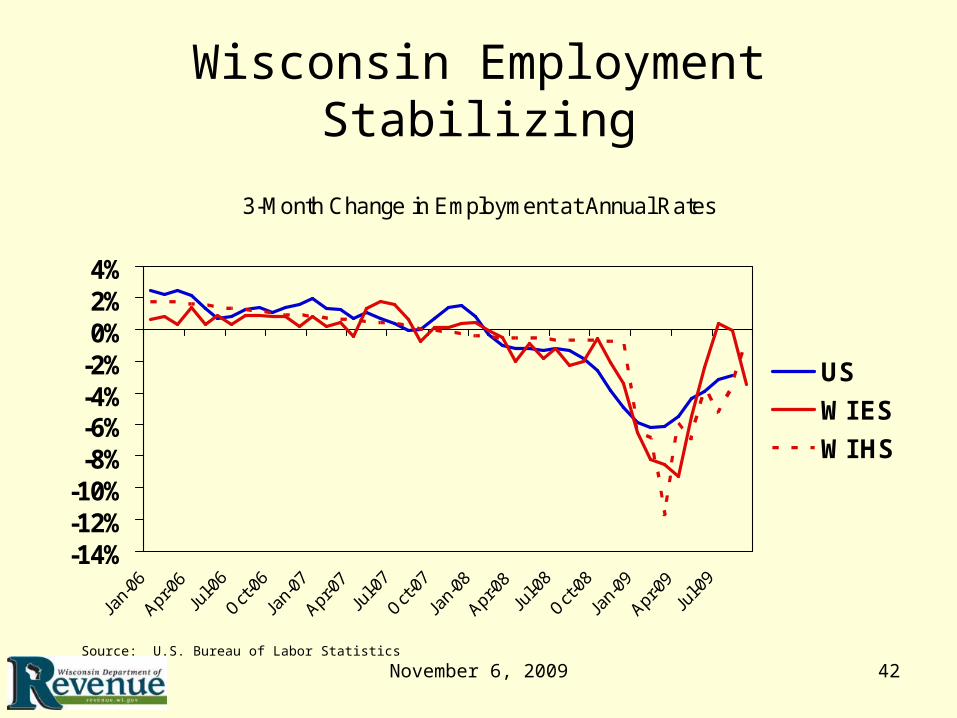
Wisconsin Employment Stabilizing
3-Month Change in Employment at Annual Rates
-14%-12%-10%-8%-6%-4%-2%0%2%4%
US
WI ES
WI HS
Source: U.S. Bureau of Labor Statistics
November 6, 2009 43
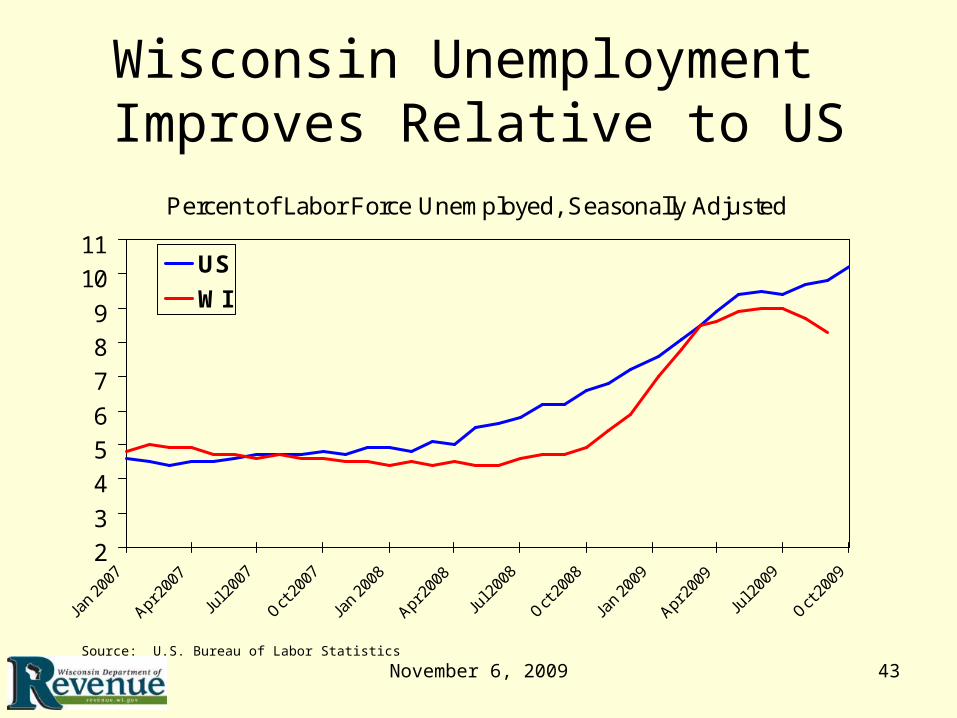
Wisconsin Unemployment Improves Relative to US
Percent of Labor Force Unemployed, Seasonally Adjusted
2
3
4
5
6
7
8
9
10
11
Jan
2007
Apr 2
007
Jul 2
007
Oct 2
007
Jan
2008
Apr 2
008
Jul 2
008
Oct 2
008
Jan
2009
Apr 2
009
Jul 2
009
Oct 2
009
US
WI
Source: U.S. Bureau of Labor Statistics
November 6, 2009 44
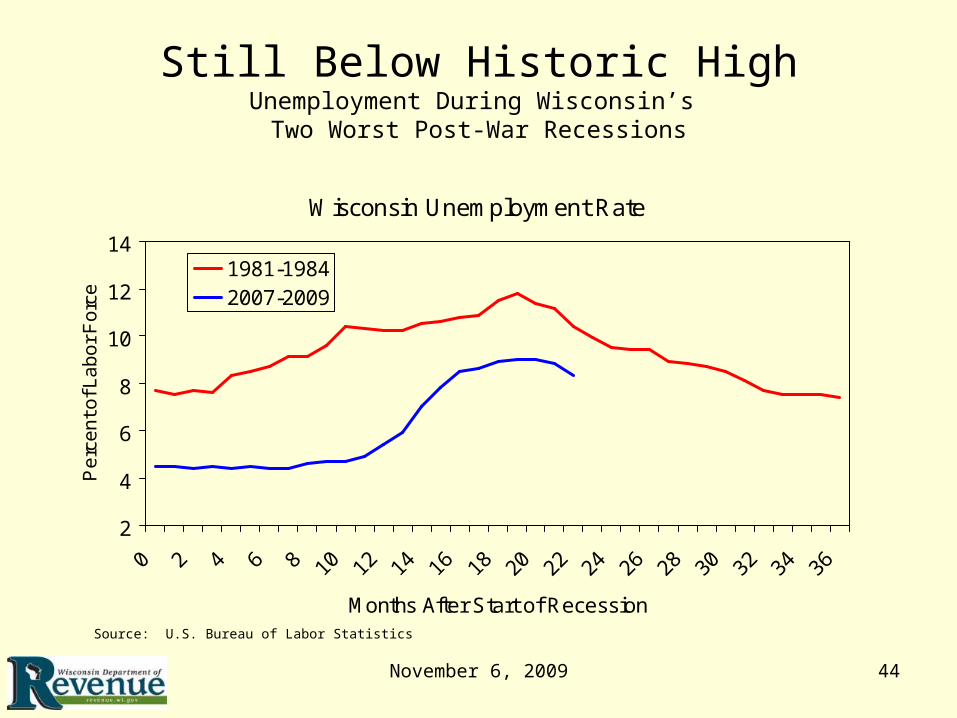
Still Below Historic HighUnemployment During Wisconsin’s Two Worst Post-War Recessions
Wisconsin Unemployment Rate
2
4
6
8
10
12
14
0 2 4 6 8 10 12 14 16 18 20 22 24 26 28 30 32 34 36
Months After Start of Recession
Pe
rce
nt o
f La
bo
r F
orc
e
1981-19842007-2009
Source: U.S. Bureau of Labor Statistics
November 6, 2009 45
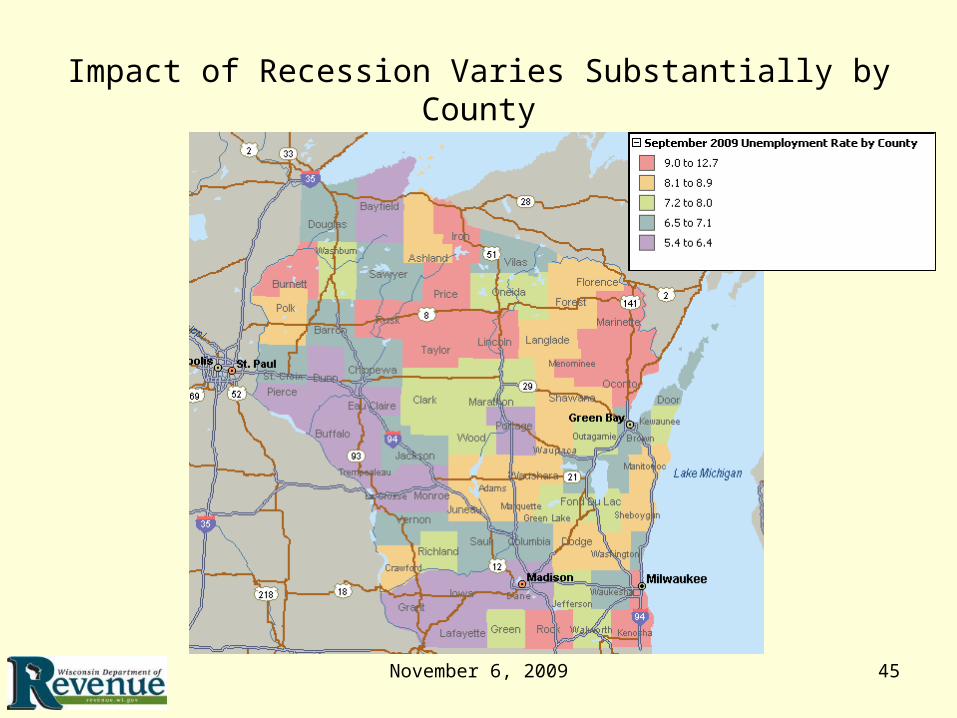
Impact of Recession Varies Substantially by County

It Will Be A Long Road Back

November 6, 2009 47
Financial Crisis Still In The Background
Spread Between BAA Corporate Bonds and Long-Term Treasuries
0
1
2
3
4
5
6
-18
-16
-14
-12
-10 -8 -6 -4 -2 0 2 4 6 8 10 12 14 16 18 20 22
Pre
cent
2007-09
Average
November 6, 2009 48
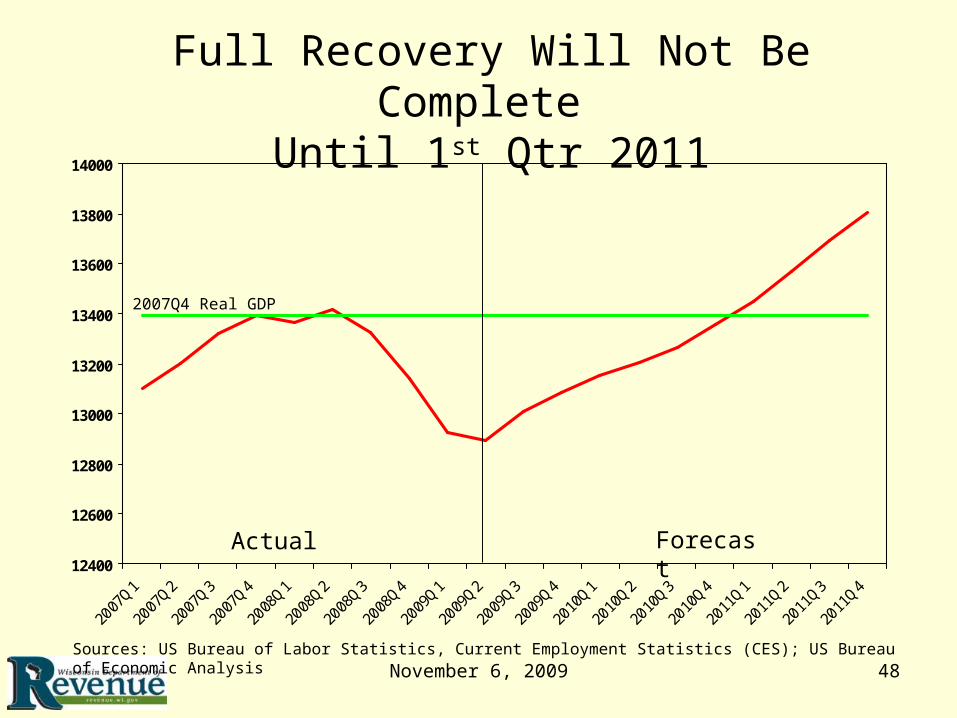
Full Recovery Will Not Be Complete Until 1st Qtr 2011
12400
12600
12800
13000
13200
13400
13600
13800
14000
2007
Q1
2007
Q2
2007
Q3
2007
Q4
2008
Q1
2008
Q2
2008
Q3
2008
Q4
2009
Q1
2009
Q2
2009
Q3
2009
Q4
2010
Q1
2010
Q2
2010
Q3
2010
Q4
2011
Q1
2011
Q2
2011
Q3
2011
Q4
Sources: US Bureau of Labor Statistics, Current Employment Statistics (CES); US Bureau of Economic Analysis
Actual Forecast
2007Q4 Real GDP
November 6, 2009 49
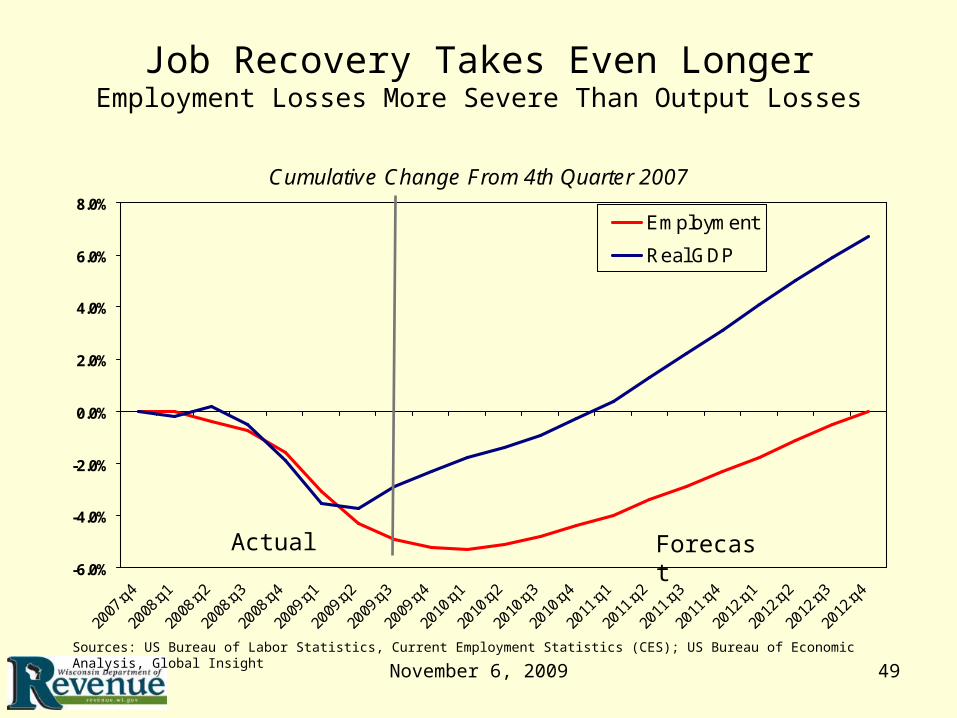
Job Recovery Takes Even LongerEmployment Losses More Severe Than Output Losses
Cumulative Change From 4th Quarter 2007
-6.0%
-4.0%
-2.0%
0.0%
2.0%
4.0%
6.0%
8.0%
2007
:q4
2008
:q1
2008
:q2
2008
:q3
2008
:q4
2009
:q1
2009
:q2
2009
:q3
2009
:q4
2010
:q1
2010
:q2
2010
:q3
2010
:q4
2011
:q1
2011
:q2
2011
:q3
2011
:q4
2012
:q1
2012
:q2
2012
:q3
2012
:q4
Employment
Real GDP
Sources: US Bureau of Labor Statistics, Current Employment Statistics (CES); US Bureau of Economic Analysis, Global Insight
Actual Forecast
Wisconsin will Match or Outpace US growth in 2010.
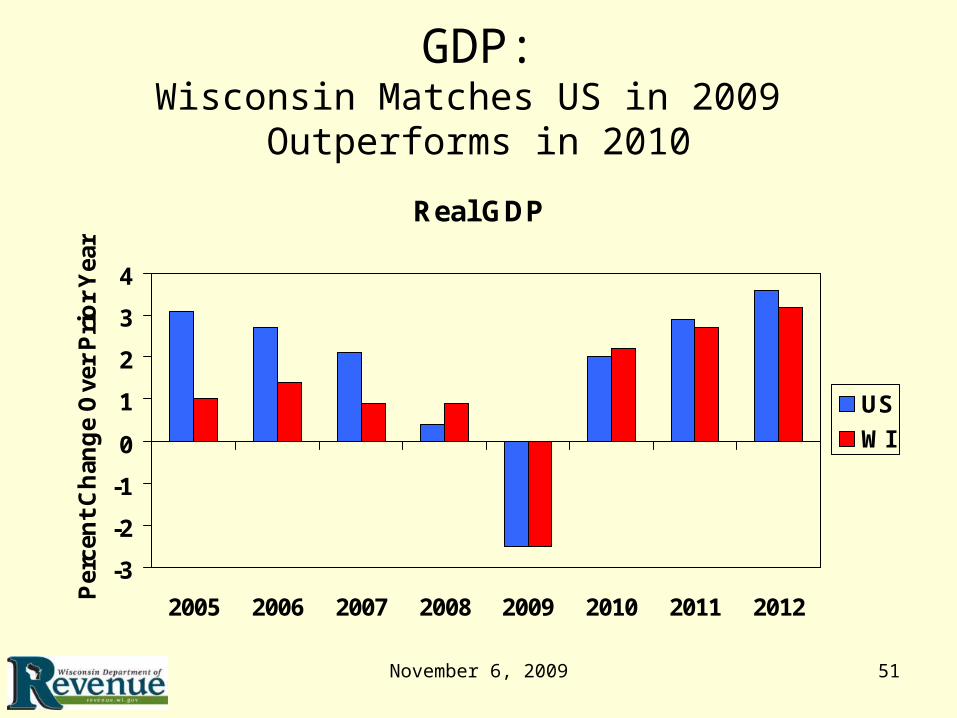
November 6, 2009 51
GDP:Wisconsin Matches US in 2009
Outperforms in 2010
Real GDP
-3
-2
-1
0
1
2
3
4
2005 2006 2007 2008 2009 2010 2011 2012Per
cen
t C
han
ge
Ove
r P
rio
r Y
ear
US
WI
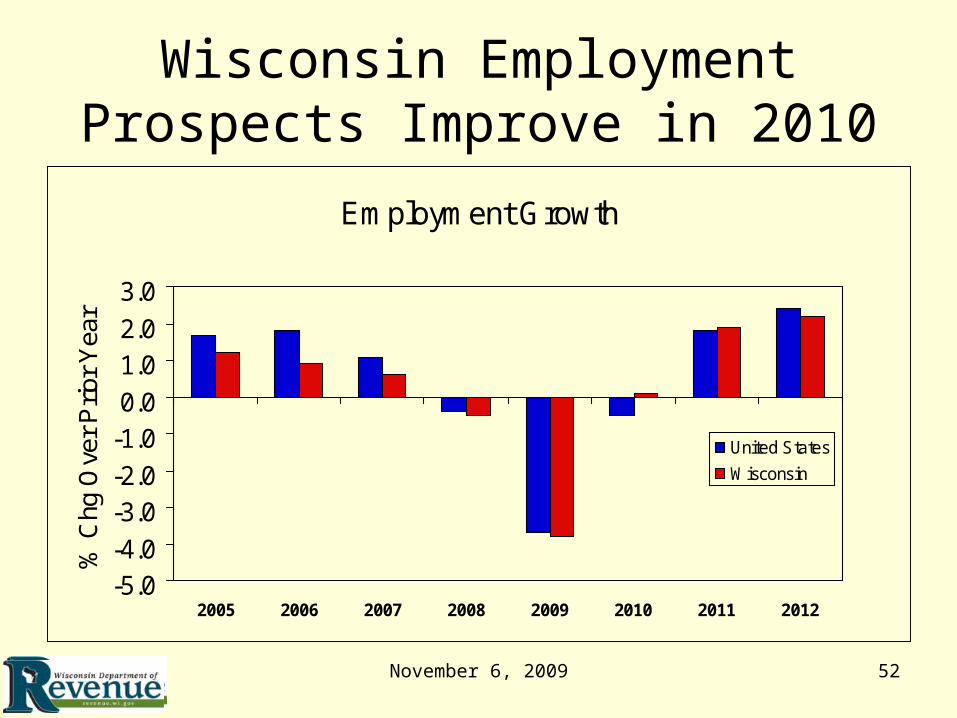
November 6, 2009 52
Wisconsin Employment Prospects Improve in 2010
Employment Growth
-5.0-4.0
-3.0-2.0
-1.00.0
1.02.0
3.0
2005 2006 2007 2008 2009 2010 2011 2012
% C
hg O
ver
Prio
r Y
ear
United States
Wisconsin
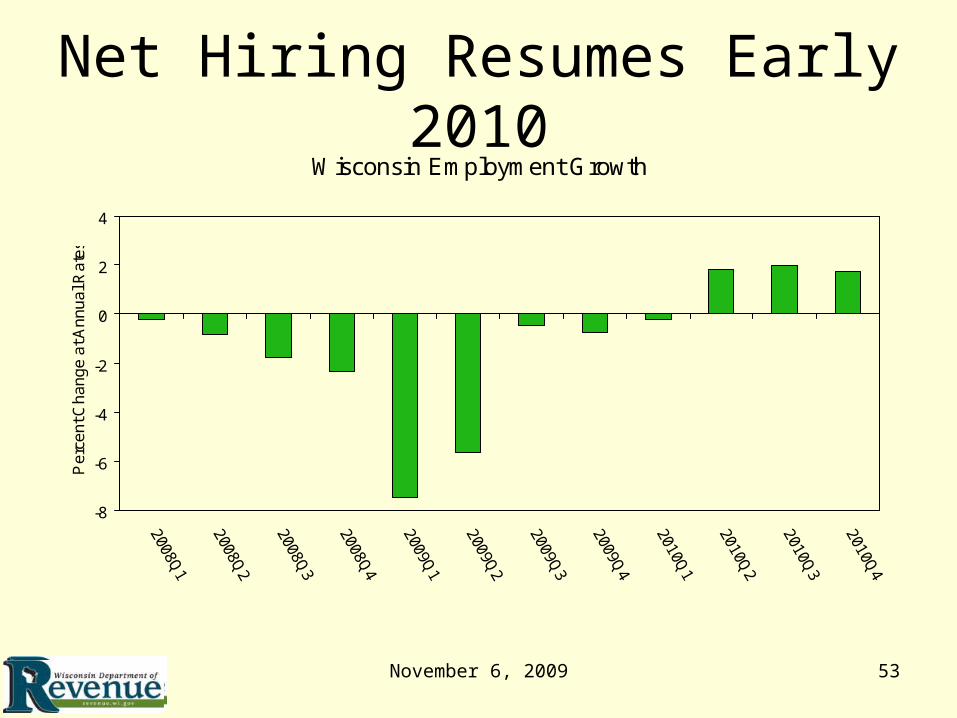
November 6, 2009 53
Net Hiring Resumes Early 2010Wisconsin Employment Growth
-8
-6
-4
-2
0
2
4
2008Q1
2008Q2
2008Q3
2008Q4
2009Q1
2009Q2
2009Q3
2009Q4
2010Q1
2010Q2
2010Q3
2010Q4
Pe
rce
nt C
ha
ng
e a
t An
nu
al R
ate
s
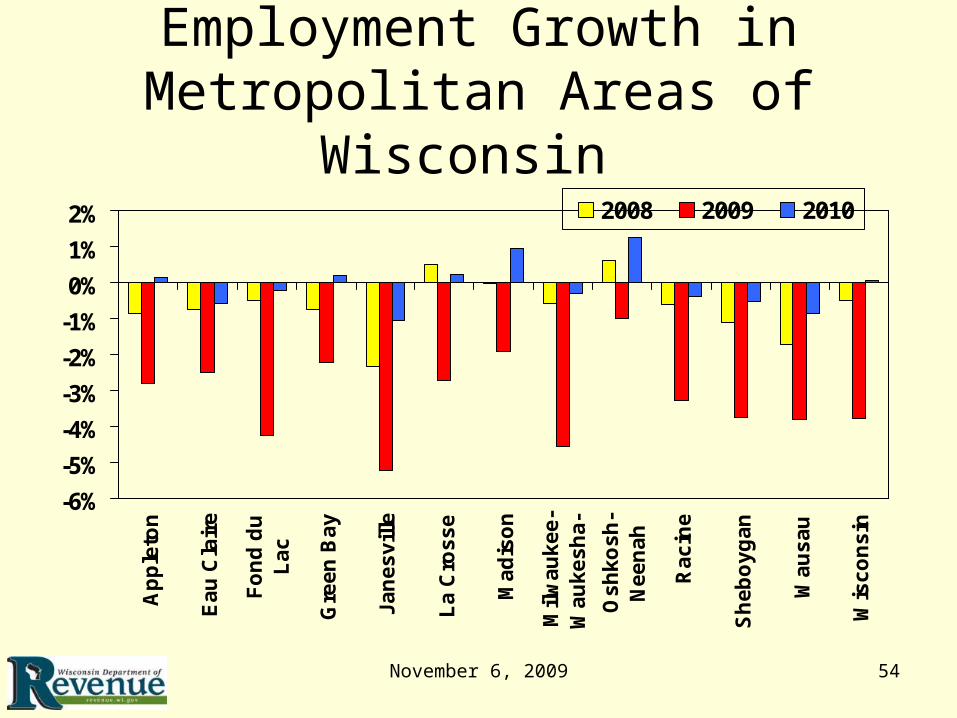
November 6, 2009 54
Employment Growth in Metropolitan Areas of Wisconsin
-6%
-5%
-4%
-3%
-2%
-1%
0%
1%
2%
Ap
ple
ton
Ea
u C
lair
e
Fo
nd
du
La
c
Gre
en
Ba
y
Ja
ne
sv
ille
La
Cro
ss
e
Ma
dis
on
Mil
wa
uk
ee
-W
au
ke
sh
a-
Os
hk
os
h-
Ne
en
ah
Ra
cin
e
Sh
eb
oy
ga
n
Wa
us
au
Wis
co
ns
in
2008 2009 2010
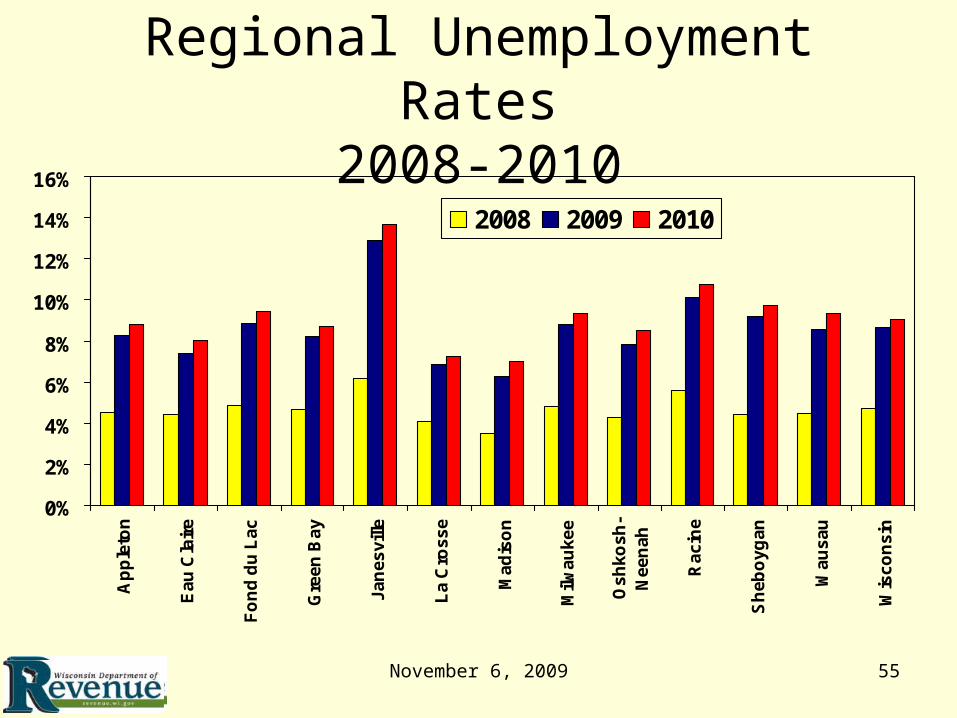
November 6, 2009 55
Regional Unemployment Rates2008-2010
0%
2%
4%
6%
8%
10%
12%
14%
16%
Ap
ple
ton
Ea
u C
lair
e
Fo
nd
du
La
c
Gre
en
Ba
y
Ja
ne
sv
ille
La
Cro
ss
e
Ma
dis
on
Milw
au
ke
e
Os
hk
os
h-
Ne
en
ah
Ra
cin
e
Sh
eb
oy
ga
n
Wa
us
au
Wis
co
ns
in
2008 2009 2010

November 6, 2009 56
Personal Income GrowthBy MSA, 2009-2010
-4.0%
-3.0%
-2.0%
-1.0%
0.0%
1.0%
2.0%
3.0%
Ap
ple
ton
Eau
Cla
ire
Fo
nd
du
Lac
Gre
en B
ay
Jan
esvi
lle
La
Cro
sse
Mad
iso
n
Mil
wau
kee
Osh
kosh
-N
een
ah
Rac
ine
Sh
ebo
ygan
Wau
sau
Wis
con
sin
2009 2010

Wisconsin Better Off Than Its Critics Realize

November 6, 2009 58
Wisconsin Among States with an Unemployment Rate Significantly Below US Average
State Unemployment RateRelative To US Average
Significantly Lower (27)About the Same (15)Significantly Higher (9)
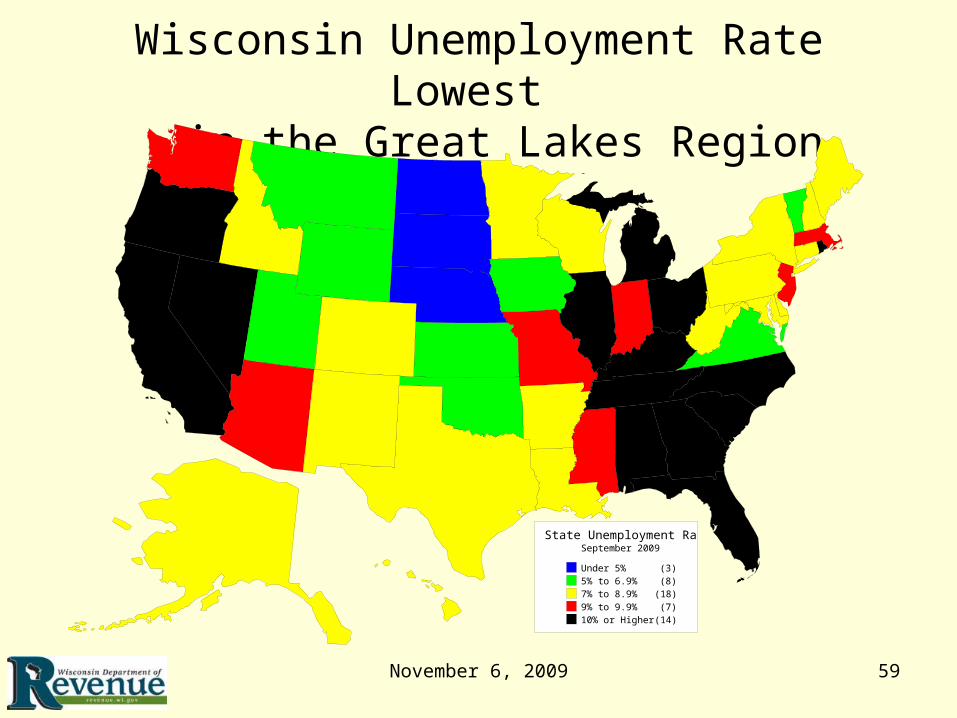
November 6, 2009 59
Wisconsin Unemployment Rate Lowest in the Great Lakes Region
State Unemployment RatesSeptember 2009
Under 5% (3)5% to 6.9% (8)7% to 8.9% (18)9% to 9.9% (7)10% or Higher (14)
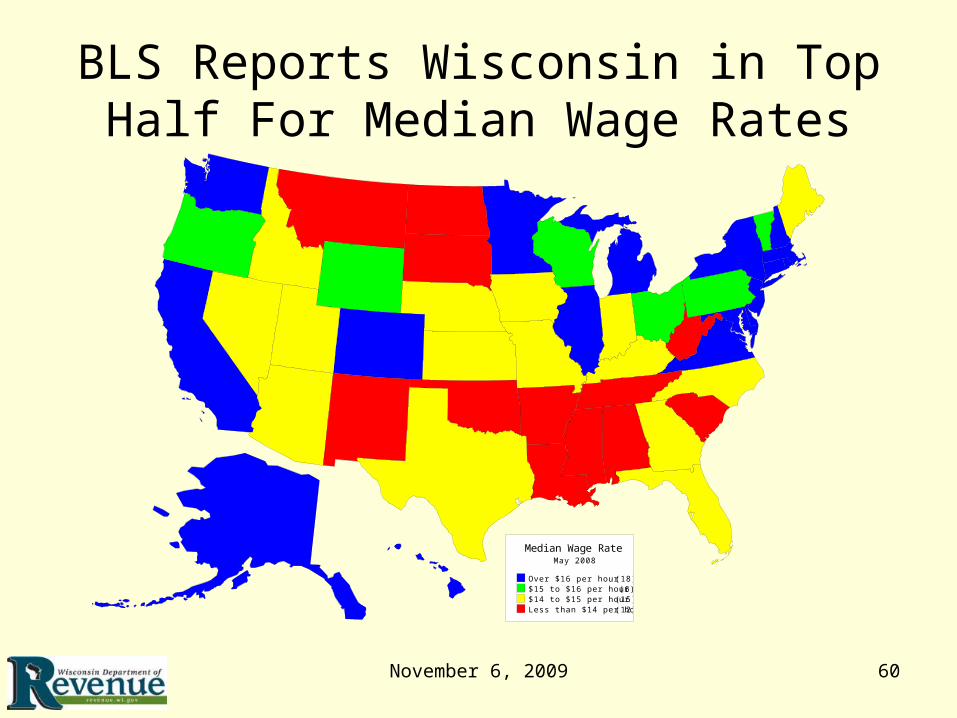
November 6, 2009 60
BLS Reports Wisconsin in Top Half For Median Wage Rates
Median Wage RateMay 2008
Over $16 per hour (18)$15 to $16 per hour (6)$14 to $15 per hour (15)Less than $14 per hour (12)
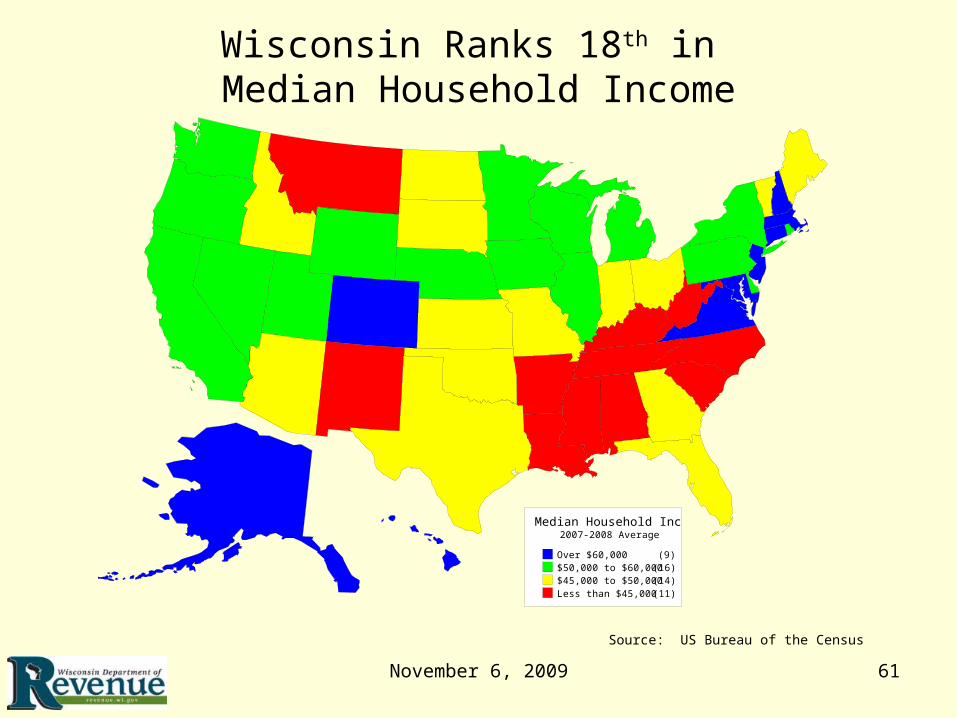
November 6, 2009 61
Wisconsin Ranks 18th in Median Household Income
Source: US Bureau of the Census
Median Household Income2007-2008 Average
Over $60,000 (9)$50,000 to $60,000 (16)$45,000 to $50,000 (14)Less than $45,000 (11)
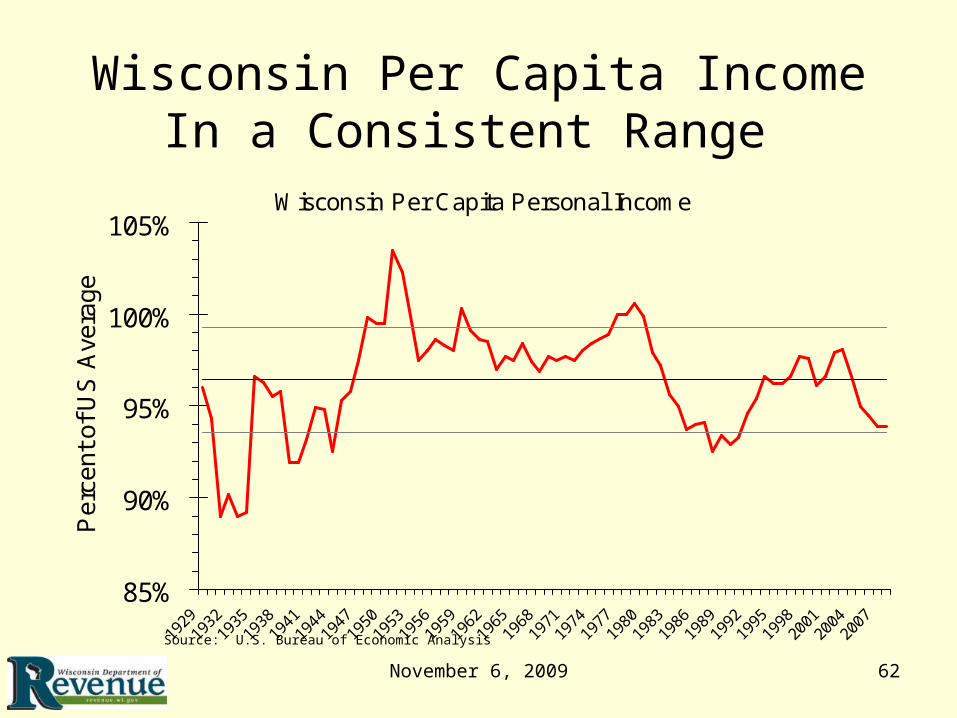
November 6, 2009 62
Wisconsin Per Capita Income In a Consistent Range
Wisconsin Per Capita Personal Income
85%
90%
95%
100%
105%
1929
1932
1935
1938
1941
1944
1947
1950
1953
1956
1959
1962
1965
1968
1971
1974
1977
1980
1983
1986
1989
1992
1995
1998
2001
2004
2007
Pe
rce
nt
of
US
Ave
rag
e
Source: U.S. Bureau of Economic Analysis
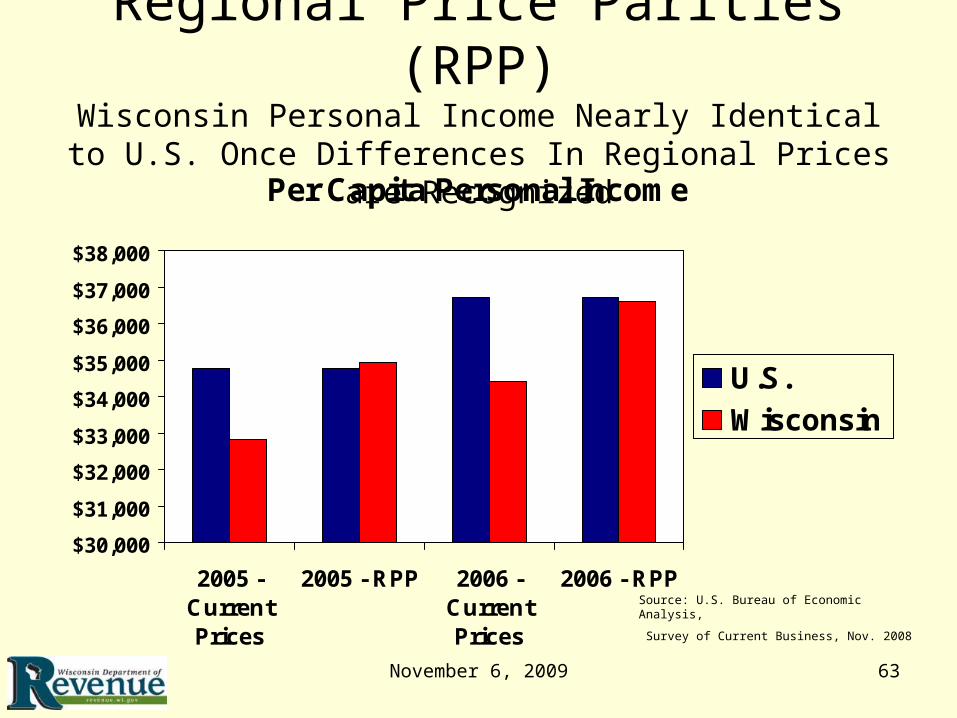
November 6, 2009 63
Regional Price Parities (RPP)Wisconsin Personal Income Nearly Identical to U.S. Once
Differences In Regional Prices are RecognizedPer Capita Personal Income
$30,000
$31,000
$32,000
$33,000
$34,000
$35,000
$36,000
$37,000
$38,000
2005 -CurrentPrices
2005 - RPP 2006 -CurrentPrices
2006 - RPP
U.S.
Wisconsin
Source: U.S. Bureau of Economic Analysis,
Survey of Current Business, Nov. 2008
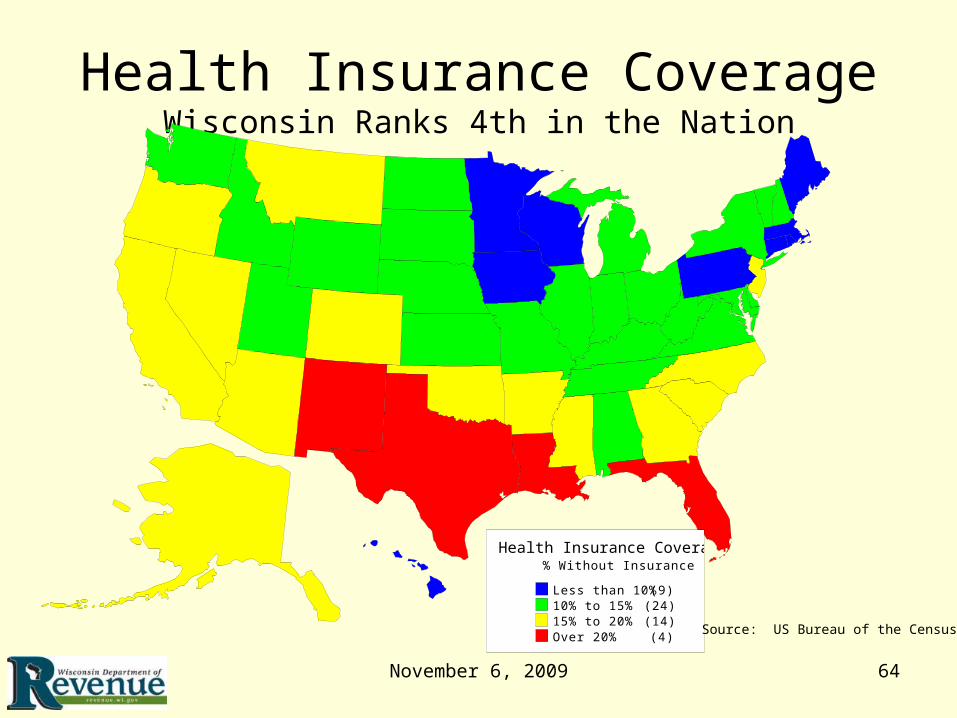
November 6, 2009 64
Health Insurance CoverageWisconsin Ranks 4th in the Nation
Health Insurance Coverage% Without Insurance
Less than 10% (9)10% to 15% (24)15% to 20% (14)Over 20% (4) Source: US Bureau of the Census

November 6, 2009 65
Wisconsin Ranks 30th in Population Growth
Population Change% Chg 2000-2008
Over 10% (13)6.2% to 10% (12)3.2% to 6.1% (12)0% to 3.2% (11)Less than 0% (2)
Source: US Bureau of the Census

November 6, 2009 66
Wisconsin Has Net In-Migration
Net In-Migration (36)Net Out-Migration (15)
Total Migration 2000-2008
Source: US Bureau of the Census
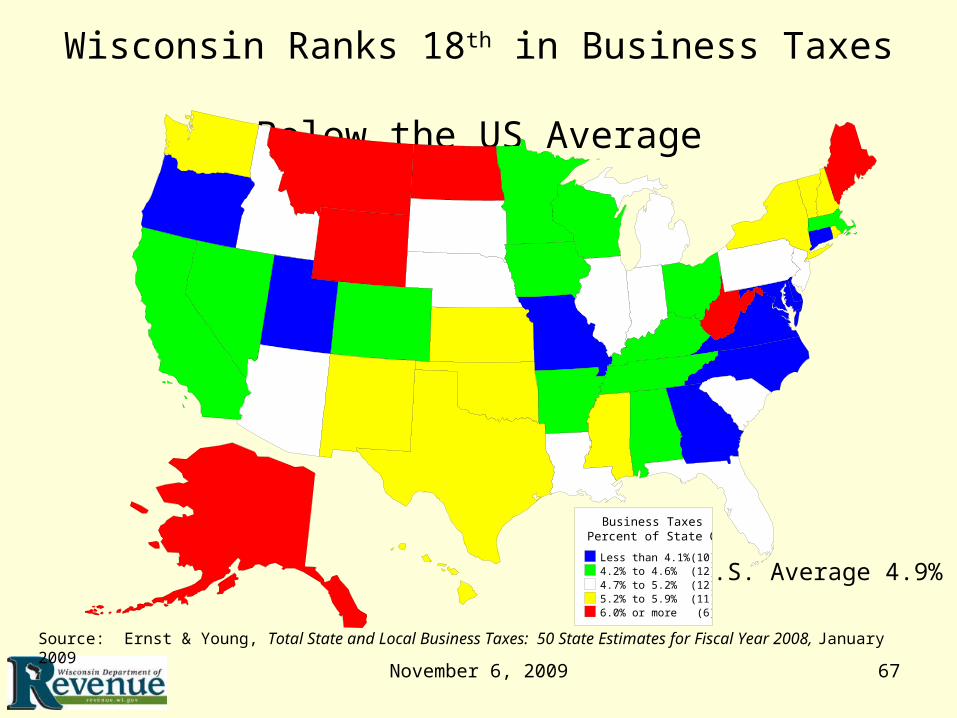
November 6, 2009 67
Wisconsin Ranks 18th in Business Taxes Below the US Average
Source: Ernst & Young, Total State and Local Business Taxes: 50 State Estimates for Fiscal Year 2008, January 2009
U.S. Average 4.9%
Business TaxesPercent of State GDP
Less than 4.1% (10)4.2% to 4.6% (12)4.7% to 5.2% (12)5.2% to 5.9% (11)6.0% or more (6)