nozzle geometry and needle motion session
TRANSCRIPT

ECN1 Workshop 2011 Nozzle Geometry and Needle Motion Session Page 1 of 2
Nozzle Geometry and Needle Motion Session Group Leader: Alan Kastengren (Argonne National Laboratory) Contributors: Christopher Powell (Argonne National Laboratory), Lyle Pickett and Peter Lillo (Sandia National Laboratory), Raul Payri (CMT), Tim Bazyn (Caterpillar) Experimental Techniques It is well-known that the detailed nozzle geometry in spray nozzles can profoundly impact the spray behavior. To better understand the ECN spray behavior, four different measurement techniques have been used to measure the nozzle geometry. Caterpillar has performed static x-ray tomography with a laboratory x-ray source. Argonne has performed phase-contrast imaging of nozzles using a synchrotron undulator source. Sandia has performed optical and SEM microscopy of the nozzle exit region. Finally, CMT has performed silicone molding to characterize the internal geometry. Argonne has also performed time-resolved phase-contrast x-ray imaging of the injector needle motion to characterize the three-dimensional motion of the needle during the injection event. Findings
• X-ray tomography measurements provide the best base dataset for the nozzle geometry, as the data are quantitative, three-dimensional, and cover the entire nozzle tip region.
• X-ray tomography results suffer from some artifacts and drawbacks, which can be corrected using the other measurement techniques.
o The spatial resolution of the tomographic reconstructions (3 µm transverse, 8 µm axially) is insufficient to precisely define the nozzle exit diameter.
o Tomographic reconstruction shows oscillations in the nozzle wall that are not seen in the phase-contrast images.
• Optical microscopy provides the best measure of the nozzle exit shape and size. • SEM looking into the nozzle hole provides perhaps the only feasible non-destructive method to
determine the nozzle surface roughness, but requires dismounting the nozzle from the injector. • Silicone molding has the best potential to determine the nozzle inlet diameter, but requires
dismounting the nozzle from the injector. • Nozzle K-factors vary, but tend to be around 2 – 2.5. The exit diameter of all nozzles seems to
be less than 90 µm, which has important implications regarding the determination of nozzle flow coefficients.
• Tomography and phase-contrast imaging both show a significant narrowing of the nozzles for about 50 µm near the nozzle exit. This seems consistent for the various nozzles.
• The needle motion for each injector is highly repeatable from injection to injection. The needle motion is complex and three-dimensional, with significant oscillatory off-axis motions.
• The axial needle motions are quite similar between all injectors tested. The lateral motions of the needle are unique to each injector.
Recommendations & Future Investigation
• There is a lack of cross comparisons between the different techniques to measure nozzle geometry. Efforts are ongoing to complete a more comprehensive set of measurements with each of the techniques.
• Given the significant asymmetries seen in the nozzle geometry, all ECN experimenters should carefully record the injector orientation for their measurements. The recommended reference is the injector fuel inlet (which also aligns with the flats on the injector).

ECN1 Workshop 2011 Nozzle Geometry and Needle Motion Session Page 2 of 2
• A consistent methodology must be developed to create a reference geometry (preferably in STL format) for use in CFD modeling of internal nozzle flow.

Measurements of ECN Injector Geometry Measurements of ECN Injector Geometry and Needle Motion
Alan Kastengren, Christopher Powell; Argonne National Laboratory
Tim Bazyn; Caterpillar
Raul Payri; CMTy ;
Lyle Pickett, Peter Lillo; Sandia National Laboratories
DOE Vehicle Technologies Program
Team Leader: Gurpreet SinghTeam Leader: Gurpreet Singh
Need for Injector Geometry Data
It is well‐known that imperfections in nozzle geometry have a profound impact on spray behavior
ECN nozzles are 90 µm in diameter; difficult to precisely make holes this small
What do we want to know for modeling and experiment interpretation?
– Hole diameter and length
– K‐factor
– Inlet radius
– Exit condition
– Surface roughness
– Imperfections in geometry: misalignment of hole, defects in machining
Give an overview of several related efforts to measure injector geometryj g y
– Comparison of different techniques
– Recommendations for interpretation of data
Present results of nozzle geometry measurementsPresent results of nozzle geometry measurements
Engine Combustion Network Workshop, Ventura, CA, May 2011
2

X-Ray Tomography: Caterpillar
Use x‐ray tube source to view injector from multiple angles to reconstruct 3‐D geometry
Provides quantitative, 3‐D geometry data throughout nozzle and upstream flow passage
Best way to get baseline geometry, but not perfect
Reconstruction can be complex, but a great deal of work has been done in this area: medical CT scans
Static measurements only
Resolution: original voxels 8 µm, g µinterpolated in reconstruction to 3 µm
Engine Combustion Network Workshop, Ventura, CA, May 2011
3
X-Ray Phase-Contrast Imaging: Argonne
2‐D imaging with synchrotron source
Phase effects accentuate boundaries
– Biases in interface position?
– In tomography measurements as well?
Can perform measurements fast to see injector motionj
Very limited access; less than 2 weeks/year
Resolution: 4‐5 µm per pixel, perhapsResolution: 4 5 µm per pixel, perhaps blurred
Compilation of Phase Contrast Images
Experiment Setup
Injector #211201
Engine Combustion Network Workshop, Ventura, CA, May 2011
4

SEM/Optical Microscopy of Nozzle Exit: Sandia
Microscopic imaging of nozzle exit to examine exit condition
Optical to get exit geometry
Injector 370
SEM to see surface finish?
Only works very region very near the nozzle exit
SEM requires dismounting the nozzle
High resolution: < 0.7 µm optical
lOptical Microscopy Image(20x objective lens)
SEM Images
Engine Combustion Network Workshop, Ventura, CA, May 2011
5
Silicone Molds: CMT
Inject silicone into nozzle, extract, and examine with SEM
SEM images give much higher resolution than x‐ray measurements
Defects in molding process: tears, sagging
Requires dismounting of injector Mold Defectsq g j
Resolution: probably limited by mold fidelityMold Defects
Injector #210675
Image of NozzlePassage
Engine Combustion Network Workshop, Ventura, CA, May 2011
6

Comparisons Between Methods
Injector # Geometry Tomography PC Imaging SEM/Optical Silicone Molds
370 S A S x x370 Spray A Spec. x x
210675 Spray A x x x
210676 Spray A x
210677 Spray A x
210678 Spray A x x
210679 Spray A x xp y
211201 Spray B x x
Engine Combustion Network Workshop, Ventura, CA, May 2011
7
Injector #210675: Phase-Contrast Imaging vs. Silicone MoldsSilicone Molds
Images appear to be of same orientation
PC imaging gives inlet diameter = 106 µm, ili ld i 107silicone mold gives 107 µm
PC imaging gives exit diameter of 86 µm, silicone mold gives 89 µm
Phase Contrast I i
Silicone Mold
Imaging
Engine Combustion Network Workshop, Ventura, CA, May 2011
8

Injector #370: Comparison of SEM, Optical Microscopy and TomographyMicroscopy, and Tomography
SEM (best resolution) and Optical Microscopy (0.7 µm resolution) h l id ti l it h
0.05Comparison of Nozzle Exit Boundaries for Injector 370
show nearly identical exit shape and diameter.
X‐ray tomography shows more i ti m
)
SEMvariation. 0
Y (
mm S
Optical Microscopy.stl (X-Ray Tomography)
Injector 370
-0.05 0 0.05-0.05
X (mm)
X (mm)
SEM and optical microscopy both
Engine Combustion Network Workshop, Ventura, CA, May 2011
9
Optical Microscopy SEM measure 88 mm effective diameter.
Injector #210678: Tomography shows artifact at nozzle exit not measured by optical microscopynozzle exit, not measured by optical microscopy
T h A i l P fil
Exit condition can have artifacts in tomography data.
Tomography Axial Profile vs. MicroscopyInjector #210678
Analysis of the .stl tomography file for effective area shows less variation.
Optical microscopy (0.7 µm res.) preferred over x‐ray tomography to measure exit shape and size.
C i f N l E it B d i f I j t 210678 0 092
0.094
0.05Comparison of Nozzle Exit Boundaries for Injector 210678
)
0.09
0.092
me
ter
[mm
]
0
Y (
mm
)
Optical Microscopy
.stl (X-Ray Tomography)
0 086
0.088
dia
Optical microscopyxray 12/07, CATxray 09/11, CATNew analysis of 12/07 stl: D
Engine Combustion Network Workshop, Ventura, CA, May 2011
10
-0.05 0 0.05-0.05
X (mm)
-0.4 -0.3 -0.2 -0.1 0 0.1
0.086
nozzle axis [mm]
New analysis of 12/07 .stl: Deff

Injectors #210675 and #210679: Tomography vs. Phase Contrast ImagingPhase Contrast Imaging
Diameter results from tomography and phase contrast imaging are quite similar
– Within 1 pixel (4 µm) for phase contrast images
– Both measurements show that #210679 has higher K‐factor and smaller exit diameter
Wh the offset bet een theWhy the offset between the curves, especially for #210679?
– Bias in phase‐contrast images
A i l hift f i l it– Axial shift: reference is nozzle exit, which may not be indexed the same in the measurements
– Error in length scale calibration ofError in length scale calibration of one or both measurements
Engine Combustion Network Workshop, Ventura, CA, May 2011
11
Injector #210679: Tomography vs. Phase Contrast ImagingImaging
Tomography shows waves that aren’t id t i hevident in phase
contrast images
Transition from dl t tneedle seat to sac
blurred in tomography
Engine Combustion Network Workshop, Ventura, CA, May 2011
12

Static Geometry ResultsNozzles K‐factors varyy
– Most KS 2.0 – 2.5
– Not conical; converge a little more quickly near inlet
Exit diameter for all nozzles < 90 µm
All nozzles converge in last 50 µm
We need good measurements at exitWe need good measurements at exit
– Phase contrast and SEM/optical microscopy can help
– 2% change in d = 4% change in area2% change in d 4% change in area
Nozzle Diameter byNozzle Exit Nozzle Diameter by Tomography and Phase
Contrast Imaging
Nozzle ExitPhase Contrast ImageEdge Filter Applied
Engine Combustion Network Workshop, Ventura, CA, May 2011
13
Static Geometry Results (cont.)Inlet radius ~ 25 µm vs x‐ray axialInlet radius 25 µm vs. x‐ray axial spacing of points of 4‐8 µm
– Only a handful of points to fit arc
– Silicone mold is best for this– Silicone mold is best for this
All holes are misaligned
– Turning angle at inlet varies
May cause asymmetry in nozzle flow– May cause asymmetry in nozzle flow
Surface of silicone mold looks reasonably smooth: no evidence of waves seen in tomographywaves seen in tomography
Engine Combustion Network Workshop, Ventura, CA, May 2011
14
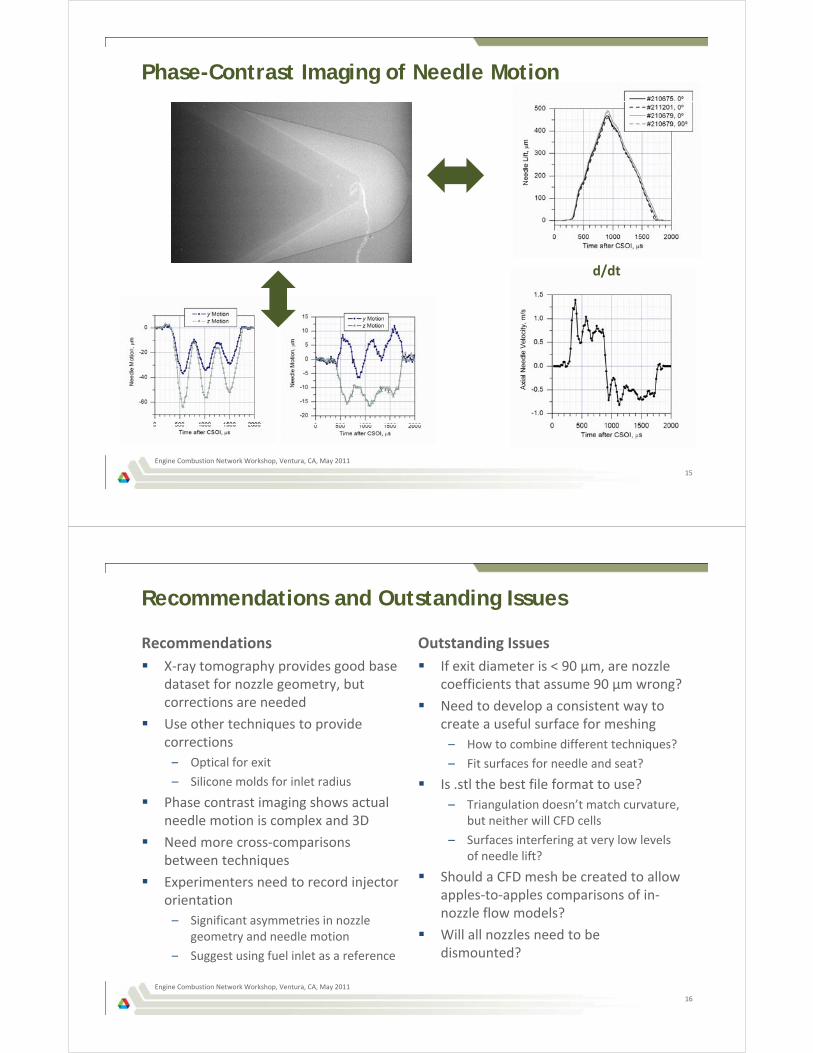
Phase-Contrast Imaging of Needle Motion
d/dt
Mold DefectsInjector #210675
Engine Combustion Network Workshop, Ventura, CA, May 2011
15
Recommendations and Outstanding Issues
Recommendations
X‐ray tomography provides good base dataset for nozzle geometry, but
Outstanding Issues
If exit diameter is < 90 µm, are nozzle coefficients that assume 90 µm wrong?
corrections are needed
Use other techniques to provide corrections
Need to develop a consistent way to create a useful surface for meshing
– How to combine different techniques?
– Optical for exit
– Silicone molds for inlet radius
Phase contrast imaging shows actual needle motion is complex and 3D
– Fit surfaces for needle and seat?
Is .stl the best file format to use?
– Triangulation doesn’t match curvature, but neither will CFD cellsneedle motion is complex and 3D
Need more cross‐comparisons between techniques
Experimenters need to record injector
but neither will CFD cells
– Surfaces interfering at very low levels of needle lift?
Should a CFD mesh be created to allow Experimenters need to record injector orientation
– Significant asymmetries in nozzle geometry and needle motion
apples‐to‐apples comparisons of in‐nozzle flow models?
Will all nozzles need to be dismounted?– Suggest using fuel inlet as a reference dismounted?
Engine Combustion Network Workshop, Ventura, CA, May 2011
16

Conclusions from Discussion
General agreement that the risk of dismounting the nozzles for silicone molding outweighs the benefits
STL file format was agreed to be suitable for a reference geometryg g y
Smoothing will be required to develop a suitable reference geometry
Agreement that the injector fuel inlet is a suitable reference for describing the orientation of the injectorthe orientation of the injector
Engine Combustion Network Workshop, Ventura, CA, May 2011
17