n.p.d.e.s. phase ii virginia beach. local condition area 312 square miles chesapeake bay 98 square...
TRANSCRIPT
N.P.D.E.S. PHASE IIN.P.D.E.S. PHASE II
Virginia Beach
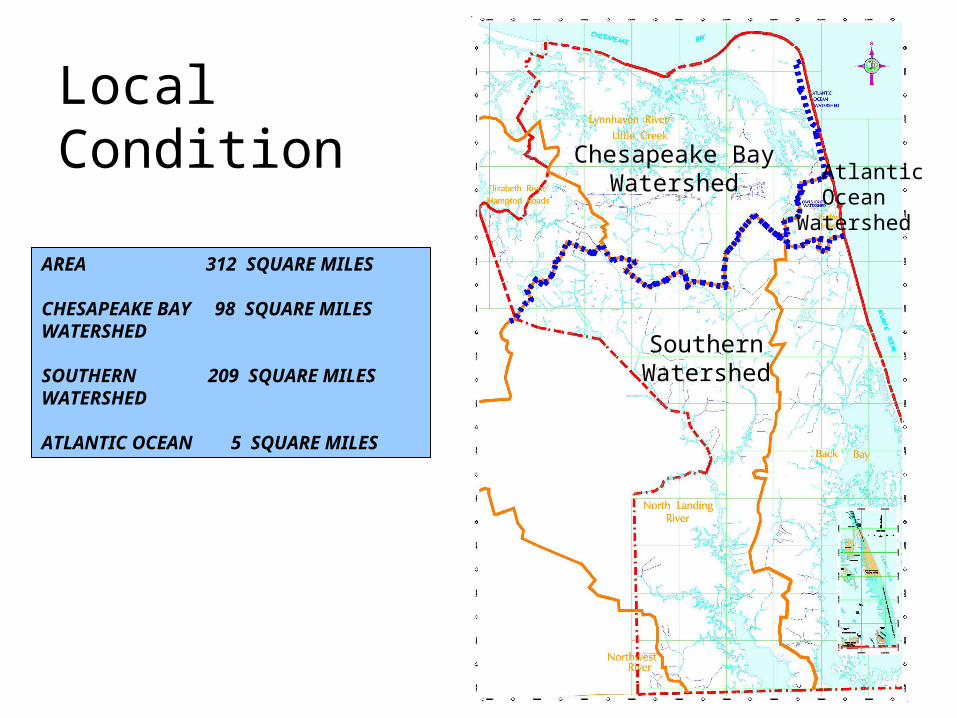
Local Condition
AREA 312 SQUARE MILES
CHESAPEAKE BAY 98 SQUARE MILESWATERSHED
SOUTHERN 209 SQUARE MILESWATERSHED
ATLANTIC OCEAN 5 SQUARE MILES
Chesapeake BayWatershed
SouthernWatershed
AtlanticOcean
Watershed
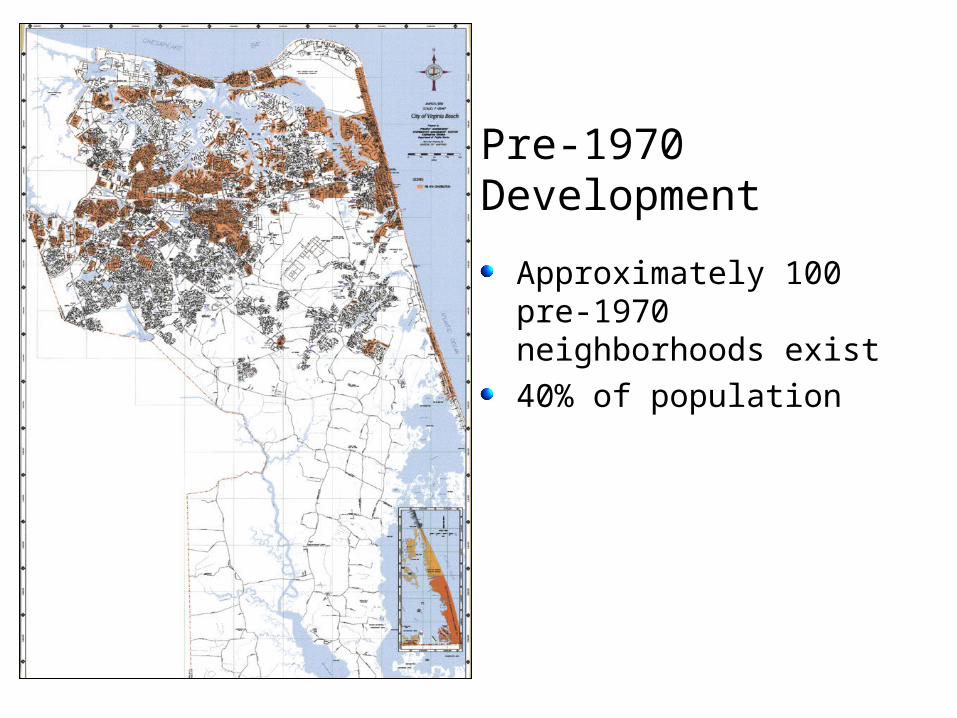
Pre-1970 Development
Approximately 100 pre-1970 neighborhoods exist 40% of population
Department of Agriculture has several programs to promote proper level of pesticides, herbicides and fertilizers.
Commercial Pesticide Applicator re-certification courses
Courses for nitrogen application though trickle irrigation
Lake and Pond management workshops
Promotion of the use of grass filter strips
Promotion of a conservation district Envirothon.
Back Yard Conservation programs
N.P.D.E.S. PHASE IIMinimum Control Measure
N.P.D.E.S. PHASE IIMinimum Control Measure PUBLIC EDUCATION AND OUTREACH
Virginia Beach SWM Activities:

Programs for tire recycling through Virginia Dare Soil and Water Conservation (150 tons of tires).
Active Public Education Programs through:
Boy Scouts Local Harvest Fair
Early Discovery School Groups
Public Education through cooperative education programs with HRPDC – HR Storm Initiative at TV, theater and local events.
N.P.D.E.S. PHASE IIMinimum Control Measure
N.P.D.E.S. PHASE IIMinimum Control Measure PUBLIC EDUCATION AND OUTREACH
Virginia Beach SWM Activities:
Recycling and city wide “Blue Can” pickup contract with Tidewater Fiber (e.g. Tyre Recycling).
“Adopt A” Programs:
Highway Waterway Street
Park Trail Beach
School Ground
Clean the Bay Day (131 miles / 40 tons).
Storm drain stenciling (W.Q. Fish) “Dumping Pollutes”.
N.P.D.E.S. PHASE IIMinimum Control Measure
N.P.D.E.S. PHASE IIMinimum Control Measure PUBLIC PARTICIPATION / INVOLVEMENT
Virginia Beach SWM Activities:
Dry weather field screening; Map grid / consultant testing via annual services contract.
Adopted Stormwater Management Ordinance.
HAZMAT Program; Fire Department / Public Works (371 spill responses)
River Stars Program in cooperation with Elizabeth River Project.
Stormwater Hotline,
Inspectors (12 illicit discharges detected and corrected).
N.P.D.E.S. PHASE IIMinimum Control Measure
N.P.D.E.S. PHASE IIMinimum Control Measure
ILLICIT DISCHARGE DETECTION AND ELIMINATION Virginia Beach SWM Activities:

Construction plan review by DSC 01-02 – 1304 development plans reviewed.
Erosion and Sediment Control plans required.
Land disturbances >5 acres reported to DEQ.
Education and training of construction inspectors for DCR certification
E & S part of all city construction projects.
Site Plan Ordinance.
N.P.D.E.S. PHASE IIMinimum Control Measure
N.P.D.E.S. PHASE IIMinimum Control Measure CONSTRUCTION SITE RUNOFF CONTROL
Virginia Beach SWM Activities:

City’s Standards and Specifications for development requires stormwater treatment and control.
CIP Program constructs regional facilities where possible.
Stormwater Management Master Plan.
N.P.D.E.S. PHASE IIMinimum Control Measure
N.P.D.E.S. PHASE IIMinimum Control Measure
POST-CONSTRUCTION RUNOFF CONTROL Virginia Beach SWM Activities:
City Personnel receive training and certifications to ensure proper use of materials and maintenance methods to prevent or reduce pollution.
Capital Improvement Program includes projects to upgrade or replace those parts of city infrastructure to reduce or prevent pollution
BMP’s are inspected and evaluated to ensure performance while evaluating various methodologies for long term compatibility in the city.
Stormwater Management Master Plan includes planning for future City water quality needs as dictated by the Comprehensive Development Plan.
Proper disposal of all toxic/hazardous waste is performed with regional waste management program as a member of the Southeastern Public Service Authority.
N.P.D.E.S. PHASE IIMinimum Control Measure
N.P.D.E.S. PHASE IIMinimum Control Measure
POLLUTION PREVENTION/GOOD HOUSEKEEPING Virginia Beach SWM Activities:
Established by City Council in December 1992 as part of Capital Improvement Program approval with 7-4 vote
Implementation in July 1993
Separate Bill
Combine With Water/Sewer Bill in January 2004
N.P.D.E.S. PHASE IIStorm Water Utility Fund
N.P.D.E.S. PHASE IIStorm Water Utility Fund
HISTORY OF STORM WATER FUND
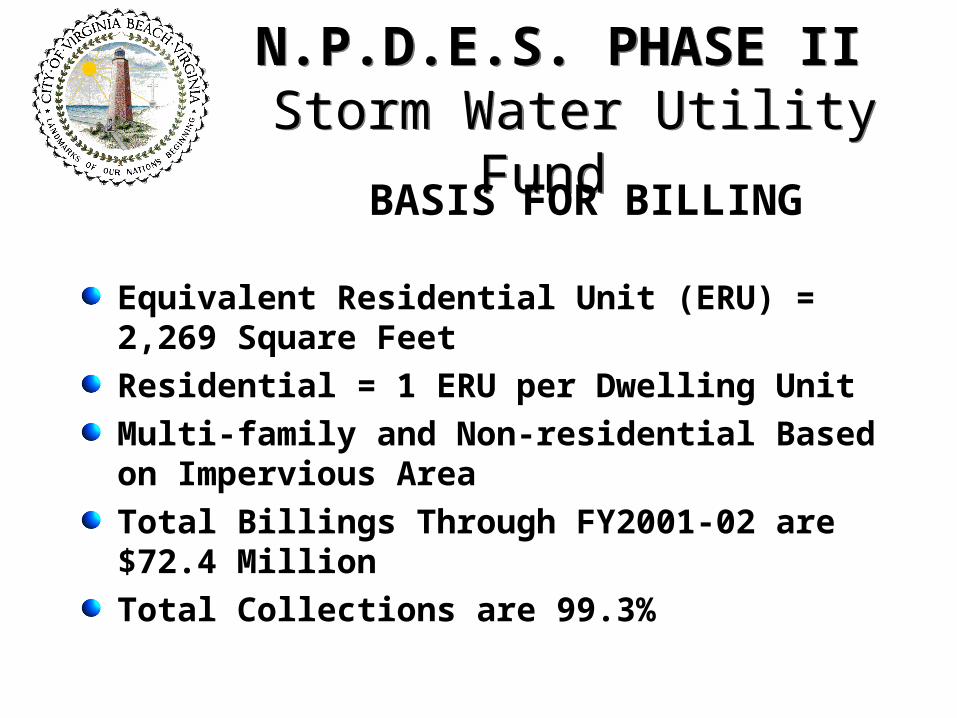
Equivalent Residential Unit (ERU) = 2,269 Square Feet
Residential = 1 ERU per Dwelling Unit
Multi-family and Non-residential Based on Impervious Area
Total Billings Through FY2001-02 are $72.4 Million
Total Collections are 99.3%
N.P.D.E.S. PHASE II Storm Water Utility Fund
N.P.D.E.S. PHASE II Storm Water Utility Fund
BASIS FOR BILLING
N.P.D.E.S. PHASE II Storm Water Utility Fund
N.P.D.E.S. PHASE II Storm Water Utility Fund
CITY OF VIRGINIA BEACH
STORM WATER MANAGEMENT SERVICE
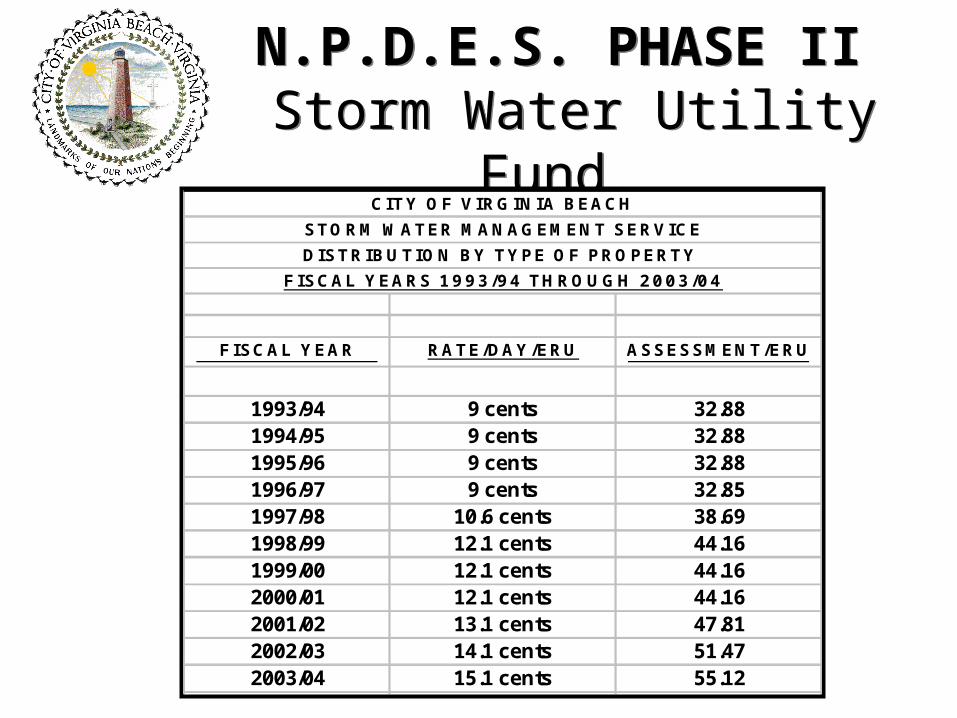
DISTRIBUTION BY TYPE OF PROPERTY
FISCAL YEARS 1993/94 THROUGH 2003/04
FISCAL YEAR RATE/DAY/ERU ASSESSMENT/ERU
1993/94 9 cents 32.881994/95 9 cents 32.881995/96 9 cents 32.881996/97 9 cents 32.851997/98 10.6 cents 38.691998/99 12.1 cents 44.161999/00 12.1 cents 44.162000/01 12.1 cents 44.162001/02 13.1 cents 47.812002/03 14.1 cents 51.472003/04 15.1 cents 55.12
N.P.D.E.S. PHASE II Storm Water Utility Fund
N.P.D.E.S. PHASE II Storm Water Utility Fund
CITY OF VIRGINIA BEACH
STORM WATER MANAGEMENT SERVICE
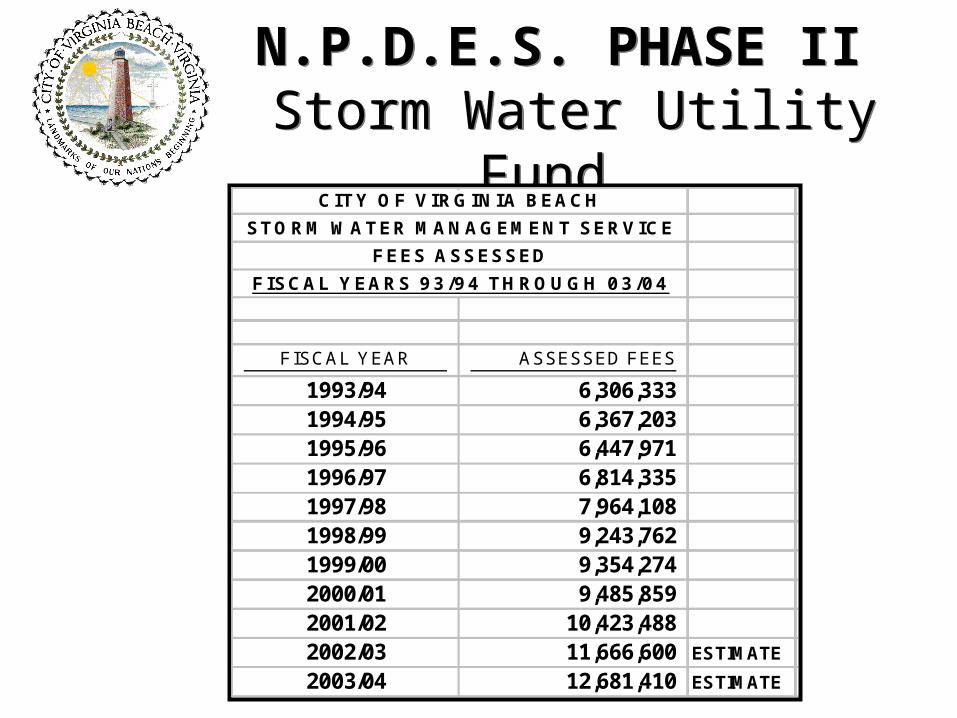
FEES ASSESSED
FISCAL YEARS 93/94 THROUGH 03/04
FISCAL Y EAR ASSESSED FEES
1993/94 6,306,333 1994/95 6,367,203 1995/96 6,447,971 1996/97 6,814,335 1997/98 7,964,108 1998/99 9,243,762 1999/00 9,354,274 2000/01 9,485,859 2001/02 10,423,488 2002/03 11,666,600 ESTIMATE
2003/04 12,681,410 ESTIMATE
N.P.D.E.S. PHASE II Storm Water Utility Fund
N.P.D.E.S. PHASE II Storm Water Utility Fund
CITY OF VIRGINIA BEACH
STORM WATER MANAGEMENT SERVICE
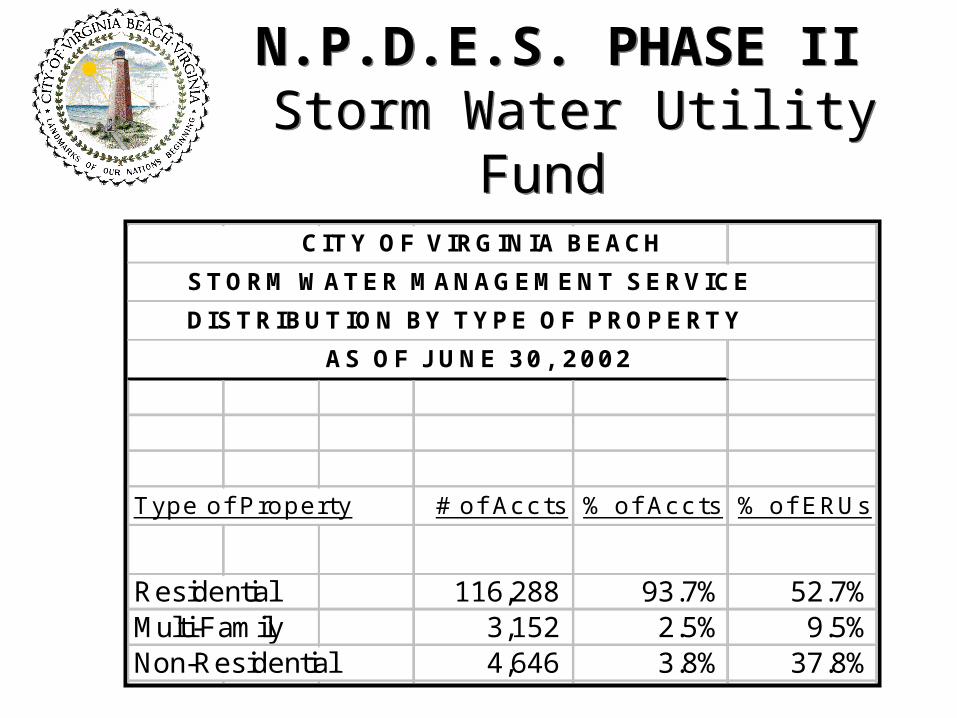
DISTRIBUTION BY TYPE OF PROPERTY
AS OF J UNE 30, 2002
Type of P roperty # of Accts % of Accts % of ERUs
Residential 116,288 93.7% 52.7%Multi-Family 3,152 2.5% 9.5%Non-Residential 4,646 3.8% 37.8%
N.P.D.E.S. PHASE II Storm Water Utility Fund
N.P.D.E.S. PHASE II Storm Water Utility Fund
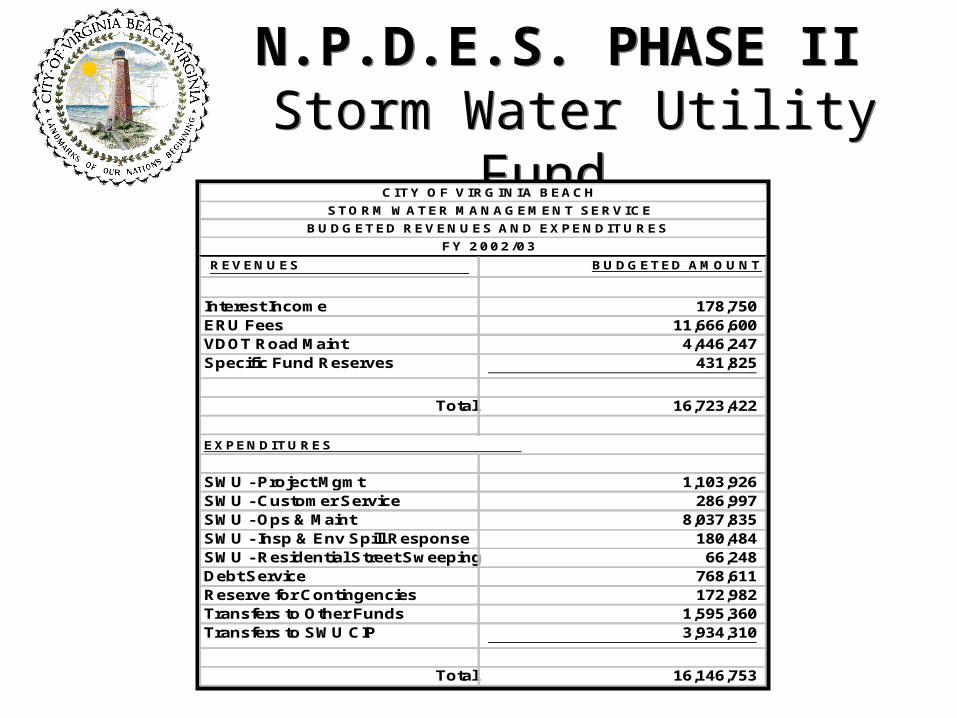
CITY OF VIRGINIA BEACH
STORM WATER MANAGEMENT SERVICE
BUDGETED REVENUES AND EXPENDITURES
FY 2002/03
REVENUES BUDGETED AMOUNT
Interest Income 178,750 ERU Fees 11,666,600 VDOT Road Maint 4,446,247 Specific Fund Reserves 431,825
Total 16,723,422
EX PEN DI T U RES
SWU - Project Mgmt 1,103,926 SWU - Customer Service 286,997 SWU - Ops & Maint 8,037,835 SWU - Insp & Env Spill Response 180,484 SWU - Residential Street Sweeping 66,248 Debt Service 768,611 Reserve for Contingencies 172,982 Transfers to Other Funds 1,595,360 Transfers to SWU CIP 3,934,310
Total 16,146,753

N.P.D.E.S. PHASE II Storm Water Utility Fund
N.P.D.E.S. PHASE II Storm Water Utility Fund
CITY OF VIRGINIA BEACH, VIRGINIAOPERATING DATAas of June 30, 2002
$10,000,000 Storm Water Utility Revenue Bonds
Series of 2000
$14,000,000 Storm Water Utility Revenue Bonds
Series of 2005

Get unanimous approval by Council/Board
Have adequate staffing for start-up
Don’t underestimate the demands of your customers
You can never charge enough to meet all your needs
Know how you are going to bill before you get started
Customers will not pay just because you send a bill
Do it anyway - it is still a good idea
N.P.D.E.S. PHASE II Storm Water Utility Fund
N.P.D.E.S. PHASE II Storm Water Utility Fund
LESSONS LEARNED
N.P.D.E.S. PHASE IIStorm Water CIP
N.P.D.E.S. PHASE IIStorm Water CIP
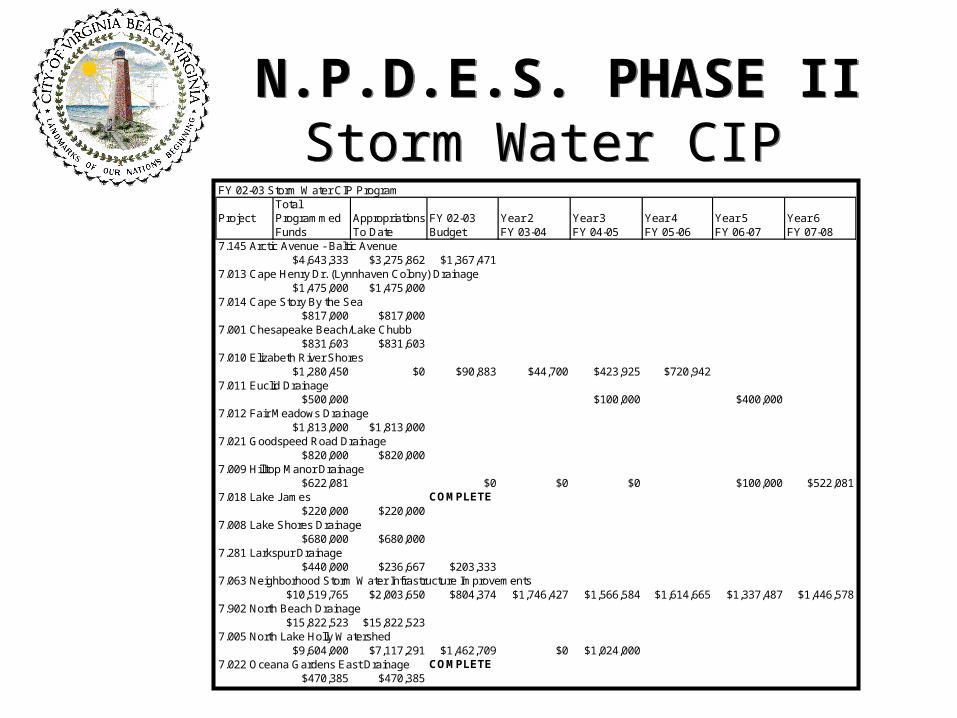
FY 02-03 Storm Water CIP ProgramTotal
Project Programmed Appropriations FY 02-03 Year 2 Year 3 Year 4 Year 5 Year 6Funds To Date Budget FY 03-04 FY 04-05 FY 05-06 FY 06-07 FY 07-08
7.145 Arctic Avenue - Baltic Avenue$4,643,333 $3,275,862 $1,367,471
7.013 Cape Henry Dr. (Lynnhaven Colony) Drainage$1,475,000 $1,475,000
7.014 Cape Story By the Sea$817,000 $817,000
7.001 Chesapeake Beach/Lake Chubb$831,603 $831,603
7.010 Elizabeth River Shores$1,280,450 $0 $90,883 $44,700 $423,925 $720,942
7.011 Euclid Drainage$500,000 $100,000 $400,000
7.012 Fair Meadows Drainage$1,813,000 $1,813,000
7.021 Goodspeed Road Drainage$820,000 $820,000
7.009 Hilltop Manor Drainage$622,081 $0 $0 $0 $100,000 $522,081
7.018 Lake James COMPLETE$220,000 $220,000
7.008 Lake Shores Drainage$680,000 $680,000
7.281 Larkspur Drainage$440,000 $236,667 $203,333
7.063 Neighborhood Storm Water Infrastructure Improvements$10,519,765 $2,003,650 $804,374 $1,746,427 $1,566,584 $1,614,665 $1,337,487 $1,446,578
7.902 North Beach Drainage$15,822,523 $15,822,523
7.005 North Lake Holly Watershed$9,604,000 $7,117,291 $1,462,709 $0 $1,024,000
7.022 Oceana Gardens East Drainage COMPLETE$470,385 $470,385

N.P.D.E.S. PHASE II Storm Water CIP
N.P.D.E.S. PHASE II Storm Water CIP
FY 02-03 Storm Water CIP ProgramTotal
Project Programmed Appropriations FY 02-03 Year 2 Year 3 Year 4 Year 5 Year 6Funds To Date Budget FY 03-04 FY 04-05 FY 05-06 FY 06-07 FY 07-08
7.145 Arctic Avenue - Baltic Avenue$4,643,333 $3,275,862 $1,367,471
7.013 Cape Henry Dr. (Lynnhaven Colony) Drainage$1,475,000 $1,475,000
7.014 Cape Story By the Sea$817,000 $817,000
7.001 Chesapeake Beach/Lake Chubb$831,603 $831,603
7.010 Elizabeth River Shores$1,280,450 $0 $90,883 $44,700 $423,925 $720,942
7.011 Euclid Drainage$500,000 $100,000 $400,000
7.012 Fair Meadows Drainage$1,813,000 $1,813,000
7.021 Goodspeed Road Drainage$820,000 $820,000
7.009 Hilltop Manor Drainage$622,081 $0 $0 $0 $100,000 $522,081
7.018 Lake James COMPLETE$220,000 $220,000
7.008 Lake Shores Drainage$680,000 $680,000
7.281 Larkspur Drainage$440,000 $236,667 $203,333
7.063 Neighborhood Storm Water Infrastructure Improvements$10,519,765 $2,003,650 $804,374 $1,746,427 $1,566,584 $1,614,665 $1,337,487 $1,446,578
7.902 North Beach Drainage$15,822,523 $15,822,523
7.005 North Lake Holly Watershed$9,604,000 $7,117,291 $1,462,709 $0 $1,024,000
7.022 Oceana Gardens East Drainage COMPLETE$470,385 $470,385
7.960 Oceana Gardens West Drainage
$2,591,963 $1,280,746 $1,311,2177.062 Pembroke Manor Drainage
$500,000 $100,000 $400,0007.181 Pocahontas Village COMPLETE
$1,512,163 $1,512,1637.067 Primary System Infrastructure Improvements
$7,792,713 $835,000 $1,158,465 $1,164,963 $1,171,502 $1,178,082 $1,184,701 $1,100,0007.027 SWM Master Planning, Analysis, and Inventory
$427,000 $427,0007.144 Sandbridge Drainage COMPLETE
$981,625 $981,6257.016 South Lake Holly Watershed
$8,629,400 $350,000 $720,529 $375,000 $3,639,700 $3,544,171 $07.024 Southern Canal/Lead Ditch and Culvert Improvements
$900,000 $100,000 $100,000 $250,000 $250,000 $200,0007.004 Storm Water Infrastructure Rehabilitation
$1,895,427 $650,000 $50,000 $50,000 $50,000 $195,427 $450,000 $450,0007.183 Storm Water Quality Enhancements
$1,897,444 $737,099 $57,075 $22,120 $57,075 $107,075 $467,000 $450,0007.025 Upper West Neck Creek Improvements
$700,000 $500,000 $200,0007.091 Residential Drainage Cost Participation Program
$200,000 $200,000
TOTAL $78,586,875 $42,956,614 $5,694,310 $5,059,956 $4,768,086 $7,705,891 $7,833,359 $4,568,659
N.P.D.E.S. PHASE II Storm Water CIP
N.P.D.E.S. PHASE II Storm Water CIP
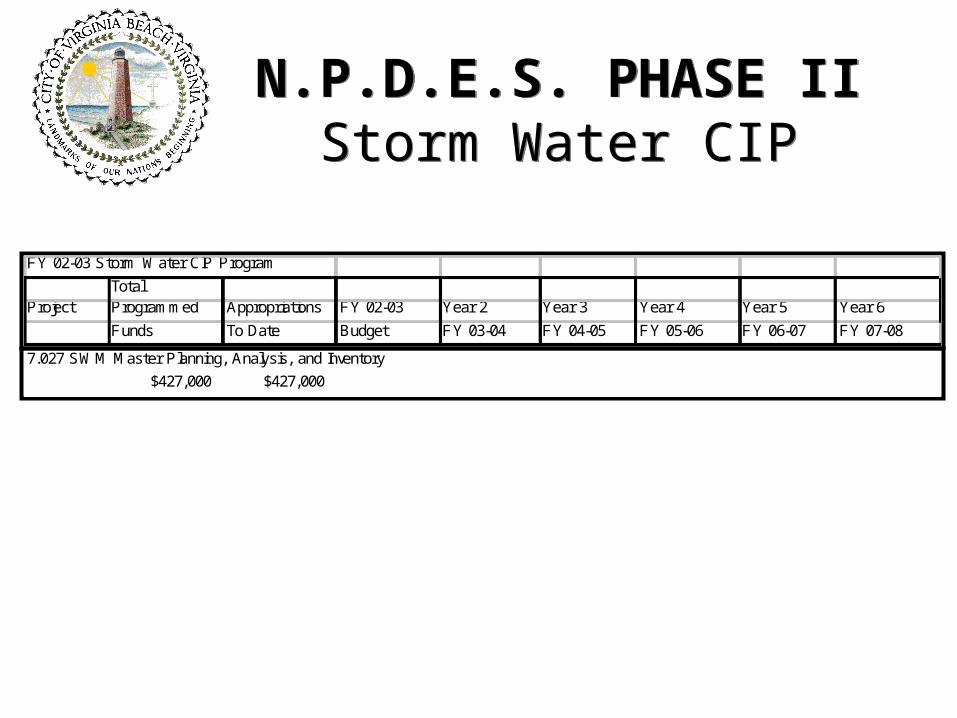
FY 02-03 Storm Water CIP Program
TotalProject Programmed Appropriations FY 02-03 Year 2 Year 3 Year 4 Year 5 Year 6
Funds To Date Budget FY 03-04 FY 04-05 FY 05-06 FY 06-07 FY 07-08
7.027 SWM Master Planning, Analysis, and Inventory
$427,000 $427,000
N.P.D.E.S. PHASE II Storm Water CIP
N.P.D.E.S. PHASE II Storm Water CIP
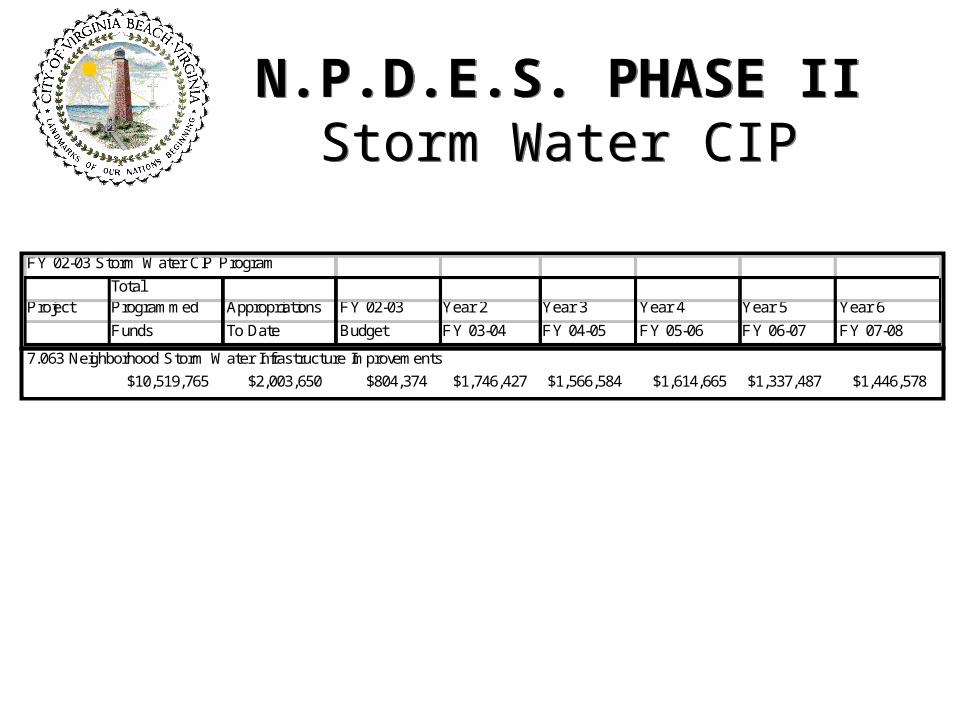
FY 02-03 Storm Water CIP Program
TotalProject Programmed Appropriations FY 02-03 Year 2 Year 3 Year 4 Year 5 Year 6
Funds To Date Budget FY 03-04 FY 04-05 FY 05-06 FY 06-07 FY 07-08
7.063 Neighborhood Storm Water Infrastructure Improvements
$10,519,765 $2,003,650 $804,374 $1,746,427 $1,566,584 $1,614,665 $1,337,487 $1,446,578

N.P.D.E.S. PHASE II Storm Water CIP
N.P.D.E.S. PHASE II Storm Water CIP
FY 02-03 Storm Water CIP Program
TotalProject Programmed Appropriations FY 02-03 Year 2 Year 3 Year 4 Year 5 Year 6
Funds To Date Budget FY 03-04 FY 04-05 FY 05-06 FY 06-07 FY 07-08
7.004 Storm Water Infrastructure Rehabilitation
$1,895,427 $650,000 $50,000 $50,000 $50,000 $195,427 $450,000 $450,000
N.P.D.E.S. PHASE II Storm Water CIP
N.P.D.E.S. PHASE II Storm Water CIP
FY 02-03 Storm Water CIP Program
TotalProject Programmed Appropriations FY 02-03 Year 2 Year 3 Year 4 Year 5 Year 6
Funds To Date Budget FY 03-04 FY 04-05 FY 05-06 FY 06-07 FY 07-08
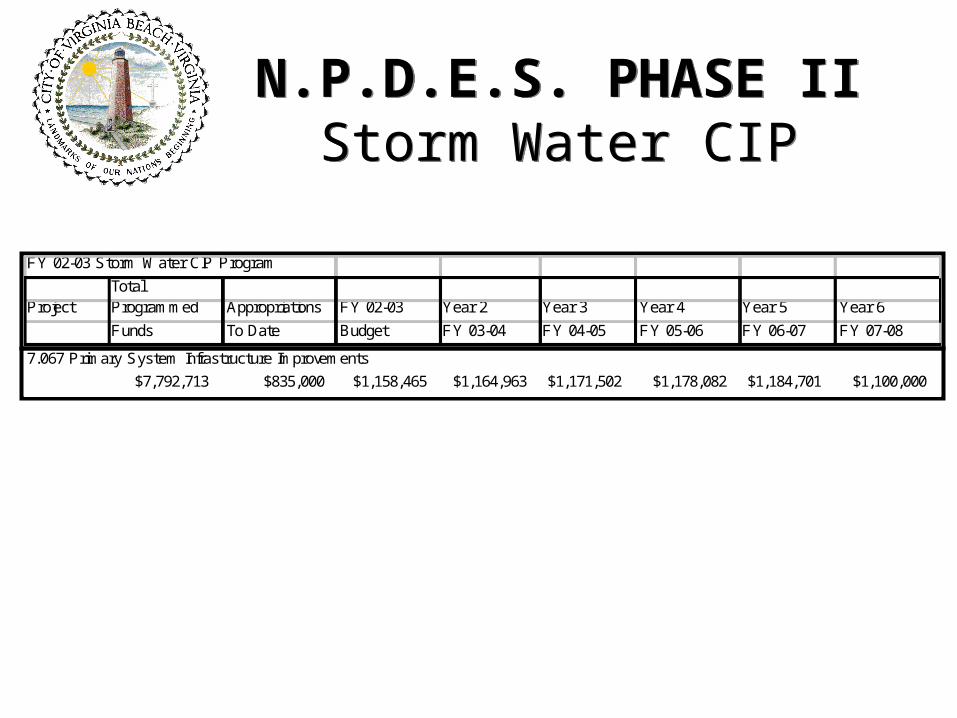
7.067 Primary System Infrastructure Improvements
$7,792,713 $835,000 $1,158,465 $1,164,963 $1,171,502 $1,178,082 $1,184,701 $1,100,000

N.P.D.E.S. PHASE II Storm Water CIP
N.P.D.E.S. PHASE II Storm Water CIP
FY 02-03 Storm Water CIP Program
TotalProject Programmed Appropriations FY 02-03 Year 2 Year 3 Year 4 Year 5 Year 6
Funds To Date Budget FY 03-04 FY 04-05 FY 05-06 FY 06-07 FY 07-08
7.091 Residential Drainage Cost Participation Program
$200,000 $200,000
N.P.D.E.S. PHASE II Storm Water CIP
N.P.D.E.S. PHASE II Storm Water CIP
FY 02-03 Storm Water CIP Program
TotalProject Programmed Appropriations FY 02-03 Year 2 Year 3 Year 4 Year 5 Year 6
Funds To Date Budget FY 03-04 FY 04-05 FY 05-06 FY 06-07 FY 07-08
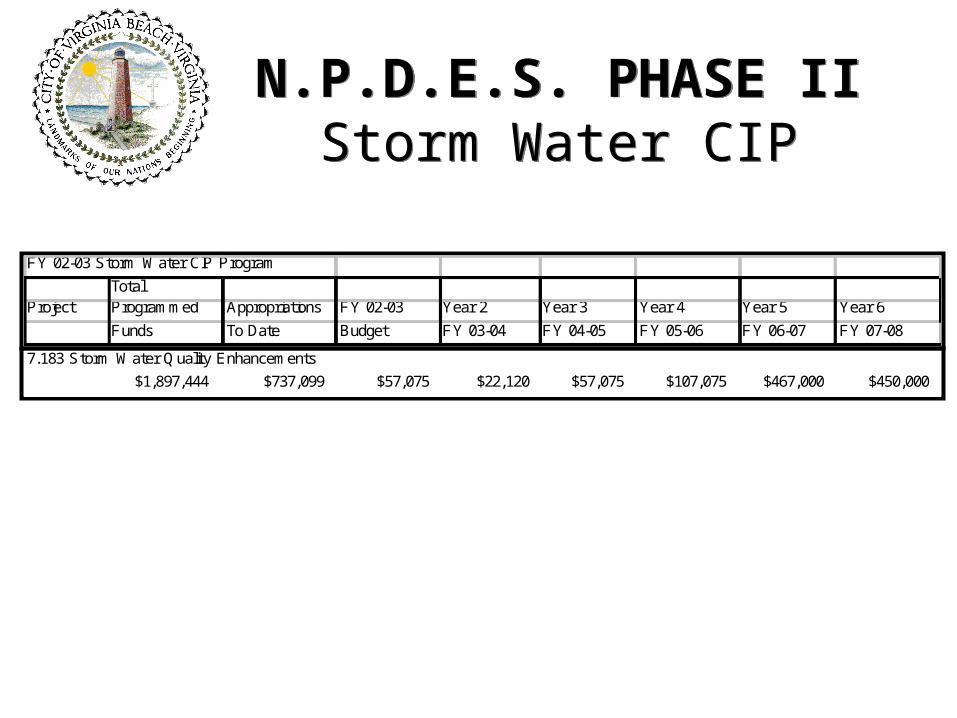
7.183 Storm Water Quality Enhancements
$1,897,444 $737,099 $57,075 $22,120 $57,075 $107,075 $467,000 $450,000
N.P.D.E.S. PHASE II Storm Water CIP
N.P.D.E.S. PHASE II Storm Water CIP
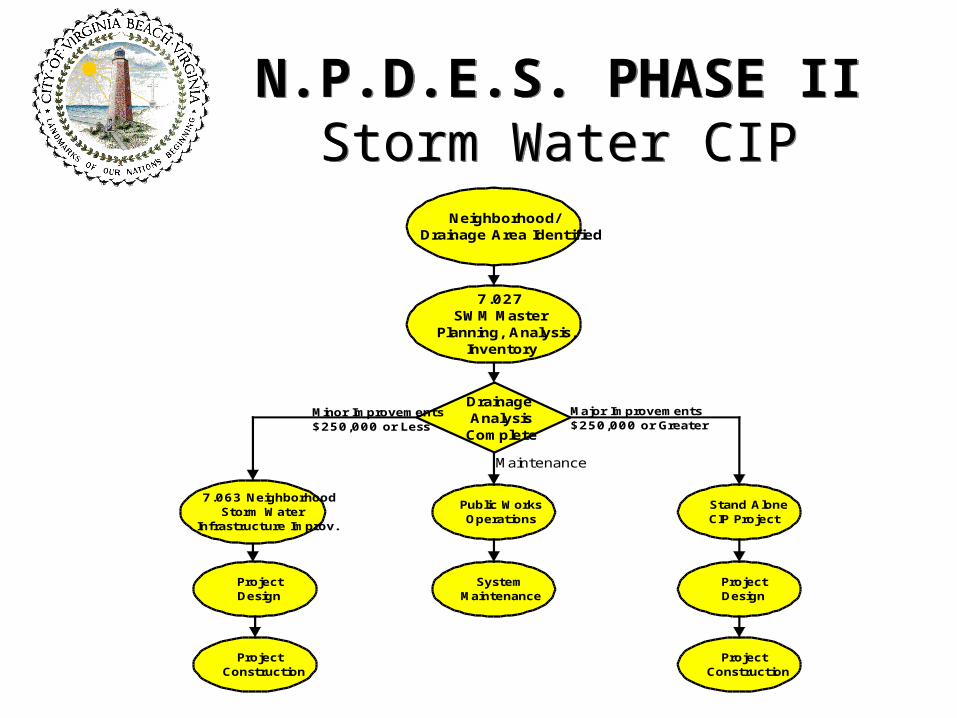
Major Improvements$250,000 or Greater
DrainageAnalysisComplete
Neighborhood/Drainage Area Identified
7.027SWM Master
Planning, Analysis,Inventory
Public WorksOperations
SystemMaintenance
7.063 NeighborhoodStorm Water
Infrastructure Improv.
ProjectDesign
ProjectConstruction
Stand AloneCIP Project
ProjectDesign
ProjectConstruction
Minor Improvements$250,000 or Less
Maintenance
N.P.D.E.S. PHASE IIN.P.D.E.S. PHASE II
Questions