npv model and analyzer - evaluateevaluategroup.com/ux/help/npvmethodology.pdf · this document...
TRANSCRIPT

This document (EvaluatePharma® NPV Model and Analyzer: User Guide to Methodology) is the property of EvaluatePharma Ltd. All copies which are downloaded from the EvaluatePharma® website (www.evaluatepharma.com) shall remain the property of EvaluatePharma Ltd. No copies may be made of this document except for personal use without the prior written consent of EvaluatePharma Ltd. Distribution of this document to non-registered users of EvaluatePharma® is prohibited without the prior written consent of EvaluatePharma Ltd.
© EvaluatePharma Ltd., 11-29 Fashion Street, London E1 6PX
NPV Model and Analyzer
User Guide to Methodology
July 2015

STRICTLY CONFIDENTIAL PAGE 2 JULY 2015
This document (EvaluatePharma® NPV Model and Analyzer: User Guide to Methodology) is the property of EvaluatePharma Ltd. All copies which are downloaded from the EvaluatePharma® website (www.evaluatepharma.com) shall remain the property of EvaluatePharma Ltd. No copies may be made of this document except for personal use without the prior written consent of EvaluatePharma Ltd. Distribution of this document to non-registered users of EvaluatePharma® is prohibited without the prior written consent of EvaluatePharma Ltd.
© EvaluatePharma Ltd., 11-29 Fashion Street, London E1 6P
Table of Contents
TABLE OF CONTENTS ................................................................................................................................................. 2
OVERVIEW ...................................................................................................................................................................... 3
INTRODUCTION ............................................................................................................................................................... 3 NPVS FROM EVALUATEPHARMA® ALPHA ................................................................................................................ 3 WHAT IS THE NET PRESENT VALUE (NPV) OF A PRODUCT? .................................................................................... 3
NPV INPUTS & DETAILED METHODOLOGY ..................................................................................................... 5
COMPONENTS OF THE CALCULATION ......................................................................................................................... 5 PROJECTED SALES (USA/ EX-USA) FORECAST TO 2029 .......................................................................................... 5 INPUTS INTO USA/ EX-USA SALES PROJECTION ....................................................................................................... 6
1. Consensus product forecast to 2014 (USA & Ex-USA) ................................................................................... 6 2. Patent Date (USA & Ex-USA) ........................................................................................................................... 6 3. Sales Erosion Algorithms .................................................................................................................................. 7 4. Terminal Value ................................................................................................................................................. 10
COST ELEMENTS .......................................................................................................................................................... 11 5. Cost of Goods Sold ........................................................................................................................................... 11 6. Royalty Payments (USA/ Ex-USA) .................................................................................................................. 15 7. Selling, General & Administration (SG&A) Costs ......................................................................................... 15 8. R&D Costs ....................................................................................................................................................... 21 9. Profit Sharing Agreements .............................................................................................................................. 21
OTHER REVENUES (ROYALTY, ALLIANCE/ CO-PROMOTION & JV INCOME) ....................................................... 22 Tax Rate .................................................................................................................................................................... 23
DISCOUNT RATE ........................................................................................................................................................... 24
RISK ADJUSTMENTS ................................................................................................................................................. 26
WHAT ARE THE APPROPRIATE RISK ADJUSTMENTS? ............................................................................................ 26 ADJUSTING ANALYST FORECASTS FOR THE PROBABILITY TO LAUNCH ............................................................... 26 VIEWING ADJUSTED AND UNADJUSTED CONSENSUS SALES FORECASTS .............................................................. 29
NPV EXAMPLES: DATA OUTPUT & INTERPRETATION....................................................................................... 31
NPV ANALYSIS: COMPANY SUMMARY PAGE .......................................................................................................... 31 Interpretation ........................................................................................................................................................... 33
NPV ANALYSIS: PRODUCT SUMMARY PAGE ........................................................................................................... 33 Interpretation ........................................................................................................................................................... 35 Transparency of the NPV Calculation ..................................................................................................................... 36
STRICTLY CONFIDENTIAL PAGE 3 JULY 2015
This document (EvaluatePharma® NPV Model and Analyzer: User Guide to Methodology) is the property of EvaluatePharma Ltd. All copies which are downloaded from the EvaluatePharma® website (www.evaluatepharma.com) shall remain the property of EvaluatePharma Ltd. No copies may be made of this document except for personal use without the prior written consent of EvaluatePharma Ltd. Distribution of this document to non-registered users of EvaluatePharma® is prohibited without the prior written consent of EvaluatePharma Ltd.
© EvaluatePharma Ltd., 11-29 Fashion Street, London E1 6P
Overview
Introduction
Over the last two decades Net Present Value (NPV) analysis has become a standard technique for
product valuations within the pharmaceutical and biotechnology industry. The nature of the
industry lends itself to this approach - biopharmaceutical companies’ success or failure is often
determined product by product, and stakeholders frequently analyse companies on this basis (how
much is a particular in-licensed product worth, or what is the impact of early patent loss on a
blockbuster product, for example), with the result that there is a plethora of data available for
individual products (sales, forecasts, patent information, technical appraisals, etc.).
NPVs from EvaluatePharma® Alpha
From November 2007, product NPV estimations have been available within a new service from EvaluatePharma®, called EvaluatePharma® Alpha. Features of the NPV capability within this service include:
Global coverage: Product NPVs for 3,000+ products across all major companies and
therapy areas
A sophisticated and transparent methodology driven by
Analyst consensus forecasts for sales and
EvaluatePharma®’s algorithms for sales growth and erosion beyond the
consensus forecast period, based on product composition (chemical or
biologic) geography (US or Ex-US), and considering events such as patent
expiration and timing of peak sales
Evaluate Pharma cost assumptions and discount rate
Presentation of NPVs as a percentage of company share price with daily updates
Proprietary software integrates the analysis into EvaluatePharma®’s industry standard
platform
Online interactive NPV Analyzer that allows users to input their own assumptions and /
or change the default assumptions to model events such as approval delays, generic
competition, and assess impact on company market valuations
Ability to create, annotate and save multiple scenarios and download into excel.
This guide summarises the methodology behind the EvaluatePharma® NPV Analyzer. It assumes
a basic level of understanding of the concept of the time value of money and the math behind net
present value calculations. These basic concepts can be found in most finance reference manuals
or introductory text books.
What is the Net Present Value (NPV) of a Product?
Pharmaceutical products are assets that over the course of their life-cycle contribute to the cash
flow of the company that owns them. Depending on where the product is in its life cycle, it can
either absorb funds (as it does during the development phase and during early market adoption,
when costs exceed sales) or be cash generative (i.e., producing sales that exceed costs) once
established in the marketplace. The NPV of a product is simply the sum of the present values of
STRICTLY CONFIDENTIAL PAGE 4 JULY 2015
This document (EvaluatePharma® NPV Model and Analyzer: User Guide to Methodology) is the property of EvaluatePharma Ltd. All copies which are downloaded from the EvaluatePharma® website (www.evaluatepharma.com) shall remain the property of EvaluatePharma Ltd. No copies may be made of this document except for personal use without the prior written consent of EvaluatePharma Ltd. Distribution of this document to non-registered users of EvaluatePharma® is prohibited without the prior written consent of EvaluatePharma Ltd.
© EvaluatePharma Ltd., 11-29 Fashion Street, London E1 6P
the annual future cash flows expected over the life of the product. Mathematically this can be
expressed as:
NPV =CFt / (1 + i)t *
Where t = time of the cash flow, i = the discount rate and CFt = the cash flow at time t
Any NPV calculation must begin with estimates of a product’s future sales and costs. Within EvaluatePharma® we begin with analyst consensus sales forecasts, to 2014. Sales beyond 2014, costs and resulting cash flows are then projected over the life of the product to 2029. Terminal growth methodology is applied to calculate the value of any cash flows beyond 2029. A discount rate is then applied to all cash flows to express them in present value terms. The sum of these values is the product’s NPV.
*Note: this formula shows the calculation of NPV assuming discrete annual compounding. The NPV Analyzer employs continuous compounding, which produces more precise results.
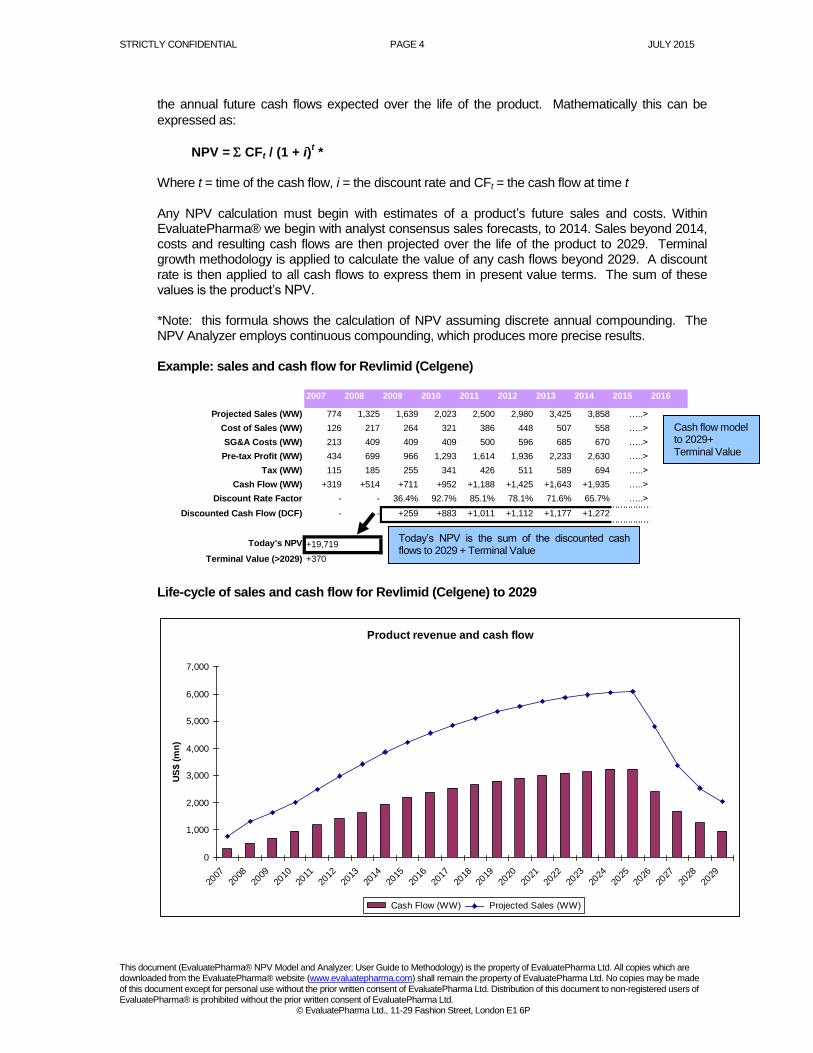
Example: sales and cash flow for Revlimid (Celgene)
2007 2008 2009 2010 2011 2012 2013 2014 2015 2016
Projected Sales (WW) 774 1,325 1,639 2,023 2,500 2,980 3,425 3,858 …..>
Cost of Sales (WW) 126 217 264 321 386 448 507 558 …..>
SG&A Costs (WW) 213 409 409 409 500 596 685 670 …..>
Pre-tax Profit (WW) 434 699 966 1,293 1,614 1,936 2,233 2,630 …..>
Tax (WW) 115 185 255 341 426 511 589 694 …..>
Cash Flow (WW) +319 +514 +711 +952 +1,188 +1,425 +1,643 +1,935 …..>
Discount Rate Factor - - 36.4% 92.7% 85.1% 78.1% 71.6% 65.7% …..>
Discounted Cash Flow (DCF) - - +259 +883 +1,011 +1,112 +1,177 +1,272
Today's NPV
Terminal Value (>2029) +370
+19,719
Life-cycle of sales and cash flow for Revlimid (Celgene) to 2029
Product revenue and cash flow
0
1,000
2,000
3,000
4,000
5,000
6,000
7,000
2007
2008
2009
2010
2011
2012
2013
2014
2015
2016
2017
2018
2019
2020
2021
2022
2023
2024
2025
2026
2027
2028
2029
US
$ (
mn
)
Cash Flow (WW) Projected Sales (WW)
Today’s NPV is the sum of the discounted cash flows to 2029 + Terminal Value
Cash flow model to 2029+ Terminal Value
STRICTLY CONFIDENTIAL PAGE 5 JULY 2015
This document (EvaluatePharma® NPV Model and Analyzer: User Guide to Methodology) is the property of EvaluatePharma Ltd. All copies which are downloaded from the EvaluatePharma® website (www.evaluatepharma.com) shall remain the property of EvaluatePharma Ltd. No copies may be made of this document except for personal use without the prior written consent of EvaluatePharma Ltd. Distribution of this document to non-registered users of EvaluatePharma® is prohibited without the prior written consent of EvaluatePharma Ltd.
© EvaluatePharma Ltd., 11-29 Fashion Street, London E1 6P
NPV Inputs & Detailed Methodology
As detailed in the previous section, a product’s NPV is the sum of the present values of its future
annual cash flows. EvaluatePharma®’s NPV analyzer uses consensus sales forecasts to 2014
then applies its own methodology to forecast costs and sales until 2029 and estimate a terminal
value for cash flows beyond that period. These cash flow streams are then discounted to calculate
their present value, and summed to reach the NPV. The following section takes a closer look at
the key inputs used to calculate the NPV and examines the methodology to derive these inputs in
detail.
Components of the Calculation
Projected Sales (USA/ Ex-USA) Forecast to 2029
EvaluatePharma®’s NPV Analyzer uses analyst consensus sales forecasts for products’ USA and
Ex-USA revenues during the period 2009-2014. The forecasts in 2013-14 are then projected
forward beyond the consensus period based on a moderating growth curve to the patent date. The
trajectory of the curve is therefore determined by consensus forecasts rather than
EvaluatePharma® forecasts. From the patent date, sales decline according to an erosion algorithm
determined by the product’s composition (chemical or biologic) and geography (USA or Ex-USA).
However, for most branded OTC products, patent expiry is assumed to be largely irrelevant to
sales growth and a moderating growth curve is applied indefinitely until growth reaches 0%.
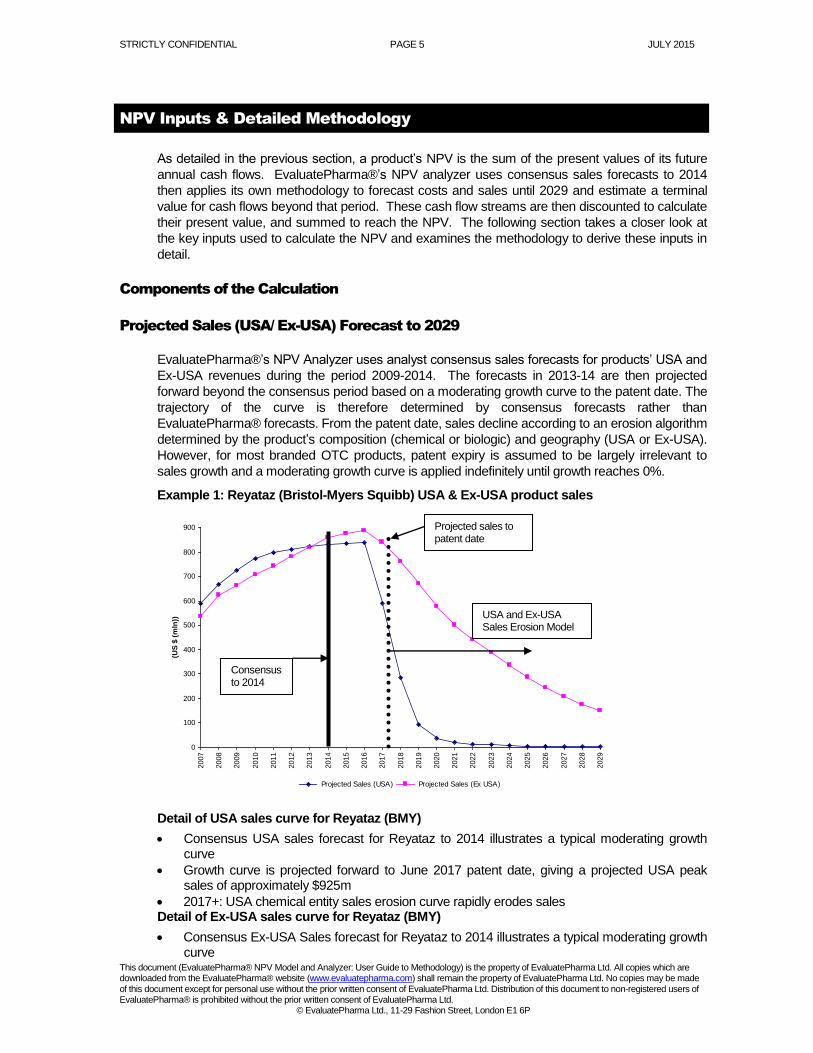
Example 1: Reyataz (Bristol-Myers Squibb) USA & Ex-USA product sales
0
100
200
300
400
500
600
700
800
900
2007
2008
2009
2010
2011
2012
2013
2014
2015
2016
2017
2018
2019
2020
2021
2022
2023
2024
2025
2026
2027
2028
2029
(US
$ (
mln
))
Projected Sales (USA) Projected Sales (Ex USA)
Source: EvaluatePharma®
Detail of USA sales curve for Reyataz (BMY)
Consensus USA sales forecast for Reyataz to 2014 illustrates a typical moderating growth curve
Growth curve is projected forward to June 2017 patent date, giving a projected USA peak sales of approximately $925m
2017+: USA chemical entity sales erosion curve rapidly erodes sales Detail of Ex-USA sales curve for Reyataz (BMY)
Consensus Ex-USA Sales forecast for Reyataz to 2014 illustrates a typical moderating growth curve
Projected sales to patent date
Consensus to 2014
USA and Ex-USA Sales Erosion Model
STRICTLY CONFIDENTIAL PAGE 6 JULY 2015
This document (EvaluatePharma® NPV Model and Analyzer: User Guide to Methodology) is the property of EvaluatePharma Ltd. All copies which are downloaded from the EvaluatePharma® website (www.evaluatepharma.com) shall remain the property of EvaluatePharma Ltd. No copies may be made of this document except for personal use without the prior written consent of EvaluatePharma Ltd. Distribution of this document to non-registered users of EvaluatePharma® is prohibited without the prior written consent of EvaluatePharma Ltd.
© EvaluatePharma Ltd., 11-29 Fashion Street, London E1 6P
Growth curve is projected forward to 2017 patent date; Giving a projected Ex-USA peak sale of approximately $865m
2017+: Ex-USA chemical entity patent erosion model gradually erodes sales
Inputs into USA/ Ex-USA Sales Projection
1. Consensus product forecast to 2014 (USA & Ex-USA)
EvaluatePharma® contains consensus sales forecasts for over 3,000 USA and worldwide products. We have used these as the basis for the projected sales component of the NPV Analyzer. We calculate the Ex-USA sales from the difference between the worldwide and USA sales and thus split the product analysis along geographic lines.
2. Patent Date (USA & Ex-USA)
2.1. Marketed products
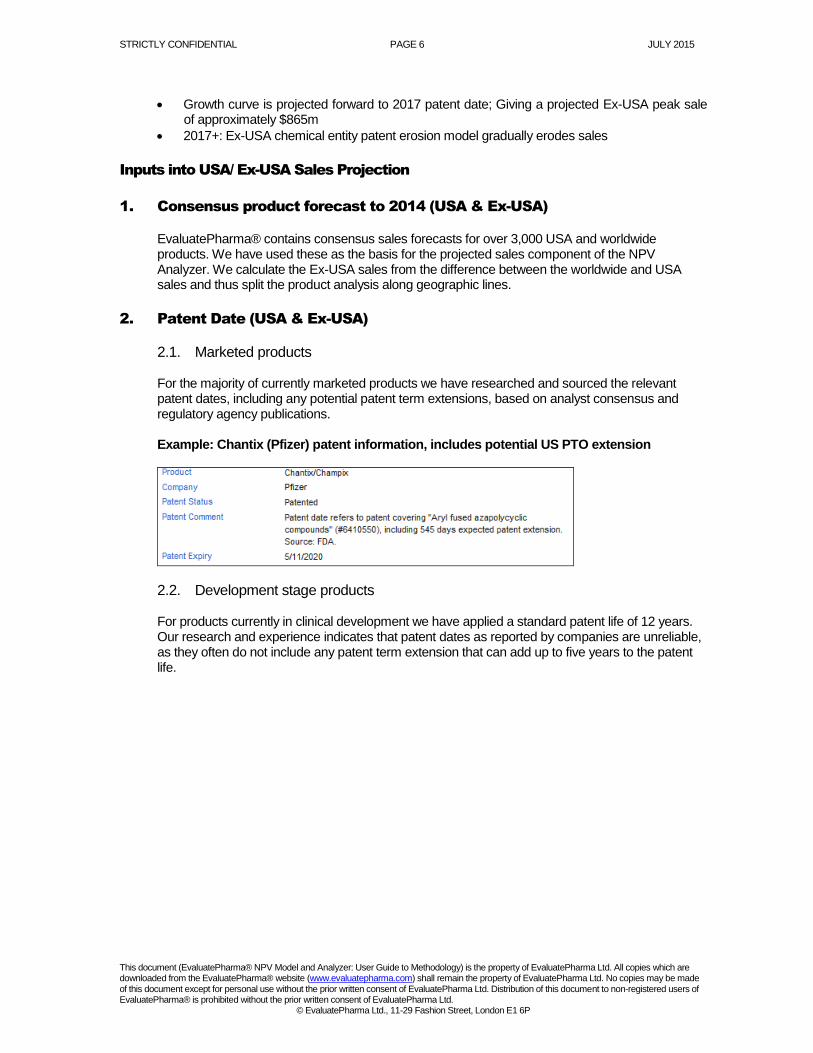
For the majority of currently marketed products we have researched and sourced the relevant patent dates, including any potential patent term extensions, based on analyst consensus and regulatory agency publications. Example: Chantix (Pfizer) patent information, includes potential US PTO extension
2.2. Development stage products For products currently in clinical development we have applied a standard patent life of 12 years. Our research and experience indicates that patent dates as reported by companies are unreliable, as they often do not include any patent term extension that can add up to five years to the patent life.

STRICTLY CONFIDENTIAL PAGE 7 JULY 2015
This document (EvaluatePharma® NPV Model and Analyzer: User Guide to Methodology) is the property of EvaluatePharma Ltd. All copies which are downloaded from the EvaluatePharma® website (www.evaluatepharma.com) shall remain the property of EvaluatePharma Ltd. No copies may be made of this document except for personal use without the prior written consent of EvaluatePharma Ltd. Distribution of this document to non-registered users of EvaluatePharma® is prohibited without the prior written consent of EvaluatePharma Ltd.
© EvaluatePharma Ltd., 11-29 Fashion Street, London E1 6P
Patent length assumptions for marketed and development stage products (if not disclosed)
3. Sales Erosion Algorithms EvaluatePharma® utilises four different sales erosion algorithms to forecast a product’s sales after patent expiry. The algorithm used is determined by the product’s composition (chemical entity or biologic) and the geography (USA or Ex-USA). The erosion algorithm for USA biologic products assumes that a regulatory pathway for bio-similar products will be established in the USA in the next five years. We have assumed the erosion rates on biologic products to be 50% of that of chemical products. For chemical entities in the USA, we have assumed rapid sales erosion, based on recent patent expiry examples, with sales falling to 2% of pre-patent expiry levels within five years.
In Ex-USA markets, erosion algorithms for both biologic and chemical entities employ gentler decline curves relative to those in the USA. Broadly, this reflects (i) the lower penetration of generics outside the USA, (ii) the lower differential in profitability between ethical and generic products outside the USA, given government controlled pricing for ethicals and the higher margin ‘branded generic’ market model in place in many Ex-USA jurisdictions, and (iii) in the case of biologics, uncertainty regarding timing of a regulatory pathway for bio-similars in some Ex-USA jurisdictions and in the EU, the requirement for clinical trials prior to approval.
STRICTLY CONFIDENTIAL PAGE 8 JULY 2015
This document (EvaluatePharma® NPV Model and Analyzer: User Guide to Methodology) is the property of EvaluatePharma Ltd. All copies which are downloaded from the EvaluatePharma® website (www.evaluatepharma.com) shall remain the property of EvaluatePharma Ltd. No copies may be made of this document except for personal use without the prior written consent of EvaluatePharma Ltd. Distribution of this document to non-registered users of EvaluatePharma® is prohibited without the prior written consent of EvaluatePharma Ltd.
© EvaluatePharma Ltd., 11-29 Fashion Street, London E1 6P
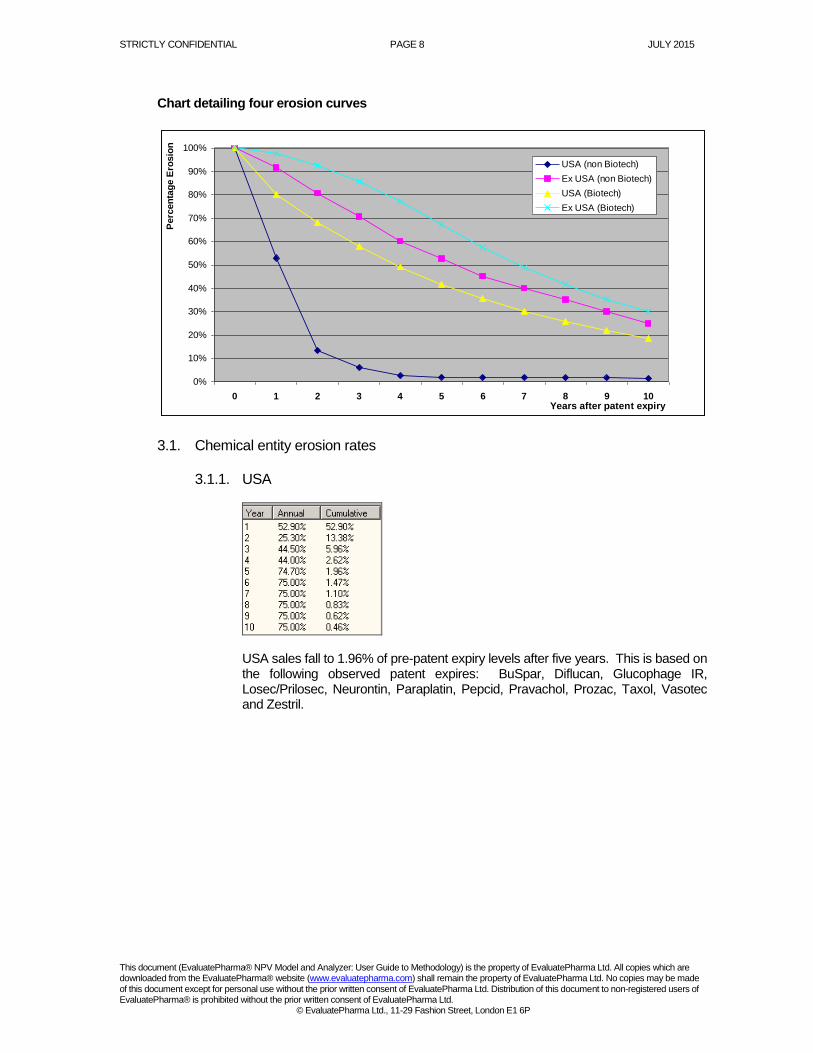
Chart detailing four erosion curves
0%
10%
20%
30%
40%
50%
60%
70%
80%
90%
100%
0 1 2 3 4 5 6 7 8 9 10Years after patent expiry
Perc
en
tag
e E
rosio
nUSA (non Biotech)
Ex USA (non Biotech)
USA (Biotech)
Ex USA (Biotech)
3.1. Chemical entity erosion rates
3.1.1. USA
USA sales fall to 1.96% of pre-patent expiry levels after five years. This is based on the following observed patent expires: BuSpar, Diflucan, Glucophage IR, Losec/Prilosec, Neurontin, Paraplatin, Pepcid, Pravachol, Prozac, Taxol, Vasotec and Zestril.
STRICTLY CONFIDENTIAL PAGE 9 JULY 2015
This document (EvaluatePharma® NPV Model and Analyzer: User Guide to Methodology) is the property of EvaluatePharma Ltd. All copies which are downloaded from the EvaluatePharma® website (www.evaluatepharma.com) shall remain the property of EvaluatePharma Ltd. No copies may be made of this document except for personal use without the prior written consent of EvaluatePharma Ltd. Distribution of this document to non-registered users of EvaluatePharma® is prohibited without the prior written consent of EvaluatePharma Ltd.
© EvaluatePharma Ltd., 11-29 Fashion Street, London E1 6P
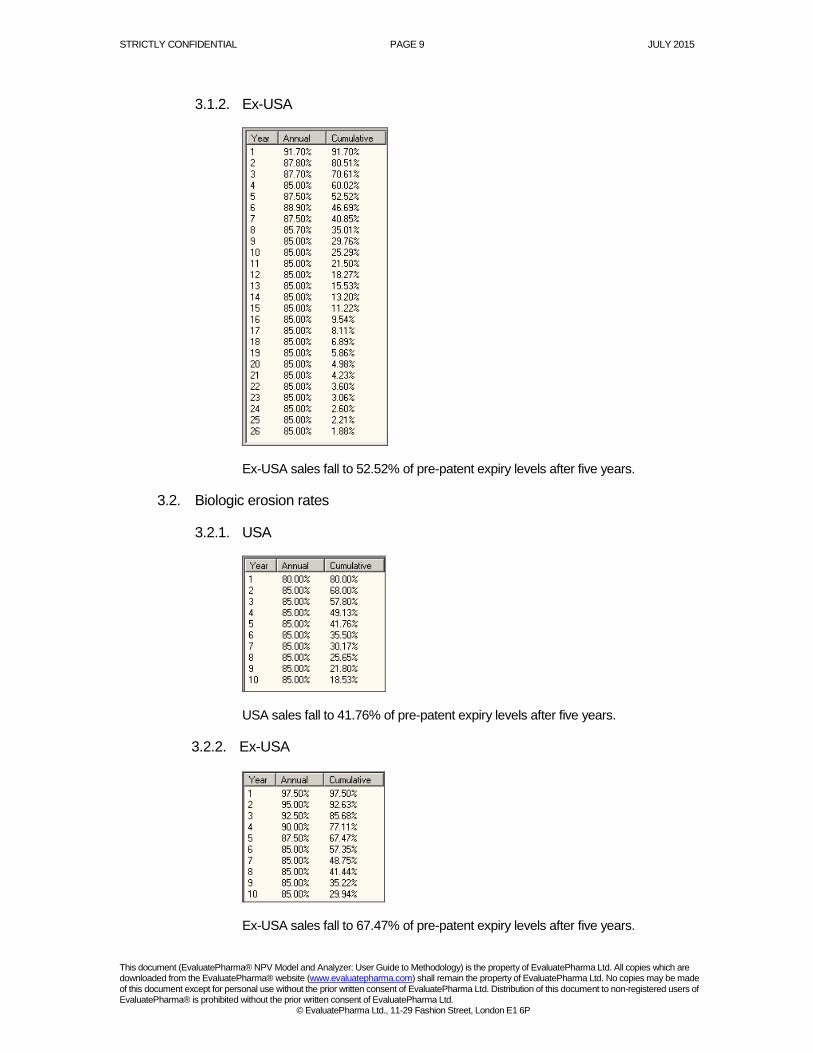
3.1.2. Ex-USA
Ex-USA sales fall to 52.52% of pre-patent expiry levels after five years.
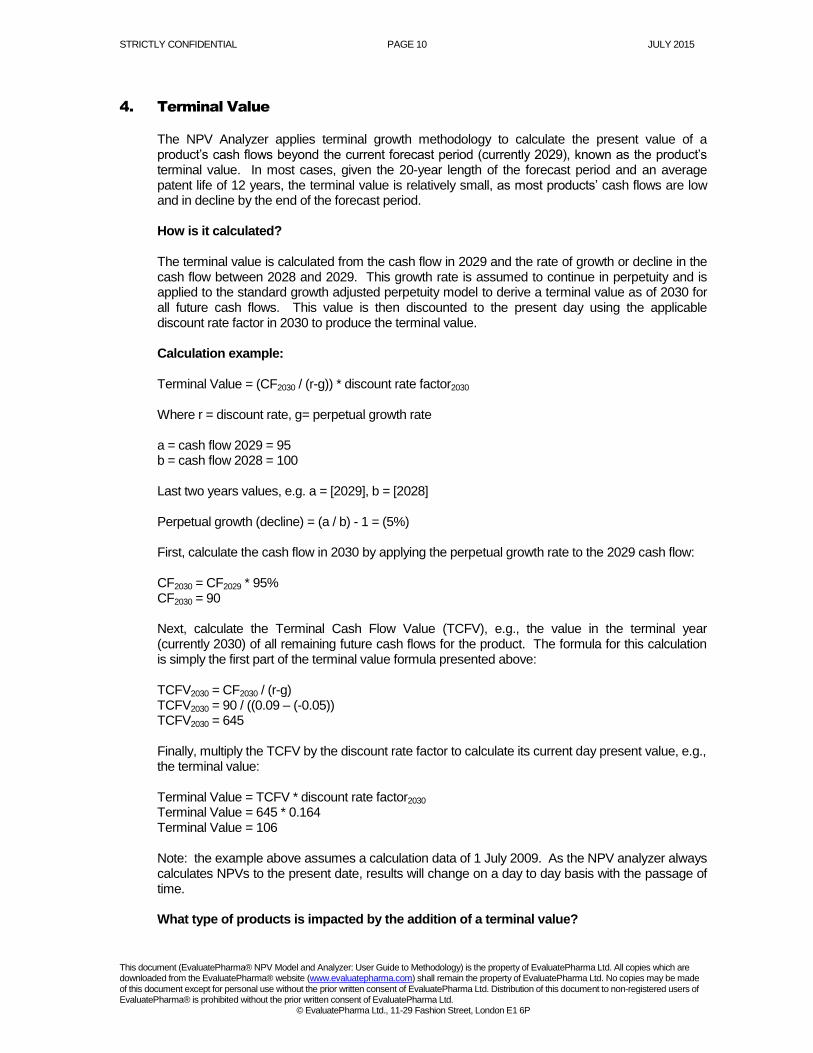
3.2. Biologic erosion rates
3.2.1. USA
USA sales fall to 41.76% of pre-patent expiry levels after five years.
3.2.2. Ex-USA
Ex-USA sales fall to 67.47% of pre-patent expiry levels after five years.
STRICTLY CONFIDENTIAL PAGE 10 JULY 2015
This document (EvaluatePharma® NPV Model and Analyzer: User Guide to Methodology) is the property of EvaluatePharma Ltd. All copies which are downloaded from the EvaluatePharma® website (www.evaluatepharma.com) shall remain the property of EvaluatePharma Ltd. No copies may be made of this document except for personal use without the prior written consent of EvaluatePharma Ltd. Distribution of this document to non-registered users of EvaluatePharma® is prohibited without the prior written consent of EvaluatePharma Ltd.
© EvaluatePharma Ltd., 11-29 Fashion Street, London E1 6P
4. Terminal Value
The NPV Analyzer applies terminal growth methodology to calculate the present value of a product’s cash flows beyond the current forecast period (currently 2029), known as the product’s terminal value. In most cases, given the 20-year length of the forecast period and an average patent life of 12 years, the terminal value is relatively small, as most products’ cash flows are low and in decline by the end of the forecast period. How is it calculated? The terminal value is calculated from the cash flow in 2029 and the rate of growth or decline in the cash flow between 2028 and 2029. This growth rate is assumed to continue in perpetuity and is applied to the standard growth adjusted perpetuity model to derive a terminal value as of 2030 for all future cash flows. This value is then discounted to the present day using the applicable discount rate factor in 2030 to produce the terminal value. Calculation example: Terminal Value = (CF2030 / (r-g)) * discount rate factor2030
Where r = discount rate, g= perpetual growth rate a = cash flow 2029 = 95 b = cash flow 2028 = 100 Last two years values, e.g. a = [2029], b = [2028] Perpetual growth (decline) = (a / b) - 1 = (5%) First, calculate the cash flow in 2030 by applying the perpetual growth rate to the 2029 cash flow: CF2030 = CF2029 * 95% CF2030 = 90 Next, calculate the Terminal Cash Flow Value (TCFV), e.g., the value in the terminal year (currently 2030) of all remaining future cash flows for the product. The formula for this calculation is simply the first part of the terminal value formula presented above: TCFV2030 = CF2030 / (r-g) TCFV2030 = 90 / ((0.09 – (-0.05)) TCFV2030 = 645 Finally, multiply the TCFV by the discount rate factor to calculate its current day present value, e.g., the terminal value: Terminal Value = TCFV * discount rate factor2030 Terminal Value = 645 * 0.164 Terminal Value = 106 Note: the example above assumes a calculation data of 1 July 2009. As the NPV analyzer always calculates NPVs to the present date, results will change on a day to day basis with the passage of time. What type of products is impacted by the addition of a terminal value?
STRICTLY CONFIDENTIAL PAGE 11 JULY 2015
This document (EvaluatePharma® NPV Model and Analyzer: User Guide to Methodology) is the property of EvaluatePharma Ltd. All copies which are downloaded from the EvaluatePharma® website (www.evaluatepharma.com) shall remain the property of EvaluatePharma Ltd. No copies may be made of this document except for personal use without the prior written consent of EvaluatePharma Ltd. Distribution of this document to non-registered users of EvaluatePharma® is prohibited without the prior written consent of EvaluatePharma Ltd.
© EvaluatePharma Ltd., 11-29 Fashion Street, London E1 6P
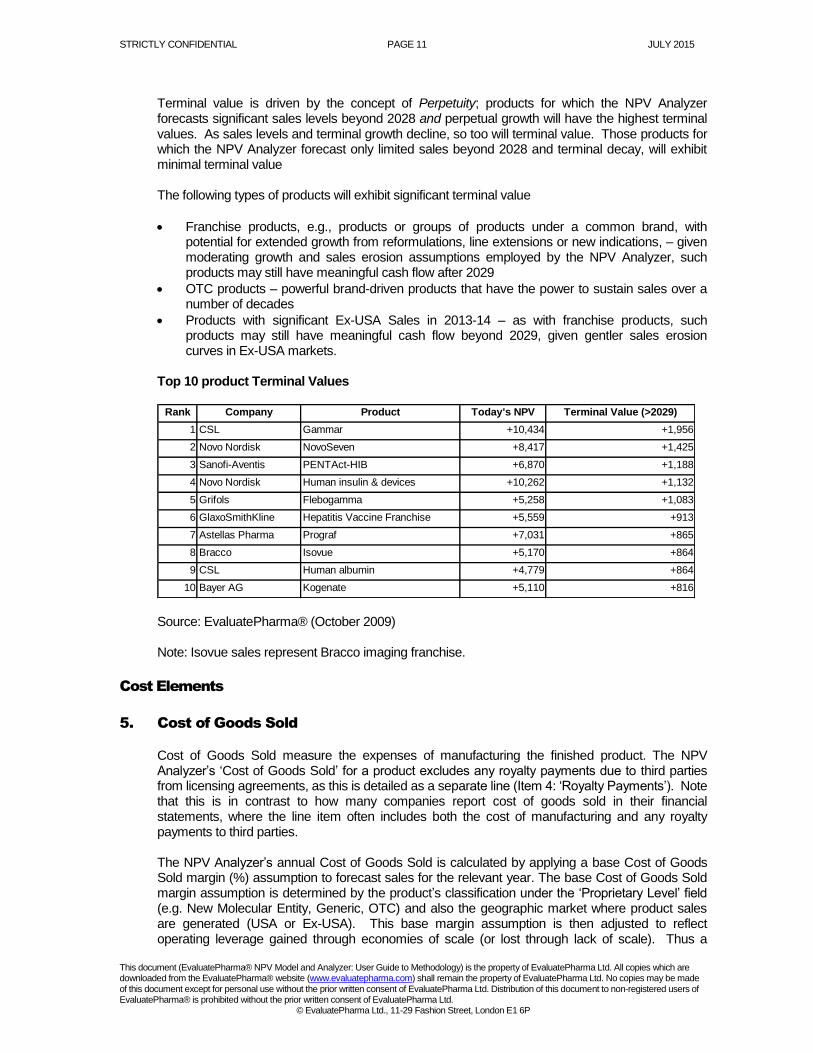
Terminal value is driven by the concept of Perpetuity; products for which the NPV Analyzer forecasts significant sales levels beyond 2028 and perpetual growth will have the highest terminal values. As sales levels and terminal growth decline, so too will terminal value. Those products for which the NPV Analyzer forecast only limited sales beyond 2028 and terminal decay, will exhibit minimal terminal value The following types of products will exhibit significant terminal value
Franchise products, e.g., products or groups of products under a common brand, with potential for extended growth from reformulations, line extensions or new indications, – given moderating growth and sales erosion assumptions employed by the NPV Analyzer, such products may still have meaningful cash flow after 2029
OTC products – powerful brand-driven products that have the power to sustain sales over a number of decades
Products with significant Ex-USA Sales in 2013-14 – as with franchise products, such products may still have meaningful cash flow beyond 2029, given gentler sales erosion curves in Ex-USA markets.
Top 10 product Terminal Values
Rank Company Product Today's NPV Terminal Value (>2029)
1 CSL Gammar +10,434 +1,956
2 Novo Nordisk NovoSeven +8,417 +1,425
3 Sanofi-Aventis PENTAct-HIB +6,870 +1,188
4 Novo Nordisk Human insulin & devices +10,262 +1,132
5 Grifols Flebogamma +5,258 +1,083
6 GlaxoSmithKline Hepatitis Vaccine Franchise +5,559 +913
7 Astellas Pharma Prograf +7,031 +865
8 Bracco Isovue +5,170 +864
9 CSL Human albumin +4,779 +864
10 Bayer AG Kogenate +5,110 +816
Source: EvaluatePharma® (October 2009) Note: Isovue sales represent Bracco imaging franchise.
Cost Elements
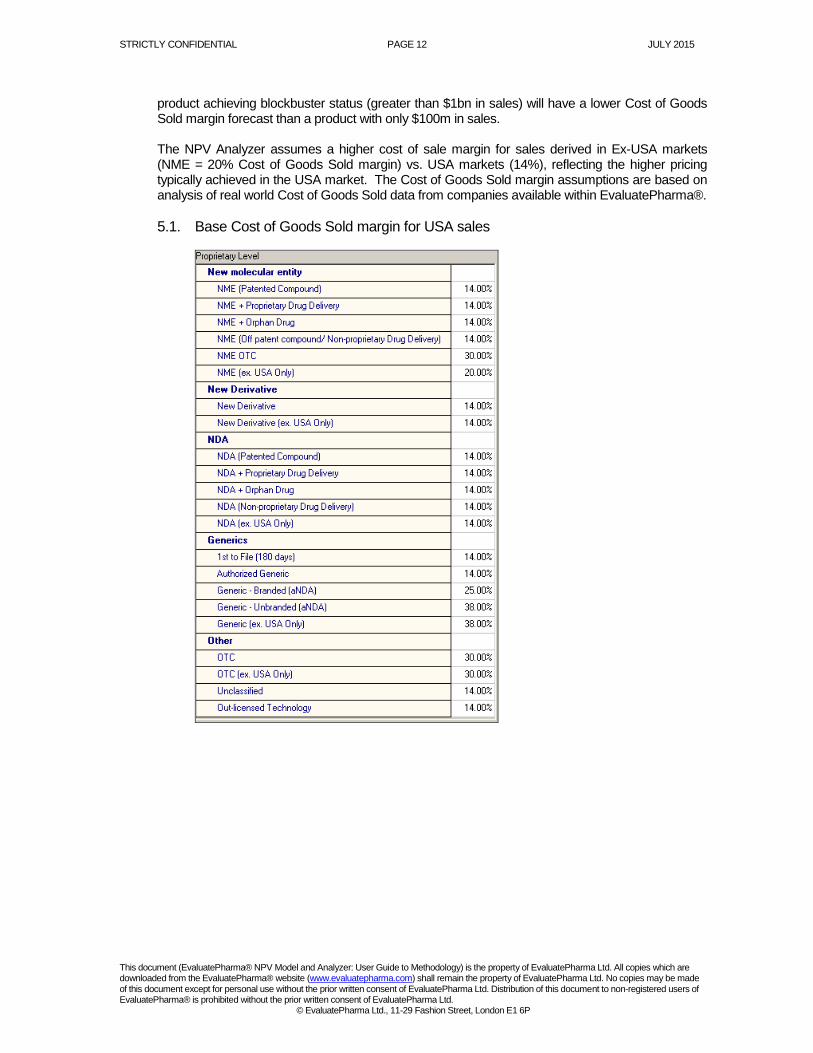
5. Cost of Goods Sold Cost of Goods Sold measure the expenses of manufacturing the finished product. The NPV Analyzer’s ‘Cost of Goods Sold’ for a product excludes any royalty payments due to third parties from licensing agreements, as this is detailed as a separate line (Item 4: ‘Royalty Payments’). Note that this is in contrast to how many companies report cost of goods sold in their financial statements, where the line item often includes both the cost of manufacturing and any royalty payments to third parties. The NPV Analyzer’s annual Cost of Goods Sold is calculated by applying a base Cost of Goods Sold margin (%) assumption to forecast sales for the relevant year. The base Cost of Goods Sold margin assumption is determined by the product’s classification under the ‘Proprietary Level’ field (e.g. New Molecular Entity, Generic, OTC) and also the geographic market where product sales are generated (USA or Ex-USA). This base margin assumption is then adjusted to reflect operating leverage gained through economies of scale (or lost through lack of scale). Thus a
STRICTLY CONFIDENTIAL PAGE 12 JULY 2015
This document (EvaluatePharma® NPV Model and Analyzer: User Guide to Methodology) is the property of EvaluatePharma Ltd. All copies which are downloaded from the EvaluatePharma® website (www.evaluatepharma.com) shall remain the property of EvaluatePharma Ltd. No copies may be made of this document except for personal use without the prior written consent of EvaluatePharma Ltd. Distribution of this document to non-registered users of EvaluatePharma® is prohibited without the prior written consent of EvaluatePharma Ltd.
© EvaluatePharma Ltd., 11-29 Fashion Street, London E1 6P
product achieving blockbuster status (greater than $1bn in sales) will have a lower Cost of Goods Sold margin forecast than a product with only $100m in sales. The NPV Analyzer assumes a higher cost of sale margin for sales derived in Ex-USA markets (NME = 20% Cost of Goods Sold margin) vs. USA markets (14%), reflecting the higher pricing typically achieved in the USA market. The Cost of Goods Sold margin assumptions are based on analysis of real world Cost of Goods Sold data from companies available within EvaluatePharma®.
5.1. Base Cost of Goods Sold margin for USA sales

STRICTLY CONFIDENTIAL PAGE 13 JULY 2015
This document (EvaluatePharma® NPV Model and Analyzer: User Guide to Methodology) is the property of EvaluatePharma Ltd. All copies which are downloaded from the EvaluatePharma® website (www.evaluatepharma.com) shall remain the property of EvaluatePharma Ltd. No copies may be made of this document except for personal use without the prior written consent of EvaluatePharma Ltd. Distribution of this document to non-registered users of EvaluatePharma® is prohibited without the prior written consent of EvaluatePharma Ltd.
© EvaluatePharma Ltd., 11-29 Fashion Street, London E1 6P
5.2. Base Cost of Goods Sold margin for ‘Ex-USA’ sales
Notes: In certain cases the Cost of Goods Sold assumptions used by the NPV Analyzer are not in line with historical Cost of Goods Sold margins reported by the relevant manufacturer:
Joint venture companies (e.g. TAP, Merck Schering-Plough) appear to have significantly lower Cost of Goods Sold margin versus those achieved by parent companies
Biotech companies that out-license manufacturing can have a reported Cost of Goods Sold margin lower than the USA default assumption of 14% of sales of a new molecular entity (NME)
Certain companies have higher reported Cost of Goods Sold versus the NPV Analyzer’s assumption which may be due to the high cost location of manufacturing facilities as well as the complexity of the manufacturing process for certain products (e.g. Novo Nordisk, Sanofi-Aventis).
STRICTLY CONFIDENTIAL PAGE 14 JULY 2015
This document (EvaluatePharma® NPV Model and Analyzer: User Guide to Methodology) is the property of EvaluatePharma Ltd. All copies which are downloaded from the EvaluatePharma® website (www.evaluatepharma.com) shall remain the property of EvaluatePharma Ltd. No copies may be made of this document except for personal use without the prior written consent of EvaluatePharma Ltd. Distribution of this document to non-registered users of EvaluatePharma® is prohibited without the prior written consent of EvaluatePharma Ltd.
© EvaluatePharma Ltd., 11-29 Fashion Street, London E1 6P
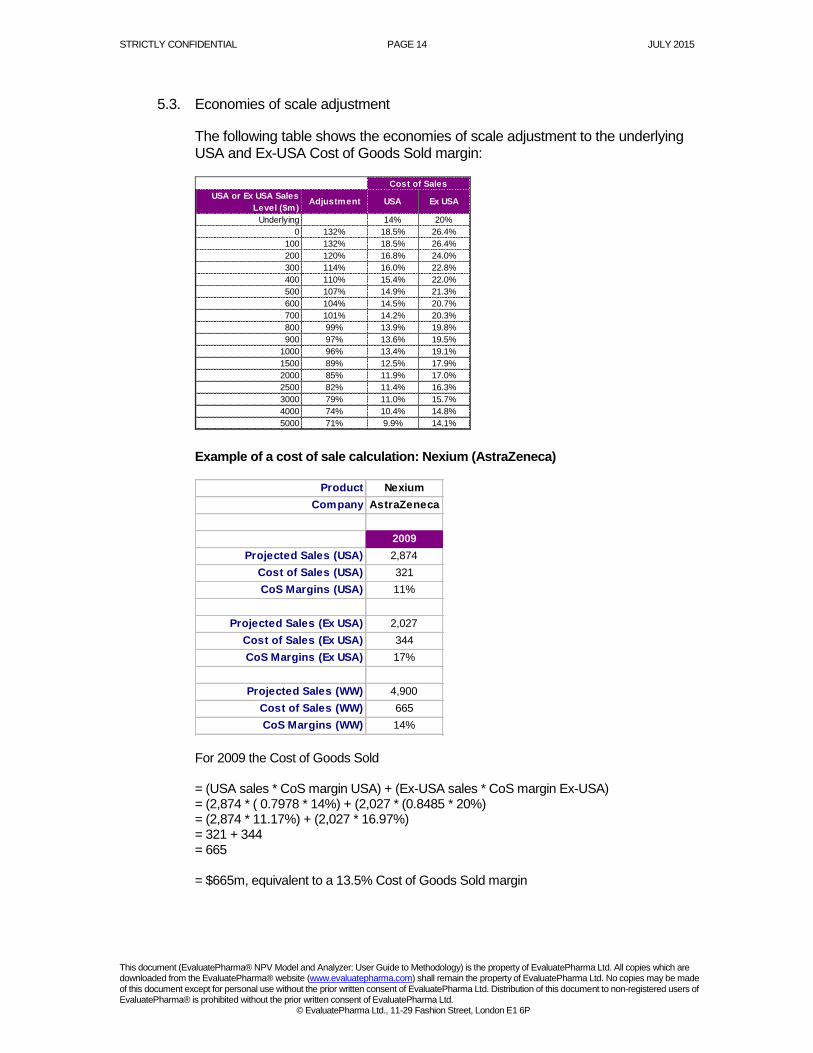
5.3. Economies of scale adjustment
The following table shows the economies of scale adjustment to the underlying USA and Ex-USA Cost of Goods Sold margin:
USA or Ex USA Sales
Level ($m)Adjustment USA Ex USA
Underlying 14% 20%
0 132% 18.5% 26.4%
100 132% 18.5% 26.4%
200 120% 16.8% 24.0%
300 114% 16.0% 22.8%
400 110% 15.4% 22.0%
500 107% 14.9% 21.3%
600 104% 14.5% 20.7%
700 101% 14.2% 20.3%
800 99% 13.9% 19.8%
900 97% 13.6% 19.5%
1000 96% 13.4% 19.1%
1500 89% 12.5% 17.9%
2000 85% 11.9% 17.0%
2500 82% 11.4% 16.3%
3000 79% 11.0% 15.7%
4000 74% 10.4% 14.8%
5000 71% 9.9% 14.1%
Cost of Sales
Example of a cost of sale calculation: Nexium (AstraZeneca)
Product Nexium
Company AstraZeneca
2009
Projected Sales (USA) 2,874
Cost of Sales (USA) 321
CoS Margins (USA) 11%
Projected Sales (Ex USA) 2,027
Cost of Sales (Ex USA) 344
CoS Margins (Ex USA) 17%
Projected Sales (WW) 4,900
Cost of Sales (WW) 665
CoS Margins (WW) 14% For 2009 the Cost of Goods Sold = (USA sales * CoS margin USA) + (Ex-USA sales * CoS margin Ex-USA) = (2,874 * ( 0.7978 * 14%) + (2,027 * (0.8485 * 20%) = (2,874 * 11.17%) + (2,027 * 16.97%) = 321 + 344 = 665 = $665m, equivalent to a 13.5% Cost of Goods Sold margin
STRICTLY CONFIDENTIAL PAGE 15 JULY 2015
This document (EvaluatePharma® NPV Model and Analyzer: User Guide to Methodology) is the property of EvaluatePharma Ltd. All copies which are downloaded from the EvaluatePharma® website (www.evaluatepharma.com) shall remain the property of EvaluatePharma Ltd. No copies may be made of this document except for personal use without the prior written consent of EvaluatePharma Ltd. Distribution of this document to non-registered users of EvaluatePharma® is prohibited without the prior written consent of EvaluatePharma Ltd.
© EvaluatePharma Ltd., 11-29 Fashion Street, London E1 6P
6. Royalty Payments (USA/ Ex-USA)
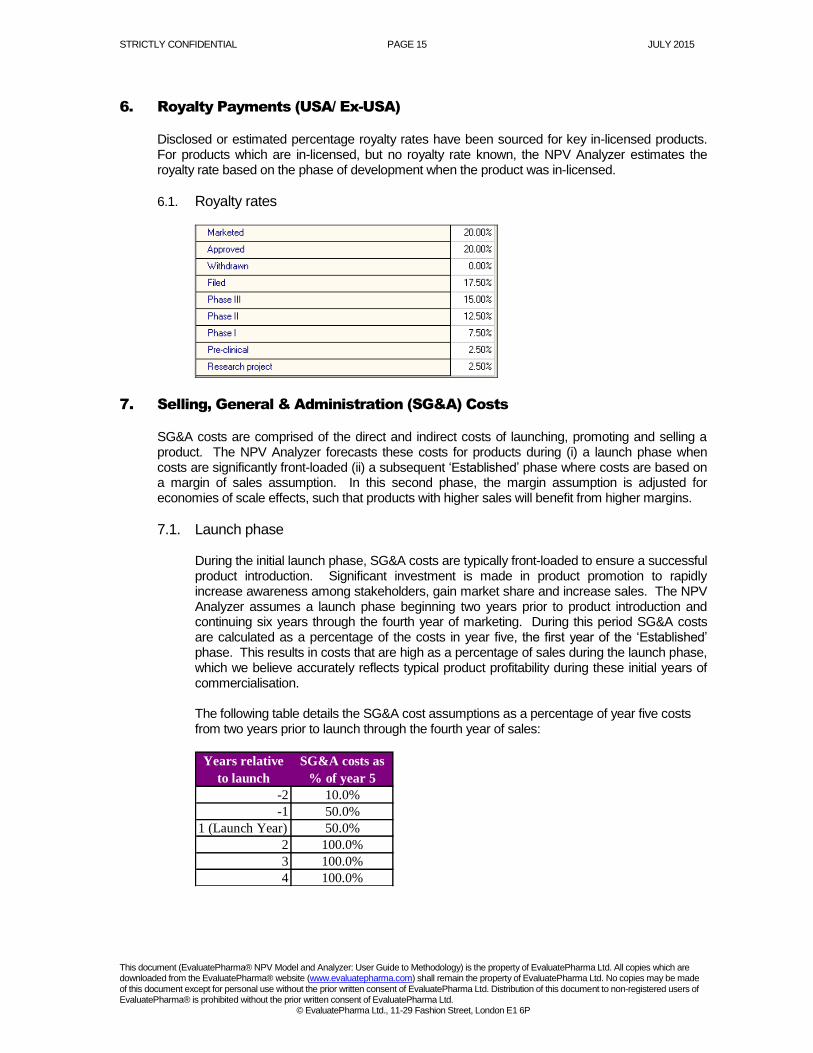
Disclosed or estimated percentage royalty rates have been sourced for key in-licensed products. For products which are in-licensed, but no royalty rate known, the NPV Analyzer estimates the royalty rate based on the phase of development when the product was in-licensed.
6.1. Royalty rates
7. Selling, General & Administration (SG&A) Costs
SG&A costs are comprised of the direct and indirect costs of launching, promoting and selling a product. The NPV Analyzer forecasts these costs for products during (i) a launch phase when costs are significantly front-loaded (ii) a subsequent ‘Established’ phase where costs are based on a margin of sales assumption. In this second phase, the margin assumption is adjusted for economies of scale effects, such that products with higher sales will benefit from higher margins.
7.1. Launch phase
During the initial launch phase, SG&A costs are typically front-loaded to ensure a successful product introduction. Significant investment is made in product promotion to rapidly increase awareness among stakeholders, gain market share and increase sales. The NPV Analyzer assumes a launch phase beginning two years prior to product introduction and continuing six years through the fourth year of marketing. During this period SG&A costs are calculated as a percentage of the costs in year five, the first year of the ‘Established’ phase. This results in costs that are high as a percentage of sales during the launch phase, which we believe accurately reflects typical product profitability during these initial years of commercialisation. The following table details the SG&A cost assumptions as a percentage of year five costs from two years prior to launch through the fourth year of sales:
-2 10.0%
-1 50.0%
1 (Launch Year) 50.0%
2 100.0%
3 100.0%
4 100.0%
Years relative
to launch
SG&A costs as
% of year 5
STRICTLY CONFIDENTIAL PAGE 16 JULY 2015
This document (EvaluatePharma® NPV Model and Analyzer: User Guide to Methodology) is the property of EvaluatePharma Ltd. All copies which are downloaded from the EvaluatePharma® website (www.evaluatepharma.com) shall remain the property of EvaluatePharma Ltd. No copies may be made of this document except for personal use without the prior written consent of EvaluatePharma Ltd. Distribution of this document to non-registered users of EvaluatePharma® is prohibited without the prior written consent of EvaluatePharma Ltd.
© EvaluatePharma Ltd., 11-29 Fashion Street, London E1 6P
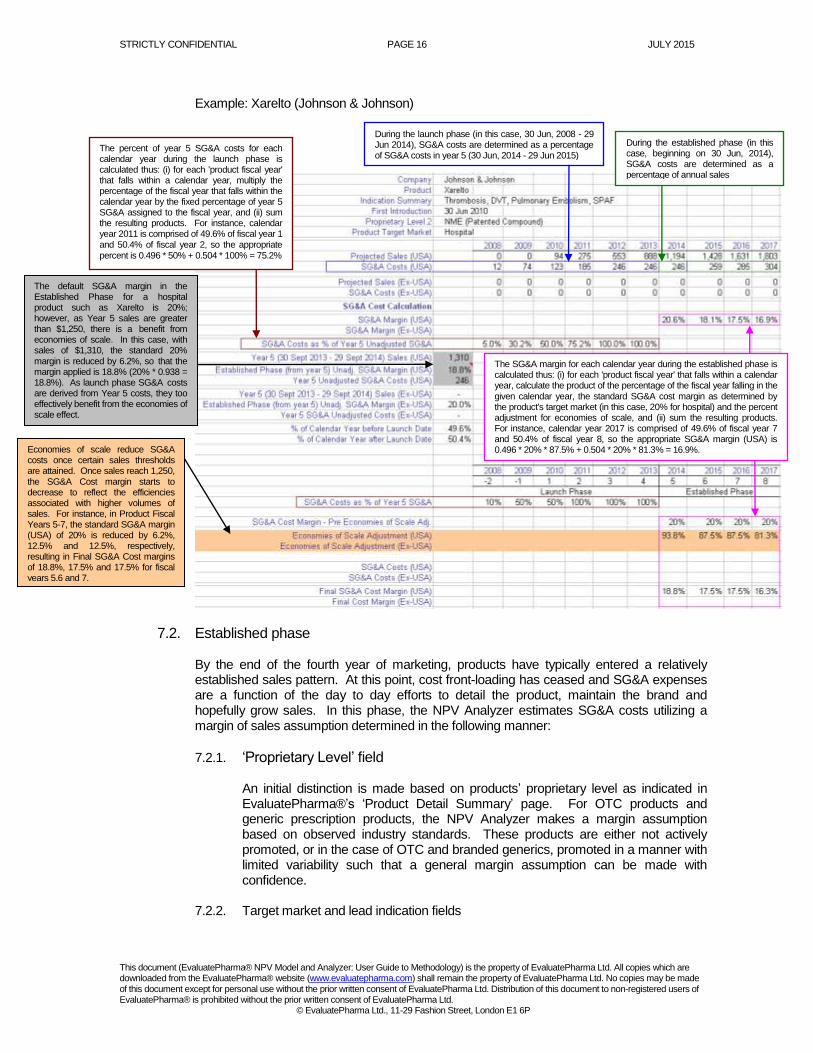
Example: Xarelto (Johnson & Johnson)
7.2. Established phase
By the end of the fourth year of marketing, products have typically entered a relatively established sales pattern. At this point, cost front-loading has ceased and SG&A expenses are a function of the day to day efforts to detail the product, maintain the brand and hopefully grow sales. In this phase, the NPV Analyzer estimates SG&A costs utilizing a margin of sales assumption determined in the following manner:
7.2.1. ‘Proprietary Level’ field
An initial distinction is made based on products’ proprietary level as indicated in EvaluatePharma®’s ‘Product Detail Summary’ page. For OTC products and generic prescription products, the NPV Analyzer makes a margin assumption based on observed industry standards. These products are either not actively promoted, or in the case of OTC and branded generics, promoted in a manner with limited variability such that a general margin assumption can be made with confidence.
7.2.2. Target market and lead indication fields
During the established phase (in this case, beginning on 30 Jun, 2014), SG&A costs are determined as a percentage of annual sales
During the launch phase (in this case, 30 Jun, 2008 - 29 Jun 2014), SG&A costs are determined as a percentage of SG&A costs in year 5 (30 Jun, 2014 - 29 Jun 2015)
The SG&A margin for each calendar year during the established phase is calculated thus: (i) for each 'product fiscal year' that falls within a calendar year, calculate the product of the percentage of the fiscal year falling in the given calendar year, the standard SG&A cost margin as determined by the product's target market (in this case, 20% for hospital) and the percent adjustment for economies of scale, and (ii) sum the resulting products. For instance, calendar year 2017 is comprised of 49.6% of fiscal year 7 and 50.4% of fiscal year 8, so the appropriate SG&A margin (USA) is 0.496 * 20% * 87.5% + 0.504 * 20% * 81.3% = 16.9%. Economies of scale reduce SG&A
costs once certain sales thresholds are attained. Once sales reach 1,250, the SG&A Cost margin starts to decrease to reflect the efficiencies associated with higher volumes of sales. For instance, in Product Fiscal Years 5-7, the standard SG&A margin (USA) of 20% is reduced by 6.2%, 12.5% and 12.5%, respectively, resulting in Final SG&A Cost margins of 18.8%, 17.5% and 17.5% for fiscal years 5,6 and 7.
The percent of year 5 SG&A costs for each calendar year during the launch phase is calculated thus: (i) for each 'product fiscal year' that falls within a calendar year, multiply the percentage of the fiscal year that falls within the calendar year by the fixed percentage of year 5 SG&A assigned to the fiscal year, and (ii) sum the resulting products. For instance, calendar year 2011 is comprised of 49.6% of fiscal year 1 and 50.4% of fiscal year 2, so the appropriate percent is 0.496 * 50% + 0.504 * 100% = 75.2%
The default SG&A margin in the Established Phase for a hospital product such as Xarelto is 20%; however, as Year 5 sales are greater than $1,250, there is a benefit from economies of scale. In this case, with sales of $1,310, the standard 20% margin is reduced by 6.2%, so that the margin applied is 18.8% (20% * 0.938 = 18.8%). As launch phase SG&A costs are derived from Year 5 costs, they too effectively benefit from the economies of scale effect.
STRICTLY CONFIDENTIAL PAGE 17 JULY 2015
This document (EvaluatePharma® NPV Model and Analyzer: User Guide to Methodology) is the property of EvaluatePharma Ltd. All copies which are downloaded from the EvaluatePharma® website (www.evaluatepharma.com) shall remain the property of EvaluatePharma Ltd. No copies may be made of this document except for personal use without the prior written consent of EvaluatePharma Ltd. Distribution of this document to non-registered users of EvaluatePharma® is prohibited without the prior written consent of EvaluatePharma Ltd.
© EvaluatePharma Ltd., 11-29 Fashion Street, London E1 6P
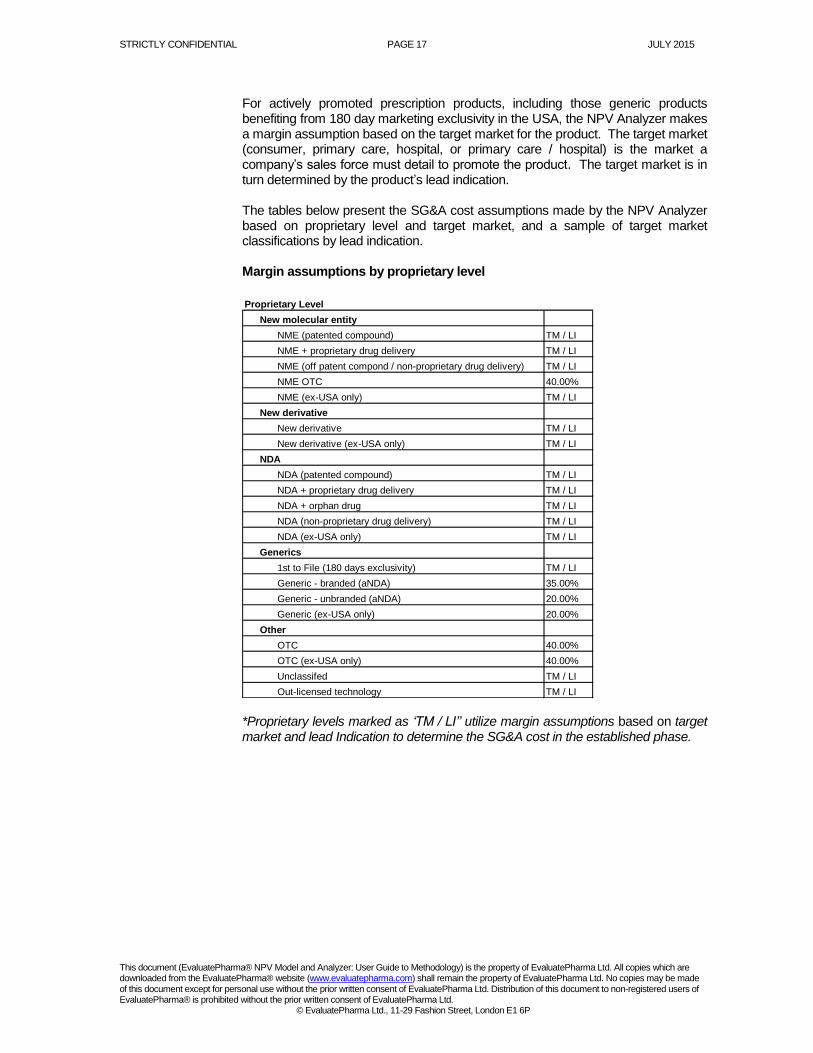
For actively promoted prescription products, including those generic products benefiting from 180 day marketing exclusivity in the USA, the NPV Analyzer makes a margin assumption based on the target market for the product. The target market (consumer, primary care, hospital, or primary care / hospital) is the market a company’s sales force must detail to promote the product. The target market is in turn determined by the product’s lead indication.
The tables below present the SG&A cost assumptions made by the NPV Analyzer based on proprietary level and target market, and a sample of target market classifications by lead indication.
Margin assumptions by proprietary level
Proprietary Level
New molecular entity
NME (patented compound) TM / LI
NME + proprietary drug delivery TM / LI
NME (off patent compond / non-proprietary drug delivery) TM / LI
NME OTC 40.00%
NME (ex-USA only) TM / LI
New derivative
New derivative TM / LI
New derivative (ex-USA only) TM / LI
NDA
NDA (patented compound) TM / LI
NDA + proprietary drug delivery TM / LI
NDA + orphan drug TM / LI
NDA (non-proprietary drug delivery) TM / LI
NDA (ex-USA only) TM / LI
Generics
1st to File (180 days exclusivity) TM / LI
Generic - branded (aNDA) 35.00%
Generic - unbranded (aNDA) 20.00%
Generic (ex-USA only) 20.00%
Other
OTC 40.00%
OTC (ex-USA only) 40.00%
Unclassifed TM / LI
Out-licensed technology TM / LI *Proprietary levels marked as ‘TM / LI’’ utilize margin assumptions based on target market and lead Indication to determine the SG&A cost in the established phase.
STRICTLY CONFIDENTIAL PAGE 18 JULY 2015
This document (EvaluatePharma® NPV Model and Analyzer: User Guide to Methodology) is the property of EvaluatePharma Ltd. All copies which are downloaded from the EvaluatePharma® website (www.evaluatepharma.com) shall remain the property of EvaluatePharma Ltd. No copies may be made of this document except for personal use without the prior written consent of EvaluatePharma Ltd. Distribution of this document to non-registered users of EvaluatePharma® is prohibited without the prior written consent of EvaluatePharma Ltd.
© EvaluatePharma Ltd., 11-29 Fashion Street, London E1 6P
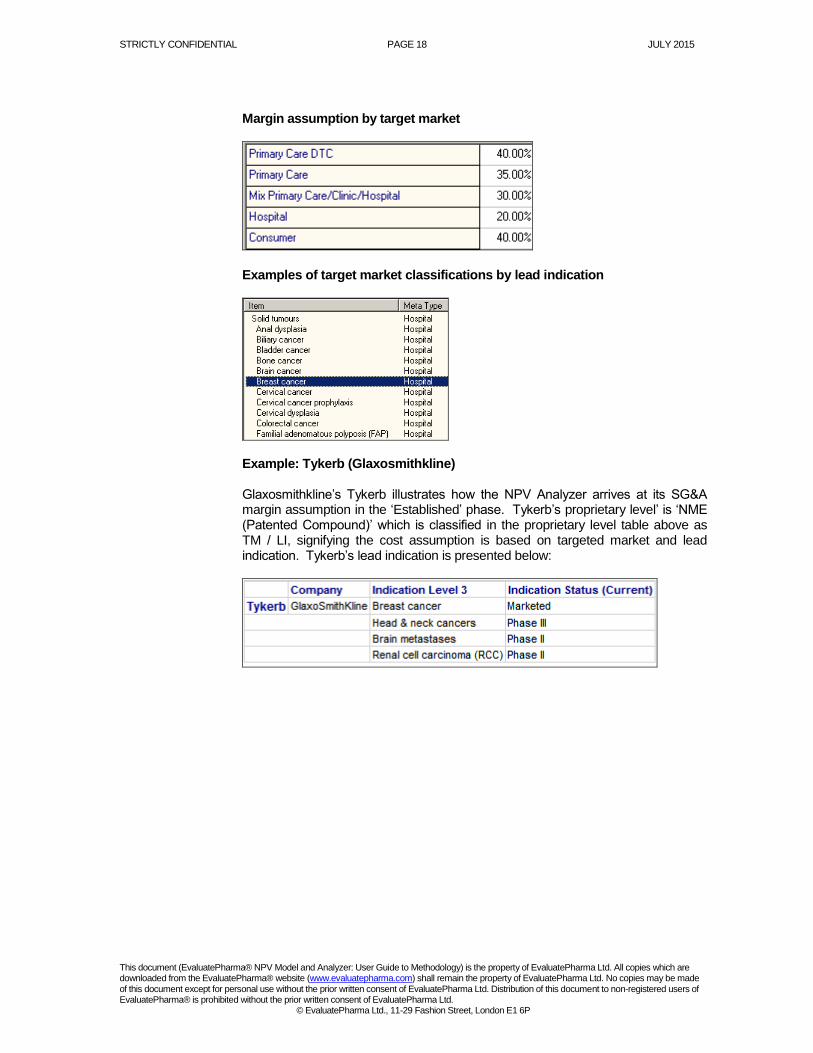
Margin assumption by target market
Examples of target market classifications by lead indication
Example: Tykerb (Glaxosmithkline) Glaxosmithkline’s Tykerb illustrates how the NPV Analyzer arrives at its SG&A margin assumption in the ‘Established’ phase. Tykerb’s proprietary level’ is ‘NME (Patented Compound)’ which is classified in the proprietary level table above as TM / LI, signifying the cost assumption is based on targeted market and lead indication. Tykerb’s lead indication is presented below:
STRICTLY CONFIDENTIAL PAGE 19 JULY 2015
This document (EvaluatePharma® NPV Model and Analyzer: User Guide to Methodology) is the property of EvaluatePharma Ltd. All copies which are downloaded from the EvaluatePharma® website (www.evaluatepharma.com) shall remain the property of EvaluatePharma Ltd. No copies may be made of this document except for personal use without the prior written consent of EvaluatePharma Ltd. Distribution of this document to non-registered users of EvaluatePharma® is prohibited without the prior written consent of EvaluatePharma Ltd.
© EvaluatePharma Ltd., 11-29 Fashion Street, London E1 6P
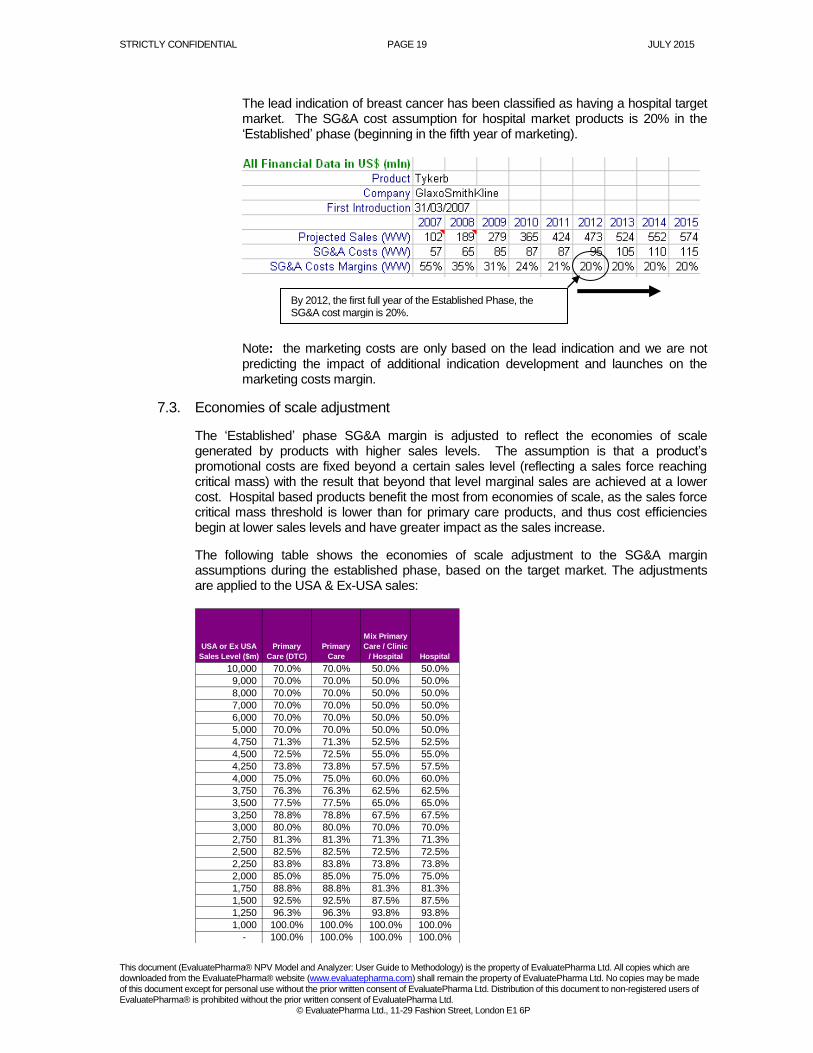
The lead indication of breast cancer has been classified as having a hospital target market. The SG&A cost assumption for hospital market products is 20% in the ‘Established’ phase (beginning in the fifth year of marketing).
Note: the marketing costs are only based on the lead indication and we are not predicting the impact of additional indication development and launches on the marketing costs margin.
7.3. Economies of scale adjustment
The ‘Established’ phase SG&A margin is adjusted to reflect the economies of scale generated by products with higher sales levels. The assumption is that a product’s promotional costs are fixed beyond a certain sales level (reflecting a sales force reaching critical mass) with the result that beyond that level marginal sales are achieved at a lower cost. Hospital based products benefit the most from economies of scale, as the sales force critical mass threshold is lower than for primary care products, and thus cost efficiencies begin at lower sales levels and have greater impact as the sales increase.
The following table shows the economies of scale adjustment to the SG&A margin assumptions during the established phase, based on the target market. The adjustments are applied to the USA & Ex-USA sales:
USA or Ex USA
Sales Level ($m)
Primary
Care (DTC)
Primary
Care
Mix Primary
Care / Clinic
/ Hospital Hospital
10,000 70.0% 70.0% 50.0% 50.0%
9,000 70.0% 70.0% 50.0% 50.0%
8,000 70.0% 70.0% 50.0% 50.0%
7,000 70.0% 70.0% 50.0% 50.0%
6,000 70.0% 70.0% 50.0% 50.0%
5,000 70.0% 70.0% 50.0% 50.0%
4,750 71.3% 71.3% 52.5% 52.5%
4,500 72.5% 72.5% 55.0% 55.0%
4,250 73.8% 73.8% 57.5% 57.5%
4,000 75.0% 75.0% 60.0% 60.0%
3,750 76.3% 76.3% 62.5% 62.5%
3,500 77.5% 77.5% 65.0% 65.0%
3,250 78.8% 78.8% 67.5% 67.5%
3,000 80.0% 80.0% 70.0% 70.0%
2,750 81.3% 81.3% 71.3% 71.3%
2,500 82.5% 82.5% 72.5% 72.5%
2,250 83.8% 83.8% 73.8% 73.8%
2,000 85.0% 85.0% 75.0% 75.0%
1,750 88.8% 88.8% 81.3% 81.3%
1,500 92.5% 92.5% 87.5% 87.5%
1,250 96.3% 96.3% 93.8% 93.8%
1,000 100.0% 100.0% 100.0% 100.0%
- 100.0% 100.0% 100.0% 100.0%
By 2012, the first full year of the Established Phase, the SG&A cost margin is 20%.
STRICTLY CONFIDENTIAL PAGE 20 JULY 2015
This document (EvaluatePharma® NPV Model and Analyzer: User Guide to Methodology) is the property of EvaluatePharma Ltd. All copies which are downloaded from the EvaluatePharma® website (www.evaluatepharma.com) shall remain the property of EvaluatePharma Ltd. No copies may be made of this document except for personal use without the prior written consent of EvaluatePharma Ltd. Distribution of this document to non-registered users of EvaluatePharma® is prohibited without the prior written consent of EvaluatePharma Ltd.
© EvaluatePharma Ltd., 11-29 Fashion Street, London E1 6P
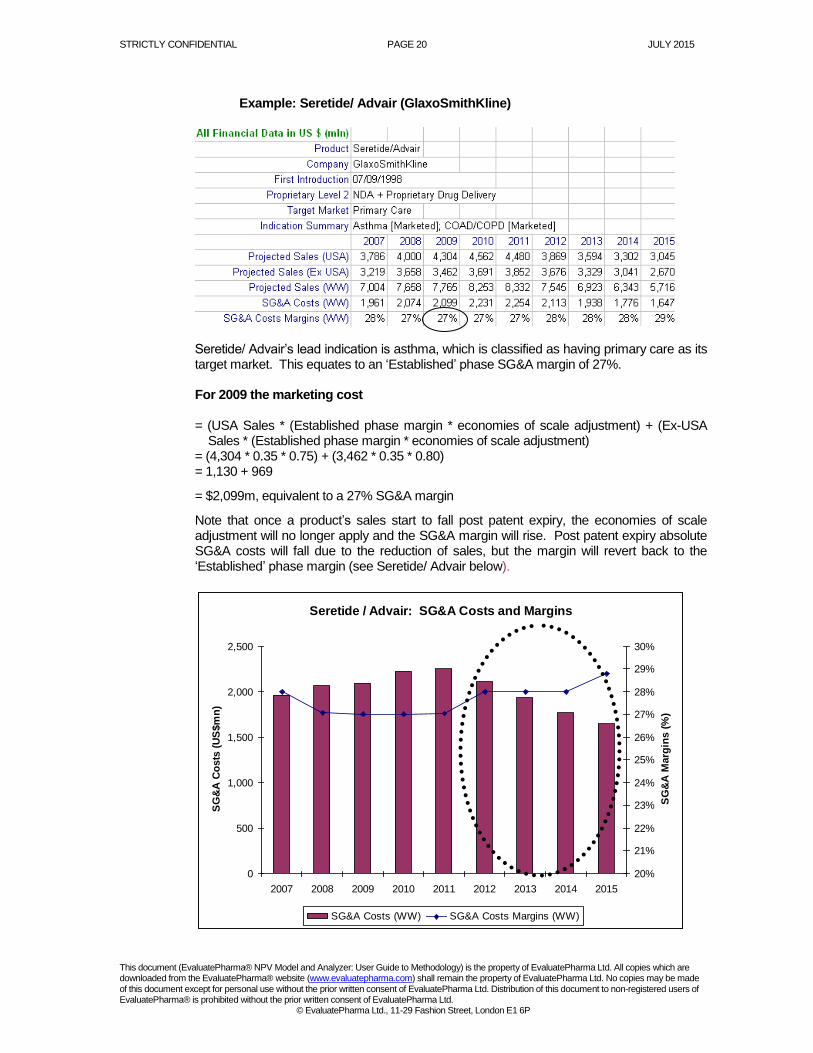
Example: Seretide/ Advair (GlaxoSmithKline)
Seretide/ Advair’s lead indication is asthma, which is classified as having primary care as its target market. This equates to an ‘Established’ phase SG&A margin of 27%. For 2009 the marketing cost = (USA Sales * (Established phase margin * economies of scale adjustment) + (Ex-USA
Sales * (Established phase margin * economies of scale adjustment) = (4,304 * 0.35 * 0.75) + (3,462 * 0.35 * 0.80) = 1,130 + 969
= $2,099m, equivalent to a 27% SG&A margin
Note that once a product’s sales start to fall post patent expiry, the economies of scale adjustment will no longer apply and the SG&A margin will rise. Post patent expiry absolute SG&A costs will fall due to the reduction of sales, but the margin will revert back to the ‘Established’ phase margin (see Seretide/ Advair below).
Seretide / Advair: SG&A Costs and Margins
0
500
1,000
1,500
2,000
2,500
2007 2008 2009 2010 2011 2012 2013 2014 2015
SG
&A
Co
sts
(U
S$m
n)
20%
21%
22%
23%
24%
25%
26%
27%
28%
29%
30%
SG
&A
Marg
ins (
%)
SG&A Costs (WW) SG&A Costs Margins (WW)
STRICTLY CONFIDENTIAL PAGE 21 JULY 2015
This document (EvaluatePharma® NPV Model and Analyzer: User Guide to Methodology) is the property of EvaluatePharma Ltd. All copies which are downloaded from the EvaluatePharma® website (www.evaluatepharma.com) shall remain the property of EvaluatePharma Ltd. No copies may be made of this document except for personal use without the prior written consent of EvaluatePharma Ltd. Distribution of this document to non-registered users of EvaluatePharma® is prohibited without the prior written consent of EvaluatePharma Ltd.
© EvaluatePharma Ltd., 11-29 Fashion Street, London E1 6P
8. R&D Costs EvaluatePharma®’s NPVs Analyzer does not allocate costs for research & development (R&D) on a per product basis. For the most part, particularly with regards to existing marketed products, R&D is an historical, ‘sunk’ cost. It is also assumed that established biopharmaceutical companies’ R&D expenses are relatively fixed as a percentage of sales, and are not significantly altered by the fates of individual products. These assumptions allow individual products to be modelled on a marginal profit basis and offer useful insights into the potential impact individual products or product-driven events have on a company’s share price.
Admittedly, the assumptions described above are more suspect with regards to smaller and / or earlier stage companies, where well defined levels of R&D expense are not a given, and may need to be altered substantially based on the presence or absence of cash flow available to fund them. However, we have determined that the benefits of uniformity outweigh these potential shortcomings, and have chosen to treat all products from all companies in the same manner. This is consistent with the methodology employed by most equity analysts in our experience. Nevertheless, we are mindful that in the case of smaller and earlier stage companies the conclusions that are drawn from the product NPV analyses, especially as they relate to overall company value, must be viewed with heightened caution.
9. Profit Sharing Agreements
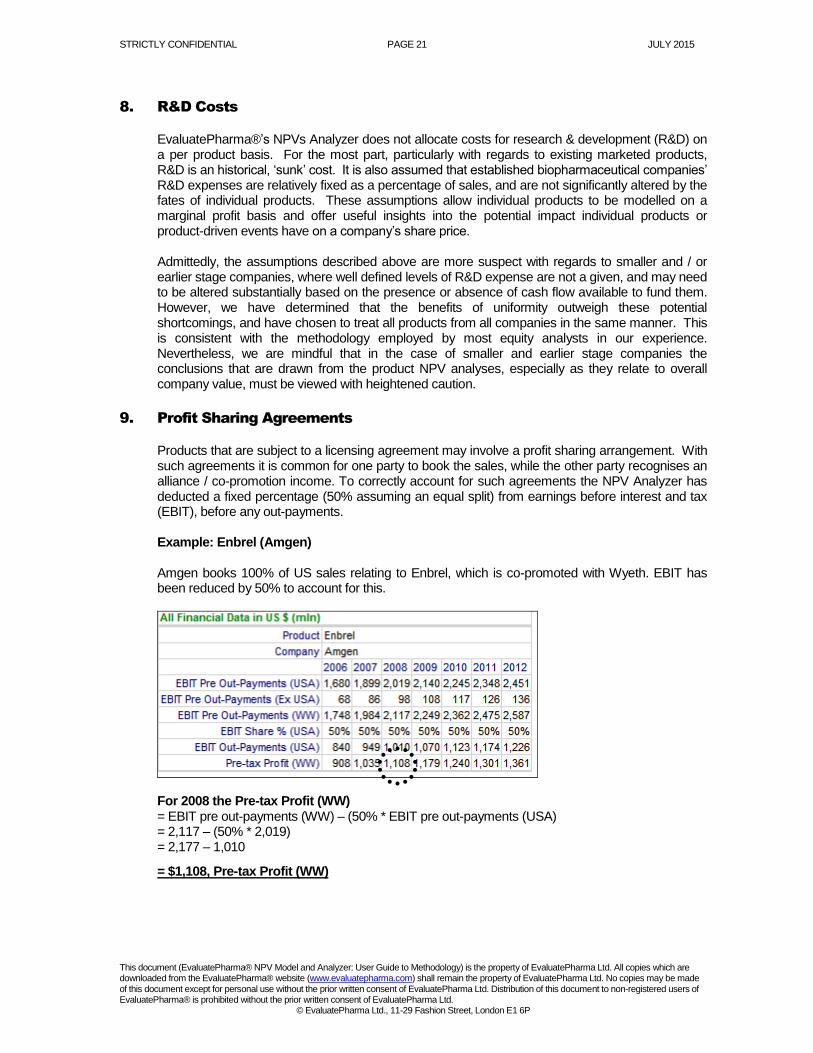
Products that are subject to a licensing agreement may involve a profit sharing arrangement. With such agreements it is common for one party to book the sales, while the other party recognises an alliance / co-promotion income. To correctly account for such agreements the NPV Analyzer has deducted a fixed percentage (50% assuming an equal split) from earnings before interest and tax (EBIT), before any out-payments. Example: Enbrel (Amgen) Amgen books 100% of US sales relating to Enbrel, which is co-promoted with Wyeth. EBIT has been reduced by 50% to account for this.
For 2008 the Pre-tax Profit (WW) = EBIT pre out-payments (WW) – (50% * EBIT pre out-payments (USA) = 2,117 – (50% * 2,019) = 2,177 – 1,010
= $1,108, Pre-tax Profit (WW)
STRICTLY CONFIDENTIAL PAGE 22 JULY 2015
This document (EvaluatePharma® NPV Model and Analyzer: User Guide to Methodology) is the property of EvaluatePharma Ltd. All copies which are downloaded from the EvaluatePharma® website (www.evaluatepharma.com) shall remain the property of EvaluatePharma Ltd. No copies may be made of this document except for personal use without the prior written consent of EvaluatePharma Ltd. Distribution of this document to non-registered users of EvaluatePharma® is prohibited without the prior written consent of EvaluatePharma Ltd.
© EvaluatePharma Ltd., 11-29 Fashion Street, London E1 6P
Other Revenues (Royalty, Alliance/ Co-promotion & JV Income)
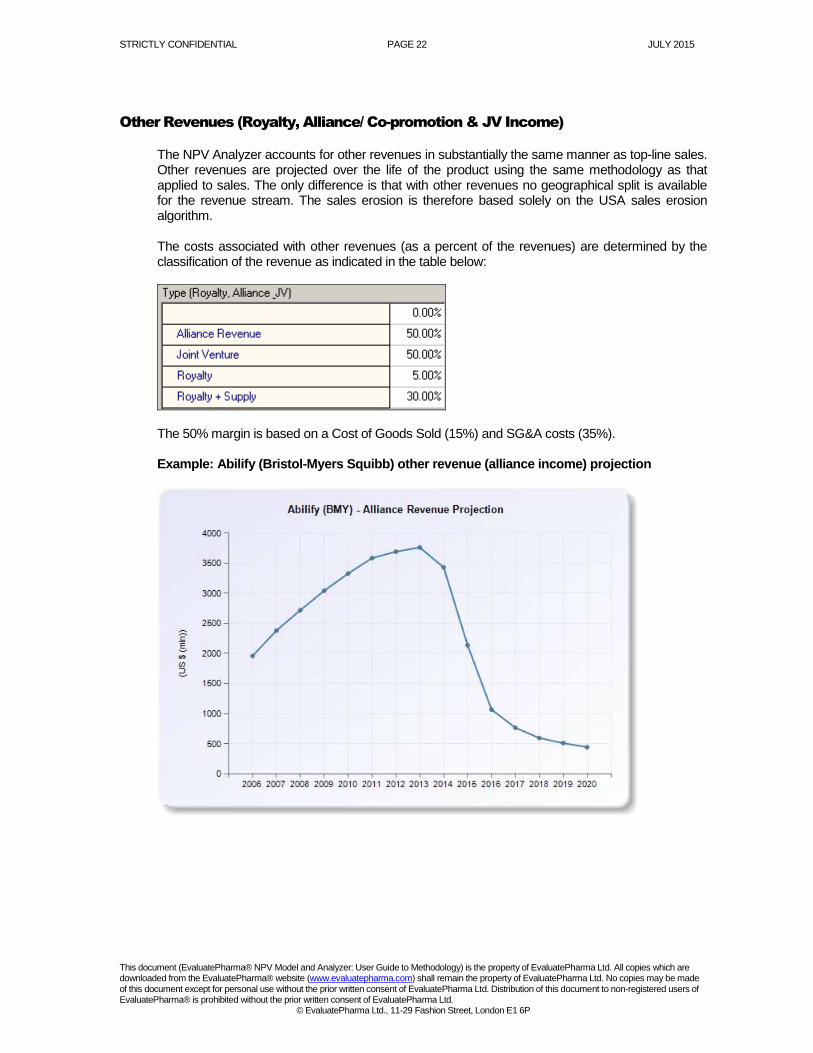
The NPV Analyzer accounts for other revenues in substantially the same manner as top-line sales. Other revenues are projected over the life of the product using the same methodology as that applied to sales. The only difference is that with other revenues no geographical split is available for the revenue stream. The sales erosion is therefore based solely on the USA sales erosion algorithm.
The costs associated with other revenues (as a percent of the revenues) are determined by the classification of the revenue as indicated in the table below:
The 50% margin is based on a Cost of Goods Sold (15%) and SG&A costs (35%). Example: Abilify (Bristol-Myers Squibb) other revenue (alliance income) projection
STRICTLY CONFIDENTIAL PAGE 23 JULY 2015
This document (EvaluatePharma® NPV Model and Analyzer: User Guide to Methodology) is the property of EvaluatePharma Ltd. All copies which are downloaded from the EvaluatePharma® website (www.evaluatepharma.com) shall remain the property of EvaluatePharma Ltd. No copies may be made of this document except for personal use without the prior written consent of EvaluatePharma Ltd. Distribution of this document to non-registered users of EvaluatePharma® is prohibited without the prior written consent of EvaluatePharma Ltd.
© EvaluatePharma Ltd., 11-29 Fashion Street, London E1 6P
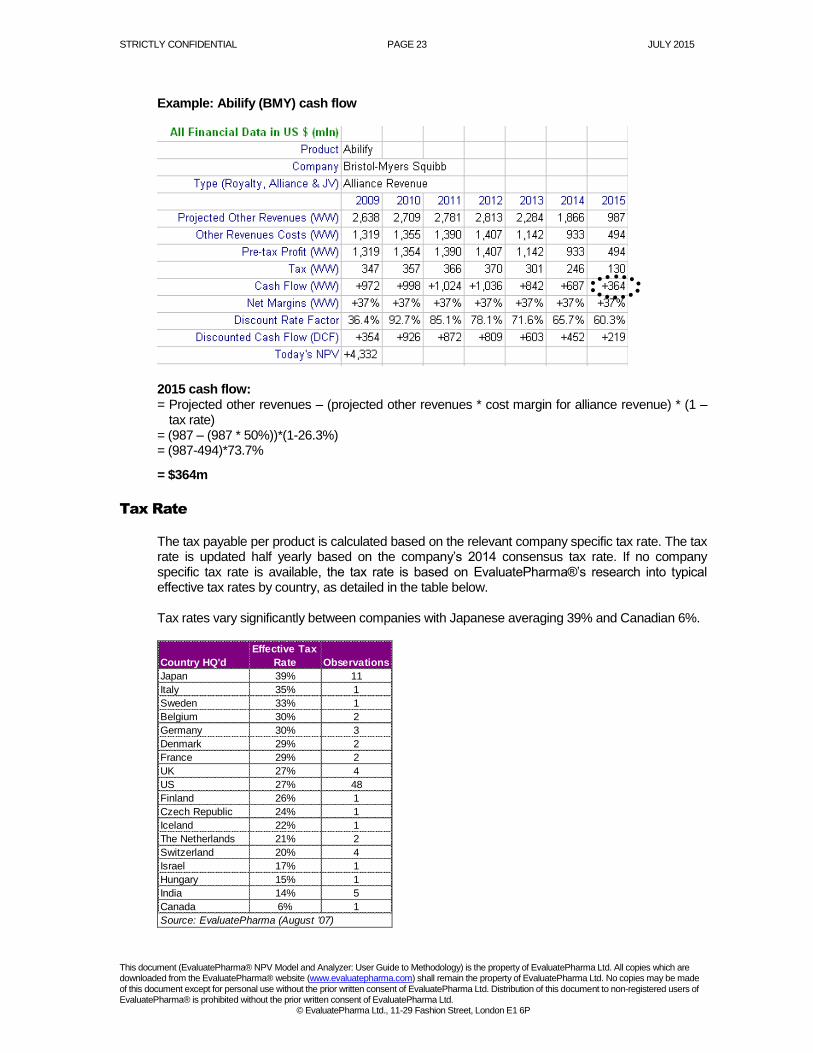
Example: Abilify (BMY) cash flow
2015 cash flow: = Projected other revenues – (projected other revenues * cost margin for alliance revenue) * (1 –
tax rate) = (987 – (987 * 50%))*(1-26.3%) = (987-494)*73.7%
= $364m
Tax Rate
The tax payable per product is calculated based on the relevant company specific tax rate. The tax rate is updated half yearly based on the company’s 2014 consensus tax rate. If no company specific tax rate is available, the tax rate is based on EvaluatePharma®’s research into typical effective tax rates by country, as detailed in the table below. Tax rates vary significantly between companies with Japanese averaging 39% and Canadian 6%.
Country HQ'd
Effective Tax
Rate Observations
Japan 39% 11
Italy 35% 1
Sweden 33% 1
Belgium 30% 2
Germany 30% 3
Denmark 29% 2
France 29% 2
UK 27% 4
US 27% 48
Finland 26% 1
Czech Republic 24% 1
Iceland 22% 1
The Netherlands 21% 2
Switzerland 20% 4
Israel 17% 1
Hungary 15% 1
India 14% 5
Canada 6% 1
Source: EvaluatePharma (August '07)

STRICTLY CONFIDENTIAL PAGE 24 JULY 2015
This document (EvaluatePharma® NPV Model and Analyzer: User Guide to Methodology) is the property of EvaluatePharma Ltd. All copies which are downloaded from the EvaluatePharma® website (www.evaluatepharma.com) shall remain the property of EvaluatePharma Ltd. No copies may be made of this document except for personal use without the prior written consent of EvaluatePharma Ltd. Distribution of this document to non-registered users of EvaluatePharma® is prohibited without the prior written consent of EvaluatePharma Ltd.
© EvaluatePharma Ltd., 11-29 Fashion Street, London E1 6P
Discount Rate
From December 2009 (the inception of Evaluate’s NPV Analyzer) to June 26th 2015, a discount
rate of 9% has been used to calculate product NPVs. From the 26th June onwards we have
modified the discount rate and have chosen a discount rate based on company size to calculate
the NPV for all products. We have decided to vary the discount rate by size of the company as it
allows us to effectively use a WACC which reflects the different expected returns/risk assumptions
associated with smaller companies. The rates chosen are those typically used within industry and
allow us to factor in the company size and risk into valuation. The NPV Analyzer offers users full
flexibility in making their own assumptions as to the discount rate. The discount rates used are as
following:
6.5% for a large company ($30bn+)
9% for a midcap company ($2.5bn - $30bn)
11.5% for a small size cap company ($250m - $2.5bn)
14% for a microcap company ($100m - $250m)
14% of a nanocap company (<$100m)
Below illustrates the impact that changing the discount rate has on certain products as of June
2015.
Sovaldi (Gilead)
Discount rate of 9%: NPV $11.743 billion
Discount rate of 6.5%: NPV $13.317 billion
Orkambi (Vertex)
Discount rate of 9%: NPV $17.029 billion
Discount rate of 6.5%: NPV $20.379 billion
Repatha (Amgen)
Discount rate of 9%: NPV $8.739 billion
Discount rate of 6.5%: NPV: $11.347 billion
The discount rate is applied to the product’s annual cash flows to determine NPV of the product.
For each year, a discount rate factor is calculated, which when multiplied by the year’s cash flow,
yields the present value. The discount rate factor is a function of discount rate and the number of
periods over which the cash flow is to be compounded. The annual present values are then
summed and a terminal value added, yielding the NPV.
The NPV Analyzer utilises continuous compounding – cash flows are discounted instantaneously
as they occur. As cash flows are assumed to occur evenly throughout the year, the average time
over which they are compounded in a given year is half a year. However, as the NPV Analyzer’s
temporal point of reference is always the present day, unless it is 31 December, the first
compounding period will be a partial year. For partial years the average compounding period is
less than half a year. Also, only cash flows that occur in the future factor in the NPV calculation.
The discount rate factor in a partial year is adjusted downwards to reflect that only part of the
annual cash flows – those occurring from present day to the end of the year – are to be discounted
to present value.
STRICTLY CONFIDENTIAL PAGE 25 JULY 2015
This document (EvaluatePharma® NPV Model and Analyzer: User Guide to Methodology) is the property of EvaluatePharma Ltd. All copies which are downloaded from the EvaluatePharma® website (www.evaluatepharma.com) shall remain the property of EvaluatePharma Ltd. No copies may be made of this document except for personal use without the prior written consent of EvaluatePharma Ltd. Distribution of this document to non-registered users of EvaluatePharma® is prohibited without the prior written consent of EvaluatePharma Ltd.
© EvaluatePharma Ltd., 11-29 Fashion Street, London E1 6P
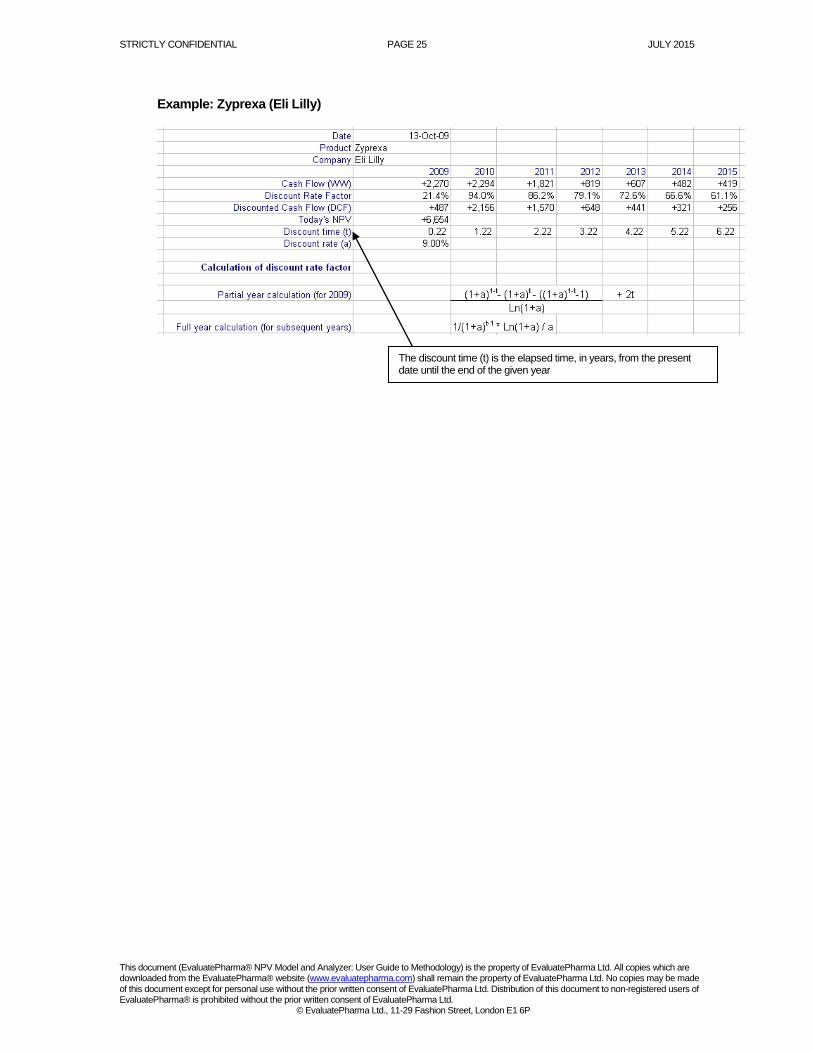
Example: Zyprexa (Eli Lilly)
The discount time (t) is the elapsed time, in years, from the present date until the end of the given year
STRICTLY CONFIDENTIAL PAGE 26 JULY 2015
This document (EvaluatePharma® NPV Model and Analyzer: User Guide to Methodology) is the property of EvaluatePharma Ltd. All copies which are downloaded from the EvaluatePharma® website (www.evaluatepharma.com) shall remain the property of EvaluatePharma Ltd. No copies may be made of this document except for personal use without the prior written consent of EvaluatePharma Ltd. Distribution of this document to non-registered users of EvaluatePharma® is prohibited without the prior written consent of EvaluatePharma Ltd.
© EvaluatePharma Ltd., 11-29 Fashion Street, London E1 6P
Risk Adjustments
What Are the Appropriate Risk Adjustments?
EvaluatePharma® believes that product forecasts should be adjusted for the following types of
risk:
Development risk (probability to launch)
Withdrawal risk
Competition risk
Development risk measures the probability that a product in the R&D phase will be approved by
regulatory authorities and commercialised (known as ‘probability to launch’). It is the single largest
risk factor for any product – early stage compounds have only a small probability of reaching
commercialisation. As a product progresses through clinical trials, the probability that it will be
commercialised increases. In forecasting sales for a product still in the R&D phase, equity
research analysts generally adjust their annual estimates by a probability weight that represents
the cumulative likelihood that it will progress through the remaining clinical phases to regulatory
approval and commercialisation. For some companies, typically smaller biotechs, equity analysts
forecast sales for R&D products which do not include an adjustment for the probability to launch.
In such cases, forecasts represent a best case scenario rather than a risk adjusted outcome.
Analysts account for development risk by using a high discount rate (30-40%) to value these
companies.
Since those products with forecasts that have not been adjusted for development risk will have
artificially high NPVs; EvaluatePharma® corrects for this by applying its own development risk
adjustments. The methodology is described in the following pages.
Withdrawal risk is the probability that a product already commercialised will be removed from the
market (voluntarily or otherwise) for safety reasons. In recent years, high profile product
withdrawals such as Vioxx have brought product safety issues to public attention and heightened
the vigilance of regulatory authorities. This has arguably increased withdrawal risk.
Competition risk measures the probability that a product’s market share will be diminished by
other products competing for sales in the same therapeutic indication and / or drug class. As in
most industries, competition is a part of doing business in the biopharmaceutical sector. Nearly all
diseases have multiple treatment alternatives. Competition risk is assumed to increase over time,
as companies seek to gain share of the larger disease markets by releasing new products and the
progress of R&D results in improved therapy options for consumers.
Adjusting Analyst Forecasts for the Probability to Launch
The NPV Analyzer adjusts the consensus sales forecasts for those products it deems equity analysts are not probability weighting for development risk. In these cases, The NPV Analyzer assumes the forecasts are based on a best case scenario (100% probability to launch) and thus adjusts the forecasts downwards by a fixed percentage to reflect the risk that the products might fail in development. Source of Probability of Launch Risk Weightings
STRICTLY CONFIDENTIAL PAGE 27 JULY 2015
This document (EvaluatePharma® NPV Model and Analyzer: User Guide to Methodology) is the property of EvaluatePharma Ltd. All copies which are downloaded from the EvaluatePharma® website (www.evaluatepharma.com) shall remain the property of EvaluatePharma Ltd. No copies may be made of this document except for personal use without the prior written consent of EvaluatePharma Ltd. Distribution of this document to non-registered users of EvaluatePharma® is prohibited without the prior written consent of EvaluatePharma Ltd.
© EvaluatePharma Ltd., 11-29 Fashion Street, London E1 6P
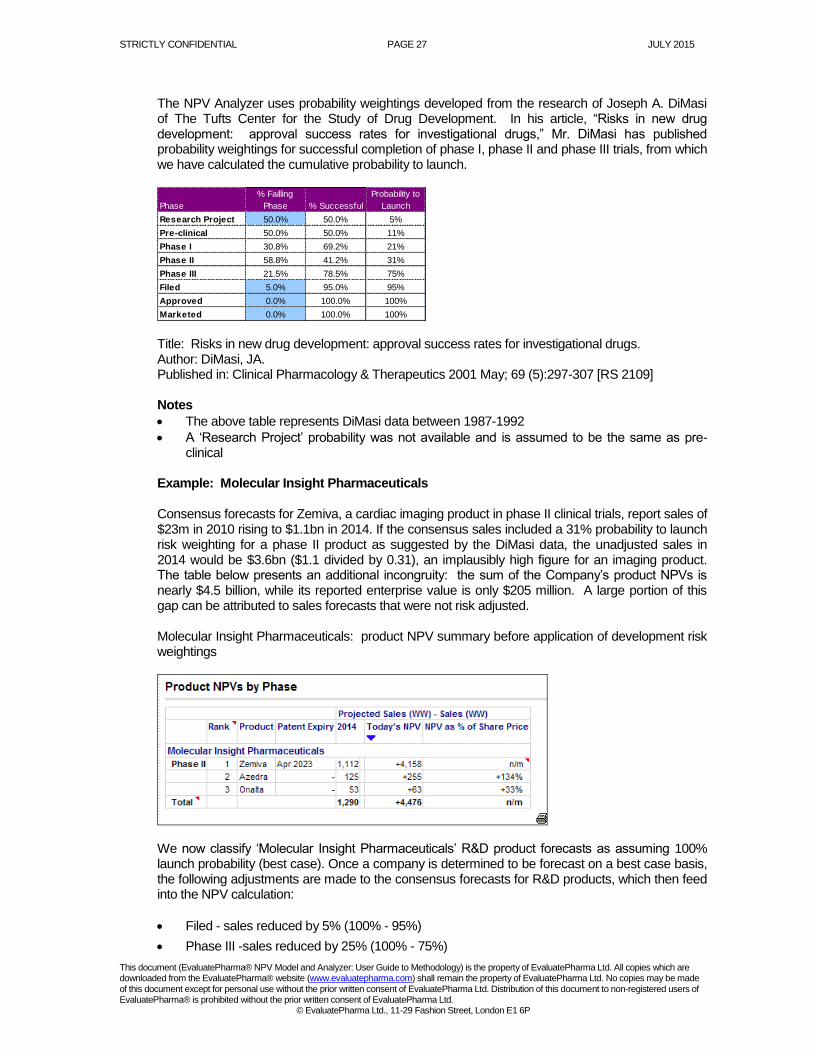
The NPV Analyzer uses probability weightings developed from the research of Joseph A. DiMasi of The Tufts Center for the Study of Drug Development. In his article, “Risks in new drug development: approval success rates for investigational drugs,” Mr. DiMasi has published probability weightings for successful completion of phase I, phase II and phase III trials, from which we have calculated the cumulative probability to launch.
Phase
% Failling
Phase % Successful
Probability to
Launch
Research Project 50.0% 50.0% 5%
Pre-clinical 50.0% 50.0% 11%
Phase I 30.8% 69.2% 21%
Phase II 58.8% 41.2% 31%
Phase III 21.5% 78.5% 75%
Filed 5.0% 95.0% 95%
Approved 0.0% 100.0% 100%
Marketed 0.0% 100.0% 100% Title: Risks in new drug development: approval success rates for investigational drugs. Author: DiMasi, JA. Published in: Clinical Pharmacology & Therapeutics 2001 May; 69 (5):297-307 [RS 2109] Notes
The above table represents DiMasi data between 1987-1992
A ‘Research Project’ probability was not available and is assumed to be the same as pre-clinical
Example: Molecular Insight Pharmaceuticals Consensus forecasts for Zemiva, a cardiac imaging product in phase II clinical trials, report sales of $23m in 2010 rising to $1.1bn in 2014. If the consensus sales included a 31% probability to launch risk weighting for a phase II product as suggested by the DiMasi data, the unadjusted sales in 2014 would be $3.6bn ($1.1 divided by 0.31), an implausibly high figure for an imaging product. The table below presents an additional incongruity: the sum of the Company’s product NPVs is nearly $4.5 billion, while its reported enterprise value is only $205 million. A large portion of this gap can be attributed to sales forecasts that were not risk adjusted. Molecular Insight Pharmaceuticals: product NPV summary before application of development risk weightings
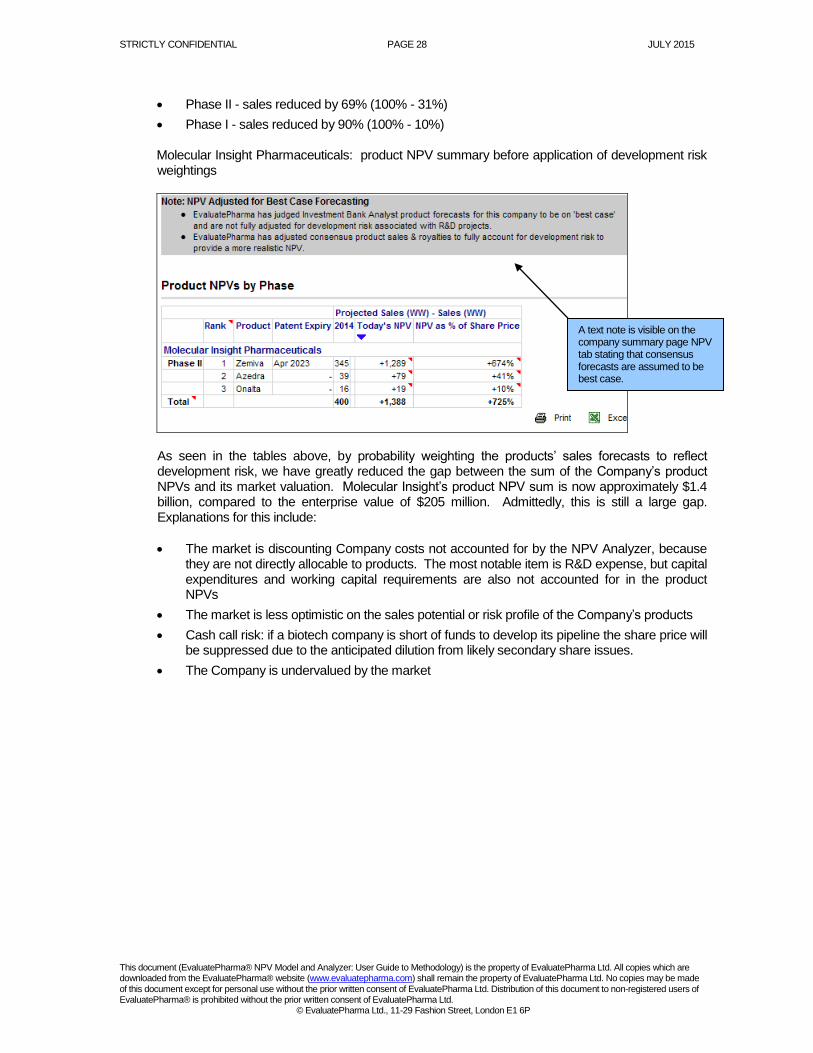
We now classify ‘Molecular Insight Pharmaceuticals’ R&D product forecasts as assuming 100% launch probability (best case). Once a company is determined to be forecast on a best case basis, the following adjustments are made to the consensus forecasts for R&D products, which then feed into the NPV calculation:
Filed - sales reduced by 5% (100% - 95%)
Phase III -sales reduced by 25% (100% - 75%)
STRICTLY CONFIDENTIAL PAGE 28 JULY 2015
This document (EvaluatePharma® NPV Model and Analyzer: User Guide to Methodology) is the property of EvaluatePharma Ltd. All copies which are downloaded from the EvaluatePharma® website (www.evaluatepharma.com) shall remain the property of EvaluatePharma Ltd. No copies may be made of this document except for personal use without the prior written consent of EvaluatePharma Ltd. Distribution of this document to non-registered users of EvaluatePharma® is prohibited without the prior written consent of EvaluatePharma Ltd.
© EvaluatePharma Ltd., 11-29 Fashion Street, London E1 6P
Phase II - sales reduced by 69% (100% - 31%)
Phase I - sales reduced by 90% (100% - 10%)
Molecular Insight Pharmaceuticals: product NPV summary before application of development risk weightings
As seen in the tables above, by probability weighting the products’ sales forecasts to reflect development risk, we have greatly reduced the gap between the sum of the Company’s product NPVs and its market valuation. Molecular Insight’s product NPV sum is now approximately $1.4 billion, compared to the enterprise value of $205 million. Admittedly, this is still a large gap. Explanations for this include:
The market is discounting Company costs not accounted for by the NPV Analyzer, because they are not directly allocable to products. The most notable item is R&D expense, but capital expenditures and working capital requirements are also not accounted for in the product NPVs
The market is less optimistic on the sales potential or risk profile of the Company’s products
Cash call risk: if a biotech company is short of funds to develop its pipeline the share price will be suppressed due to the anticipated dilution from likely secondary share issues.
The Company is undervalued by the market
A text note is visible on the company summary page NPV tab stating that consensus forecasts are assumed to be best case.
STRICTLY CONFIDENTIAL PAGE 29 JULY 2015
This document (EvaluatePharma® NPV Model and Analyzer: User Guide to Methodology) is the property of EvaluatePharma Ltd. All copies which are downloaded from the EvaluatePharma® website (www.evaluatepharma.com) shall remain the property of EvaluatePharma Ltd. No copies may be made of this document except for personal use without the prior written consent of EvaluatePharma Ltd. Distribution of this document to non-registered users of EvaluatePharma® is prohibited without the prior written consent of EvaluatePharma Ltd.
© EvaluatePharma Ltd., 11-29 Fashion Street, London E1 6P
Viewing Adjusted and Unadjusted Consensus Sales Forecasts
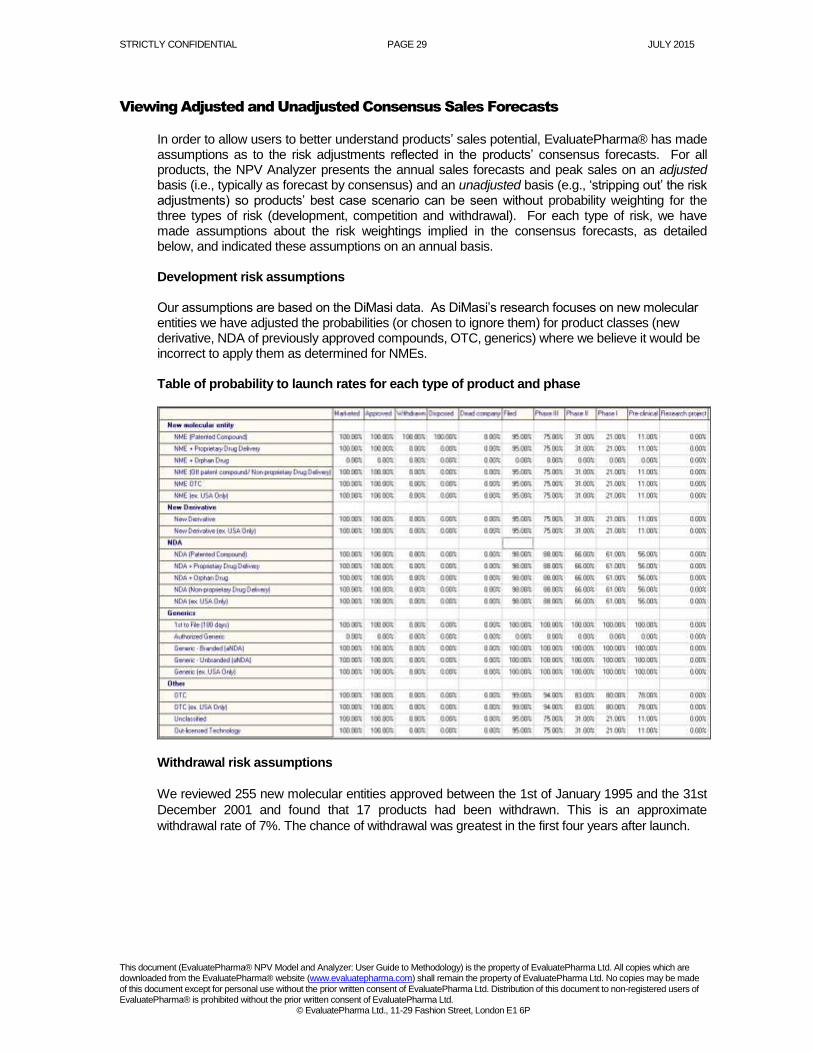
In order to allow users to better understand products’ sales potential, EvaluatePharma® has made assumptions as to the risk adjustments reflected in the products’ consensus forecasts. For all products, the NPV Analyzer presents the annual sales forecasts and peak sales on an adjusted basis (i.e., typically as forecast by consensus) and an unadjusted basis (e.g., ‘stripping out’ the risk adjustments) so products’ best case scenario can be seen without probability weighting for the three types of risk (development, competition and withdrawal). For each type of risk, we have made assumptions about the risk weightings implied in the consensus forecasts, as detailed below, and indicated these assumptions on an annual basis. Development risk assumptions Our assumptions are based on the DiMasi data. As DiMasi’s research focuses on new molecular entities we have adjusted the probabilities (or chosen to ignore them) for product classes (new derivative, NDA of previously approved compounds, OTC, generics) where we believe it would be incorrect to apply them as determined for NMEs.
Table of probability to launch rates for each type of product and phase
Withdrawal risk assumptions
We reviewed 255 new molecular entities approved between the 1st of January 1995 and the 31st
December 2001 and found that 17 products had been withdrawn. This is an approximate
withdrawal rate of 7%. The chance of withdrawal was greatest in the first four years after launch.

STRICTLY CONFIDENTIAL PAGE 30 JULY 2015
This document (EvaluatePharma® NPV Model and Analyzer: User Guide to Methodology) is the property of EvaluatePharma Ltd. All copies which are downloaded from the EvaluatePharma® website (www.evaluatepharma.com) shall remain the property of EvaluatePharma Ltd. No copies may be made of this document except for personal use without the prior written consent of EvaluatePharma Ltd. Distribution of this document to non-registered users of EvaluatePharma® is prohibited without the prior written consent of EvaluatePharma Ltd.
© EvaluatePharma Ltd., 11-29 Fashion Street, London E1 6P
Table of withdrawal risk per year and cumulative
Competition risk assumptions
It is assumed the risk of competition increases with time. Our research indicates that the majority of products for which the consensus forecast predicts growth exhibit a moderating growth curve. However, our review of the historical sales of most successful NMEs revealed growth curves that were straighter than the typical forecasts. The difference, we believe, reflect the consensus competition risk assumptions.
Example: Humira historic and forecast sales (adjusted and unadjusted for competition risk)
0
1,000
2,000
3,000
4,000
5,000
6,000
7,000
8,000
9,000
2003 2004 2005 2006 2007 2008 2009 2010 2011 2012 2013 2014 2015
Sa
les
($
m)
Sales - Adjusted Sales - Unadjusted
Table of Competition Risk per Year and Cumulative
Example: FTY720 (Novartis)
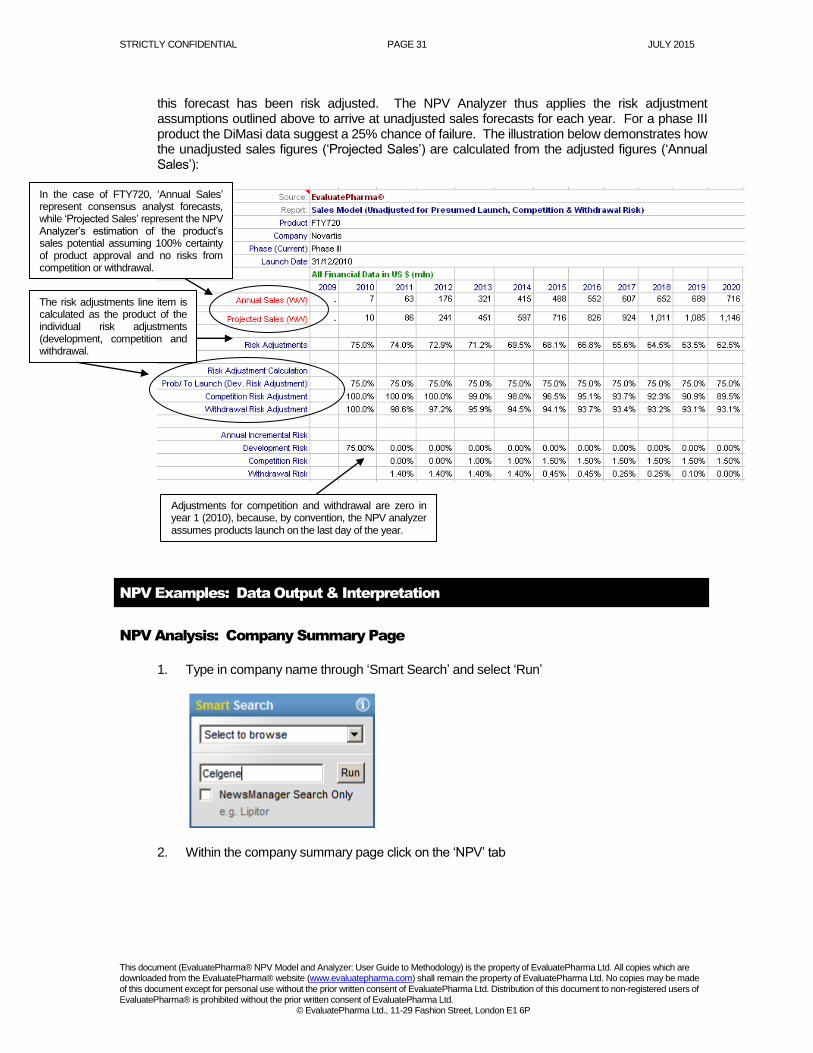
Novartis’ FTY720, a phase III project for multiple sclerosis, currently has 2012 consensus sales of $216m. Given the well-publicised safety concerns surrounding the product, as well as the drug class in general, and in the absence of clear evidence to the contrary, it is reasonable to assume
STRICTLY CONFIDENTIAL PAGE 31 JULY 2015
This document (EvaluatePharma® NPV Model and Analyzer: User Guide to Methodology) is the property of EvaluatePharma Ltd. All copies which are downloaded from the EvaluatePharma® website (www.evaluatepharma.com) shall remain the property of EvaluatePharma Ltd. No copies may be made of this document except for personal use without the prior written consent of EvaluatePharma Ltd. Distribution of this document to non-registered users of EvaluatePharma® is prohibited without the prior written consent of EvaluatePharma Ltd.
© EvaluatePharma Ltd., 11-29 Fashion Street, London E1 6P
this forecast has been risk adjusted. The NPV Analyzer thus applies the risk adjustment assumptions outlined above to arrive at unadjusted sales forecasts for each year. For a phase III product the DiMasi data suggest a 25% chance of failure. The illustration below demonstrates how the unadjusted sales figures (‘Projected Sales’) are calculated from the adjusted figures (‘Annual Sales’):
NPV Examples: Data Output & Interpretation
NPV Analysis: Company Summary Page
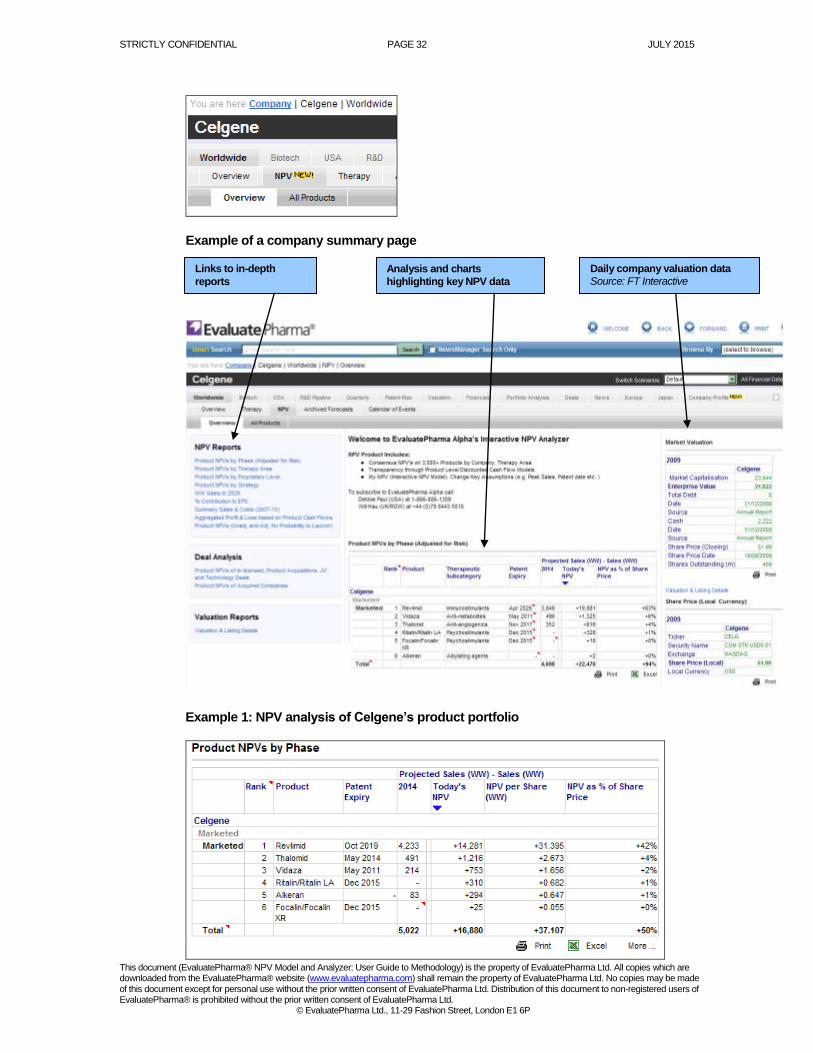
1. Type in company name through ‘Smart Search’ and select ‘Run’
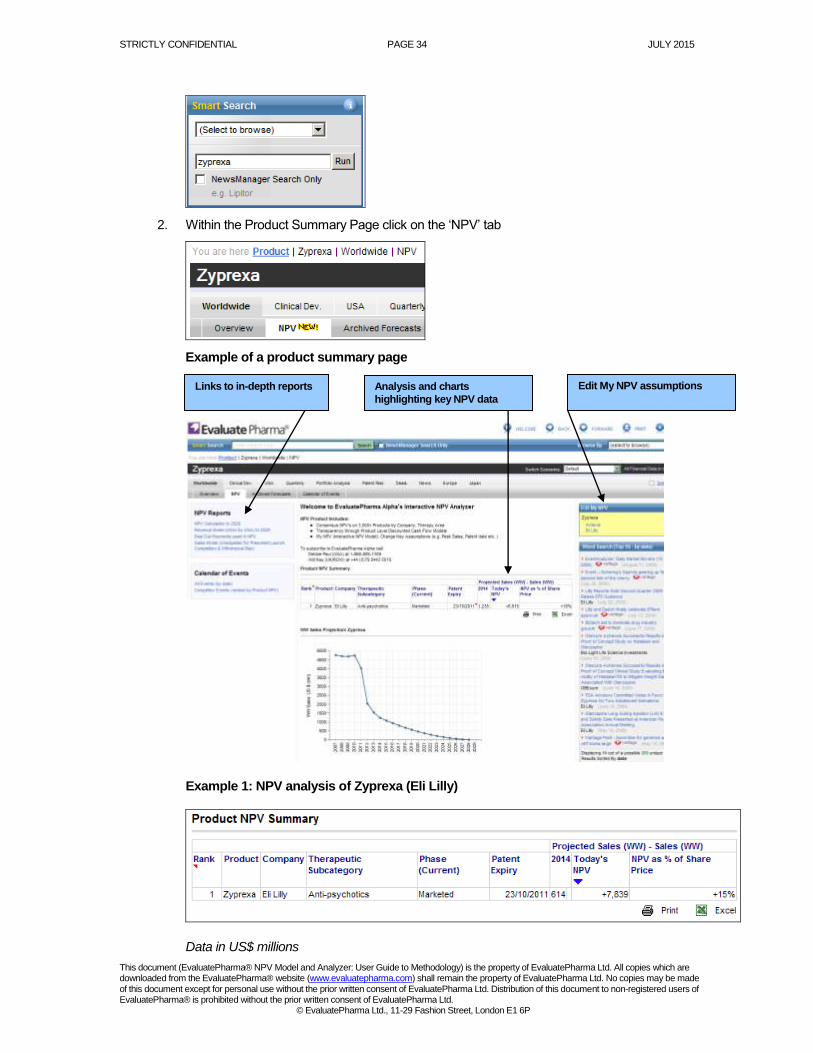
2. Within the company summary page click on the ‘NPV’ tab
In the case of FTY720, ‘Annual Sales’ represent consensus analyst forecasts, while ‘Projected Sales’ represent the NPV Analyzer’s estimation of the product’s sales potential assuming 100% certainty of product approval and no risks from competition or withdrawal.
The risk adjustments line item is calculated as the product of the individual risk adjustments (development, competition and withdrawal.
Adjustments for competition and withdrawal are zero in year 1 (2010), because, by convention, the NPV analyzer assumes products launch on the last day of the year.
STRICTLY CONFIDENTIAL PAGE 32 JULY 2015
This document (EvaluatePharma® NPV Model and Analyzer: User Guide to Methodology) is the property of EvaluatePharma Ltd. All copies which are downloaded from the EvaluatePharma® website (www.evaluatepharma.com) shall remain the property of EvaluatePharma Ltd. No copies may be made of this document except for personal use without the prior written consent of EvaluatePharma Ltd. Distribution of this document to non-registered users of EvaluatePharma® is prohibited without the prior written consent of EvaluatePharma Ltd.
© EvaluatePharma Ltd., 11-29 Fashion Street, London E1 6P
Example of a company summary page
Example 1: NPV analysis of Celgene’s product portfolio
Links to in-depth
reports
Analysis and charts
highlighting key NPV data
Daily company valuation data
Source: FT Interactive

STRICTLY CONFIDENTIAL PAGE 33 JULY 2015
This document (EvaluatePharma® NPV Model and Analyzer: User Guide to Methodology) is the property of EvaluatePharma Ltd. All copies which are downloaded from the EvaluatePharma® website (www.evaluatepharma.com) shall remain the property of EvaluatePharma Ltd. No copies may be made of this document except for personal use without the prior written consent of EvaluatePharma Ltd. Distribution of this document to non-registered users of EvaluatePharma® is prohibited without the prior written consent of EvaluatePharma Ltd.
© EvaluatePharma Ltd., 11-29 Fashion Street, London E1 6P
Data in US$ millions
Interpretation
The above analysis reveals the following:
1. Current value of product-by-product NPVs. The sum of the product-by-product
NPVs for Celgene based on consensus forecasts and EvaluatePharma® default
assumptions is $16.88bn.
2. The marginal contribution of individual products to the Company’s market value.
The NPV of the product Revlimid equates to $14.28bn or 42% of Celgene share price.
3. Comparison of the sum of a company’s product NPVs to its enterprise value. The
product by product NPV of $16.88bn can be compared to Celgene’s enterprise value of
$31bn, with certain caveats. Whereas Celgene’s enterprise value reflects the present
value of all expected future cash flows associated with the Company, the product by
product NPV only reflects the value of cash flows directly allocable to the products.
Significant cash outflows are excluded from the product NPV analysis. The largest such
item is R&D expense, but capital expenditures and changes in working capital
requirements are other items that do not factor in the product NPV calculation. Users
may apply a ‘quick and dirty’ adjustment to account for R&D expense by subtracting a
Company’s estimated five year tax-adjusted R&D spend from the sum of the product
NPVs. The NPV Analyzer provides estimates for this cost for each of the companies it
covers.
Given the exclusion of these outflows from its calculation, it is reasonable to conclude
that the sum of the product NPVs for a company overstates its true enterprise value. In
the case of Celgene, this suggests that the actual value differential is greater than that
suggested by simple subtraction of the NPV from the enterprise value*.
Explanations for the differential include:
Management’s ability to generate value going forward (track record in creating or destroying value via product development, in-licensing or mergers and acquisitions)
The market has overvalued the Company
Equity analysts are undervaluing the Company
Product NPVs under or overestimated due to assumptions
* This comparison is further complicated in the case of companies with significant sales
that cannot be attributed to individual products. EvaluatePharma® does not currently
value non-pharmaceutical divisions (e.g., Animal Health, Med tech) or pharmaceuticals
sales which cannot be attributed directly to a product. For these companies it is difficult
to draw any meaningful conclusion from a comparison of the sum of the product by
product NPVs and enterprise value.
NPV Analysis: Product Summary Page
1. Type in product name through ‘Smart Search’ and select ’Run’
STRICTLY CONFIDENTIAL PAGE 34 JULY 2015
This document (EvaluatePharma® NPV Model and Analyzer: User Guide to Methodology) is the property of EvaluatePharma Ltd. All copies which are downloaded from the EvaluatePharma® website (www.evaluatepharma.com) shall remain the property of EvaluatePharma Ltd. No copies may be made of this document except for personal use without the prior written consent of EvaluatePharma Ltd. Distribution of this document to non-registered users of EvaluatePharma® is prohibited without the prior written consent of EvaluatePharma Ltd.
© EvaluatePharma Ltd., 11-29 Fashion Street, London E1 6P
2. Within the Product Summary Page click on the ‘NPV’ tab
Example of a product summary page
Example 1: NPV analysis of Zyprexa (Eli Lilly)
Data in US$ millions
Links to in-depth reports Analysis and charts
highlighting key NPV data
Edit My NPV assumptions

STRICTLY CONFIDENTIAL PAGE 35 JULY 2015
This document (EvaluatePharma® NPV Model and Analyzer: User Guide to Methodology) is the property of EvaluatePharma Ltd. All copies which are downloaded from the EvaluatePharma® website (www.evaluatepharma.com) shall remain the property of EvaluatePharma Ltd. No copies may be made of this document except for personal use without the prior written consent of EvaluatePharma Ltd. Distribution of this document to non-registered users of EvaluatePharma® is prohibited without the prior written consent of EvaluatePharma Ltd.
© EvaluatePharma Ltd., 11-29 Fashion Street, London E1 6P
Interpretation
1. Illustrates consensus driven NPV of Zyprexa to Eli Lilly. The current NPV of
Zyprexa driven by consensus forecasts is $7,839bn.
2. The marginal contribution of Zyprexa to Eli Lilly’s market value: the current value
(NPV) of the Zyprexa equates to 15% of Eli Lilly’s share price.
3. Contribution to profits
It is estimated that Zyprexa currently contributes 49% to Lilly’s earnings per share. This
is forecast to drop to 7% by 2014. 4. Reveals USA and Ex-USA Sales Trend
Zyprexa is forecast to have rapid erosion in USA and Ex-USA sales following patent expiry in October 2010.
Ex-USA Sales
USA Sales
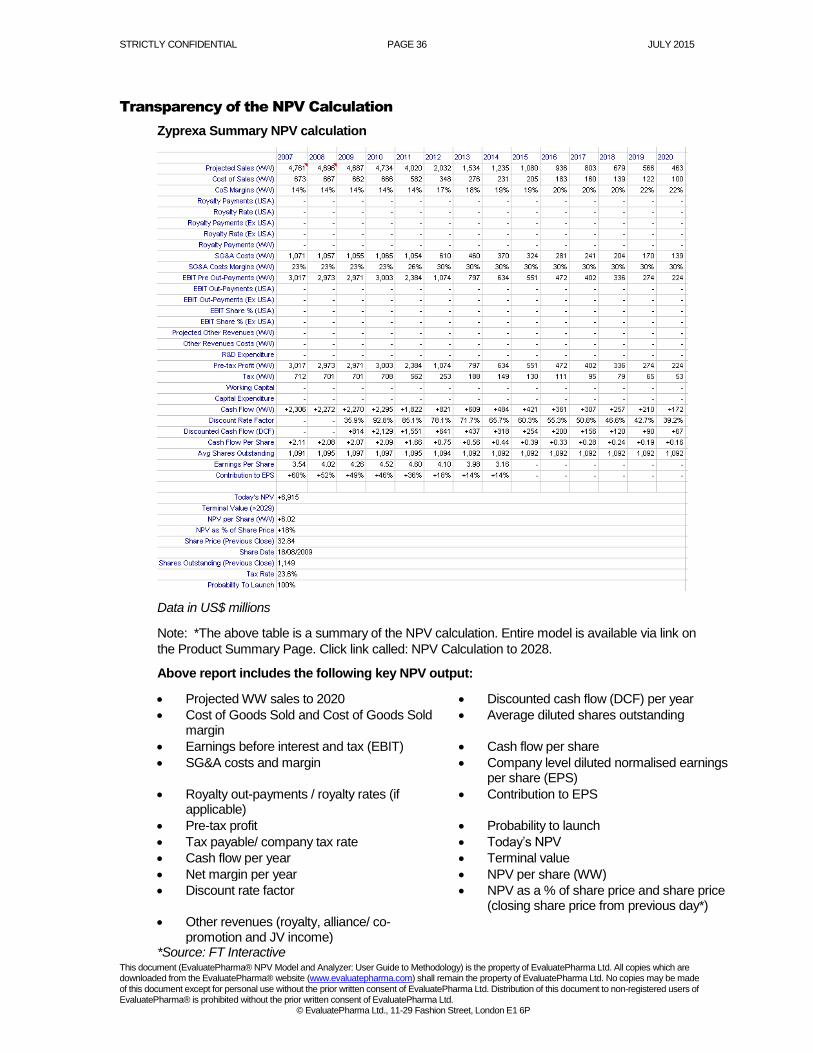
STRICTLY CONFIDENTIAL PAGE 36 JULY 2015
This document (EvaluatePharma® NPV Model and Analyzer: User Guide to Methodology) is the property of EvaluatePharma Ltd. All copies which are downloaded from the EvaluatePharma® website (www.evaluatepharma.com) shall remain the property of EvaluatePharma Ltd. No copies may be made of this document except for personal use without the prior written consent of EvaluatePharma Ltd. Distribution of this document to non-registered users of EvaluatePharma® is prohibited without the prior written consent of EvaluatePharma Ltd.
© EvaluatePharma Ltd., 11-29 Fashion Street, London E1 6P
Transparency of the NPV Calculation
Zyprexa Summary NPV calculation
Data in US$ millions
Note: *The above table is a summary of the NPV calculation. Entire model is available via link on
the Product Summary Page. Click link called: NPV Calculation to 2028.
Above report includes the following key NPV output:
Projected WW sales to 2020 Discounted cash flow (DCF) per year
Cost of Goods Sold and Cost of Goods Sold margin
Average diluted shares outstanding
Earnings before interest and tax (EBIT) Cash flow per share
SG&A costs and margin Company level diluted normalised earnings per share (EPS)
Royalty out-payments / royalty rates (if applicable)
Contribution to EPS
Pre-tax profit Probability to launch
Tax payable/ company tax rate Today’s NPV
Cash flow per year Terminal value
Net margin per year NPV per share (WW)
Discount rate factor NPV as a % of share price and share price (closing share price from previous day*)
Other revenues (royalty, alliance/ co-promotion and JV income)
*Source: FT Interactive