nrl09/21/2004_davis.1 goes-r and the hyperspectral environmental sensor (hes) suite curtiss o. davis...
TRANSCRIPT
NRL09/21/2004_Davis.1
GOES-R and the Hyperspectral Environmental Sensor (HES) Suite
GOES-R and the Hyperspectral Environmental Sensor (HES) Suite
Curtiss O. DavisCode 7203
Naval Research Laboratory
Washington, DC [email protected]
(202) 767-9296
NRL09/21/2004_Davis.2
Presentation OutlinePresentation Outline
• Why Geostationary imaging for the coastal ocean?• Status and Timeline For GOES-R• Instrument threshold and goal requirements• Products• Applications and Science• Issues we should consider at this meeting • Supporting the GOES-R HES definition studies.

NRL09/21/2004_Davis.3
Why Geostationary Imaging?Why Geostationary Imaging?
• The key advantage of a geostationary imager is frequency of revisit. – The coastal ocean is highly dynamic– Tides, diurnal winds, river runoff, upwelling and storm winds drive
currents from one to several knots – Tidal currents reverse every 6 hours. – HES-CW has a threshold requirement of sampling every 3 hours
and a goal of hourly• Ocean color imaging requires sunlight and few clouds;
– From Geostationary Earth Orbit (GEO) Image when cloud free not on fixed satellite orbit schedule
– The Advanced Baseline Imager (ABI) may be used to cue HES-CW• The sensor can stare at an area of interest for extended periods of time.
– Integrate longer to improve Signal-to-Noise Ratio (SNR)- Low Earth Orbit (LEO)the sensor is traveling at 7 km/sec plus
scanning +/- 50 degrees gives integration times on order of 1/100 sec- In GEO integration times can be a second or longer as needed.
NRL09/21/2004_Davis.4
Geostationary Field of RegardGeostationary Field of Regard
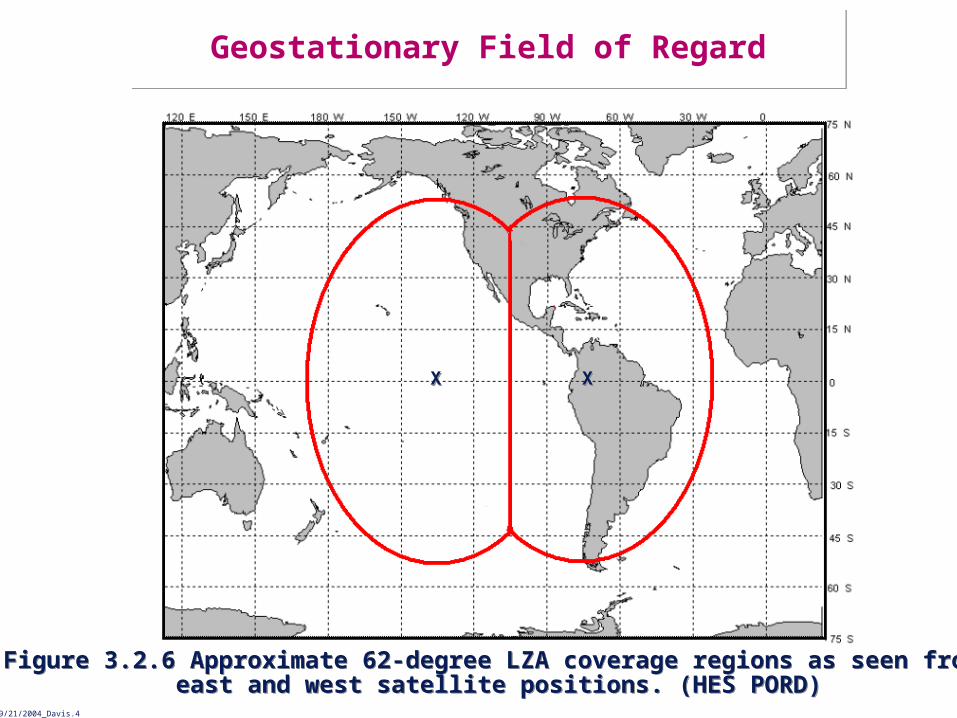
Figure 3.2.6 Approximate 62-degree LZA coverage regions as seen from east and west satellite positions. (HES PORD)
Figure 3.2.6 Approximate 62-degree LZA coverage regions as seen from east and west satellite positions. (HES PORD)
XX XX

NRL09/21/2004_Davis.5
GOES-R and HES ScheduleGOES-R and HES Schedule
• NOAA is planning to build the next generation Geostationary Operational Environmental Satellite (GOES R) to be launched in 2012.
• It will include the Hyperspectral Environment Suite (HES) The HES is any instrument or combination of instruments that meet the following threshold tasks: – two sounding tasks, which include disk sounding (DS) and severe
weather/mesoscale sounding (SW/M), and – a shelf and coastal waters imaging task (CW).– The suite architecture will have a major impact on the ability of HES-CW
to image the coastal waters. E.g. if it is only one instrument then the CW task will be scheduled around the DS task which will occupy most of the imaging time.
• Last June NASA funded three companies (BAE, Ball and ITT) to conduct two-year, multimillion dollar design and risk reduction studies for the HES suite. – They will solidify the requirements by the end of January 2005 and have
a preliminary design by the end of the first year– Industry designs will be competed at the end of the second year (June
2006) and a contractor selected to build the HES suite.

NRL09/21/2004_Davis.6
Requirements, Products and ApplicationsRequirements, Products and Applications
• Requirements are specifications that HES-CW and the GOES-R satellite system must meet in order to produce useful data:– Threshold requirements are the minimal performance required to
produce useful data. E.g. SNR of 300:1 for ocean radiances.– Goal requirements are the desired performance for improved data
coverage and quality. E.g. SNR of 900:1 for ocean radiances.• Products are the data that will be produced by the HES-CW instrument and
delivered to NOAA for processing, archiving and distribution.– Current products are at sensor calibrated radiances and a chlorophyll
product similar to the MODIS standard product. • Applications are the use that will be made of the products by NOAA and the
ocean community– Examples are water quality monitoring and Harmful Algal Bloom (HAB)
assessment and tracking • Coastal Ocean Science is the use of the data to develop new insights and
understanding of the coastal environment and the changes that might be occurring.– Includes NOAA, NASA, Navy and University science– Often leads to new applications
NRL09/21/2004_Davis.7
Key Threshold and Goal RequirementsKey Threshold and Goal Requirements
Nominal Threshold Channel Center
Wavelength (um)
Nominal Threshold Resolution
(um)
Nominal Threshold Signal to
Noise
Nominal GOAL Channel Center
Wavelength (um)
Nominal GOAL
Resolution (um)
Nominal Goal Signal to
Noise
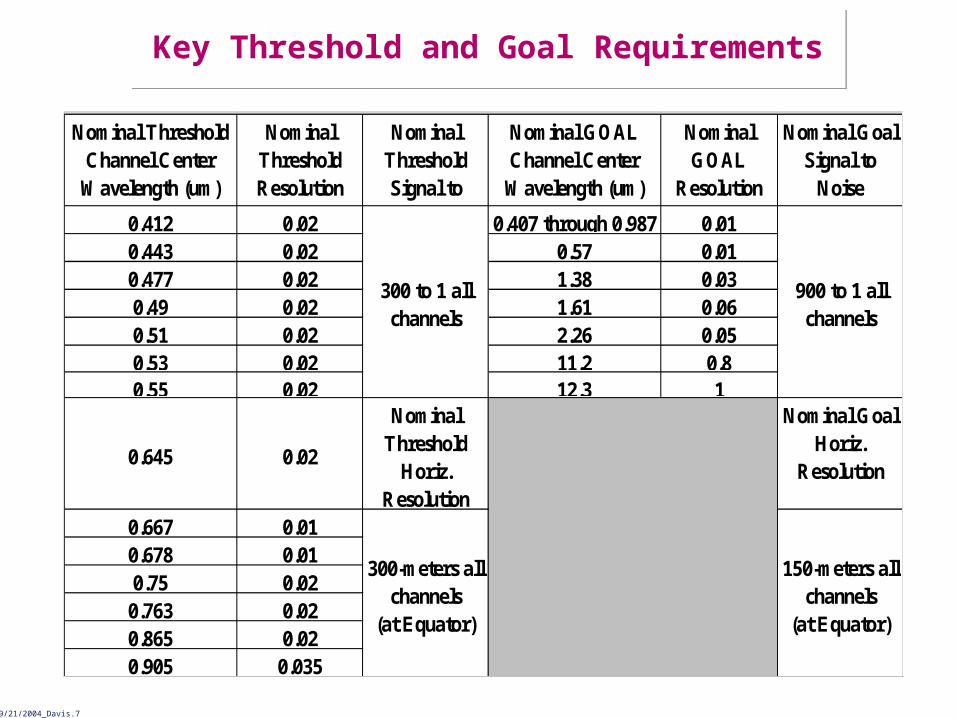
0.412 0.02 0.407 through 0.987 0.010.443 0.02 0.57 0.010.477 0.02 1.38 0.030.49 0.02 1.61 0.060.51 0.02 2.26 0.050.53 0.02 11.2 0.80.55 0.02 12.3 1
0.645 0.02
Nominal Threshold
Horiz. Resolution
Nominal Goal Horiz.
Resolution
0.667 0.010.678 0.010.75 0.02
0.763 0.020.865 0.020.905 0.035
300-meters all channels
(at Equator)
150-meters all channels
(at Equator)
300 to 1 all channels
900 to 1 all channels
NRL09/21/2004_Davis.8
More RequirementsMore Requirements
• Sampling Frequency:– Threshold requirement is to sample the entire U.S. coastal waters once
every three hours– Goal is hourly– Additional sampling for selected regions at higher frequency– Daylight hours only– May be adjusted for cloud cover; use Advanced Baseline Imager (ABI) to
select cloud free areas for imaging• Simultaneity for imaging spectral channels
– Some instrument designs (e.g. filter wheel spectrometer) image channels sequentially
– Current requirement is 15 sec based on the simultaneity requirement for ABI which is based on the speed of high altitude clouds; can this be relaxed to 20 or 30 seconds?
• Many other requirements for stability, jitter, etc.

NRL09/21/2004_Davis.9
HES-CW ProductsHES-CW Products
• The primary products are calibrated at sensor radiances for all channels– Either the threshold 14 channels and possibly the additional
goal channels• The other required ocean product is chlorophyll by something
like the MODIS standard algorithm• Products are geo-located to approximately 1 Ground Sample
Distance (GSD)• Methods for on-orbit calibration and validation of products are
not clearly defined at this time.• Methods for atmospheric correction are not clearly identified at
this time.

NRL09/21/2004_Davis.10
NOAA HES-CW ApplicationsNOAA HES-CW Applications
Water quality monitoring Coastal hazard assessment Navigation safety Human and ecosystem health awareness Natural resource management in coastal and estuarine
areas Climate variability prediction (e.g., carbon cycle) Landscape changes Coral reef detection and health appraisal

NRL09/21/2004_Davis.11
HES-CW Heritage and Instrument Design Options
HES-CW Heritage and Instrument Design Options
• Current Ocean Color Imagers– SeaWiFS and MODIS
- Algorithms and products- Understanding of SNR and other requirements- Instruments are multiple filter and focal plane designs with scanning
mirrors or telescopes• Airborne hyperspectral imagers (Imaging Spectrometers)
– AVIRIS – NASA Facility instrument built by JPL- Old complex design that would not work well in space.- JPL now prefers Offner Spectrometer Design
– NRL PHILLS Offner Spectrometer Hyperspectal Imager• Fourier Transform Spectrometer
- Excellent for High spectral resolution in mid- and long-wave infrared- Not recommended in the visible
• Special Event Imager (SEI) Geostationary Imager– Filter Wheel Spectrometer
NRL09/21/2004_Davis.12
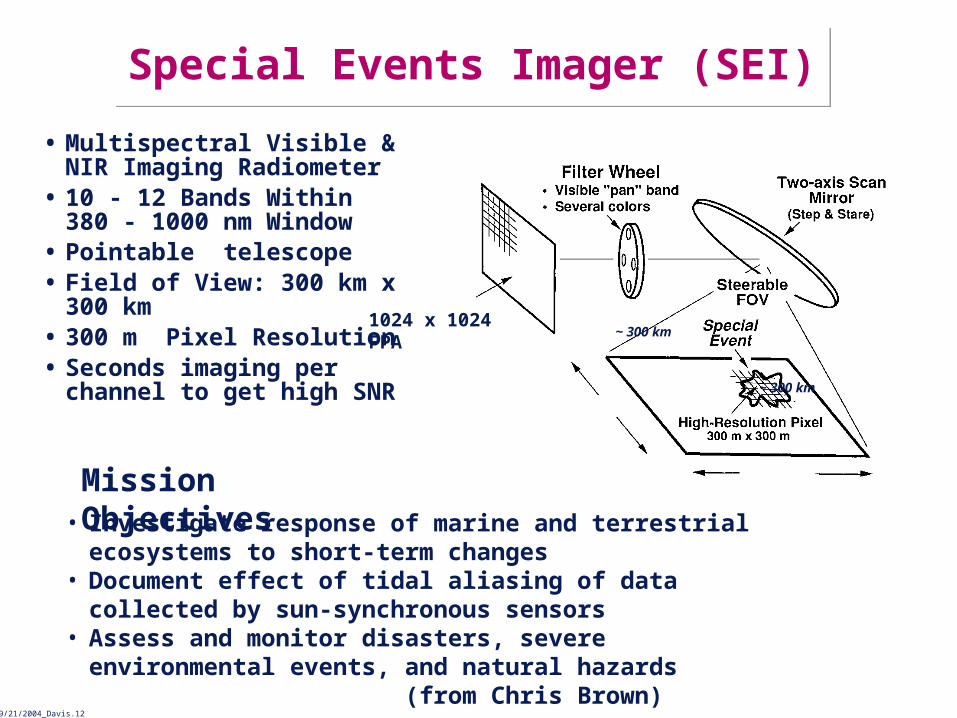
• Multispectral Visible & NIR Imaging Radiometer
• 10 - 12 Bands Within 380 - 1000 nm Window
• Pointable telescope• Field of View: 300 km x 300
km• 300 m Pixel Resolution• Seconds imaging per channel
to get high SNR
Mission Objectives
1024 x 1024 FPA
~ 300 km
~ 300 km
• Investigate response of marine and terrestrial ecosystems to short-term changes
• Document effect of tidal aliasing of data collected by sun-synchronous sensors
• Assess and monitor disasters, severe environmental events, and natural hazards (from Chris Brown)
Special Events Imager (SEI)Special Events Imager (SEI)
NRL09/21/2004_Davis.13
Hyperspectral Imaging ConceptHyperspectral Imaging Concept
Sig
nal
Wavelength
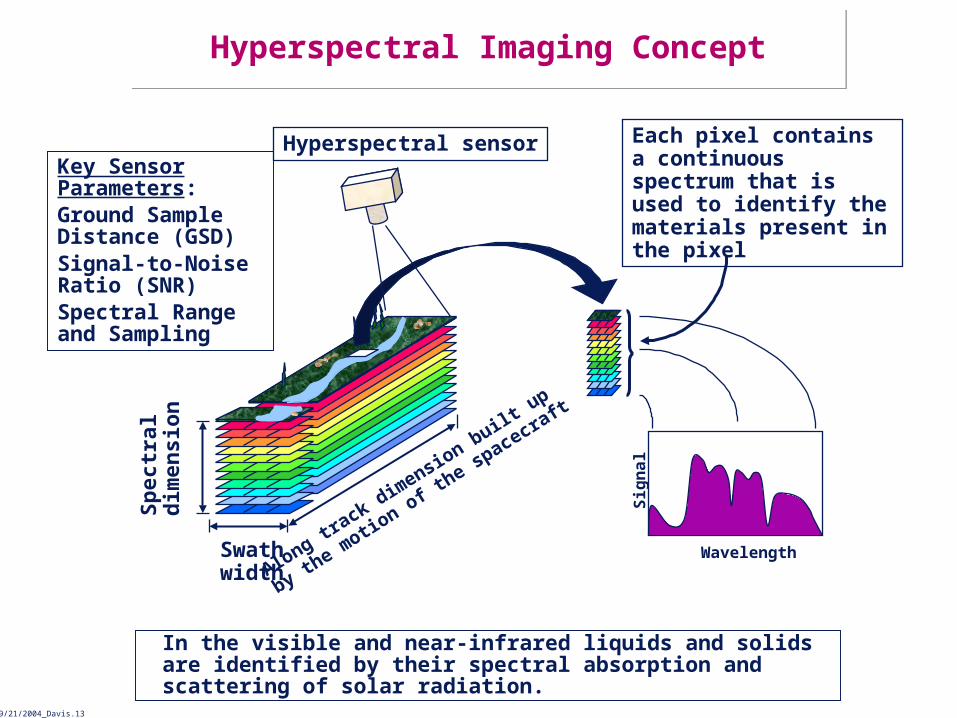
Each pixel contains a continuous spectrum that is used to identify the materials present in the pixel
Swathwidth
Sp
ectr
ald
imen
sion
Hyperspectral sensor
Along track dimensio
n built up
by the m
otion of th
e spacecraft
Key Sensor Parameters:Ground Sample Distance (GSD)Signal-to-Noise Ratio (SNR)Spectral Range and Sampling
In the visible and near-infrared liquids and solids are identified by their spectral absorption and scattering of solar radiation.

NRL09/21/2004_Davis.14
Resolving the Complexity of Coastal OpticsRequires Hyperspectral Remote Sensing?
Resolving the Complexity of Coastal OpticsRequires Hyperspectral Remote Sensing?
Extensive studies using shipboard measurements and airborne hyperspectral imaging have shown that hyperspectral imaging is the only tool available to resolve the complexity of the coastal ocean from space WHEN YOU SEE THE BOTTOM. (Lee and Carder, Appl. Opt., 41(12), 2191 – 2201, 2002.)
NRL09/21/2004_Davis.15
Ocean Portable Hyperspectral Imager for Low-Light Spectroscopy (Ocean PHILLS) Ocean Portable Hyperspectral Imager for Low-Light Spectroscopy (Ocean PHILLS)
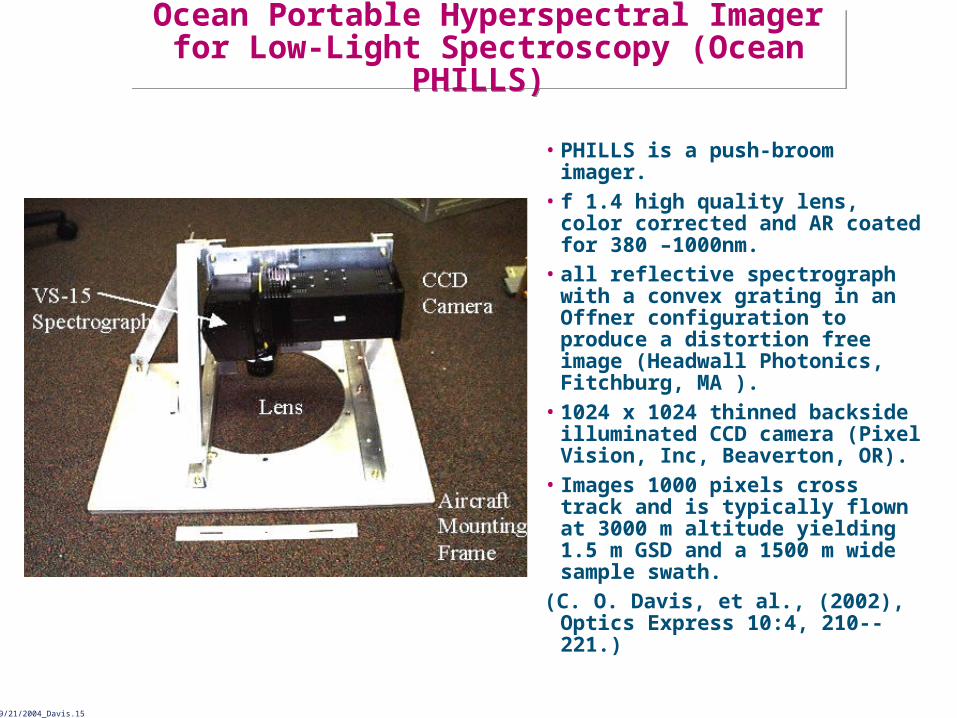
• PHILLS is a push-broom imager.
• f 1.4 high quality lens, color corrected and AR coated for 380 –1000nm.
• all reflective spectrograph with a convex grating in an Offner configuration to produce a distortion free image (Headwall Photonics, Fitchburg, MA ).
• 1024 x 1024 thinned backside illuminated CCD camera (Pixel Vision, Inc, Beaverton, OR).
• Images 1000 pixels cross track and is typically flown at 3000 m altitude yielding 1.5 m GSD and a 1500 m wide sample swath.
(C. O. Davis, et al., (2002), Optics Express 10:4, 210--221.)
NRL09/21/2004_Davis.16
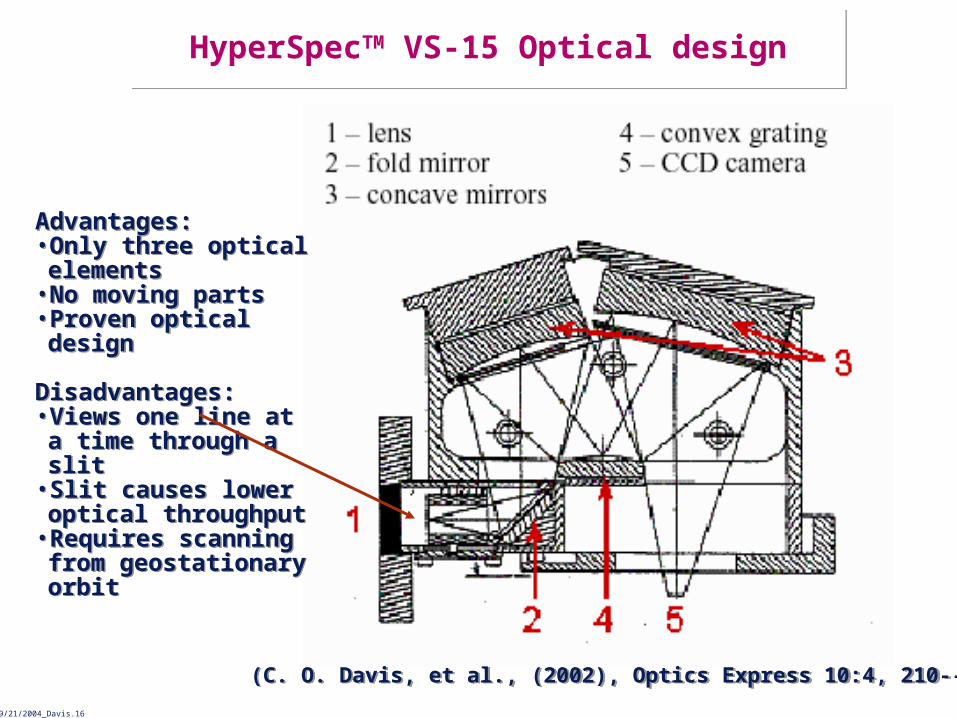
HyperSpecTM VS-15 Optical designHyperSpecTM VS-15 Optical design
(C. O. Davis, et al., (2002), Optics Express 10:4, 210--221.)(C. O. Davis, et al., (2002), Optics Express 10:4, 210--221.)
Advantages:• Only three optical elements
• No moving parts• Proven optical design
Disadvantages:• Views one line at a time through a slit
• Slit causes lower optical throughput
• Requires scanning from geostationary orbit
Advantages:• Only three optical elements
• No moving parts• Proven optical design
Disadvantages:• Views one line at a time through a slit
• Slit causes lower optical throughput
• Requires scanning from geostationary orbit

NRL09/21/2004_Davis.17
PHILLS data for Great Bay Region (010731 Run15seq03)
PHILLS data for Great Bay Region (010731 Run15seq03)
• The image is 1000 pixels wide and 1024 pixels long. The spatial resolution is 1.8 meters.
• The data was processed to Rrs using laboratorycalibration data, and the Tafkaa atmospheric correction.
• “X” marks the location of spectra shown below.
(C. O. Davis, et al., (2002), Optics Express 10:4, 210--221.)
X
0
50
100
150
200
250
300
0.4 0.5 0.6 0.7 0.8 0.9Wavelength (microns)
Ref
lect
ance
X 1
04 PHILLS-1
Ground Truth ASD

NRL09/21/2004_Davis.18
Next StepsNext Steps
• Evaluate the threshold and goal requirements:– Are the threshold requirements adequate? This may be all we get.– Of the goal requirements which is most important? We need to have a
priority list. We will not get all of them.• Instrument designers are looking at the entire HES suite and are concerned
about size, weight, power, jitter, etc.– HES may be single instrument; this would severely limit coastal imaging
frequency and timing.• The industry teams meet with the NOAA/NASA review team quarterly. Issues
may be presented at any time. Industry may ask for relief on requirements, or may ask for priorities for goal requirement, etc.
• Requirements are derived from desired products and applications. We need to review, edit and add to the list of applications and science that can be done with HES-CW.
• We should consider the entire GOES-R system not just HES-CW– ABI can be used for selecting cloud free areas to image– ABI and HES produce excellent atmospheric data. Can that be used to
improve our atmospheric and cloud corrections?• Other Issues?

NRL09/21/2004_Davis.19
BACKUP SLIDESBACKUP SLIDES
NRL09/21/2004_Davis.20
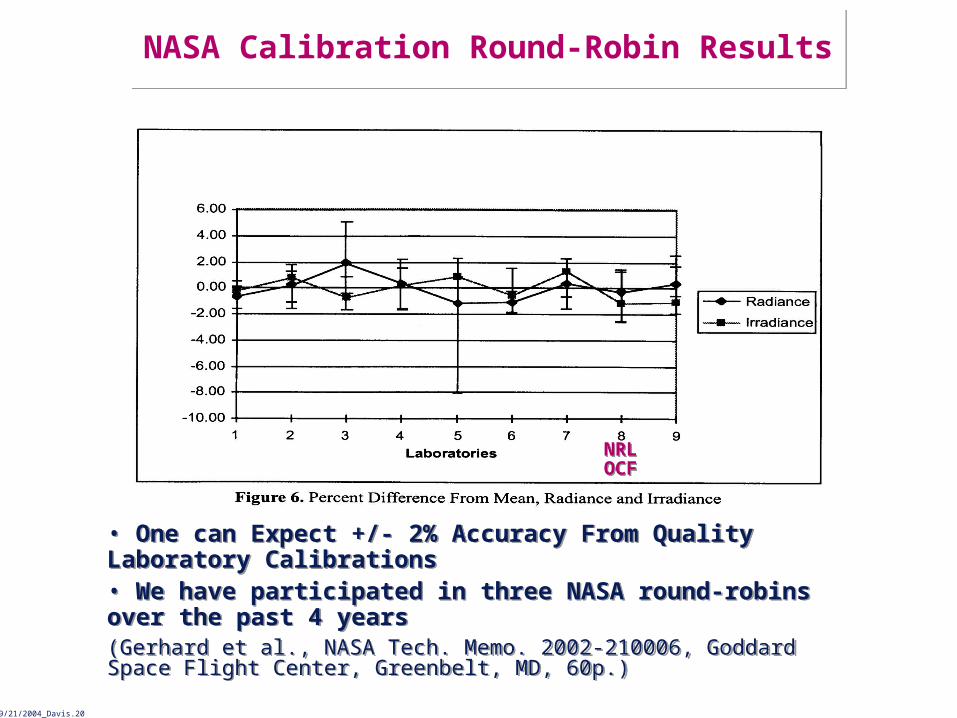
NASA Calibration Round-Robin ResultsNASA Calibration Round-Robin Results
NRLOCFNRLOCF
• One can Expect +/- 2% Accuracy From Quality Laboratory Calibrations• We have participated in three NASA round-robins over the past 4 years(Gerhard et al., NASA Tech. Memo. 2002-210006, Goddard Space Flight Center, Greenbelt, MD, 60p.)
• One can Expect +/- 2% Accuracy From Quality Laboratory Calibrations• We have participated in three NASA round-robins over the past 4 years(Gerhard et al., NASA Tech. Memo. 2002-210006, Goddard Space Flight Center, Greenbelt, MD, 60p.)
NRL09/21/2004_Davis.21
ApplicationsApplications
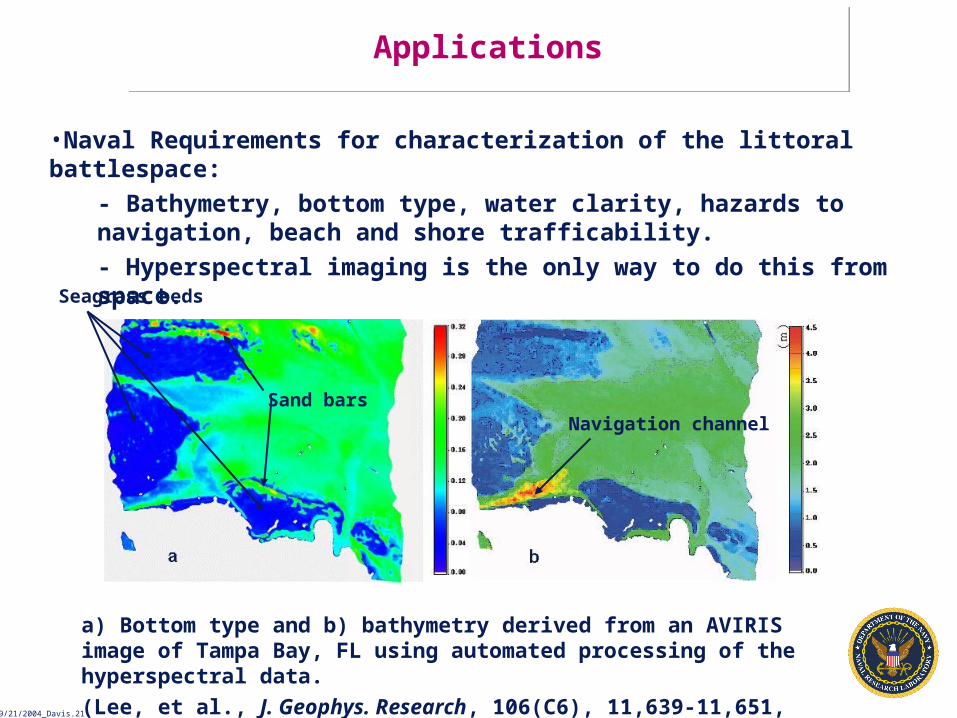
a) Bottom type and b) bathymetry derived from an AVIRIS image of Tampa Bay, FL using automated processing of the hyperspectral data.
(Lee, et al., J. Geophys. Research, 106(C6), 11,639-11,651, 2001.)
Seagrass beds
Sand barsNavigation channel
•Naval Requirements for characterization of the littoral battlespace:
- Bathymetry, bottom type, water clarity, hazards to navigation, beach and shore trafficability.
- Hyperspectral imaging is the only way to do this from space.
NRL09/21/2004_Davis.22
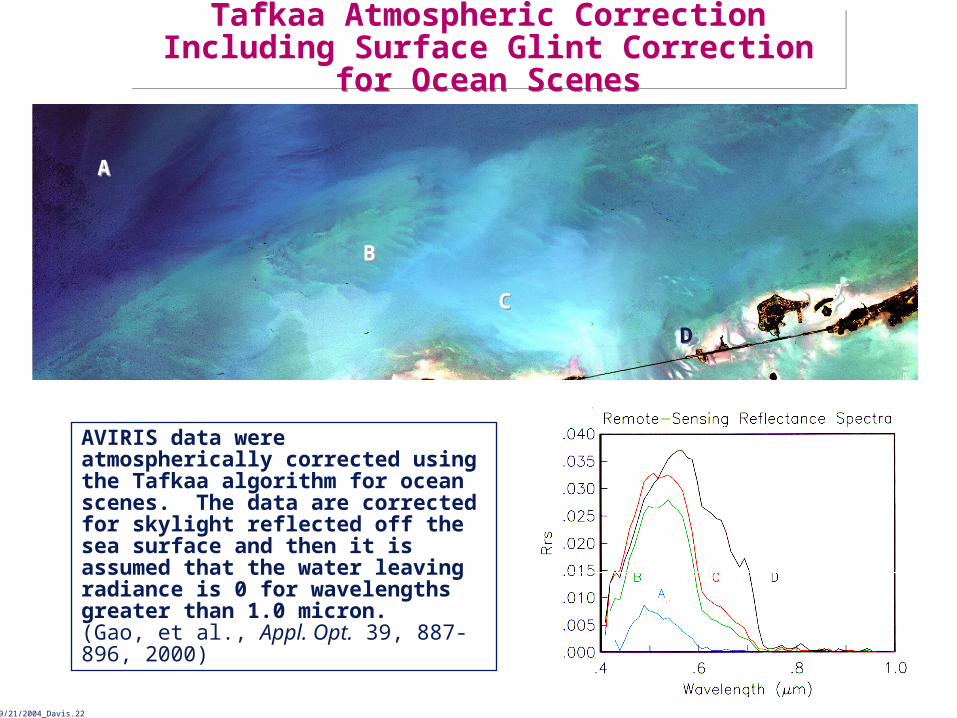
Tafkaa Atmospheric Correction Including Surface Glint Correction for Ocean ScenesTafkaa Atmospheric Correction Including
Surface Glint Correction for Ocean Scenes
AVIRIS data were atmospherically corrected using the Tafkaa algorithm for ocean scenes. The data are corrected for skylight reflected off the sea surface and then it is assumed that the water leaving radiance is 0 for wavelengths greater than 1.0 micron. (Gao, et al., Appl. Opt. 39, 887-896, 2000)
AA
BB
CC
DD
NRL09/21/2004_Davis.23
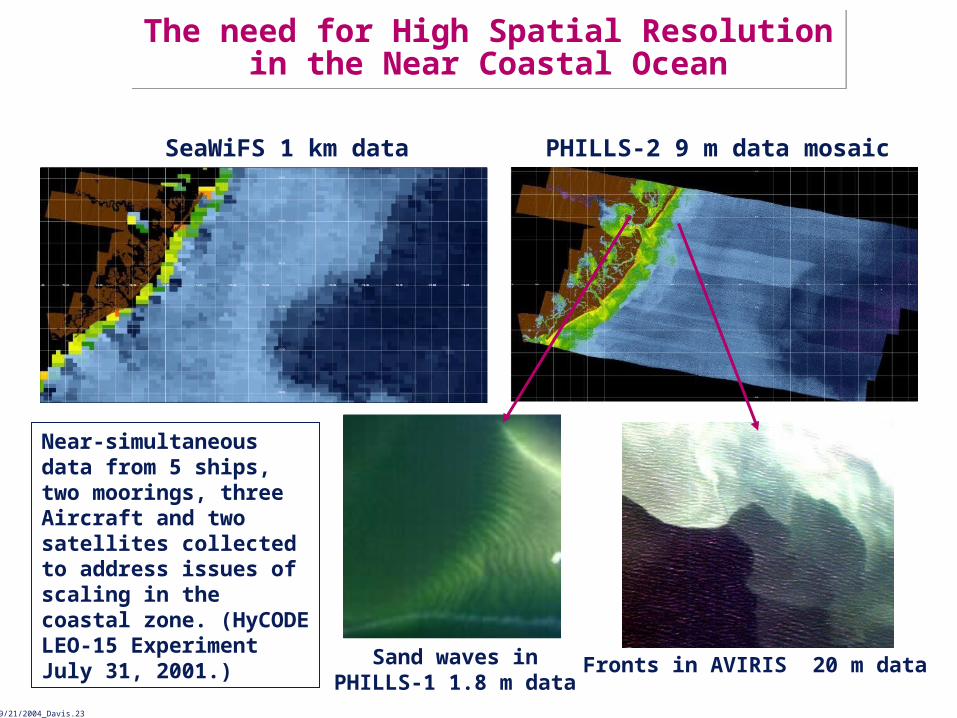
SeaWiFS 1 km data PHILLS-2 9 m data mosaic
Sand waves inPHILLS-1 1.8 m data
Fronts in AVIRIS 20 m data
Near-simultaneous data from 5 ships, two moorings, three Aircraft and two satellites collected to address issues of scaling in the coastal zone. (HyCODE LEO-15 Experiment July 31, 2001.)
The need for High Spatial Resolution in the Near Coastal Ocean
The need for High Spatial Resolution in the Near Coastal Ocean
NRL09/21/2004_Davis.24
On-Board Processing With ORASIS
• Optical Real-time Adaptive Spectral Identification System (ORASIS)
– Parallel, Adaptive Hyperspectral Method for Real-time, Scene Characterization and Data Compression.
- Automatically Determines the Fundamental Spectral Signatures (Endmembers) Contained in an Arbitrary Scene Without Need for Training or a-priori Information
- Spectrally Demixes Every Scene Pixel Into Its Fundamental Constituents Using Optimal Spectral Filters (Filter Vectors)
- Fully Automated With Minimal User Training Required
- High Compression (>10x) With Minimal Spectral Signature Degradation to Ease Data Storage and Downlink Requirements
- Real-time Spectral Classification and Demixing Allows Real-time Tactical Downlink of End Products Directly From the Spacecraft to the Field
• ORASIS has been demonstrated on a breadboard on-board processor for Real-time Data Compression (Requirement >10:1 Compression)
NRL09/21/2004_Davis.25
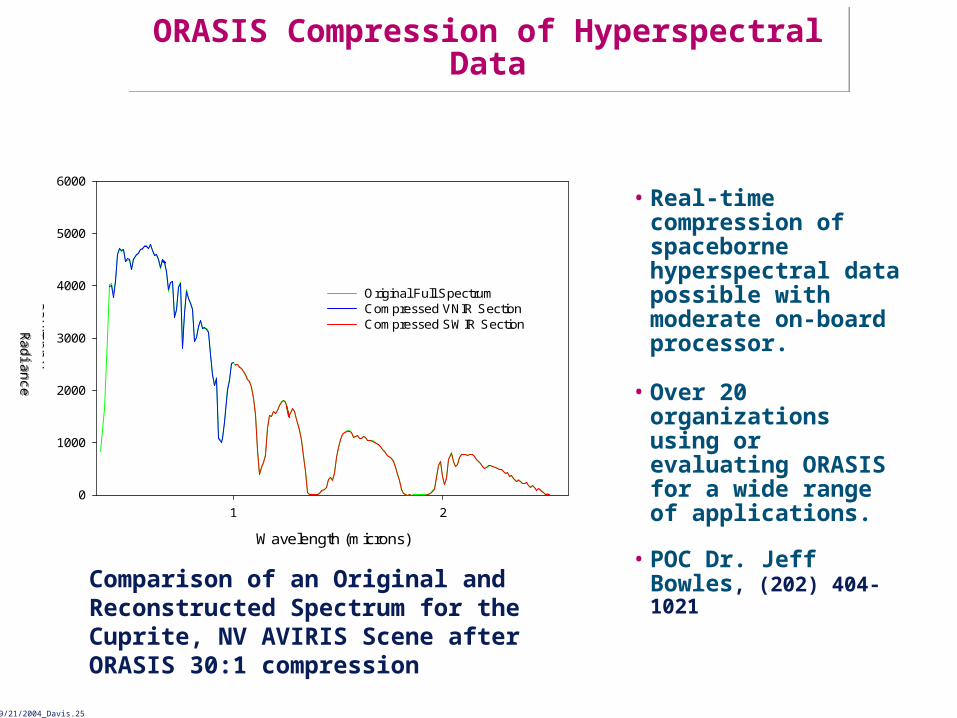
ORASIS Compression of Hyperspectral DataORASIS Compression of Hyperspectral Data
• Real-time compression of spaceborne hyperspectral data possible with moderate on-board processor.
• Over 20 organizations using or evaluating ORASIS for a wide range of applications.
• POC Dr. Jeff Bowles, (202) 404-1021Wavelength (microns)
1 2
Ra
dia
nce
0
1000
2000
3000
4000
5000
6000
Original Full SpectrumCompressed VNIR SectionCompressed SWIR Section
Comparison of an Original and Reconstructed Spectrum for the Cuprite, NV AVIRIS Scene after ORASIS 30:1 compression
Radiance
Radiance

NRL09/21/2004_Davis.26
SUMMARY: NRL Spiral Development of Products from Hyperspectral Imagery
SUMMARY: NRL Spiral Development of Products from Hyperspectral Imagery
0
20
40
60
80
100
120
140
0 1000 2000 3000 4000 5000 6000Counts
Rad
ianc
e (W
m-2
ste
r-1 m
icro
n-1)
450 nm 550 nm 650 nm 850 nm
0
50
100
150
200
250
300
0.4 0.5 0.6 0.7 0.8 0.9Wavelength (microns)
Ref
lect
ance
X 1
04 PHILLS-1
Ground Truth ASD
RequirementsEvaluation
ProductEvaluation
ProductExtraction
DataProcessing
Ground / WaterTruth
FlightCampaigns
SensorCalibration
ProductAlgorithm
Development
SensorDevelopment
0
50
100
150
200
250
300
350
400 500 600 700 800 900 1000
Signal to Noise Ratio10 nm Spectral Bins
Sig
na
l to
No
ise
Wavelength (nm)
f/4
f/2.8
f/2GSD = 100mAlbedo = 5%GMC = 1
PURSUITPatternRecognition/Classification
TAFKAA AtmosphericRemoval Algorithm
ORASISSpectralIdentification

NRL09/21/2004_Davis.27
Bo-Cai Gao MODIS Team ActivitiesBo-Cai Gao MODIS Team Activities
• MODIS has five channels located near 1 m for remote sensing of water vapor. MODIS also has a narrow channel centered at 1.375 m for remote sensing of high clouds.
• Responsible for the MODIS near-IR water vapor algorithm and the cirrus reflectance algorithm using those channels. – 14 reviewed publications on these topics.
Highlight recent results and show the need for cirrus cloud corrections for aerosol and sea surface temperature retrievals.
Highlight recent results and show the need for cirrus cloud corrections for aerosol and sea surface temperature retrievals.

NRL09/21/2004_Davis.28
SSMI Vapor (7/2002)
MODIS Vapor (7/2002)
Vapor (MODIS + SSMI)
(Gao, B.-C., P. K. Chan, and R.-R. Li, A global water vapor data set obtained by merging the SSMI and MODIS data, Geophys. Res. Lett., 31, 2004 (doi:10.1029/2004GL020656).)
(Gao, B.-C., P. K. Chan, and R.-R. Li, A global water vapor data set obtained by merging the SSMI and MODIS data, Geophys. Res. Lett., 31, 2004 (doi:10.1029/2004GL020656).)
Water Vapor Image (MODIS + SSMI)Water Vapor Image (MODIS + SSMI)

NRL09/21/2004_Davis.29
Cirrus Cloud Detection Over Western USCirrus Cloud Detection Over Western US

NRL09/21/2004_Davis.30
Cirrus Mask For Improving Aerosol RetrievalsCirrus Mask For Improving Aerosol Retrievals
NRL09/21/2004_Davis.31
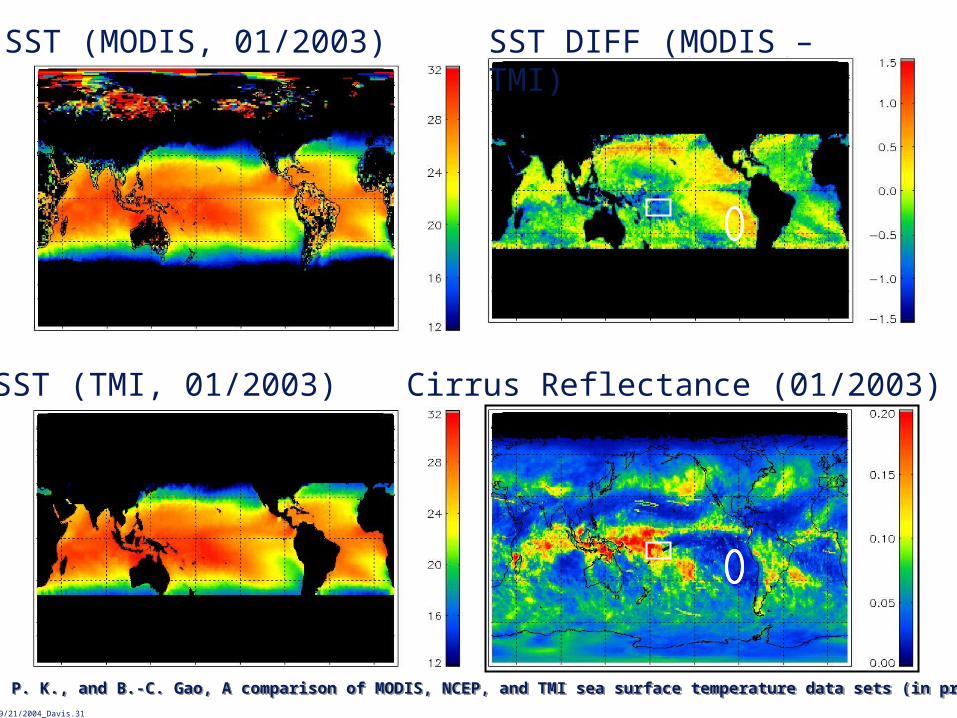
SST (MODIS, 01/2003)
SST (TMI, 01/2003)
SST DIFF (MODIS – TMI)
Cirrus Reflectance (01/2003)
Chan, P. K., and B.-C. Gao, A comparison of MODIS, NCEP, and TMI sea surface temperature data sets (in press). Chan, P. K., and B.-C. Gao, A comparison of MODIS, NCEP, and TMI sea surface temperature data sets (in press).

NRL09/21/2004_Davis.32
• Global water vapor and cirrus reflectance products have been derived from MODIS channels in the near-IR spectral region.
• By combining the MODIS near-IR water vapor over land and the SSMI water vapor over oceans, we have created an excellent water vapor data set for climate studies.
• We believe that many MODIS data products are contaminated by cirrus clouds. Cirrus corrections, just like aerosol corrections, are required in order to improve the quality of most MODIS data products for climate related research.
Bo-Cai Gao MODIS SummaryBo-Cai Gao MODIS Summary

NRL09/21/2004_Davis.33
IMAGERY ANALYSIS FOR HYPERION
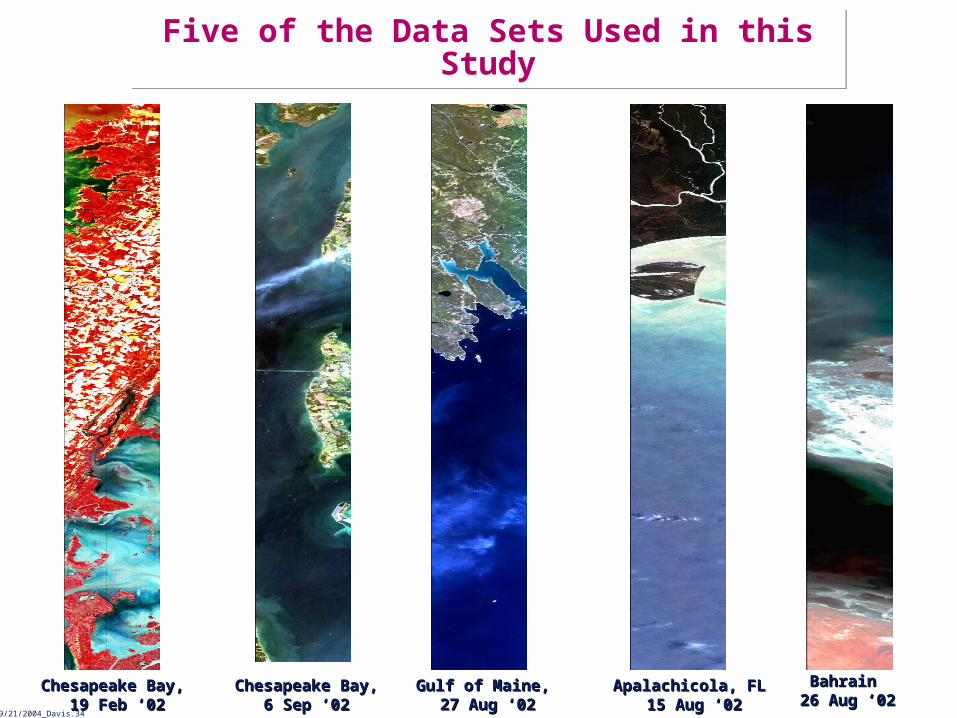
5 DATA SETS - HYPERION DATA:
Chesapeake Bay (19 Feb ’02)
Chesapeake Bay ( 6 Sep ’02)
Gulf of Maine (27 Aug ’02)
Gulf of Mexico (15 Aug ‘02) (Apalachicola Bay, FL)
Bahrain (27 Aug ’02)
Looe Key, FL (26 Oct ‘02)
ANALYSIS INCLUDES:Matching With SeaWIFS Imagery
Comparison With In-situ Data From Cruises And Moorings In The Area
Qualitative Identification Of Possible Features
Application Of Remote Sensing Processing Techniques
Quantitative Extraction Of Features And Bathymetry
Identification Of Hyperion Issues
THE TEAM:
Bo-Cai Gao, Marcos Montes, Curt Davis, and Bob Arnone and Ping Lee (NRLSSC)
Imagery Analysis For Hyperion Imagery Analysis For Hyperion
NRL09/21/2004_Davis.34
Chesapeake Bay,Chesapeake Bay, 19 Feb ‘0219 Feb ‘02
Gulf of Maine, Gulf of Maine, 27 Aug ‘0227 Aug ‘02
Apalachicola, FLApalachicola, FL 15 Aug ‘0215 Aug ‘02
Chesapeake Bay,Chesapeake Bay,6 Sep ‘026 Sep ‘02
Bahrain Bahrain 26 Aug ‘0226 Aug ‘02
Five of the Data Sets Used in this StudyFive of the Data Sets Used in this Study
NRL09/21/2004_Davis.35
1
23
4
5
6
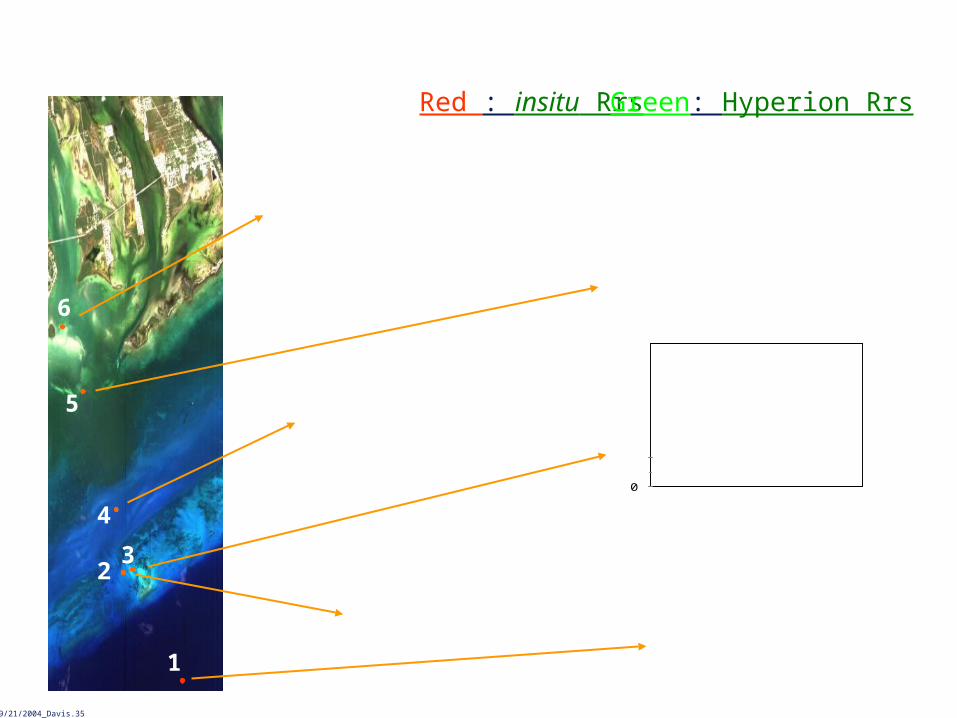
Red : insitu Rrs Green: Hyperion Rrs
0
0.01
0.02
0.03
0.04
0.05
400 500 600 700 800
3
0
0.01
0.02
0.03
0.04
400 500 600 700 800
2
0
0.002
0.004
0.006
0.008
0.01
400 500 600 700 800
1
0
0.01
0.02
0.03
400 500 600 700 800
4
0
0.005
0.01
0.015
0.02
0.025
400 500 600 700 800
5
0
0.01
0.02
0.03
0.04
400 500 600 700 800
6
(Looe Key Hyperion data)
Rrs comparison (after Tafkaa)Rrs comparison (after Tafkaa)
NRL09/21/2004_Davis.36
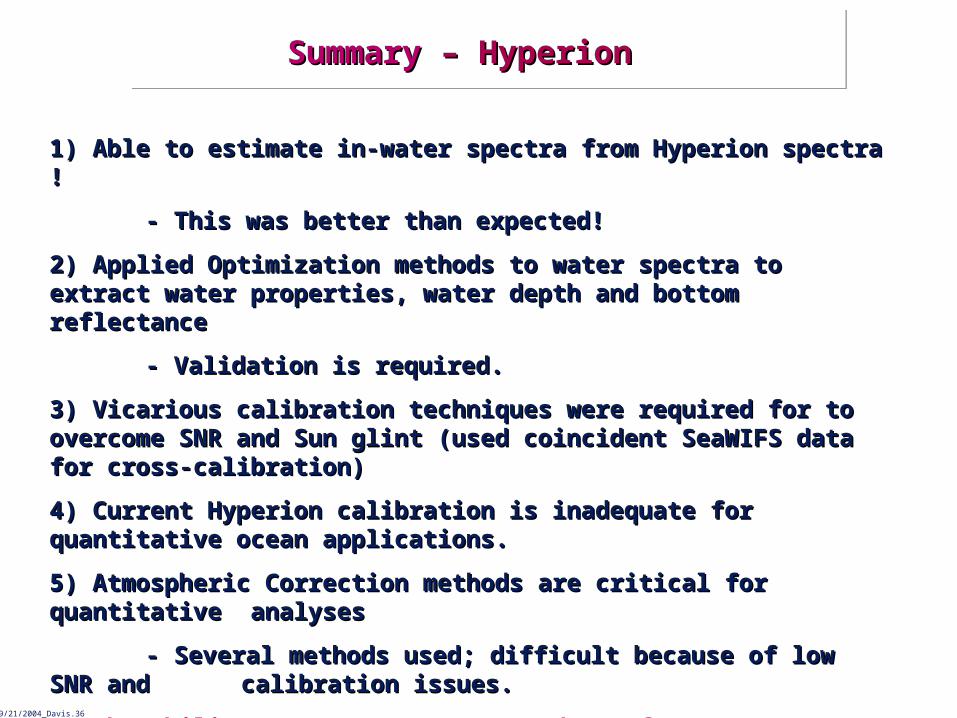
1) Able to estimate in-water spectra from Hyperion spectra ! 1) Able to estimate in-water spectra from Hyperion spectra !
- This was better than expected! - This was better than expected!
2) Applied Optimization methods to water spectra to extract water 2) Applied Optimization methods to water spectra to extract water properties, water depth and bottom reflectance properties, water depth and bottom reflectance
- Validation is required. - Validation is required.
3) Vicarious calibration techniques were required for to overcome SNR 3) Vicarious calibration techniques were required for to overcome SNR and Sun glint (used coincident SeaWIFS data for cross-calibration) and Sun glint (used coincident SeaWIFS data for cross-calibration)
4) Current Hyperion calibration is inadequate for quantitative ocean 4) Current Hyperion calibration is inadequate for quantitative ocean applications. applications.
5) Atmospheric Correction methods are critical for quantitative analyses 5) Atmospheric Correction methods are critical for quantitative analyses
- Several methods used; difficult because of low SNR and - Several methods used; difficult because of low SNR and calibration issues.calibration issues.
6) The ability to extract ocean products from HYPERION data exceeded 6) The ability to extract ocean products from HYPERION data exceeded expectations indicating the value of having hyperspectral data for the expectations indicating the value of having hyperspectral data for the coastal ocean.coastal ocean.
SummarySummary – Hyperion – Hyperion SummarySummary – Hyperion – Hyperion

NRL09/21/2004_Davis.37
New GOES-R Satellite in 2012New GOES-R Satellite in 2012
NASA & NOAA are developing GOES-R to be launched in 2012. – Will have a Hyperspectral Environmental Suite (HES)
HES LW is a 3.5 – 12 micron hyperspectral atmospheric sounder and imager
– Will provide SST +/- 0.2 deg. C at 4 km GSD
HES-CW is designed specifically for Coastal Waters.
– Multispectral or hyperspectral imager covering the 400 – 1000 nm spectral range with SeaWiFS like high SNR (>300:1 for ocean radiances, goal 900:1)-- 300 m Ground Sample Distance (GSD at nadir) with a goal of 150 m.
-- Reimage all U. S. coastal waters once every 3 hours with selected regions hourly, with a goal of the entire coast once every hour.
• Two year HES design studies underway at three contractors.
– Curt Davis and Mike Corson supporting NASA for these studies.
NRL09/21/2004_Davis.38
GOES-R HES-CW Science Goals and Planned Products
GOES-R HES-CW Science Goals and Planned Products
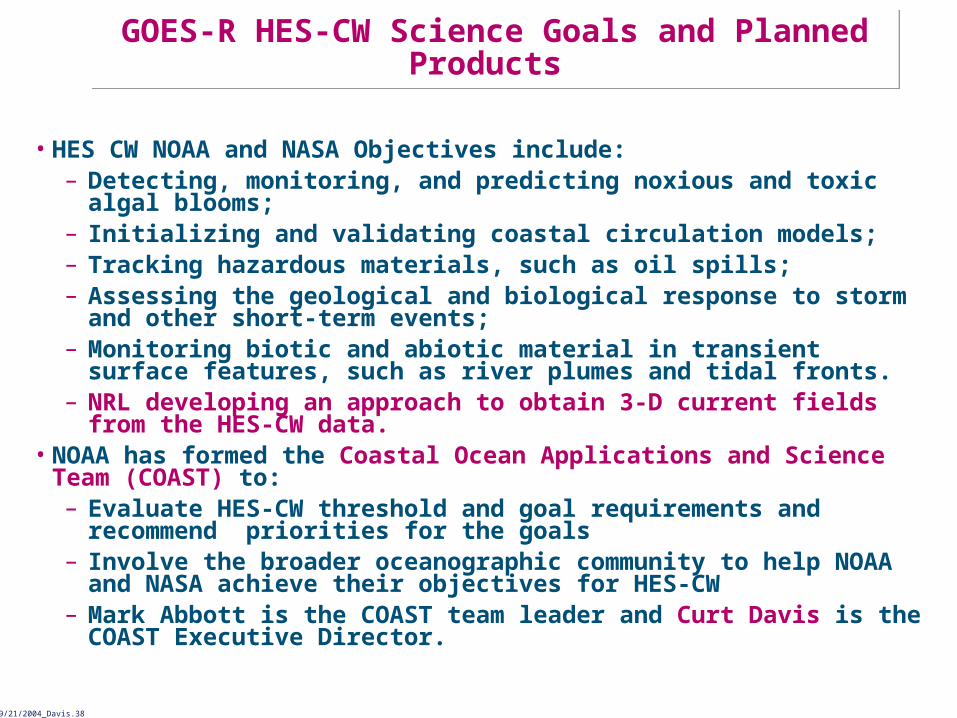
• HES CW NOAA and NASA Objectives include:– Detecting, monitoring, and predicting noxious and toxic algal blooms;– Initializing and validating coastal circulation models;– Tracking hazardous materials, such as oil spills;– Assessing the geological and biological response to storm and other
short-term events; – Monitoring biotic and abiotic material in transient surface features, such
as river plumes and tidal fronts.– NRL developing an approach to obtain 3-D current fields from the HES-
CW data. • NOAA has formed the Coastal Ocean Applications and Science Team
(COAST) to:– Evaluate HES-CW threshold and goal requirements and recommend
priorities for the goals – Involve the broader oceanographic community to help NOAA and NASA
achieve their objectives for HES-CW– Mark Abbott is the COAST team leader and Curt Davis is the COAST
Executive Director.