nrri the national regulatory research institute myths regarding low-income consumers: implications...
TRANSCRIPT

NRRI
The NationalRegulatoryResearch Institute
Myths Regarding Low-Income Consumers: Implications for Consumer Education

NRRI
Myths Regarding Low-Income Consumers: Implications for Consumer Education
2005 Joint Low Income Energy Conferences
Phoenix, ArizonaJune 14, 2005
Presented by:Francine Sevel, Ph.D. NRRI Senior Consumer Affairs Program Manager

NRRI
Overview of Myths
1. Low-income consumers can afford high energy bills
2. Problem of energy affordability is not serious
3. Low-income consumers do not practice energy conservation

NRRI
Myth 1: Can afford high energy bills
Low-income households spend a greater % of household income on energy
Choose between energy services and food, rent, other bills

NRRI
Myth 1: Can afford high energy bills
2003 official poverty rate:12.5 percent, vs. 12.1% in 2002.
2003, 35.9 million people in poverty, vs. 1.3 million in 2002.
NRRI
Myth 1: Can afford high energy bills
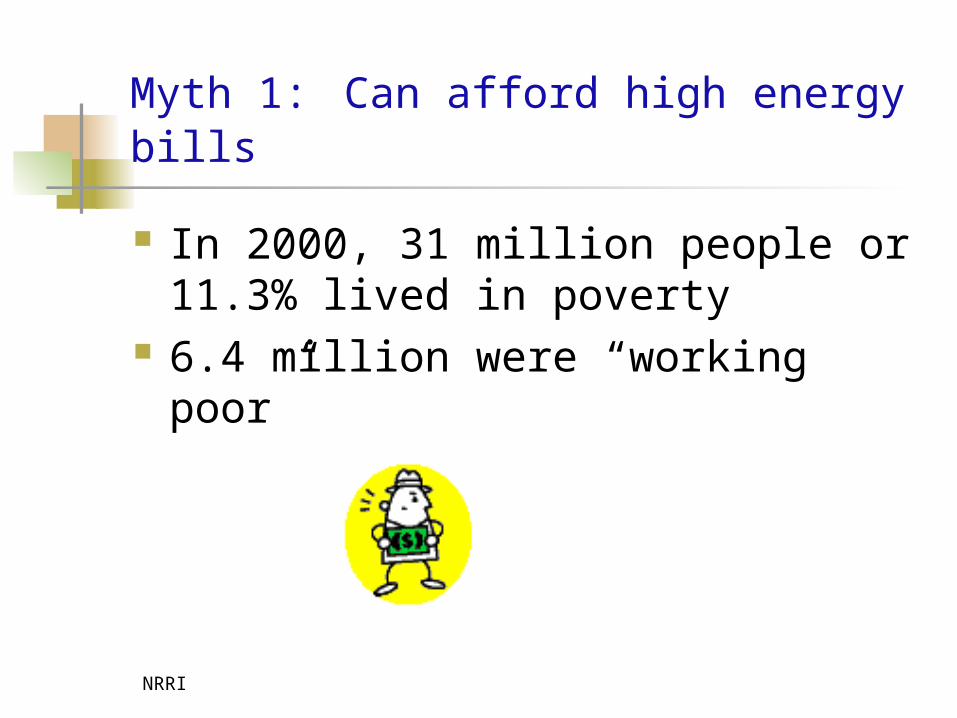
In 2000, 31 million people or 11.3% lived in poverty
6.4 million were “working poor”

NRRI
Myth 1: Can afford high energy bills
$15.37 national housing wage $14.00 is the median hourly wage
in US >$10.00 earned by ¼ of
population
NRRI
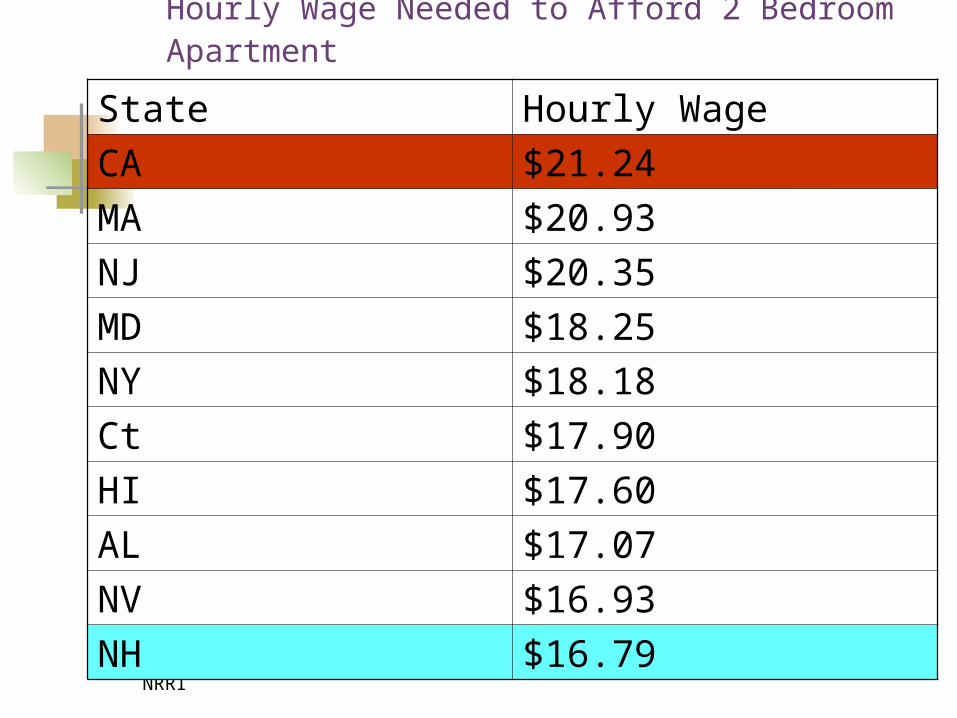
Hourly Wage Needed to Afford 2 Bedroom Apartment
State Hourly Wage
CA $21.24
MA $20.93
NJ $20.35
MD $18.25
NY $18.18
Ct $17.90
HI $17.60
AL $17.07
NV $16.93
NH $16.79

NRRI
Myth 2: Problem Not SeriousImpact on health Percentage
W/out food 22%
W/out medicine or dental care
38%
Took less meds. Didn’t fill prescription
30%
Sick due to cold home 21%
Related illness resulting in dr. hospital visit
5%
Sickness due to hot home 7%

NRRI
Myth 2: Problem Not Serious
Impact on shelter Percentage
Missed rent/mortgage payment
28%
Moved in w/ family/friends
9%
Homeless 4%
Heat disconnected 17%
Used stove for heat 30%

NRRI
Myth 2: Problem Not Serious
Impact on shelter cont’d
Percentage
Unable to pay entire energy bill
51%
Electricity disconnect
8%
Heating system broke-unable to pay for repair
10%
Unable use AC—due to inability to pay to fix
12%

NRRI
Myth 2: Problem Not Serious
PA 2004 disconnect data15,000 households /out heating4,496 w/out elec1,509 w/out natural gasAdditional 14,595 disconnected
residences are vacant
Vs. 5,8000 in 2000
NRRI
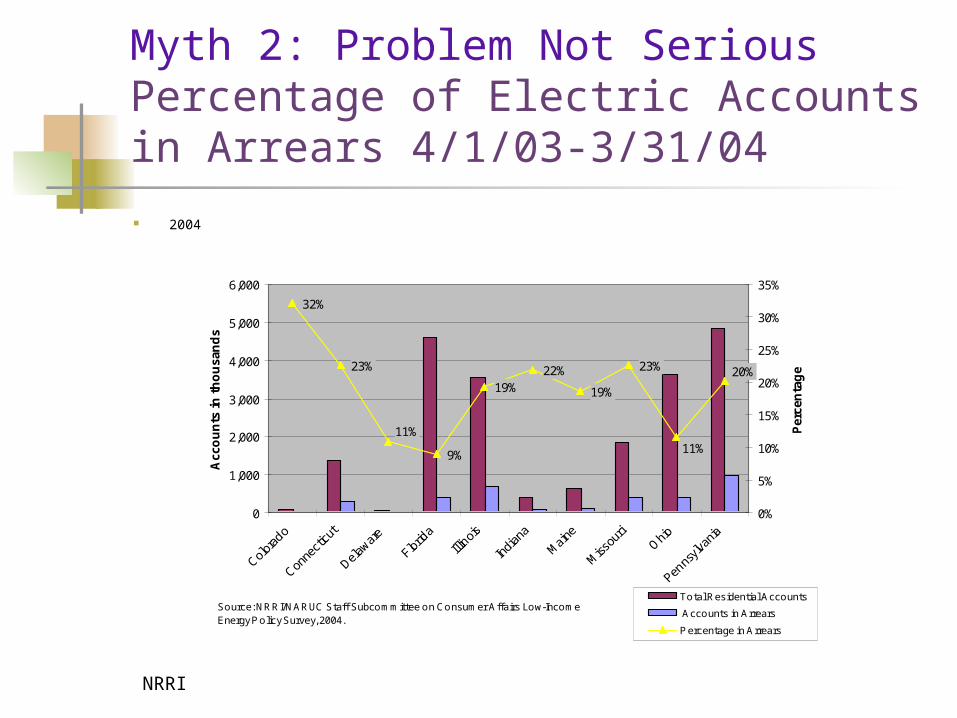
Myth 2: Problem Not Serious Percentage of Electric Accounts in Arrears 4/1/03-3/31/04
2004
32%
23%
9%
19%22%
19%
23%
11%11%
20%
0
1,000
2,000
3,000
4,000
5,000
6,000
Acc
ou
nts
in t
ho
usa
nd
s
0%
5%
10%
15%
20%
25%
30%
35%
Source: NRRI/NARUC Staff Subcommittee on Consumer Affairs Low-Income Energy P olicy Survey, 2004.
Per
cen
tag
e
Total Residential Accounts
Accounts in Arrears
P ercentage in Arrears

NRRI
Myth 2: Problem Not Serious Percentage of Gas Accounts in Arrears 4/1/03 - 3/31/04 2004
Source: NRRI/NARUC Staff Subcommittee on Consumer Affairs Low-IncomeEnergy P olicy Survey, 2004.
33%
21%19%
14%
17% 17% 18%
13%
10%
22%
13%
0
500
1,000
1,500
2,000
2,500
3,000
3,500
Acc
ou
nts
in t
ho
usa
nd
s
0%
5%
10%
15%
20%
25%
30%
35%
Per
cen
tag
e
Number of Residential Accounts
Number Accounts in Arrears
P ercentage of Accounts in Arrears

NRRI
Myth 2: Problem Not Serious Percentage of Gas Account Disconnections 4/1/03 - 3/31/04 2004
Source: NRRI/NARUC Staff Subcommittee on Consumer Affairs Low-Income Energy P olicy Survey, 2004.
4%
3%
4%
9%
5%
7%
10%
3%
5%5%
4%
0
500
1,000
1,500
2,000
2,500
3,000
3,500
Acc
ou
nts
in t
ho
usa
nd
s
0%
2%
4%
6%
8%
10%
12%
Per
cen
tag
e
Number of Residential Accounts Number of Disconnections P ercentage of Disconnections

NRRI
Myth 3: Energy Conservation Not PracticedEnergy Savings Actions by LIHEAP Recipients
Percentage
Plastic on windows 44%Lowered heat at bedtime 76%Used fans/opened windows 78%Kept shades closed during day in summer
83%
Washed clothes in cold water 65%Used compact fluorescent light bulbs
44%
NRRI
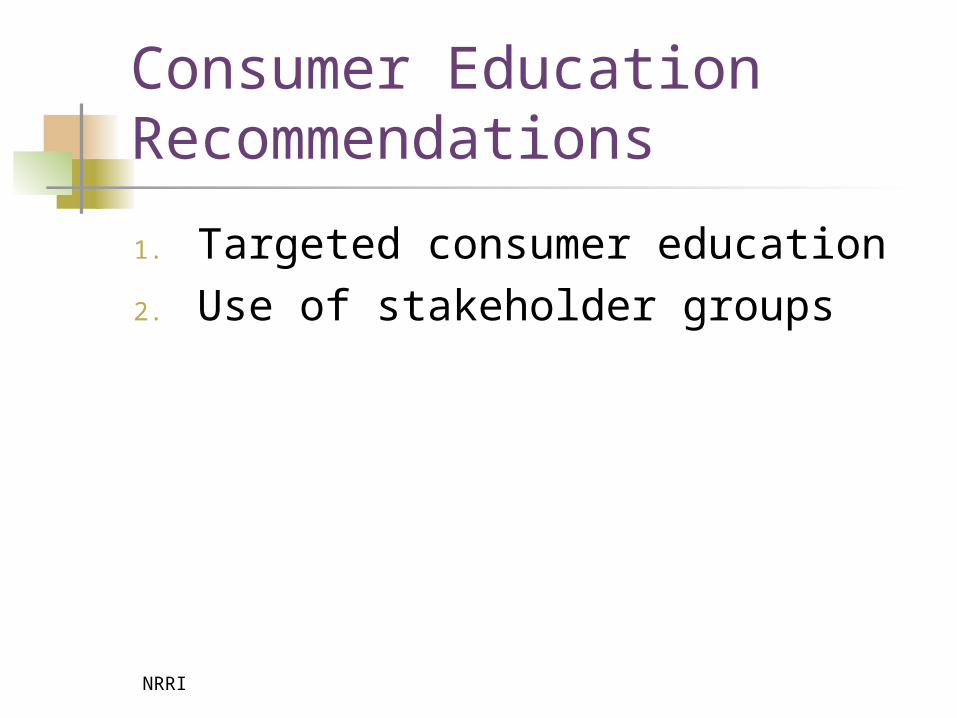
Consumer Education Recommendations
1. Targeted consumer education2. Use of stakeholder groups

NRRI
Targeted consumer education
0.0% 10.0% 20.0% 30.0% 40.0% 50.0%
Source: NRRI/BIGresearch, FEB-03, n=18,793
Community advocacy organizations
My church or synagogue
Social service agencies
State government
The billing utility
Neighborhood group
Friend or relative
Other
Finding Help Paying Utility Bill:Less than $15,000 vs. $15,000 and more
$15,000 or more Less than $15,000

NRRI
Targeted consumer education
0.0% 10.0% 20.0% 30.0% 40.0% 50.0%
Source: NRRI/BIGresearch, FEB-03, n=18,793
Community advocacy organizations
My church or synagogue
Social service agencies
State government
The billing utility
Neighborhood group
Friend or relative
Other
Finding Help Paying Utility Bill:55 and above vs. less than 55
Less than 55 55 and above

NRRI
Consumer Affairs
FederalCommissions
Consumer Protection Stakeholders
Utilities
BillingHouses
BillingParties
StatePolicymakers State
AgenciesAG
Federal Policymakers
StakeholderOrganizations
& CBOs
Consumer Protection
Organizations
Use of stakeholder groups

NRRI
Stakeholder groups

NRRI
0.0% 10.0% 20.0% 30.0% 40.0% 50.0% 60.0%
Source: NRRI/BIGresearch, FEB-03, n=18,793
Community advocacy organizations
My church or synagogue
Social service agencies
State government
The billing utility
Neighborhood group
Friend or relative
Other
Finding Help Paying Utility Bill:Hispanic vs. All Others
All Others Hispanic