ns 2015 10-k
TRANSCRIPT

Table of Contents
UNITED STATES SECURITIES AND EXCHANGE COMMISSIONWashington, D.C. 20549
FORM 10-K[X] ANNUAL REPORT PURSUANT TO SECTION 13 OR 15(d) OF THE
SECURITIES EXCHANGE ACT OF 1934For the fiscal year ended December 31, 2015
OR[ ] TRANSITION REPORT PURSUANT TO SECTION 13 OR 15(d) OF
THE SECURITIES EXCHANGE ACT OF 1934
For the transition period from to Commission File Number 1-16417
NUSTAR ENERGY L.P.(Exact name of registrant as specified in its charter)
Delaware 74-2956831(State or other jurisdiction ofincorporation or organization)
(I.R.S. EmployerIdentification No.)
19003 IH-10 West 78257San Antonio, Texas (Zip Code)
(Address of principal executive offices)
Registrant’s telephone number, including area code (210) 918-2000
Securities registered pursuant to Section 12(b) of the Act: Common units representing partnership interests listed on the New York Stock Exchange.
Securities registered pursuant to 12(g) of the Act: None.
Indicate by check mark if the registrant is a well-known seasoned issuer, as defined in Rule 405 of the Securities Act. Yes [X] No [ ]
Indicate by check mark if the registrant is not required to file reports pursuant to Section 13 or Section 15(d) of the Act.Yes [ ] No [X]
Indicate by check mark whether the registrant (1) has filed all reports required to be filed by Section 13 or 15(d) of the Securities Exchange Act of 1934 during the preceding 12 months (or for such shorter period that the registrant was required to file such reports), and (2) has been subject to such filing requirements for the past 90 days. Yes [X] No [ ]
Indicate by check mark whether the registrant has submitted electronically and posted on its corporate Web site, if any, every Interactive Data File required to be submitted and posted pursuant to Rule 405 of Regulation S-T (§232.405 of this chapter) during the preceding 12 months (or for such shorter period that the registrant was required to submit and post such files). Yes [X] No [ ]
Indicate by check mark if disclosure of delinquent filers pursuant to Item 405 of Regulation S-K (§229.405 of this chapter) is not contained herein, and will not be contained, to the best of registrant’s knowledge, in definitive proxy or information statements incorporated by reference in Part III of this Form 10-K or any amendment to this Form 10-K. [ ]
Indicate by check mark whether the registrant is a large accelerated filer, an accelerated filer, a non-accelerated filer, or a smaller reporting company. See the definitions of “large accelerated filer,” “accelerated filer” and “smaller reporting company” in Rule12b-2 of the Exchange Act:
Large accelerated filer [X] Accelerated filer [ ]
Non-accelerated filer [ ] (Do not check if a smaller reporting company) Smaller reporting company [ ]
Indicate by check mark whether the registrant is a shell company (as defined in Rule 12b-2 of the Exchange Act). Yes [ ] No [X]
The aggregate market value of the common units held by non-affiliates was approximately $3,838 million based on the last sales price quoted as of June 30, 2015, the last business day of the registrant’s most recently completed second quarter.
The number of common units outstanding as of January 31, 2016 was 77,886,078.

Table of Contents
2
NUSTAR ENERGY L.P.FORM 10-K
TABLE OF CONTENTS
PART IItems 1., 1A. & 2. Business, Risk Factors and Properties
OverviewRecent DevelopmentsOrganizational StructureSegmentsEmployeesRate RegulationEnvironmental and Safety RegulationRisk FactorsProperties
Item 1B. Unresolved Staff Comments
Item 3. Legal Proceedings
Item 4. Mine Safety Disclosures
PART IIItem 5. Market for Registrant’s Common Units, Related Unitholder Matters and Issuer Purchases of
Common Units
Item 6. Selected Financial Data
Item 7. Management’s Discussion and Analysis of Financial Condition and Results of Operations
Item 7A. Quantitative and Qualitative Disclosures about Market Risk
Item 8. Financial Statements and Supplementary Data
Item 9. Changes in and Disagreements with Accountants on Accounting and Financial Disclosure
Item 9A. Controls and Procedures
Item 9B. Other Information
PART IIIItem 10. Directors, Executive Officers and Corporate Governance
Item 11. Executive Compensation
Item 12. Security Ownership of Certain Beneficial Owners and Management and Related Unitholder Matters
Item 13. Certain Relationships and Related Transactions and Director Independence
Item 14. Principal Accounting Fees and Services
PART IVItem 15. Exhibits and Financial Statement Schedules
Signatures
33445
1313141730
30
30
31
32
33
34
53
56
106
106
106
107
111
143
146
149
150
159

Table of Contents
3
PART I
Unless otherwise indicated, the terms “NuStar Energy L.P.,” “the Partnership,” “we,” “our” and “us” are used in this report to refer to NuStar Energy L.P., to one or more of our consolidated subsidiaries or to all of them taken as a whole. In this Form 10-K, we make certain forward-looking statements, including statements regarding our plans, strategies, objectives, expectations, intentions and resources. These forward-looking statements can generally be identified by the words “anticipates,” “believes,” “expects,” “plans,” “intends,” “estimates,” “forecasts,” “budgets,” “projects,” “will,” “could,” “should,” “may” and similar expressions. We do not undertake to update, revise or correct any of the forward-looking information. You are cautioned that such forward-looking statements should be read in conjunction with our disclosures beginning on page 34 of this report under the heading: “CAUTIONARY STATEMENT REGARDING FORWARD-LOOKING INFORMATION.”
ITEM 1., 1A. and 2. BUSINESS, RISK FACTORS AND PROPERTIES
OVERVIEW
NuStar Energy L.P. (NuStar Energy), a Delaware limited partnership, was formed in 1999 and completed its initial public offering of common units on April 16, 2001. Our common units are traded on the New York Stock Exchange (NYSE) under the symbol “NS.” Our principal executive offices are located at 19003 IH-10 West, San Antonio, Texas 78257 and our telephone number is (210) 918-2000.
We are engaged in the transportation of petroleum products and anhydrous ammonia, the terminalling and storage of petroleum products and the marketing of petroleum products. The term “throughput” as used in this document generally refers to barrels of crude oil or refined product or tons of ammonia, as applicable, that pass through our pipelines, terminals or storage tanks.
We divide our operations into the following three reportable business segments: pipeline, storage and fuels marketing. As of December 31, 2015, our assets included:
• 5,500 miles of refined product pipelines with 21 associated terminals providing storage capacity of 5.0 million barrels and two tank farms providing storage capacity of 1.4 million barrels;
• 2,000 miles of anhydrous ammonia pipelines;• 1,200 miles of crude oil pipelines, with 8 associated terminals, providing 4.0 million barrels of associated storage
capacity; and• 50 terminal and storage facilities providing 82.9 million barrels of storage capacity.
We conduct our operations through our wholly owned subsidiaries, primarily NuStar Logistics, L.P. (NuStar Logistics) and NuStar Pipeline Operating Partnership L.P. (NuPOP). Our revenues include:
• tariffs for transporting crude oil, refined products and anhydrous ammonia through our pipelines;• fees for the use of our terminal and storage facilities and related ancillary services; and• sales of crude oil and refined petroleum products.
We strive to increase unitholder value by:• enhancing our existing assets through strategic internal growth projects that expand our business with current and
new customers;• pursuing strategic expansion projects by constructing new assets;• improving our operations, including safety and environmental stewardship, cost control and asset reliability; and• identifying acquisition targets that meet our financial and strategic criteria.
Our internet website address is http://www.nustarenergy.com. Information contained on our website is not part of this report. Our annual reports on Form 10-K, quarterly reports on Form 10-Q and current reports on Form 8-K filed with (or furnished to) the Securities and Exchange Commission (SEC) are available on our website, free of charge, as soon as reasonably practicable after we file or furnish such material (select the “Investors” link, then the “SEC Filings” link). We also post our corporate governance guidelines, code of business conduct and ethics, code of ethics for senior financial officers and the charters of our board’s committees on our website free of charge (select the “Investors” link, then the “Corporate Governance” link).
Our governance documents are available in print to any unitholder that makes a written request to Corporate Secretary, NuStar Energy L.P., 19003 IH-10 West, San Antonio, Texas 78257 or [email protected].

Table of Contents
4
RECENT DEVELOPMENTS
On January 2, 2015, we acquired full ownership of a refined products terminal in Linden, NJ, for $142.5 million. Prior to the acquisition, the terminal operated as a joint venture between ourselves and Linden Holding Corp., with each party owning 50%.
ORGANIZATIONAL STRUCTURE
Our operations are managed by NuStar GP, LLC, the general partner of our general partner. NuStar GP, LLC, a Delaware limited liability company, is a consolidated subsidiary of NuStar GP Holdings, LLC (NuStar GP Holdings) (NYSE: NSH).
The following chart depicts a summary of our organizational structure at December 31, 2015.

Table of Contents
5
SEGMENTS
Detailed financial information about our segments is included in Note 25 of the Notes to Consolidated Financial Statements in Item 8. “Financial Statements and Supplementary Data.” The following map depicts our assets at December 31, 2015.
PIPELINE
Our pipeline operations consist of the transportation of refined petroleum products, crude oil and anhydrous ammonia. As of December 31, 2015, we owned and operated:
• refined product pipelines with an aggregate length of 3,140 miles and crude oil pipelines with an aggregate length of 1,200 miles in Texas, Oklahoma, Kansas, Colorado and New Mexico (collectively, the Central West System);
• a 1,920-mile refined product pipeline originating in southern Kansas and terminating at Jamestown, North Dakota, with a western extension to North Platte, Nebraska and an eastern extension into Iowa (the East Pipeline);
• a 440-mile refined product pipeline originating at Tesoro Corporation’s (Tesoro) Mandan, North Dakota refinery and terminating in Minneapolis, Minnesota (the North Pipeline); and
• a 2,000-mile anhydrous ammonia pipeline originating at the Louisiana delta area that travels north through the midwestern United States forking east and west to terminate in Nebraska and Indiana (the Ammonia Pipeline).
We charge tariffs on a per barrel basis for transporting refined products, crude oil and other feedstocks in our refined product and crude oil pipelines and on a per ton basis for transporting anhydrous ammonia in the Ammonia Pipeline.

Table of Contents
6
The following table lists information about our pipeline assets as of December 31, 2015:
Throughput For the year ended December 31,
Region / Pipeline System Length Tank Capacity 2015 2014(Miles) (Barrels) (Barrels/Day)
Central West System:McKee System 2,276 — 172,590 164,589Three Rivers System 373 — 74,361 78,177Other 491 — 60,410 51,698
Central West Refined Products Pipelines 3,140 — 307,361 294,464
South Texas Crude System 319 2,157,000 179,734 155,439Other 196 — 85,495 75,226
Eagle Ford System 515 2,157,000 265,229 230,665McKee System 598 1,039,000 144,077 140,402Ardmore System 87 824,000 62,326 66,690
Central West Crude Oil Pipelines 1,200 4,020,000 471,632 437,757Total Central West System 4,340 4,020,000 778,993 732,221
Central East System:East Pipeline 1,920 4,977,000 132,005 134,816North Pipeline 440 1,437,000 46,951 45,641Ammonia Pipeline 2,000 — 35,829 35,816
Total Central East System 4,360 6,414,000 214,785 216,273
Total 8,700 10,434,000 993,778 948,494
Description of PipelinesCentral West System. The Central West System covers a total of 4,340 miles. The Central West System pipelines support shale oil production and the refineries to which they are connected, including Valero Energy Corporation’s (Valero Energy) McKee, Three Rivers and Ardmore refineries. The refined product pipelines have an aggregate length of 3,140 miles (Central West Refined Products Pipelines) and transport gasoline, distillates (including diesel and jet fuel), natural gas liquids and other products produced at the refineries to which they are connected. The crude oil pipelines have an aggregate length of 1,200 miles (Central West Crude Oil Pipelines). Our crude oil pipelines transport crude oil and other feedstocks from various points to the refineries to which they are connected, and from the Eagle Ford Shale region to our North Beach marine terminal and refineries in Corpus Christi, Texas.
Central East System. The Central East System covers a total of 4,360 miles and consists of the East Pipeline, North Pipeline and Ammonia Pipeline.
The East Pipeline covers 1,920 miles and moves refined products and natural gas liquids north in pipelines ranging in diameter from 6 inches to 16 inches to NuStar Energy and third party terminals along the system and to receiving pipeline connections in Kansas. The East Pipeline system includes 17 terminals, discussed below, with storage capacity of approximately 3.6 million barrels and two tank farms with storage capacity of approximately 1.4 million barrels at McPherson and El Dorado, Kansas. Shippers on the East Pipeline obtain refined petroleum products from refineries in Kansas, Oklahoma and Texas.
The North Pipeline originates at Tesoro’s Mandan, North Dakota refinery and runs from west to east for approximately 440 miles to its termination in the Minneapolis, Minnesota area. The North Pipeline system includes 4 terminals, discussed below, with storage capacity of approximately 1.4 million barrels.
The East and North Pipelines include 21 truck-loading terminals through which refined petroleum products are delivered to storage tanks and then loaded into petroleum product transport trucks. Revenues earned at these terminals predominately relate to the volumes transported on the pipeline through fees included in the pipeline tariff. As a result, these terminals are included in this segment instead of the storage segment.

Table of Contents
7
The 2,000-mile Ammonia Pipeline originates in the Louisiana delta area, where it connects to three third-party marine terminals and three anhydrous ammonia plants on the Mississippi River. The line runs north through Louisiana and Arkansas into Missouri, where at Hermann, Missouri it splits and one branch goes east into Illinois and Indiana, while the other branch continues north into Iowa and then turns west into Nebraska. The Ammonia Pipeline is connected to multiple third-party-owned terminals, which include industrial facility delivery locations. Product is supplied to the pipeline from anhydrous ammonia plants in Louisiana and imported product delivered through the marine terminals. Anhydrous ammonia is primarily used as agricultural fertilizer. It is also used as a feedstock to produce other nitrogen derivative fertilizers and explosives.
Pipeline OperationsRevenues for the pipelines are based upon origin-to-destination throughput volumes traveling through our pipelines and their related tariff rates.
In general, shippers on our crude oil and refined product pipelines deliver petroleum products to our pipelines for transport to/from: (i) refineries that connect to our pipelines, (ii) third-party pipelines or terminals and (iii) NuStar Energy terminals for further delivery to marine vessels or pipelines. We charge our shippers tariff rates based on transportation from the origination point on the pipeline to the point of delivery.
Our pipelines are subject to federal regulation by one or more of the following governmental agencies: the Federal Energy Regulatory Commission (the FERC), the Surface Transportation Board (the STB), the Department of Transportation (DOT), the Environmental Protection Agency (EPA) and Homeland Security. Additionally, the operations and integrity of the pipelines are subject to the respective state jurisdictions.
The majority of our pipelines are common carrier. Common carrier activities are those for which transportation through our pipelines is available to any shipper of petroleum products who requests such services and satisfies the conditions and specifications for transportation. Published tariffs are (i) filed with the FERC for interstate petroleum product shipments, (ii) filed with the relevant state authority for intrastate petroleum product shipments and (iii) regulated by the STB for our Ammonia Pipeline.
We use a computerized Supervisory Control and Data Acquisition (SCADA) system to remotely operate pipelines. The SCADA system allows control center operators to control pumps and valves regulating and directing the transportation of petroleum products, while monitoring flow rates and pressures to assure system integrity and conform to pipeline schedules.
Demand for and Sources of Refined Products and Crude OilThroughputs on our Central West Refined Product Pipelines and the East and North Pipelines depend on the level of demand for refined products in the markets served by the pipelines and the ability and willingness of refiners and marketers having access to the pipelines to supply such demand by deliveries through the pipelines.
The majority of the refined products delivered through the Central West Refined Product Pipelines and the North Pipeline are gasoline and diesel fuel that originate at refineries connected to us. Demand for these products fluctuates as prices for these products fluctuate. Prices fluctuate for a variety of reasons including the overall balance in supply and demand, which is affected by general economic conditions, among other factors. Prices for gasoline and diesel fuel tend to increase in the warm weather months when people tend to drive automobiles more often and longer distances.
Much of the refined products and natural gas liquids delivered through the East Pipeline and a portion of volumes on the North Pipeline are ultimately used as fuel for railroads, ethanol denaturant or in agricultural operations, including fuel for farm equipment, irrigation systems, trucks used for transporting crops and crop-drying facilities. Demand for refined products for agricultural use, and the relative mix of products required, is affected by weather conditions in the markets served by the East and North Pipelines. The agricultural sector is also affected by government agricultural policies and crop prices. Although periods of drought suppress agricultural demand for some refined products, particularly those used for fueling farm equipment, the demand for fuel for irrigation systems often increases during such times. The mix of refined products delivered for agricultural use varies seasonally, with gasoline demand peaking in early summer, diesel fuel demand peaking in late summer and propane demand higher in the fall.
Our refined product pipelines are also dependent upon adequate levels of production of refined products by refineries connected to the pipelines, directly or through connecting pipelines. The refineries are, in turn, dependent upon adequate supplies of suitable grades of crude oil. Certain of our Central West Refined Products Pipelines are subject to long-term throughput agreements with Valero Energy. Valero Energy refineries connected directly to our pipelines obtain crude oil from a variety of foreign and domestic sources. If operations at one of these refineries were discontinued or significantly reduced, it could have a material adverse effect on our operations, although we would endeavor to minimize the impact by seeking alternative customers for those pipelines.

Table of Contents
8
The North Pipeline is heavily dependent on Tesoro’s Mandan, North Dakota refinery, which primarily runs North Dakota crude oil (although it has the ability to process other crude oils). If operations at the Tesoro refinery were interrupted, it could have a material adverse effect on our operations. The majority of the refined products transported through the East Pipeline are produced at three refineries located at McPherson and El Dorado, Kansas and Ponca City, Oklahoma, which are operated by CHS Inc., HollyFrontier Corporation (HollyFrontier) and Phillips 66, respectively. The East Pipeline also has access to Gulf Coast supplies of products through third party connecting pipelines that receive products originating on the Gulf Coast.
Other than the Valero Energy refineries described above and the Tesoro refinery, if operations at any one refinery were discontinued, we believe (assuming unchanged demand for refined products in markets served by the refined product pipelines) that the effects thereof would be short-term in nature and our business would not be materially adversely affected over the long-term because such discontinued production could be replaced by other refineries or other sources.
Our crude oil pipelines are dependent on our customers’ continued access to sufficient crude oil and sufficient demand for refined products for our customers to operate their refineries. The supply of crude oil production (domestic and foreign) could increase or decrease with the change in crude oil prices. Changes in crude oil prices could also affect the exploration and production of shale plays, which could impact crude oil pipelines serving those regions, such as our Eagle Ford System. However, many of our crude oil pipelines, including the McKee System, are the primary source of crude oil for our customers’ refineries. Therefore, these “demand-pull” pipelines are less affected by changes in crude oil prices.
Demand for and Sources of Anhydrous AmmoniaThe Ammonia Pipeline is one of two major anhydrous ammonia pipelines in the United States and the only one capable of receiving foreign product directly into the system and transporting anhydrous ammonia into the nation’s corn belt.
Throughputs on our Ammonia Pipeline depend on overall nitrogen fertilizer use, the price of natural gas, which is the primary component of anhydrous ammonia, and the level of demand for direct application of anhydrous ammonia as a fertilizer for crop production (Direct Application). Demand for Direct Application is dependent on the weather, as Direct Application is not effective if the ground is too wet or too dry.
Corn producers have fertilizer alternatives to anhydrous ammonia, such as liquid or dry nitrogen fertilizers. Liquid and dry nitrogen fertilizers are both less sensitive to weather conditions during application but are generally more costly than anhydrous ammonia. In addition, anhydrous ammonia has the highest nitrogen content of any nitrogen-derivative fertilizer.
CustomersThe largest customer of our pipeline segment was Valero Energy, which accounted for approximately 35% of the total segment revenues for the year ended December 31, 2015. In addition to Valero Energy, our customers include integrated oil companies, refining companies, farm cooperatives, railroads and others. No other customer accounted for a significant portion of the total revenues of the pipeline segment for the year ended December 31, 2015.
Competition and Business ConsiderationsBecause pipelines are generally the lowest-cost method for intermediate and long-haul movement of crude oil and refined petroleum products, our more significant competitors are common carrier and proprietary pipelines owned and operated by major integrated and large independent oil companies and other companies in the areas where we deliver products. Competition between common carrier pipelines is based primarily on transportation charges, quality of customer service and proximity to end users. Trucks may competitively deliver products in some of the areas served by our pipelines; however, trucking costs render that mode of transportation uncompetitive for longer hauls or larger volumes.
Most of our refined product pipelines and certain of our crude oil pipelines within the Central West System are physically integrated with and principally serve refineries owned by Valero Energy. As a result, we do not believe that we will face significant competition for transportation services provided to the Valero Energy refineries we serve.
Certain of our crude oil pipelines serve areas or refineries impacted by domestic shale oil production in the Eagle Ford, Permian Basin and Granite Wash regions. Our pipelines also face competition from other crude oil pipelines and truck transportation in these regions. However, that exposure is mitigated through our long-term contracts and minimum volume commitments with credit-worthy customers.
The East and North Pipelines compete with an independent common carrier pipeline system owned by Magellan Midstream Partners, L.P. (Magellan) that operates approximately 100 miles east of and parallel to the East Pipeline and in close proximity to the North Pipeline. Certain of the East Pipeline’s and the North Pipeline’s delivery terminals are in direct competition with Magellan’s terminals. Competition with Magellan is based primarily on transportation charges, quality of customer service and proximity to end users.

Table of Contents
9
Competitors of the Ammonia Pipeline include the other major anhydrous ammonia pipeline, owned by Magellan, which originates in Oklahoma and Texas and terminates in Minnesota. The competing pipeline has the same Direct Application demand and weather issues as the Ammonia Pipeline but is restricted to domestically produced anhydrous ammonia. Midwest production facilities, nitrogen fertilizer substitutes and barge and railroad transportation represent other forms of direct competition to the pipeline under certain market conditions.
STORAGE
Our storage segment includes terminal and storage facilities that provide storage, handling and other services for petroleum products, crude oil, specialty chemicals and other liquids. As of December 31, 2015, we owned and operated:
• 40 terminal and storage facilities in the United States and one terminal in Nuevo Laredo, Mexico, with total storage capacity of 51.2 million barrels;
• A terminal on the island of St. Eustatius with tank capacity of 14.4 million barrels and a transshipment facility;• A terminal located in Point Tupper, Canada with tank capacity of 7.8 million barrels and a transshipment facility;
and• Six terminals located in the United Kingdom and one terminal located in Amsterdam, the Netherlands, with total
storage capacity of approximately 9.5 million barrels.
Description of Major Terminal FacilitiesSt. Eustatius. We own and operate a 14.4 million barrel petroleum storage and terminalling facility located on the island of St. Eustatius in the Caribbean, which is located at a point of minimal deviation from major shipping routes. This facility is capable of handling a wide range of petroleum products, including crude oil and refined products, and it can accommodate heavy-laden ultra large crude carriers, or ULCCs, for loading and discharging crude oil and other petroleum products. A two-berth jetty, a two-berth monopile with platform and buoy systems, a floating hose station and an offshore single point mooring buoy with loading and unloading capabilities serve the terminal’s customers’ vessels. The fuel oil and petroleum product facilities have in-tank and in-line blending capabilities, while the crude tanks have tank-to-tank blending capability and in-tank mixers. In addition to the storage and blending services at St. Eustatius, this facility has the flexibility to utilize certain storage capacity for both feedstock and refined products to support our atmospheric distillation unit, which is capable of handling up to 25,000 barrels per day of feedstock, ranging from condensates to heavy crude oil. We own and operate all of the berthing facilities at the St. Eustatius terminal. Separate fees apply for use of the berthing facilities, as well as associated services, including pilotage, tug assistance, line handling, launch service, emergency response services and other ship services.
St. James, Louisiana. Our St. James terminal, which is located on the Mississippi River near St. James, Louisiana, has a total storage capacity of 9.2 million barrels. The facility is located on almost 900 acres of land, some of which is undeveloped. The majority of the storage tanks and infrastructure are suited for light crude oil, with four tanks capable of fuel oil or heated crude oil storage. Additionally, the facility has one barge dock and two ship docks. Our St. James terminal can receive product from gathering pipelines in the Gulf of Mexico and deliver to connecting pipelines that supply refineries in the Gulf Coast and Midwest. The St. James terminal also has two unit train rail facilities and a manifest rail facility, which are served by the Union Pacific Railroad and have a combined capacity of approximately 200,000 barrels per day. In 2016, we expect to complete construction of two additional tanks with an aggregate storage capacity of 720,000 barrels.
Point Tupper. We own and operate a 7.8 million barrel terminalling and storage facility located at Point Tupper on the Strait of Canso, near Port Hawkesbury, Nova Scotia. This facility is the deepest independent, ice-free marine terminal on the North American Atlantic coast, with access to the East Coast, Canada and the Midwestern United States via the St. Lawrence Seaway and the Great Lakes system. With one of the premier jetty facilities in North America, the Point Tupper facility can accommodate heavy-laden ULCCs for loading and discharging crude oil, petroleum products and petrochemicals. Crude oil and petroleum product movements at the terminal are fully automated. Separate fees apply for use of the jetty facility, as well as associated services, including pilotage, tug assistance, line handling, launch service, emergency response services and other ship services.
Linden, New Jersey. Our Linden terminal facility has two terminals that provide deep-water terminalling capabilities in the New York Harbor and primarily stores petroleum products, including gasoline, jet fuel and fuel oils. The two terminals have a total storage capacity of 4.6 million barrels and can receive and deliver products via ship, barge and pipeline. The terminal facility includes two docks. On January 2, 2015, we acquired full ownership of one of the terminals located at the Linden facility that we previously owned 50% through a joint venture.
Amsterdam. Our Amsterdam terminal has a total storage capacity of 3.8 million barrels. This facility is located at the Port of Amsterdam and primarily stores petroleum products including gasoline, diesel and fuel oil. This facility has two docks for vessels and five docks for inland barges.

Table of Contents
10
Corpus Christi North Beach. We own and operate a 2.1 million barrel crude oil storage and terminalling facility located at the Port of Corpus Christi in Texas. The facility supports our South Texas Crude System and provides our customers with the flexibility to segregate and deliver crude oil and processed condensate. In addition, this facility has three docks, including one private dock, and can load crude oil onto ships simultaneously on all three docks at a maximum rate of 65,000 barrels per hour. The Corpus Christi North Beach terminal has the capacity to move on average between 350,000 and 400,000 barrels per day and can accommodate Panamax-class vessels (which carry between 350,000 and 500,000 barrels).
Terminal and Storage FacilitiesThe following table sets forth information about our terminal and storage facilities as of December 31, 2015:
Facility Tank Capacity (Barrels)
Colorado Springs, CO 328,000Denver, CO 110,000Albuquerque, NM 251,000Abernathy, TX 160,000Amarillo, TX 269,000Corpus Christi, TX 329,000Corpus Christi, TX (North Beach) 2,136,000Edinburg, TX 340,000El Paso, TX (b) 419,000Harlingen, TX 286,000Laredo, TX 215,000San Antonio, TX (c) 375,000Southlake, TX 569,000Nuevo Laredo, Mexico 35,000
Central West Terminals 5,822,000
Pittsburg, CA 398,000Rosario, NM 166,000Catoosa, OK 358,000Houston, TX 86,000
Asphalt Terminals 1,008,000
Jacksonville, FL 2,593,000St. James, LA 9,190,000Texas City, TX (c) 2,964,000
Gulf Coast Terminals 14,747,000
Blue Island, IL 690,000Andrews AFB, MD (a) 75,000Baltimore, MD 818,000Piney Point, MD 5,402,000Linden, NJ (c) 4,649,000Paulsboro, NJ 74,000Virginia Beach, VA (a) 41,000
North East Terminals 11,749,000

Table of Contents
11
Facility Tank Capacity (Barrels)
Los Angeles, CA 608,000Selby, CA 3,060,000Stockton, CA 816,000Portland, OR 1,365,000Tacoma, WA 391,000Vancouver, WA (c) 774,000
West Coast Terminals 7,014,000
Corpus Christi, TX 4,030,000Texas City, TX 3,141,000Benicia, CA 3,683,000
Refinery Storage Tanks 10,854,000
Grays, England 1,958,000Eastham, England 2,096,000Runcorn, England 149,000Grangemouth, Scotland 719,000Glasgow, Scotland 353,000Belfast, Northern Ireland 408,000
United Kingdom Terminals 5,683,000
St. Eustatius, the Netherlands 14,411,000Amsterdam, the Netherlands 3,834,000Point Tupper, Canada 7,778,000
Total Terminals and Storage Facilities 82,900,000
(a) Terminal facility also includes pipelines to U.S. government military base locations.(b) We own a 67% undivided interest in the El Paso refined product terminal. The tank capacity represents the
proportionate share of capacity attributable to our ownership interest.(c) Location includes two terminal facilities.
During 2015, we divested our refined product terminals with an aggregate storage capacity of 0.7 million barrels and located in Indianapolis, Indiana; Alamogordo, New Mexico and Placedo, Texas.
Storage OperationsRevenues for the storage segment include fees for tank storage agreements, where a customer agrees to pay for a certain amount of storage in a tank over a period of time (storage lease revenues), and throughput agreements, where a customer pays a fee per barrel for volumes moving through our terminals (throughput revenues). Our terminals also provide blending, additive injections, handling and filtering services for which we charge additional fees. We charge a fee for each barrel of crude oil and certain other feedstocks that we deliver to Valero Energy’s Benicia, Corpus Christi West and Texas City refineries from our crude oil refinery storage tanks. Certain of our facilities charge fees to provide marine services such as pilotage, tug assistance, line handling, launch service, emergency response services and other ship services.
Demand for Refined Petroleum Products and Crude OilThe operations of our refined product terminals depend in large part on the level of demand for products stored in our terminals in the markets served by those assets. The majority of products stored in our terminals are refined petroleum products. Demand for our terminalling services will generally increase or decrease with demand for refined petroleum products, and demand for refined petroleum products tends to increase or decrease with the relative strength of the economy. In addition, the forward pricing curve can impact demand. For example, in a contango market (when the price for future storage is expected to exceed

Table of Contents
12
current prices), demand for storage services will generally increase. As of December 31, 2015, almost all of our tank storage capacity is under contract.
Crude oil delivered to our St. James terminal through our unit train facilities, and crude oil delivered to our Corpus Christi North Beach terminal will generally increase or decrease with crude oil production rates in the Bakken and Eagle Ford shale plays, respectively. In addition, the market price relationship between various grades of crude oil impacts the demand for our unit train facilities at our St. James terminal, which can affect our profit sharing and volumes.
CustomersWe provide storage and terminalling services for crude oil and refined petroleum products to many of the world’s largest producers of crude oil, integrated oil companies, chemical companies, oil traders and refiners. In addition, our blending capabilities in our storage assets have attracted customers who have leased capacity primarily for blending purposes. The largest customer of our storage segment is Valero Energy, which accounted for approximately 19% of the total revenues of the segment for the year ended December 31, 2015. No other customer accounted for a significant portion of the total revenues of the storage segment for the year ended December 31, 2015.
Competition and Business ConsiderationsMany major energy and chemical companies own extensive terminal storage facilities. Although such terminals often have the same capabilities as terminals owned by independent operators, they generally do not provide terminalling services to third parties. In many instances, major energy and chemical companies that own storage and terminalling facilities are also significant customers of independent terminal operators. Such companies typically have strong demand for terminals owned by independent operators when independent terminals have more cost-effective locations near key transportation links, such as deep-water ports. Major energy and chemical companies also need independent terminal storage when their owned storage facilities are inadequate, either because of size constraints, the nature of the stored material or specialized handling requirements.
Independent terminal owners generally compete on the basis of the location and versatility of terminals, service and price. A favorably located terminal will have access to various cost-effective transportation modes both to and from the terminal. Transportation modes typically include waterways, railroads, roadways and pipelines.
Terminal versatility is a function of the operator’s ability to offer complex handling requirements for diverse products. The services typically provided by the terminal include, among other things, the safe storage of the product at specified temperature, moisture and other conditions, as well as receipt at and delivery from the terminal, all of which must comply with applicable environmental regulations. A terminal operator’s ability to obtain attractive pricing is often dependent on the quality, versatility and reputation of the facilities owned by the operator. Although many products require modest terminal modification, operators with versatile storage capabilities typically require less modification prior to usage, ultimately making the storage cost to the customer more attractive.
Our St. Eustatius and Point Tupper terminals have historically functioned as “break bulk” facilities, which handled imports of light crude from foreign sources into the U.S. to satisfy U.S. East Coast and Gulf Coast refinery demand for light crude. Light crude suppliers brought the crude from the Middle East and other foreign regions on very large ships,which are efficient for long routes. These large ships, due to draft constraints, are unable to navigate far enough inland to deliver directly to U.S. shores, which necessitates unloading these ships to storage and subsequent loading onto smaller ships that can bring the crude to the refiners, a process referred to as “break bulk.” Both terminals are well-located to provide this service.
As the supply of light crude from various U.S. shale formations has increased, U.S. demand for foreign light crude oil has dropped substantially. This reduced demand for imported light crude has, in turn, dramatically changed oil trade flow patterns around the world, thereby depressing the demand for break bulk services. At the same time, South American and Canadian production of heavy crude has ramped up significantly. As demand for export of heavy crude and natural gas liquids (NGL) out of South America, as well as from Canada, has risen, so has the demand for “build bulk” services. In order to reduce costs and increase efficiencies for long routes to customers abroad, exporting producers need to consolidate their heavy oil cargos from the small ships used to move the heavy crude off shore to a large vessel that is more efficient for long routes, a process referred to as “build bulk.” Our St. Eustatius terminal’s location is well-suited to build bulk for South American producers headed to customers overseas, primarily in Asia. Our Point Tupper facility’s location is similarly well-positioned, in this case to build bulk for heavy Canadian crude oil and NGL production.
We may face increased competition from new and/or expanding terminals near our locations, if those facilities offer either break bulk or build bulk services, as demanded by the applicable oil trade flows, now and in the future.

Table of Contents
13
Our crude oil refinery storage tanks are physically integrated with and serve refineries owned by Valero Energy. Additionally, we have entered into various agreements with Valero Energy governing the usage of these tanks. As a result, we believe that we will not face significant competition for our services provided to those refineries.
FUELS MARKETING
Fuels Marketing OperationsOur fuels marketing operations involve the purchase of crude oil, fuel oil, bunker fuel, fuel oil blending components and other refined products for resale. These operations provide us the opportunity to generate additional gross margin while complementing the activities of our storage segment. We utilize storage assets, including our own terminals and rail unloading facilities, at our St. James, Texas City and St. Eustatius terminals. Rates charged by our storage segment to the fuels marketing segment are consistent with rates charged to third parties.
Within our fuels marketing operations, we purchase crude oil and refined petroleum products for resale. The results of operations for the fuels marketing segment depend largely on the margin between our cost and the sales prices of the products we market. Therefore, the results of operations for this segment are more sensitive to changes in commodity prices compared to the operations of the pipeline and storage segments.
Since our fuels marketing operations expose us to commodity price risk, we enter into derivative instruments to mitigate the effect of commodity price fluctuations on our operations. The derivative instruments we use consist primarily of commodity futures and swap contracts.
Customers Fuels marketing customers include major integrated refiners and trading companies. Customers for our bunker fuel sales are mainly ship owners, including cruise line companies. No customer accounted for a significant portion of the total revenues of the fuels marketing segment for the year ended December 31, 2015.
Competition and Business Considerations Our fuels marketing operations have numerous competitors, including large integrated refiners, marketing affiliates of other partnerships in our industry, as well as various international and domestic trading companies. In the sale of bunker fuel, we compete with ports offering bunker fuels that are along the route of travel of the vessel.
EMPLOYEES
Our operations are managed by NuStar GP, LLC. As of December 31, 2015, NuStar GP, LLC had 1,251 domestic employees and certain of our wholly owned subsidiaries had 393 employees performing services for our international operations. We believe that NuStar GP, LLC and our subsidiaries each have satisfactory relationships with their employees. Please refer to Note 28 of the Notes to Consolidated Financial Statements in Item 8. “Financial Statements and Supplementary Data” for a discussion of the employee transfer from NuStar GP, LLC.
RATE REGULATION
Several of our petroleum pipelines are interstate common carrier pipelines, which are subject to regulation by the FERC under the Interstate Commerce Act (ICA) and the Energy Policy Act of 1992 (the EP Act). The ICA and its implementing regulations give the FERC authority to regulate the rates charged for service on interstate common carrier pipelines and generally require the rates and practices of interstate oil pipelines to be just, reasonable, not unduly discriminatory, and not unduly preferential. The ICA also requires tariffs that set forth the rates a common carrier pipeline charges for providing transportation services on its interstate common carrier liquids pipelines, as well as the rules and regulations governing these services, to be maintained on file with the FERC and posted publicly. The EP Act deemed certain rates in effect prior to its passage to be just and reasonable and limited the circumstances under which a complaint can be made against such “grandfathered” rates. The EP Act and its implementing regulations also allow interstate common carrier oil pipelines to annually index their rates up to a prescribed ceiling level and require that such pipelines index their rates down to the prescribed ceiling level if the index is negative. In addition, the FERC retains cost-of-service ratemaking, market-based rates and settlement rates as alternatives to the indexing approach.
The Ammonia Pipeline is subject to regulation by the STB pursuant to the Interstate Commerce Act applicable to such pipelines (which differs from the ICA applicable to interstate liquids pipelines). Under that regulation, the Ammonia Pipeline’s rates, classifications, rules and practices related to the interstate transportation of anhydrous ammonia must be reasonable and, in

Table of Contents
14
providing interstate transportation, the Ammonia Pipeline may not subject a person, place, port or type of traffic to unreasonable discrimination.
Additionally, the rates and practices for our intrastate common carrier pipelines are subject to regulation by state commissions, including in Colorado, Kansas, Louisiana, North Dakota and Texas. Although the applicable state statutes and regulations vary, they generally require that intrastate pipelines publish tariffs setting forth all rates, rules and regulations applying to intrastate service, and generally require that pipeline rates and practices be just, reasonable and nondiscriminatory.
Shippers may challenge tariff rates, rules and regulations on our pipelines. In most instances, state commissions have not initiated investigations of the rates or practices of pipelines in the absence of shipper complaints. There are no pending challenges or complaints regarding our tariffs.
ENVIRONMENTAL AND SAFETY REGULATION
Our operations are subject to extensive federal, state and local environmental laws and regulations, including those relating to the discharge of materials into the environment, waste management and pollution prevention measures, among others. Our operations are also subject to extensive federal, state and local health and safety laws and regulations, including those relating to worker and pipeline safety, pipeline integrity and operator qualifications. The principal environmental and safety risks associated with our operations relate to unauthorized or unpermitted emissions into the air, unauthorized releases into soil, surface water or groundwater, and personal injury and property damage. Compliance with these environmental, health and safety laws, regulations and related permits increases our capital expenditures and our overall cost of business, and violations of these laws, regulations or permits can result in significant civil and criminal liabilities, injunctions or other penalties.
We have adopted policies, practices and procedures including in the areas of pollution control, pipeline integrity, operator qualifications, public relations and education, process safety management, risk management planning, hazard communication, emergency response planning, community right-to-know, occupational health and the handling, storage, use and disposal of hazardous materials, that are designed to comply with applicable federal, state and local regulations and to prevent material environmental or other damage, to ensure the safety of our pipelines, our employees, the public and the environment and to limit the financial liability that could result from such events. Future governmental action and regulatory initiatives could result in changes to expected operating permits and procedures, additional remedial actions or increased capital expenditures and operating costs that cannot be assessed with certainty at this time. In addition, contamination resulting from spills of petroleum and other products occurs within the industry. While we believe that we are in substantial compliance with the health, safety and environmental regulations applicable to us, risks of additional costs and liabilities are inherent within the industry, and there can be no assurances that significant costs and liabilities will not be incurred in the future.
Capital Expenditures Attributable to Compliance with Environmental Statutes and Regulations. It is possible that these statutes and the related regulations may be revised to be more restrictive in the future, necessitating additional capital expense to ensure our operations are in compliance. We are unable to estimate the effect on our financial condition or results of operations or the amount and timing of such required expenditures. In 2015, our capital expenditures attributable to compliance with environmental regulations were $11.4 million, and are currently estimated to be approximately $18.0 million for 2016.
RENEWABLE ENERGY AND ALTERNATIVE FUEL MANDATES
Several federal and state programs require, subsidize or encourage the purchase and use of renewable energy and alternative fuels, such as battery-powered engines, biodiesel, wind energy, and solar energy. These programs may over time offset projected increases or reduce the demand for refined petroleum products, particularly gasoline, in certain markets. The increased production and use of biofuels may also create opportunities for additional pipeline transportation and additional blending opportunities within the storage segment, although that potential cannot be quantified at present. Other legislative changes may similarly alter the expected demand and supply projections for refined petroleum products in ways that cannot be predicted.
WATER
The federal Water Pollution Control Act, as amended, also known as the Clean Water Act, and analogous or more stringent state and local statutes and regulations impose restrictions and strict controls regarding the discharge of pollutants into state waters or waters of the United States. The discharge of pollutants into state waters or waters of the United States is generally prohibited, except in accordance with the terms of a permit issued by applicable federal or state authorities. The Oil Pollution Act, enacted in 1990, amends provisions of the Clean Water Act as they pertain to prevention, response to and liability for oil spills. Spill prevention control and countermeasure requirements of the Clean Water Act and some state laws require response

Table of Contents
15
plans and the use of dikes and similar structures to help prevent contamination of state waters or waters of the United States in the event of an unauthorized discharge. Violations of any of these statutes and the related regulations could result in significant costs and liabilities. It is possible that these statutes and the related regulations may be revised to be more restrictive in the future, necessitating additional capital expense to ensure our operations are in compliance. We are unable to estimate the effect on our financial condition or results of operations or the amount and timing of such required expenditures.
AIR
The federal Clean Air Act, as amended, and analogous or more stringent state and local statutes and regulations impose restrictions and strict controls regarding the discharge of pollutants into the air. The discharge of pollutants into the air is generally prohibited, except in accordance with the terms of a permit issued by applicable federal or state authorities, and these laws and related regulations regulate emissions of air pollutants from various sources, including some of our operations, and also impose various monitoring and reporting requirements. Such laws and regulations may require a facility to obtain pre-approval for the construction or modification of certain projects or facilities expected to produce air emissions or result in the increase of existing air emissions, and obtain and strictly comply with the provisions of any air permits. Violations of any of these statutes and the related regulations could result in significant costs and liabilities. It is possible that these statutes and the related regulations may be revised to be more restrictive in the future, necessitating additional capital expense to ensure our operations are in compliance. We are unable to estimate the effect on our financial condition or results of operations or the amount and timing of such required expenditures.
SOLID WASTE
The federal Resource Conservation and Recovery Act (RCRA) and analogous or more stringent state and local statutes and regulations impose restrictions and strict controls regarding solid wastes, including hazardous wastes. We currently are not required to comply with a substantial portion of RCRA requirements because we do not operate any waste treatment, storage or disposal facilities. However, it is possible that additional wastes, which could include wastes currently generated during operations, will also be designated as hazardous wastes. Hazardous wastes are subject to more rigorous and costly disposal requirements than are non-hazardous wastes. Violations of any of these statutes and the related regulations could result in significant costs and liabilities. It is possible that these statutes and the related regulations may be revised to be more restrictive in the future, necessitating additional capital expense to ensure our operations are in compliance. We are unable to estimate the effect on our financial condition or results of operations or the amount and timing of such required expenditures.
HAZARDOUS SUBSTANCES
The federal Comprehensive Environmental Response, Compensation and Liability Act, referred to as CERCLA and also known as Superfund, and analogous or more stringent state and local statutes and regulations impose restrictions and liability, including joint and several liability, without regard to fault or the legality of the original act, on some classes of persons that contributed to the release or threatened release of a hazardous substance into the environment. These classes of persons can include the owner or operator of the facility and those that disposed or arranged for the disposal of the hazardous substances. CERCLA also authorizes the EPA and, in some instances, third parties to act in response to threats that endanger public health or the environment and to seek recovery from the responsible classes of persons for the costs they incur. In the course of our ordinary operations, we may generate and arrange for the disposal of wastes that fall within CERCLA’s definition of a hazardous substance.
We currently own or lease, and have in the past owned or leased, properties where hazardous substances are being or have been handled. Although we believe that we have utilized operating and disposal practices that were standard in the industry at the time, substances may have been disposed of or released on or under the properties owned or leased by us or on or under other locations where these wastes have been taken for disposal. In addition, we acquired many of these properties from third parties, and we did not control those third parties’ treatment and disposal or release of hazardous substances. These properties and substances disposed thereon may be subject to CERCLA, RCRA and analogous state and local statutes and regulations. Under these laws, we could be required to remove or remediate previously disposed substances (including substances disposed of or released by prior owners or operators), to clean up contaminated property (including contaminated groundwater) or to perform remedial operations to prevent future contamination. In addition, we may be exposed to joint and several liability under CERCLA for all or part of the costs required to clean up sites at which hazardous substances may have been disposed of or released into the environment.
While remediation of subsurface contamination is in process at several of our facilities, based on current available information, we believe that the cost of these activities will not materially affect our financial condition or results of operations. Such costs, however, are often unpredictable and, therefore, there can be no assurances that the future costs will not become material.

Table of Contents
16
Further, it is possible that these statutes and the related regulations may be revised to be more restrictive in the future, necessitating additional capital expense to ensure compliance. We are unable to estimate the effect on our financial condition or results of operations or the amount and timing of such required expenditures.
INTEGRITY AND SAFETY
Our pipeline, storage tank and other operations are subject to extensive federal, state and local statutes and regulations governing mechanical integrity and safety, including those in Title 49 of the United States Code and its implementing regulations. These statutes and regulations include requirements for safe operation, maintenance, testing and corrosion control, and qualification programs for operating personnel. In addition, other requirements can include reviewing and updating existing pipeline safety public education programs, providing information for the National Pipeline Mapping System, maintaining spill response plans, conducting spill response training, implementing integrity management programs and managing pipeline control centers. Violations of any of these statutes and the related regulations could result in significant costs and liabilities. It is possible that these statutes and the related regulations may be revised to be more restrictive in the future, necessitating additional capital expense to ensure our operations are in compliance. However, while compliance may affect our capital expenditures and operating expenses, we believe that the cost of such compliance will not materially affect our competitive position or have a material effect on our financial condition or results of operations.

Table of Contents
17
RISK FACTORS
RISKS RELATED TO OUR BUSINESS
We may not be able to generate sufficient cash from operations to enable us to pay quarterly distributions to our unitholders at current levels.The amount of cash that we can distribute to our unitholders each quarter principally depends upon the amount of cash we generate from our operations, which will fluctuate from quarter to quarter based on, among other things:
• throughput volumes transported in our pipelines;• lease renewals or throughput volumes in our terminals and storage facilities;• tariff rates and fees we charge and the returns we realize for our services;• the results of our marketing, trading and hedging activities, which fluctuate depending upon the relationship
between refined product prices and prices of crude oil and other feedstocks;• demand for and supply of crude oil, refined products and anhydrous ammonia;• the effect of worldwide energy conservation measures;• our operating costs;• weather conditions;• domestic and foreign governmental regulations and taxes; and• prevailing economic conditions.
In addition, the amount of cash that we will have available for distribution will depend on other factors, including:• our debt service requirements and restrictions on distributions contained in our current or future debt agreements;• the sources of cash used to fund our acquisitions;• our capital expenditures;• fluctuations in our working capital needs;• issuances of debt and equity securities; and• adjustments in cash reserves made by our general partner, in its discretion.
Because of these factors, we may not have sufficient available cash each quarter to continue paying distributions at their current level or at all. Furthermore, cash distributions to our unitholders depend primarily upon our cash flows, including cash flows from financial reserves and working capital borrowings, and not solely on profitability, which is affected by non-cash items. Therefore, we may make cash distributions during periods when we record net losses and may not make cash distributions during periods when we record net income.
Our inability to develop and execute growth projects and acquire new assets could limit our ability to maintain and grow quarterly distributions to our unitholders.Our ability to maintain and grow our distributions to unitholders depends on the growth of our existing businesses and strategic acquisitions. If we are unable to implement business development opportunities and finance such activities on economically acceptable terms, our future growth will be limited, which could adversely impact our results of operations and cash flows and, accordingly, result in reduced distributions over time.
Failure to complete capital projects as planned could adversely affect our financial condition, results of operations and cash flows.Delays or cost increases related to capital spending programs involving construction of new facilities (or improvements and repairs to our existing facilities) could adversely affect our ability to achieve forecasted operating results. Although we evaluate and monitor each capital spending project and try to anticipate difficulties that may arise, such delays or cost increases may arise as a result of factors that are beyond our control, including:
• denial or delay in issuing requisite regulatory approvals and/or permits;• unplanned increases in the cost of construction materials or labor;• disruptions in transportation of modular components and/or construction materials;• severe adverse weather conditions, natural disasters or other events (such as equipment malfunctions, explosions,
fires or spills) affecting our facilities, or those of vendors and suppliers;• shortages of sufficiently skilled labor, or labor disagreements resulting in unplanned work stoppages;• market-related increases in a project’s debt or equity financing costs; or• non-performance by, or disputes with, vendors, suppliers, contractors or sub-contractors involved with a project.
Our forecasted operating results are also based upon our projections of future market fundamentals that are not within our control, including changes in general economic conditions, the supply and demand of crude oil and refined products,

Table of Contents
18
availability to our customers of attractively priced alternative solutions for storage, transportation or supplies of crude oil and refined products and overall customer demand.
If we are unable to retain current, and obtain new, customers through renewing or establishing leases and throughput agreements at current or better rates or the utilization of our leased assets suffers a material decrease, our revenue and cash flows could be reduced to levels that could adversely affect our ability to make quarterly distributions to our unitholders.Our revenue and cash flows are generated primarily from our customers’ payments of fees under throughput contracts and lease agreements. Failure to renew or enter into new contracts or our leasing customers’ material reduction of their utilization under our existing leases could result from many factors, including:
• a material decrease in the supply or price of crude oil;• a material decrease in demand for refined products in the markets served by our pipelines and terminals;• scheduled turnarounds or unscheduled maintenance at refineries we serve;• operational problems or catastrophic events at a refinery we serve or our assets;• environmental proceedings or other litigation that compel the cessation of all or a portion of the operations at a
refinery we serve or our assets;• a decision by our current customers to redirect refined products transported in our pipelines to markets not served
by our pipelines or to transport crude oil or refined products by means other than our pipelines;• increasingly stringent environmental regulations; or• a decision by our current customers to sell one or more of the refineries we serve to a purchaser that elects not to
use our pipelines and terminals.
Competing midstream service providers, including certain major energy and chemical companies, possess, or have greater financial resources to acquire, assets better suited to customer demand, which could undermine our ability to obtain and retain customers or reduce utilization of our leased assets, which could reduce our revenues and cash flows, thereby reducing our ability to make our quarterly distributions to unitholders.Our competitors include major energy and chemical companies, some of which have greater financial resources, more pipelines or storage terminals, greater capacity pipelines or storage terminals and greater access to supply than we do. Certain of our competitors also may have advantages in competing for acquisitions or other new business opportunities because of their financial resources and synergies in operations. As a consequence of increased competition in the industry, some of our customers may be reluctant to renew or enter into long-term contracts or contracts that provide for minimum throughput amounts in the future. Our inability to renew or replace our current contracts as they expire, to enter into contracts for newly constructed or expanded assets and to respond appropriately to changing market conditions could have a negative effect on our revenue, cash flows and ability to make quarterly distributions to our unitholders.
Our future financial and operating flexibility may be adversely affected by our significant leverage, downgrades of our credit ratings, restrictions in our debt agreements or conditions in the financial markets.As of December 31, 2015, our consolidated debt was $3.2 billion. We also may be required to post cash collateral under certain of our hedging arrangements, which we expect to fund with borrowings under our revolving credit agreement. In addition to any potential direct financial impact of our debt, it is possible that any material increase to our debt or other negative financial factors may be viewed negatively by credit rating agencies, which could result in ratings downgrades and increased costs for us to access the capital markets. Any downgrades in our credit ratings in the future could result in increases to the interest rates on borrowings under our credit facilities and the 7.65% senior notes due 2018, significantly increase our capital costs, reduce our liquidity and adversely affect our ability to raise capital in the future.
Our revolving credit agreement contains restrictive covenants, such as limitations on indebtedness, liens, mergers, asset transfers and certain investing activities. In addition, the revolving credit agreement requires us to maintain, as of the end of each rolling period, which consists of any period of four consecutive fiscal quarters, a consolidated debt coverage ratio (consolidated debt to consolidated EBITDA, each as defined in the revolving credit agreement) not to exceed 5.00-to-1.00. Failure to comply with any of the revolving credit agreement restrictive covenants or this coverage ratio will result in a default and could result in acceleration of this agreement and possibly other indebtedness.
Our accounts receivable securitization program contains various customary affirmative and negative covenants and default, indemnification and termination provisions. In addition, the related receivables financing agreement pursuant to which we are initial servicer and performance guarantor provides for acceleration of amounts owed upon the occurrence of certain specified events.
Our debt service obligations, restrictive covenants and maturities resulting from our leverage may adversely affect our ability to finance future operations, pursue acquisitions, fund our capital needs and pay cash distributions to our unitholders at current levels. In addition, this leverage may make our results of operations more susceptible to adverse economic or operating

Table of Contents
19
conditions. For example, during an event of default under certain of our debt agreements, we would be prohibited from making cash distributions to our unitholders. If our lenders file for bankruptcy or experience severe financial hardship, they may not honor their pro rata share of our borrowing requests under the revolving credit agreement, which may significantly reduce our available borrowing capacity and, as a result, materially adversely affect our financial condition and ability to pay distributions to our unitholders at current levels. Additionally, we may not be able to access the capital markets in the future at economically attractive terms, which may adversely affect our future financial and operating flexibility and our ability to pay cash distributions at current levels.
Increases in interest rates could adversely affect our business and the trading price of our units.We have significant exposure to increases in interest rates. At December 31, 2015, we had approximately $3.2 billion of consolidated debt, of which $1.8 billion was at fixed interest rates and $1.4 billion was at variable interest rates. In addition, prior ratings downgrades on our existing indebtedness caused interest rates under our revolving credit agreement and our senior notes due 2018 to increase effective January 2013, and future downgrades may cause interest rates on our variable interest rate debt to increase further. Additionally, at December 31, 2015, we had $600.0 million aggregate notional amount of interest rate swap arrangements, which increase our exposure to variable interest rates. As a result, our results of operations, cash flows and financial position could be materially adversely affected by significant increases in interest rates above current levels. In addition, we historically have funded our strategic capital expenditures and acquisitions from external sources, primarily borrowings under our revolving credit agreement or funds raised through debt or equity offerings. An increase in interest rates may negatively impact our ability to access the capital markets at economically attractive rates. Further, the trading price of our units is sensitive to changes in interest rates and any rise in interest rates could adversely impact the trading price of our units, which would effectively increase our cost of raising funds through equity offerings.
Low crude oil prices could have an adverse impact on our results of operations, cash flows and ability to make distributions to our unitholders, as well as our ability to access the capital markets at economically attractive rates.During 2015 and early 2016, the price of crude oil has continued to decline, reaching lows not seen in 13 years. The sustained period of low prices has forced most crude oil producers to reduce their capital spending and drilling activity and narrow their focus to assets in the most cost-advantaged regions. On the other hand, refiners generally have benefitted from lower crude prices, particularly to the extent that lower feedstock price has been coupled with higher demand for certain refined products in some regional markets. However, a protracted period of depressed crude oil prices and overall economic downturn could have a negative impact on our results of operations.
In addition, regardless of insulation from or lack of exposure to commodity prices, continued low crude oil prices seem to be having a direct, negative impact on the unit price of many master limited partnerships, including our own, and unfavorable market conditions have increased the cost of financing capital spending through the public debt and equity markets.
Reduced demand for or supply of crude oil and refined products could affect our results of operations and ability to make distributions at current levels to our unitholders.Our business is dependent upon the demand for and supply of the crude oil and refined products transported by our pipelines and stored in our terminals. Any sustained decrease in demand for refined products in the markets served by our pipelines and terminals could result in a significant reduction in throughputs in our pipelines and storage in our terminals, which would reduce our cash flows and our ability to make distributions at current levels to our unitholders. Factors that could lead to a decrease in market demand include:
• a recession or other adverse economic condition that results in lower spending by consumers on gasoline, diesel and travel;
• higher fuel taxes or other governmental or regulatory actions that increase, directly or indirectly, the cost of gasoline;
• an increase in automotive engine fuel economy, whether as a result of a shift by consumers to more fuel-efficient vehicles or technological advances by manufacturers;
• an increase in the market price of crude oil that leads to higher refined product prices, which may reduce demand for refined products and drive demand for alternative products. Market prices for crude oil and refined products, including fuel oil, are subject to wide fluctuation in response to changes in global and regional supply that are beyond our control, and increases in the price of crude oil may result in a lower demand for refined products that we transport, store and market, including fuel oil;
• a decrease in corn acres planted, which may reduce demand for anhydrous ammonia; and• the increased use of alternative fuel sources, such as battery-powered engines.

Table of Contents
20
Similarly, any sustained decrease in the supply of crude oil and refined products could result in a significant reduction in throughputs in our pipelines and storage in our terminals, which would reduce our cash flows and our ability to make distributions at current levels to our unitholders. Factors that could lead to a decrease in supply to our pipelines and terminals include:
• prolonged periods of low prices for crude oil and refined products, which could lead to a decrease in exploration and development activity and reduced production in markets served by our pipelines and storage terminals;
• changes in the regulatory environment, governmental policies or taxation that directly or indirectly delay production or increase the cost of production of refined products; and
• actions taken by foreign oil and gas producing nations that impact prices for crude oil and refined products.
Our operations are subject to operational hazards and unforeseen interruptions, and we do not insure against all potential losses. Therefore, we could be seriously harmed by unexpected liabilities.Our operations are subject to operational hazards and unforeseen interruptions such as natural disasters, adverse weather, accidents, fires, explosions, hazardous materials releases, mechanical failures and other events beyond our control. These events might result in a loss of equipment or life, injury or extensive property damage, as well as an interruption in our operations. In the event any of our facilities are forced to shut down for a significant period of time, it may have a material adverse effect on our earnings, our other results of operations and our financial condition as a whole. We may not be able to maintain or obtain insurance of the type and amount we desire at reasonable rates. As a result of market conditions, premiums and deductibles for certain of our insurance policies have increased substantially and could escalate further. Certain insurance coverage could become unavailable or available only for reduced amounts of coverage and at higher rates. For example, our insurance carriers require broad exclusions for losses due to terrorist acts. If we were to incur a significant liability for which we are not fully insured, such a liability could have a material adverse effect on our financial position and our ability to make distributions at current levels to our unitholders and to meet our debt service requirements.
We could be subject to damages based on claims brought against us by our customers or lose customers as a result of the failure of our products to meet certain quality specifications or other claims related to the operation of our assets and the services we provide to our customers.Certain of our products are produced to precise customer specifications. If a product fails to perform in a manner consistent with the detailed quality specifications required by the customer, the customer could seek replacement of the product or damages for costs incurred as a result of the product failing to perform as guaranteed. We also could face other claims by our customers if our assets do not operate as expected by our customers or our services otherwise do not meet our customers’ expectations. A successful claim or series of claims against us could result in unforeseen expenditures and a loss of one or more customers.
We are exposed to counterparty credit risk. Nonpayment and nonperformance by our customers, vendors or derivative counterparties could reduce our revenues, increase our expenses and otherwise have a negative impact on our ability to conduct our business, our operating results, cash flows and ability to make distributions to our unitholders.We are subject to risks of loss resulting from nonpayment or nonperformance by our customers to whom we extend credit. In addition, nonperformance by vendors who have committed to provide us with critical products or services could raise our costs or interfere with our ability to successfully conduct our business. Furthermore, nonpayment by the counterparties to any of our outstanding derivatives could expose us to additional interest rate or commodity price risk. Weak economic conditions and widespread financial stress could reduce the liquidity of our customers, vendors or counterparties, making it more difficult for them to meet their obligations to us. Any substantial increase in the nonpayment and nonperformance by our customers, vendors or counterparties could have a material adverse effect on our results of operations, cash flows and ability to make distributions to unitholders.
Axeon’s failure to repay the Axeon Term Loan and any liability we incur as a result of the financing arrangements and guarantees of Axeon required by that loan could have a material and adverse impact on our financial condition, results of operations and cash flows and could adversely affect our ability to make quarterly distributions to our unitholders.In connection with our sale of NuStar Asphalt LLC (now known as Axeon), our operating subsidiary, NuStar Logistics, agreed to convert the revolving credit facility with Axeon into a $190 million term loan (the Axeon Term Loan). We also agreed to continue to provide credit support to Axeon in the form of guarantees, letters of credit and cash collateral of up to $150 million (the Credit Support) until February 26, 2016, at which point the amount of Credit Support will begin to decline until the obligation is terminated no later than September 28, 2019.
Axeon was scheduled to repay principal amounts under the Axeon Term Loan to reduce the principal amount outstanding to $175 million by December 31, 2014 and to $150 million by September 30, 2015, with repayment in full no later than September 28, 2019 and earlier repayment possible, depending on the amount of excess cash flows (if any) generated by

Table of Contents
21
Axeon. Any repayments of the Axeon Term Loan are subject to Axeon meeting certain restrictive requirements contained in its third-party asset-based revolving credit facility (ABL Facility). Axeon failed to make the scheduled principal payments by December 31, 2014 and September 30, 2015, respectively, increasing the interest rate payable by Axeon until Axeon makes the payments.
In the event that Axeon defaults on any of its obligations under the Axeon Term Loan, we would have available only those measures available to an unsecured creditor with the rights and limitations provided in the Axeon Term Loan, and, to the extent provided in the agreements, the ABL Facility lenders would be senior to those rights. In the event of a default on any of the obligations underlying the Credit Support, we would be responsible for Axeon’s liabilities for the default and have only the rights of repayment associated with that instrument. The default by Axeon of any of its obligations under the Axeon Term Loan or underlying the Credit Support may have an adverse impact on our financial condition, results of operations, cash flows and ability to pay distributions to our unitholders at current levels.
A failure in our computer systems or a cyber-attack on us or third parties with whom we have a relationship may adversely affect our operations and reputation.We rely on the use of technology to conduct our business. Our business is dependent upon our operational and financial computer systems to process the data necessary to conduct almost all aspects of our business, including operating our pipelines and storage facilities, recording and reporting commercial and financial transactions and receiving and making payments. Our systems and networks, as well as those of our customers, suppliers, vendors and counterparties, may become the target of cyber-attacks or information security breaches, which in turn could result in the unauthorized release and misuse of confidential and proprietary information as well as disrupt our operations, damage our facilities or those of third parties and harm our reputation. Any failure or disruption of our systems could have an adverse effect on our revenues and increase our operating and capital costs, which could reduce the amount of cash otherwise available for distributions. We also may be required to incur additional costs to modify or enhance our systems in order to try to prevent or remediate any such attacks.
Potential future acquisitions and expansions, if any, may increase substantially the level of our indebtedness and contingent liabilities or otherwise change our capital structure, and we may be unable to integrate acquisitions and expansions effectively into our existing operations.From time to time, we evaluate and acquire assets and businesses that we believe complement or diversify our existing assets and businesses. Acquisitions may require us to raise a substantial amount of equity or incur a substantial amount of indebtedness. If we consummate any future material acquisitions, our capitalization and results of operations may change significantly, and you will not have the opportunity to evaluate the economic, financial and other relevant information that we will consider in connection with any future acquisitions.
Acquisitions and business expansions involve numerous risks, including difficulties in the assimilation of the assets and operations of the acquired businesses, inefficiencies and difficulties that arise because of unfamiliarity with new assets and the businesses associated with them and new geographic areas. Further, unexpected costs and challenges may arise whenever businesses with different operations or management are combined. Successful business combinations will require our management and other personnel to devote significant amounts of time to integrating the acquired businesses with our existing operations. These efforts may temporarily distract their attention from day-to-day business, the development or acquisition of new properties and other business opportunities. If we do not successfully integrate any past or future acquisitions, or if there is any significant delay in achieving such integration, our business and financial condition could be adversely affected.
Moreover, part of our business strategy includes acquiring additional assets that complement our existing asset base and distribution capabilities or provide entry into new markets. We may not be able to identify suitable acquisitions, or we may not be able to purchase or finance any acquisitions on terms that we find acceptable. Additionally, we compete against other companies for acquisitions, and we may not be successful in the acquisition of any assets or businesses appropriate for our growth strategy.
We do not own all of the land on which our pipelines and facilities have been constructed, and we are therefore subject to the possibility of increased costs or the inability to retain necessary land use.We obtain the rights to construct and operate our pipelines, storage terminals and other facilities on land owned by third parties and governmental agencies. Many of these rights-of-way or other property rights are perpetual in duration while others are for a specific period of time. In addition, some of our facilities are located on leased premises. Our loss of these rights, through our inability to renew right-of-way contracts or leases or otherwise, could adversely affect our operations and cash flows available for distribution to unitholders.

Table of Contents
22
In addition, the construction of additions to our existing assets may require us to obtain new rights-of-way or property rights prior to construction. We may be unable to obtain such rights-of-way or other property rights to connect new supplies to our existing pipelines, storage terminals or other facilities or to capitalize on other attractive expansion opportunities. Additionally, it may become more expensive for us to obtain new rights-of-way or other property rights or to renew existing rights-of-way or property rights. If the cost of obtaining new or renewing existing rights-of-way or other property rights increases, it may adversely affect our operations and cash flows available for distribution to unitholders.
We may have liabilities from our assets that pre-exist our acquisition of those assets, but that may not be covered by indemnification rights we may have against the sellers of the assets.In some cases, we have indemnified the previous owners and operators of acquired assets. Some of our assets have been used for many years to transport and store crude oil and refined products. Releases may have occurred in the past that could require costly future remediation. If a significant release or event occurred in the past, the liability for which was not retained by the seller, or for which indemnification by the seller is not available, it could adversely affect our financial position and results of operations.
Climate change legislation and other regulatory initiatives may decrease demand for the products we store, transport and sell and increase our operating costs.Scientific studies have suggested that emissions of certain gases, commonly referred to as “greenhouse gases” and including carbon dioxide and methane, may be contributing to warming of the Earth’s atmosphere. In response to such studies, the U.S. Congress, European Union and other political bodies have considered legislation or regulation to reduce emissions of greenhouse gases. In December 2015, representatives from 195 countries, including the United States, met at the 2015 United Nations Climate Change Conference and adopted an accord wherein each country committed to take certain steps to reduce global carbon emissions. While adherence to the accord is voluntary and not currently binding on the United States, if the U.S. Congress adopts legislation implementing its provisions, this could have an adverse effect on demand for our products and increase our operating costs. In addition, several states and local governmental bodies, either individually or through multi-member initiatives, have already taken legal measures to reduce emissions of greenhouse gases, including through the development of greenhouse gas emission inventories and/or greenhouse gas cap and trade programs. As an alternative to reducing emission of greenhouse gases under cap and trade programs, governmental bodies may consider the implementation of a program to tax the emission of carbon dioxide and other greenhouse gases. Passage of climate change legislation or other regulatory initiatives in areas in which we conduct business, could result in changes to the demand for the products we store, transport and sell, and could increase the costs of our operations, including costs to operate and maintain our facilities, install new emission controls on our facilities, acquire allowances to authorize our greenhouse gas emissions, pay any taxes related to our greenhouse gas emissions or administer and manage a greenhouse gas emissions program. Even though we attempt to mitigate such lost revenues or increased costs through the contracts we sign with our customers, we may be unable to recover those revenues or mitigate the increased costs, and any such recovery may depend on events beyond our control, including the outcome of future rate proceedings before the FERC, the STB or other regulators and the provisions of any final legislation or regulations. Reductions in our revenues or increases in our expenses as a result of climate control or other initiatives could have adverse effects on our business, financial position, results of operations and prospects.
We operate a global business that exposes us to additional risk.We operate a global business and a significant portion of our revenues come from our business outside of the United States. Our operations outside the United States may be affected by changes in trade protection laws, policies and measures, and other regulatory requirements affecting trade and investment, including the Foreign Corrupt Practices Act, the United Kingdom Bribery Act and other foreign laws prohibiting corrupt payments, as well as import and export regulations. We have assets in certain emerging markets, and the developing nature of these markets presents a number of risks. Deterioration of social, political, labor or economic conditions, including the increasing threat of drug cartels, in a specific country or region and difficulties in staffing and managing foreign operations may also adversely affect our operations or financial results.
Our operations are subject to federal, state and local laws and regulations, in the U.S. and in the foreign countries in which we operate, relating to environmental protection and operational safety that could require us to make substantial expenditures.Our operations are subject to increasingly stringent environmental, health and safety laws and regulations. Transporting, storing and distributing products, including petroleum products, produces a risk that these products may be released into the environment, potentially causing substantial expenditures for a response action, significant government penalties, liability to government agencies for damages to natural resources, personal injury or property damages to private parties and significant business interruption. We own or lease a number of properties that have been used to transport, store or distribute products for many years. Many of these properties were operated by third parties whose handling, disposal or release of products and wastes was not under our control.

Table of Contents
23
If we were to incur a significant liability pursuant to environmental, health or safety laws or regulations, such a liability could have a material adverse effect on our financial position, our ability to make distributions to our unitholders at current levels and our ability to meet our debt service requirements. Please read Item 3. “Legal Proceedings” and Note 15 of the Notes to Consolidated Financial Statements in Item 8. “Financial Statements and Supplementary Data.”
Our interstate common carrier pipelines are subject to regulation by the FERC.The FERC regulates the tariff rates and terms and conditions of service for interstate oil movements on our common carrier pipelines. FERC regulations require that these rates must be just and reasonable and that the pipeline not engage in undue discrimination or undue preference with respect to any shipper. Under the ICA, FERC or shippers may challenge our pipeline tariff filings, including rates and terms and conditions of service. Further, other than for rates set under market-based rate authority, if a new rate is challenged by protest and investigated by the FERC, the FERC may suspend collection of such new rate for up to seven months. If such new rate is found to be unjust and unreasonable, the FERC may order refunds of amounts collected in excess of amounts generated by the just and reasonable rate determined by FERC. A successful rate challenge could result in a common carrier paying refunds together with interest for the period that the rate was in effect. In addition, shippers may challenge by complaint tariff rates and terms and conditions of service even after the rates and terms and conditions of service are in effect. If the FERC, in response to such a complaint or on its own initiative, initiates an investigation of rates that are already in effect, the FERC may order a carrier to change its rates prospectively. If existing rates are challenged and are determined by the FERC to be in excess of a just and reasonable level, a shipper may obtain reparations for damages sustained during the two years prior to the date the shipper filed a complaint.
We use various FERC-authorized rate change methodologies for our interstate pipelines, including indexing, cost-of-service rates, market-based rates and settlement rates. Typically, we adjust our rates annually in accordance with FERC indexing methodology, which currently allows a pipeline to change their rates within prescribed ceiling levels that are tied to an inflation index. For the five-year period beginning July 1, 2011, the index is measured by the year-over-year change in the Bureau of Labor’s producer price index for finished goods, plus 2.65%. For the five-year period beginning July 1, 2016, the index is measured by the year-over-year change in the Bureau of Labor’s producer price index for finished goods, plus 1.23%. We anticipate that the oil pipeline index for the five-year period beginning July 1, 2016 may be subject to further review by FERC. Some of our newer projects that involved an open season include negotiated indexation rate caps. These methodologies could result in changes in our revenue that do not fully reflect changes in costs we incur to operate and maintain our pipelines. For example, our costs could increase more quickly or by a greater amount than the negotiated indexation rate cap. Shippers may protest rate increases made within the ceiling levels, but such protests must show that the portion of the rate increase resulting from application of the index is substantially in excess of the pipeline’s change in costs from the previous year. However, if the index results in a negative adjustment, we are required to reduce any rates that exceed the new maximum allowable rate. In addition, changes in the index might not be large enough to fully reflect actual increases in our costs. If the FERC’s rate-making methodologies change, any such change or new methodologies could result in rates that generate lower revenues and cash flow and could adversely affect our ability to make distributions at current levels to our unitholders and to meet our debt service requirements. Additionally, competition constrains our rates in various markets. As a result, we may from time to time be forced to reduce some of our rates to remain competitive.
Changes to FERC rate-making principles could have an adverse impact on our ability to recover the full cost of operating our pipeline facilities and our ability to make distributions at current levels to our unitholders.In May 2005, the FERC issued a statement of general policy stating it will permit pipelines to include in cost of service a tax allowance to reflect actual or potential tax liability on their public utility income attributable to all partnership or limited liability company interests, if the ultimate owner of the interest has an actual or potential income tax liability on such income. Whether a pipeline’s owners have such actual or potential income tax liability will be reviewed by the FERC on a case-by-case basis. Although this policy is generally favorable for pipelines that are organized as pass-through entities, it still entails rate risk due to the case-by-case review requirement. This tax allowance policy and the FERC’s application of that policy were appealed to the United States Court of Appeals for the District of Columbia Circuit (D.C. Circuit), and on May 29, 2007, the D.C. Circuit issued an opinion upholding the FERC’s tax allowance policy.
In two proceedings involving SFPP, L.P., a refined products pipeline system, shippers again challenged the FERC’s income tax allowance policy, alleging that it is unlawful for a pipeline organized as a tax-pass-through entity to be afforded an income tax allowance and that the income tax allowance is unnecessary because an allowance for income taxes for such pipelines is recovered indirectly through the rate of return on equity. The FERC rejected these shipper arguments in multiple orders. Petitions for review of FERC’s rulings on the income tax allowance have been filed with the D.C. Circuit. Because the extent to which an interstate oil pipeline is entitled to an income tax allowance is subject to a case-by-case review at the FERC and is a matter under litigation, the level of income tax allowance to which we would ultimately be entitled in a cost-of-service rate review is not certain. Although the FERC’s current income tax allowance policy is generally favorable for pipelines that are organized as pass-through entities, it still entails rate risks due to the case-by-case review requirement and the above-noted

Table of Contents
24
pending litigation. How the FERC’s income tax allowance policy is applied in practice to pipelines owned by publicly traded partnerships could impose limits on our ability to include a full income tax allowance in cost of service.
The rates that we may charge on our interstate ammonia pipeline are subject to regulation by the STB.The Ammonia Pipeline is subject to regulation under the ICA by the STB. Under that regulation the Ammonia Pipeline’s rates, classifications, rules and practices related to the interstate transportation of anhydrous ammonia must be reasonable and, in providing interstate transportation, our ammonia pipeline may not subject a person, place, port or type of traffic to unreasonable discrimination.
Increases in natural gas and power prices could adversely affect our operating expenses and our ability to make distributions at current levels to our unitholders.Power costs constitute a significant portion of our operating expenses. For the year ended December 31, 2015, our power costs equaled approximately $44.9 million, or 9.5% of our operating expenses for the year. We use mainly electric power at our pipeline pump stations and terminals, and such electric power is furnished by various utility companies that primarily use natural gas to generate electricity. Accordingly, our power costs typically fluctuate with natural gas prices. Increases in natural gas prices may cause our power costs to increase further. If natural gas prices increase, our cash flows may be adversely affected, which could adversely affect our ability to make distributions at current levels to our unitholders.
Terrorist attacks and the threat of terrorist attacks have resulted in increased costs to our business. Continued hostilities in the Middle East or other sustained military campaigns may adversely impact our results of operations.Increased security measures we have taken as a precaution against possible terrorist attacks have resulted in increased costs to our business. Uncertainty surrounding continued hostilities in the Middle East or other sustained military campaigns may affect our operations in unpredictable ways, including disruptions of crude oil supplies and markets for refined products, and the possibility that infrastructure facilities could be direct targets of, or indirect casualties of, an act of terror or instability in the financial markets that could restrict our ability to raise capital.
Our cash distribution policy may limit our growth.Consistent with the terms of our partnership agreement, we distribute our available cash to our unitholders each quarter. In determining the amount of cash available for distribution, our management sets aside cash reserves, which we use to fund our growth capital expenditures. Additionally, we historically have relied upon external financing sources, including commercial borrowings and other debt and equity issuances, to fund our acquisition capital expenditures. Accordingly, to the extent we do not have sufficient cash reserves or are unable to finance growth externally, our cash distribution policy will significantly impair our ability to grow. In addition, to the extent we issue additional units in connection with any acquisitions or growth capital expenditures, the payment of distributions on those additional units may increase the risk that we will be unable to maintain or increase our current per unit distribution level.
Our purchase and sale of crude oil and petroleum products may expose us to trading losses and hedging losses, and non-compliance with our risk management policies could result in significant financial losses.Our marketing and trading of crude oil and petroleum products expose us to commodity price volatility risk for the purchase and sale of crude oil and petroleum products, including distillates and fuel oil. We attempt to mitigate this volatility risk through hedging, but we are still exposed to basis risk. In addition, we may be required to post cash collateral under our hedging arrangements. We also may be exposed to inventory and financial liquidity risk due to the inability to trade certain products or rising costs of carrying some inventories. Further, our marketing and trading activities, including any hedging activities, may cause volatility in our earnings. In addition, we will be exposed to credit risk in the event of non-performance by counterparties.
Our risk management policies may not eliminate all price risk since open trading positions will expose us to price volatility. Further, there is a risk that our risk management policies will not be complied with. Although we have designed procedures to anticipate and detect non-compliance, we cannot assure you that these steps will detect and prevent all violations of our trading policies and procedures, particularly if deception and other intentional misconduct are involved.
As a result of the risks described above, the activities associated with our marketing and trading business may expose us to volatility in earnings and financial losses, which may adversely affect our financial condition and our ability to make our quarterly distributions to our unitholders.

Table of Contents
25
Hedging transactions may limit our potential gains or result in significant financial losses.While intended to reduce the effects of volatile commodity prices, hedging transactions, depending on the hedging instrument used, may limit our potential gains if petroleum product prices were to rise substantially over the price established by the hedge. In addition, such transactions may expose us to the risk of financial loss in certain circumstances, including instances in which:
• the counterparties to our futures contracts fail to perform under the contracts; or• there is a change in the expected differential between the underlying price in the hedging agreement and the actual
prices received.
The accounting standards regarding hedge accounting are complex and, even when we engage in hedging transactions that are effective economically, these transactions may not be considered effective for accounting purposes. Accordingly, our financial statements will reflect increased volatility due to these hedges, even when there is no underlying economic impact at that point. In addition, it is not possible for us to engage in a hedging transaction that completely mitigates our exposure to commodity prices. Our financial statements may reflect a gain or loss arising from an exposure to commodity prices for which we are unable to enter into an effective hedge.
If we fail to maintain an effective system of internal controls, we may not be able to report our financial results accurately or prevent fraud, which could have a material and adverse impact on our financial condition, results of operations, and cash flows and our ability to make distributions to our unitholders.We are required to disclose material changes made in our internal controls over financial reporting on a quarterly basis and we are required to assess the effectiveness of our controls annually. Effective internal controls are necessary for us to provide reliable and timely financial reports, to prevent fraud, and to operate successfully as a publicly traded limited partnership. We may be unable to maintain effective controls over our financial processes and reporting in the future or to comply with our obligations under Section 404 of the Sarbanes-Oxley Act of 2002. For example, Section 404 requires us, among other things, annually to review and report on the effectiveness of our internal control over financial reporting. Any failure to maintain effective internal controls or to improve our internal controls could harm our operating results or cause us to fail to meet our reporting obligations.
Given the difficulties inherent in the design and operation of internal controls over financial reporting, we can provide no assurance as to our, or our independent registered public accounting firm’s, future conclusions about the effectiveness of our internal controls, and we may incur significant costs in our efforts to comply with Section 404. Any failure to maintain effective internal controls over financial reporting will subject us to regulatory scrutiny and a loss of confidence in our reported financial information, which could have a material adverse effect on our financial condition, results of operations and cash flows and our ability to make distributions to our unitholders.
NuStar GP Holdings may have conflicts of interest and limited fiduciary responsibilities, which may permit it to favor its own interests to the detriment of our unitholders.NuStar GP Holdings currently indirectly owns our general partner and, as of December 31, 2015, an aggregate 12.9% limited partner interest in us out of the total possible ownership. Conflicts of interest may arise between NuStar GP Holdings and its affiliates, including our general partner, on the one hand, and us and our limited partners, on the other hand. As a result of these conflicts, the general partner may favor its own interests and the interests of its affiliates over the interests of our unitholders. These conflicts include, among others, the following situations:
• our general partner is allowed to take into account the interests of parties other than us, such as NuStar GP Holdings, in resolving conflicts of interest, which has the effect of limiting its fiduciary duty to the unitholders;
• our general partner may limit its liability and reduce its fiduciary duties, while also restricting the remedies available to unitholders. As a result of purchasing our common units, unitholders have consented to some actions and conflicts of interest that might otherwise constitute a breach of fiduciary or other duties under applicable state law;
• our general partner determines the amount and timing of asset purchases and sales, capital expenditures, borrowings, issuance of additional limited partner interests and reserves, each of which can affect the amount of cash that is paid to our unitholders;
• our general partner determines in its sole discretion which costs incurred by NuStar GP Holdings and its affiliates are reimbursable by us;
• our general partner may cause us to pay the general partner or its affiliates for any services rendered on terms that are fair and reasonable to us or enter into additional contractual arrangements with any of these entities on our behalf;
• our general partner decides whether to retain separate counsel, accountants or others to perform services for us; and

Table of Contents
26
• in some instances, our general partner may cause us to borrow funds in order to permit the payment of distributions.
Our partnership agreement gives the general partner broad discretion in establishing financial reserves for the proper conduct of our business, including interest payments. These reserves also will affect the amount of cash available for distribution.
The general partner interest, the control of our general partner and the incentive distribution rights of our general partner may be transferred to a third party without unitholder consent.Our general partner may transfer its general partner interest to a third party in a merger or in a sale of all or substantially all of its assets without the consent of our unitholders. Furthermore, the general partner may transfer its general partnership interest to a third party without the consent of our unitholders. Any new owner of our general partner would be in a position to replace the officers of the general partner with its own choices and to control the decisions made by such officers.
Additionally, our general partner may transfer its incentive distribution rights to a third party at any time without the consent of our unitholders. If our general partner transfers its incentive distribution rights to a third party but retains its general partner interest, our general partner may not have the same incentive to grow our partnership and increase quarterly distributions to unitholders over time as it would if it had retained ownership of its incentive distribution rights.
We may issue an unlimited number of additional units, which will dilute existing interests of unitholders and may increase the risk that we will be unable to maintain or increase our per unit distribution level.Our partnership agreement allows us to issue additional units and certain other equity securities on the terms and conditions established by our general partner and without the approval of other unitholders. There is no limit on the total number of units and other equity securities we may issue. If we issue additional units or other equity securities, the proportionate partnership interest of our existing common unitholders and the relative voting strength of the previously outstanding common units will decrease. Any additional issuance may increase the risk that we will be unable to maintain or increase our per unit distribution level and may negatively affect the market price of the units.
Unitholders may not have limited liability if a court finds that unitholder action constitutes control of our business or that we have not complied with applicable statutes, which may have an impact on the cash we have available to make distributions.Under Delaware law, unitholders could be held liable for our obligations to the same extent as a general partner if a court determined that actions of a unitholder constituted participation in the “control” of our business.
Under Delaware law, the general partner generally has unlimited liability for the obligations of the partnership, such as its debts and environmental liabilities, except for those contractual obligations of the partnership that are expressly made without recourse to the general partner. In addition, Section 17-607 of the Delaware Revised Uniform Limited Partnership Act (the Delaware Act) provides that, under some circumstances, a limited partner may be liable to us for the amount of a distribution for a period of three years from the date of the distribution.
Unitholders may have liability to repay distributions.Under certain circumstances, our unitholders may have to repay amounts wrongfully returned or distributed to them. Under Section 17-607 of the Delaware Act, we may not make a distribution to our unitholders if the distribution would cause our liabilities to exceed the fair value of our assets. Liabilities to partners on account of their partnership interests and liabilities that are nonrecourse to the partnership are not counted for purposes of determining whether a distribution is permitted.
Delaware law provides that, for a period of three years from the date of an impermissible distribution, limited partners who received the distribution and who knew at the time of the distribution that it violated Delaware law will be liable to us for the repayment of the distribution amount. Likewise, upon the winding up of our partnership, in the event that (a) we do not distribute assets in the following order: (1) to creditors in satisfaction of their liabilities; (2) to partners and former partners in satisfaction of liabilities for distributions owed under our partnership agreement; (3) to partners for the return of their contributions; and finally (4) to the partners in the proportions in which the partners share in distributions and (b) a limited partner knows at the time that the distribution violated the Delaware Act, then such limited partner will be liable to repay the distribution for a period of three years from the impermissible distribution under Section 17-804 of the Delaware Act.
A purchaser of common units becomes a limited partner and is liable for the obligations of the transferring limited partner to make contributions to us that are known to such purchaser of common units at the time it became a limited partner and for unknown obligations, if the liabilities could be determined from our partnership agreement.

Table of Contents
27
Unitholders may be required to sell their units to our general partner at an undesirable time or price.If at any time less than 20% of the outstanding units of any class are held by persons other than the general partner and its affiliates, the general partner will have the right to acquire all, but not less than all, of those units at a price no less than their then-current market price. As a consequence, a unitholder may be required to sell his common units at an undesirable time or price. The general partner may assign this purchase right to any of its affiliates or to us.
The NYSE does not require a publicly traded limited partnership like us to comply with certain of its corporate governance requirements.We currently list our common units on the NYSE under the symbol “NS.” Although our general partner has maintained a majority of independent directors on its board and all members of its board’s audit committee, compensation committee and nominating/governance & conflicts committee are independent directors, because we are a publicly traded limited partnership, the NYSE does not require us to have a majority of independent directors on our general partner’s board of directors or to have a compensation committee or a nominating committee consisting of independent directors. Additionally, any future issuance of additional common units or other securities, including to affiliates, will not be subject to the NYSE’s shareholder approval rules that apply to a corporation. Accordingly, the NYSE does not mandate the same protections for our unitholders as are required for certain corporations that are subject to all of the NYSE corporate governance requirements. See “Director Independence” under Item 13 of this annual report on Form 10-K for additional information regarding the independence of our general partner’s directors and the committees of our general partner’s board.
TAX RISKS TO OUR UNITHOLDERS
If we were treated as a corporation for federal or state income tax purposes or we were otherwise subject to a material amount of entity-level taxation, then our cash available for distribution to unitholders would be substantially reduced.The anticipated after-tax benefit of an investment in our units depends largely on our being treated as a partnership for federal income tax purposes. We have not requested, and do not plan to request, a ruling from the Internal Revenue Service (the IRS) on this matter.
Despite the fact that we are a limited partnership under Delaware law, we will be treated as a corporation for federal income tax purposes unless we satisfy a “qualifying income” requirement. Based upon our current operations, we believe we satisfy the qualifying income requirement. Failing to meet the qualifying income requirement or a change in current law could cause us to be treated as a corporation for federal income tax purposes or otherwise subject us to taxation as an entity.
If we were treated as a corporation for federal income tax purposes, we would pay federal income tax on our taxable income at the corporate tax rate, which is currently a maximum of 35%, and would likely pay state and local income tax at varying rates. Distributions to unitholders would generally be taxed again as corporate dividends (to the extent of our current and accumulated earnings and profits), and no income, gains, losses, deductions or credits would flow through to unitholders. Because a tax would be imposed upon us as a corporation, our distributable cash flow would be substantially reduced.
In addition, recently enacted legislation applicable to partnership tax years beginning after 2017 changes the audit procedures for large partnerships and, in certain circumstances, would permit the IRS to assess and collect taxes (including any applicable penalties and interest) resulting from partnership-level federal income tax audits directly from us in the year in which the audit is completed. If we are required to make payments of taxes, penalties and interest resulting from audit adjustments, our cash available for distribution to our unitholders might be substantially reduced.
Moreover, changes in current state law may subject us to entity-level taxation by individual states. Because of widespread state budget deficits and other reasons, several states are evaluating ways to subject partnerships to entity-level taxation through the imposition of state income, franchise and other forms of taxation. Imposition of any such taxes or an increase in the existing tax rates would substantially reduce the cash available for distribution to our unitholders. Therefore, if we were treated as a corporation for federal income tax purposes or otherwise subjected to a material amount of entity-level taxation, there would be a material reduction in the anticipated cash flow and after-tax return to our unitholders, likely causing a substantial reduction in the value of our common units.

Table of Contents
28
The tax treatment of publicly traded partnerships or an investment in our units could be subject to potential legislative, judicial or administrative changes or differing interpretations, possibly applied on a retroactive basis.The present U.S. federal income tax treatment of publicly traded partnerships, including us, or an investment in our common units may be modified by administrative, legislative or judicial changes or differing interpretations at any time. From time to time, members of Congress propose and consider such substantive changes to the existing federal income tax laws that affect publicly traded partnerships. Further, the U.S. Treasury Department and the IRS issued proposed regulations regarding qualifying income within the meaning of Section 7704 of the Code (the “Proposed Regulations”). We believe the income that we treat as qualifying income satisfies the requirements for qualifying income under the Proposed Regulations. However, the Proposed Regulations could be changed before they are finalized and could take a position that is contrary to our interpretation of Section 7704 of the Code.
Any modification to the federal income tax laws may be applied retroactively and could make it more difficult or impossible for us to meet the exception for certain publicly traded partnerships to be treated as partnerships for federal income tax purposes. We are unable to predict whether any of these changes or other proposals will ultimately be enacted. Any such changes could negatively impact the value of an investment in our common units.
A successful IRS contest of the federal income tax positions we take may adversely impact the market for our units, and the costs of any contest will reduce cash available for distribution to our unitholders.The IRS may adopt positions that differ from the positions we take, even positions taken with the advice of counsel. It may be necessary to resort to administrative or court proceedings to sustain some or all of the positions we take. A court may not agree with all of the positions we take. Any contest with the IRS may materially and adversely impact the market for our units and the prices at which they trade. Moreover, recently enacted legislation applicable to partnership tax years beginning after 2017 changes the audit procedures for large partnerships and, in certain circumstances, would permit the IRS to assess and collect taxes (including any applicable penalties and interest) resulting from partnership-level federal income tax audits directly from us in the year in which the audit is completed. If we are required to make payments of taxes, penalties and interest resulting from audit adjustments, our cash available for distribution to our unitholders might be substantially reduced. In addition, the costs of any contest between us and the IRS will result in a reduction in cash available for distribution to our unitholders and thus will be borne indirectly by our unitholders and our general partner.
Even if unitholders do not receive any cash distributions from us, they will be required to pay taxes on their respective share of our taxable income.Unitholders will be required to pay federal income taxes and, in some cases, state and local income taxes on their respective share of our taxable income, whether or not the unitholders receive cash distributions from us. Unitholders may not receive cash distributions from us equal to their respective share of our taxable income or even equal to the actual tax liability that results from their respective share of our taxable income.
The sale or exchange of 50% or more of our capital and profits interests, within a twelve-month period, will result in the termination of our partnership for federal income tax purposes.We will be considered to have terminated for federal income tax purposes if there is a sale or exchange of 50% or more of the total interests in our capital and profits within a twelve-month period. For purposes of determining whether the 50% threshold has been met, multiple sales of the same interest will be counted only once.
Our termination for federal income tax purposes would, among other things, result in the closing of our taxable year for all unitholders, which would result in us filing two tax returns for one calendar year and could result in a significant deferral of depreciation deductions allowable in computing our taxable income. In the case of a unitholder reporting on a taxable year other than a calendar year, the closing of our taxable year may also result in more than twelve months of our taxable income or loss being includable in taxable income for the unitholder’s taxable year that includes our termination. Our termination would not affect our classification as a partnership for federal income tax purposes, but it would result in our being treated as a new partnership for U.S. federal income tax purposes following the termination. If we were treated as a new partnership, we would be required to make new tax elections and could be subject to penalties if we were unable to determine that a termination occurred. The IRS has announced a relief procedure whereby if a publicly traded partnership that has technically terminated requests, and the IRS grants, special relief, among other things, the partnership may be permitted to provide only a single Schedule K-1 to unitholders for the two short tax periods included in the year in which the termination occurs.
Tax gain or loss on the disposition of our units could be different than expected.If a unitholder sells units, the selling unitholder will recognize a gain or loss equal to the difference between the amount realized and the unitholder’s tax basis in those units. Prior distributions to the selling unitholder in excess of the total net taxable income the unitholder was allocated for a unit, which decreased the unitholder’s tax basis in that unit, will, in effect, become taxable income to the selling unitholder if the unit is sold at a price greater than the unitholder’s tax basis in that unit,

Table of Contents
29
even if the price the unitholder receives is less than the unit’s original cost. A substantial portion of the amount realized, whether or not representing gain, may be ordinary income to the selling unitholder.
Tax-exempt entities and foreign persons face unique tax issues from owning units that may result in adverse tax consequences to them.Investment in units by tax-exempt entities, such as individual retirement accounts (known as IRAs) and non-United States persons raises issues unique to them. For example, virtually all of our income allocated to organizations exempt from federal income tax, including individual retirement accounts and other retirement plans, will be unrelated business taxable income and will be taxable to them. Distributions to non-United States persons will be reduced by withholding taxes at the highest applicable effective tax rate, and non-United States persons will be required to file United States federal income tax returns and pay tax on their share of our taxable income.
We will treat each purchaser of our units as having the same tax benefits without regard to the units purchased. The IRS may challenge this treatment, which could adversely affect the value of our units.Because we cannot match transferors and transferees of units, we will adopt depreciation and amortization positions that may not conform with all aspects of existing Treasury regulations. A successful IRS challenge to those positions could adversely affect the amount of tax benefits available to unitholders. It also could affect the timing of these tax benefits or the amount of gain from a unitholder’s sale of units and could have a negative impact on the value of our units or result in audit adjustments to the unitholder’s tax returns.
Unitholders will likely be subject to state and local taxes and return filing requirements as a result of investing in our units.In addition to federal income taxes, unitholders will likely be subject to other taxes, such as state and local income taxes, unincorporated business taxes and estate, inheritance or intangible taxes that are imposed by the various jurisdictions in which we do business or own property. Unitholders will likely be required to file state and local income tax returns and pay state and local income taxes in some or all of these various jurisdictions. Further, unitholders may be subject to penalties for failure to comply with those requirements. We may own property or conduct business in other states or foreign countries in the future. It is each unitholder’s responsibility to file all federal, state and local tax returns.
We prorate our items of income, gain, loss and deduction between transferors and transferees of our units each month based upon the ownership of our units on the first day of each month, instead of on the basis of the date a particular unit is transferred. The IRS may challenge this treatment, which could change the allocation of items of income, gain, loss and deduction among our unitholders.We prorate our items of income, gain, loss and deduction between transferors and transferees of our units each month based upon the ownership of our units on the first day of each month, instead of on the basis of the date a particular unit is transferred. The U.S. Treasury Department and the IRS recently issued final regulations pursuant to which a publicly traded partnership may use a similar monthly simplifying convention to allocate tax items among transferor and transferee unitholders, although such tax items must be prorated on a daily basis. Certain publicly traded partnerships, including us, may, but are not required to, apply the conventions provided by the final regulations. However, such regulations do not specifically authorize the use of the proration method we have currently adopted. If the IRS were to challenge our proration method, we may be required to change the allocation of items of income, gain, loss and deduction among our unitholders.
We have adopted certain valuation methodologies that may result in a shift of income, gain, loss and deduction between the general partner and the unitholders. The IRS may challenge this treatment, which could adversely affect the value of our common units.When we issue additional units or engage in certain other transactions, we determine the fair market value of our assets and allocate any unrealized gain or loss attributable to our assets to the capital accounts of our unitholders and our general partner. Our methodology may be viewed as understating the value of our assets. In that case, there may be a shift of income, gain, loss and deduction between certain unitholders and the general partner, which may be unfavorable to such unitholders. Moreover, under our current valuation methods, subsequent purchasers of common units may have a greater portion of their Internal Revenue Code Section 743(b) adjustment allocated to our tangible assets and a lesser portion allocated to our intangible assets. The IRS may challenge our valuation methods, our allocation of the Section 743(b) adjustment attributable to our tangible and intangible assets, and allocations of income, gain, loss and deduction between the general partner and certain of our unitholders.
A successful IRS challenge to these methods or allocations could adversely affect the amount of taxable income or loss being allocated to our unitholders. It also could affect the amount of gain from our unitholders’ sale of common units and could have a negative impact on the value of the common units or result in audit adjustments to our unitholders’ tax returns without the benefit of additional deductions.

Table of Contents
30
A unitholder whose units are the subject of a securities loan (e.g., a loan to a “short seller” to cover a short sale of units) may be considered as having disposed of those units. If so, the unitholder would no longer be treated for tax purposes as a partner with respect to those units during the period of the loan and may recognize gain or loss from the disposition.Because there are no specific rules governing the federal income tax consequences of loaning a partnership interest, a unitholder whose units are the subject of a securities loan may be considered as having disposed of the loaned units. In that case, the unitholder may no longer be treated for tax purposes as a partner with respect to those units during the period of the loan to the short seller and the unitholder may recognize gain or loss from such disposition. Moreover, during the period of the loan, any of our income, gain, loss or deduction with respect to those units may not be reportable by the unitholder and any cash distributions received by the unitholder as to those units could be fully taxable as ordinary income. Unitholders desiring to assure their status as partners and avoid the risk of gain recognition from a loan to a short seller are urged to consult a tax advisor to discuss whether it is advisable to modify any applicable brokerage account agreements to prohibit their brokers from borrowing their units.
PROPERTIES
Our principal properties are described above under the caption “Segments,” and that information is incorporated herein by reference. We believe that we have satisfactory title to all of our assets. Although title to these properties is subject to encumbrances in some cases, such as customary interests generally retained in connection with the acquisition of real property, liens for current taxes and other burdens and easements, and restrictions or other encumbrances, including those related to environmental liabilities associated with historical operations, to which the underlying properties were subject at the time of acquisition by us or our predecessors, we believe that none of these burdens will materially detract from the value of these properties or from our interest in these properties or will materially interfere with their use in the operation of our business. In addition, we believe that we have obtained sufficient right-of-way grants and permits from public authorities and private parties for us to operate our business in all material respects as described in this report. We perform scheduled maintenance on all of our pipelines, terminals, crude oil tanks and related equipment and make repairs and replacements when necessary or appropriate. We believe that our pipelines, terminals, crude oil tanks and related equipment have been constructed and are maintained in all material respects in accordance with applicable federal, state and local laws and the regulations and standards prescribed by the American Petroleum Institute, the DOT and accepted industry practice.
ITEM 1B. UNRESOLVED STAFF COMMENTS
None.
ITEM 3. LEGAL PROCEEDINGS
We are named as a defendant in litigation and are a party to other claims and legal proceedings relating to our normal business operations, including regulatory and environmental matters. Due to the inherent uncertainty of litigation, there can be no assurance that the resolution of any particular claim or proceeding would not have a material adverse effect on our results of operations, financial position or liquidity.
We are insured against various business risks to the extent we believe is prudent; however, we cannot assure you that the nature and amount of such insurance will be adequate, in every case, to protect us against liabilities arising from future legal proceedings as a result of our ordinary business activity. ENVIRONMENTAL AND SAFETY COMPLIANCE MATTERS
With respect to the environmental proceeding listed below, if it was decided against us, we believe that it would not have a material effect on our consolidated financial position. However, it is not possible to predict the ultimate outcome of the proceeding or whether such ultimate outcome may have a material effect on our consolidated financial position. We are reporting this proceeding to comply with SEC regulations, including those which require us to disclose proceedings arising under federal, state or local provisions regulating the discharge of materials into the environment or primarily for the purpose of protecting the environment if a governmental authority is a party to the proceeding and we reasonably believe that such proceedings will result in monetary sanctions of $100,000 or more.
In particular, our wholly owned subsidiary, Shore Terminals LLC (Shore), owns a refined product terminal in Portland, Oregon located adjacent to the Portland Harbor. The EPA has classified portions of the Portland Harbor, including the portion adjacent to our terminal, as a federal “Superfund” site due to sediment contamination (the Portland Harbor Site). Portland Harbor is contaminated with metals (such as mercury), pesticides, herbicides, polynuclear aromatic hydrocarbons, polychlorinated biphenyls, semi-volatile organics, dioxin/furans and other pollutants. Shore and more than 90 other parties have received a

Table of Contents
31
“General Notice” of potential liability from the EPA relating to the Portland Harbor Site. The letter advised Shore that it may be liable for the costs of investigation and remediation (which liability may be joint and several with other potentially responsible parties), as well as for natural resource damages resulting from releases of hazardous substances to the Portland Harbor Site. We have agreed to work with more than 90 other potentially responsible parties to attempt to negotiate an agreed method of allocating costs associated with the clean-up. The precise nature and extent of any clean-up of the Portland Harbor Site, the parties to be involved, the process to be followed for any clean-up and the allocation of any costs for the clean-up among responsible parties have not yet been determined. It is unclear to what extent, if any, we will be liable for environmental costs or damages associated with the Portland Harbor Site. It is also unclear if and to what extent natural resource damage claims or third party contribution or damage claims will be asserted against Shore.
ITEM 4. MINE SAFETY DISCLOSURES
Not applicable.

Table of Contents
32
PART II
ITEM 5. MARKET FOR REGISTRANT’S COMMON UNITS, RELATED UNITHOLDER MATTERS AND ISSUER PURCHASES OF COMMON UNITS
Our common units are listed and traded on the New York Stock Exchange under the symbol “NS.” At the close of business on February 8, 2016, we had 535 holders of record of our common units. The high and low sales prices (composite transactions) by quarter for the years ended December 31, 2015 and 2014 were as follows:
Price Range of Common Unit
High Low
Year 20154th Quarter $ 52.24 $ 31.203rd Quarter $ 60.48 $ 42.002nd Quarter $ 68.10 $ 58.811st Quarter $ 63.78 $ 54.58
Year 20144th Quarter $ 66.94 $ 50.913rd Quarter $ 68.33 $ 61.022nd Quarter $ 62.88 $ 53.761st Quarter $ 55.15 $ 47.51
Our partnership agreement requires that we distribute all “Available Cash” to our partners each quarter, and this term is defined in the partnership agreement as cash on hand at the end of the quarter, plus certain permitted borrowings made subsequent to the end of the quarter, less cash reserves determined by our board of directors. See Item 7. “Management’s Discussion and Analysis of Financial Condition and Results of Operations” for further information regarding our sources of cash to fund distributions. The cash distributions applicable to each of the quarters in the years ended December 31, 2015 and 2014 were as follows:
Record Date Payment DateAmountPer Unit
Year 20154th Quarter February 8, 2016 February 12, 2016 $ 1.0953rd Quarter November 9, 2015 November 13, 2015 $ 1.0952nd Quarter August 7, 2015 August 13, 2015 $ 1.0951st Quarter May 8, 2015 May 14, 2015 $ 1.095
Year 20144th Quarter February 9, 2015 February 13, 2015 $ 1.0953rd Quarter November 10, 2014 November 14, 2014 $ 1.0952nd Quarter August 6, 2014 August 11, 2014 $ 1.0951st Quarter May 7, 2014 May 12, 2014 $ 1.095
Our general partner is entitled to incentive distributions if the amount that we distribute with respect to any quarter exceeds specified target levels shown below:
Percentage of Distribution
Quarterly Distribution Amount per Unit Unitholders General Partner
Up to $0.60 98% 2%Above $0.60 up to $0.66 90% 10%Above $0.66 75% 25%

Table of Contents
33
Our general partner’s incentive distributions totaled $43.2 million for each of the years ended December 31, 2015 and 2014. The general partner’s share of our distributions for the years ended December 31, 2015 and 2014 was 13.0% in each year due to the impact of the incentive distributions.
The following table sets forth the purchases of our common units made during the quarter ended December 31, 2015 by or on behalf of us or an affiliated purchaser:
Period
Total Number of Units
Purchased(1)
Average Price Paid per Unit(1)
Total Number ofUnits Purchased as
Part of PubliclyAnnounced Plans or
Programs
Maximum Number (orApproximate Dollar
Value) of Units that MayYet Be Purchased Underthe Plans or Programs
October 1 through October 31 — $ — — $ —November 1 through November 30 — — — —December 1 through December 31 30,000 34.20 — —Total 30,000 $ 34.20 — $ —
(1) During the quarter ended December 31, 2015, NuStar GP, LLC, the general partner of our general partner, purchased 30,000 of our common units in the open market to satisfy NuStar GP, LLC’s obligations under its long-term incentive plans.
ITEM 6. SELECTED FINANCIAL DATA
The following table contains selected financial data derived from our audited financial statements.
Year Ended December 31, 2015 2014 2013 (a) 2012 (a) 2011
(Thousands of Dollars, Except Per Unit Data)
Statement of Income Data:Revenues (b) $ 2,084,040 $ 3,075,118 $ 3,463,732 $ 5,945,736 $ 6,257,629Operating income (loss) 390,704 346,901 (19,121) (18,168) 310,883Income (loss) from continuing operations 305,946 214,169 (185,509) (166,001) 218,674Income (loss) from continuing operations per
unit applicable to limited partners 3.29 2.14 (2.89) (2.79) 2.74Cash distributions per unit applicable to
limited partners 4.380 4.380 4.380 4.380 4.360
December 31, 2015 2014 2013 2012 2011
(Thousands of Dollars)
Balance Sheet Data:Property, plant and equipment, net $ 3,683,571 $ 3,460,732 $ 3,310,653 $ 3,238,460 $ 3,430,468Total assets 5,149,262 4,918,796 5,032,186 5,613,089 5,881,190Long-term debt, less current portion 3,079,349 2,749,452 2,655,553 2,124,582 1,928,071Total partners’ equity 1,609,844 1,716,210 1,903,794 2,584,995 2,864,335
(a) The losses for the years ended December 31, 2013 and 2012 are mainly due to goodwill impairment and other asset impairment charges.
(b) The decline in revenues is due to reductions in our fuels marketing segment mainly resulting from disposals and lower commodity prices.

Table of Contents
34
ITEM 7. MANAGEMENT’S DISCUSSION AND ANALYSIS OF FINANCIAL CONDITION AND RESULTS OF OPERATIONS
The following review of our results of operations and financial condition should be read in conjunction with Items 1., 1A. and 2. “Business, Risk Factors and Properties” and Item 8. “Financial Statements and Supplementary Data” included in this report.
CAUTIONARY STATEMENT REGARDING FORWARD-LOOKING INFORMATIONThis Form 10-K contains certain estimates, predictions, projections, assumptions and other forward-looking statements that involve various risks and uncertainties. While these forward-looking statements, and any assumptions upon which they are based, are made in good faith and reflect our current judgment regarding the direction of our business, actual results will almost always vary, sometimes materially, from any estimates, predictions, projections, assumptions or other future performance suggested in this report. These forward-looking statements can generally be identified by the words “anticipates,” “believes,” “expects,” “plans,” “intends,” “estimates,” “forecasts,” “budgets,” “projects,” “will,” “could,” “should,” “may” and similar expressions. These statements reflect our current views with regard to future events and are subject to various risks, uncertainties and assumptions. Please read Item 1A. “Risk Factors” for a discussion of certain of those risks, uncertainties and assumptions.
If one or more of these risks or uncertainties materialize, or if the underlying assumptions prove incorrect, our actual results may vary materially from those described in any forward-looking statement. Other unknown or unpredictable factors could also have material adverse effects on our future results. Readers are cautioned not to place undue reliance on this forward-looking information, which is as of the date of this Form 10-K. We do not intend to update these statements unless we are required by the securities laws to do so, and we undertake no obligation to publicly release the result of any revisions to any such forward-looking statements that may be made to reflect events or circumstances after the date of this report or to reflect the occurrence of unanticipated events.
OVERVIEWNuStar Energy L.P. (NuStar Energy) (NYSE: NS) is engaged in the transportation of petroleum products and anhydrous ammonia, the terminalling and storage of petroleum products and the marketing of petroleum products. Unless otherwise indicated, the terms “NuStar Energy,” “the Partnership,” “we,” “our” and “us” are used in this report to refer to NuStar Energy, to one or more of our consolidated subsidiaries or to all of them taken as a whole. NuStar GP Holdings, LLC (NuStar GP Holdings) (NYSE: NSH) owns our general partner, Riverwalk Logistics, L.P., and owns a 14.9% total interest in us as of December 31, 2015. Our Management’s Discussion and Analysis of Financial Condition and Results of Operations is presented in seven sections:
• Overview• Results of Operations• Trends and Outlook• Liquidity and Capital Resources• Related Party Transactions• Critical Accounting Policies• New Accounting Pronouncements
Acquisitions and DispositionsLinden Acquisition. On January 2, 2015, we acquired full ownership of ST Linden Terminal, LLC (Linden), which owns a refined products terminal in Linden, NJ with 4.3 million barrels of storage capacity (the Linden Acquisition). Linden is located on a 44-acre facility that provides deep-water terminalling capabilities in the New York Harbor and primarily stores petroleum products, including gasoline, jet fuel and fuel oils. Prior to the Linden Acquisition, Linden operated as a joint venture between us and Linden Holding Corp., with each party owning 50%.
In connection with the Linden Acquisition, we ceased applying the equity method of accounting and consolidated Linden, which is included in our storage segment. The consolidated statements of income include the results of operations for Linden commencing on January 2, 2015. On the acquisition date, we remeasured our existing 50% equity investment in Linden to its fair value of $128.0 million and we recognized a gain of $56.3 million in “Other income, net” in the consolidated statements of income for the year ended December 31, 2015. Please refer to Note 4 of the Notes to Consolidated Financial Statements in Item 8. “Financial Statements and Supplementary Data” for a discussion of the Linden Acquisition.
Discontinued Operations. In 2014, we divested our terminals in Mobile, AL, Wilmington, NC and Dumfries, VA and our 75% interest in our facility in Mersin, Turkey. We presented the results of operations for those facilities as discontinued operations,

Table of Contents
35
including an impairment loss of $102.5 million for the year ended December 31, 2013. On January 1, 2013, we sold our fuels refinery in San Antonio, Texas and related assets for approximately $117.0 million (the San Antonio Refinery Sale) and recognized a gain of $9.3 million.
2014 Asphalt Sale. On February 26, 2014, we sold our remaining 50% ownership interest in NuStar Asphalt LLC to Lindsay Goldberg LLC, a private investment firm (the 2014 Asphalt Sale). Effective February 27, 2014, NuStar Asphalt LLC changed its name to Axeon Specialty Products LLC (Axeon). As a result of the 2014 Asphalt Sale, we ceased applying the equity method of accounting, and we ceased reporting transactions between us and Axeon as related party transactions in our consolidated financial statements. Upon completion of the 2014 Asphalt Sale, the parties agreed to: (i) convert the $250.0 million unsecured revolving credit facility provided by us to Axeon (the NuStar JV Facility) from a revolving credit agreement into a $190.0 million term loan (the Axeon Term Loan); (ii) terminate the terminal services agreements with respect to our terminals in Rosario, NM, Catoosa, OK and Houston, TX; (iii) amend the terminal services agreements for our terminals in Baltimore, MD and Jacksonville, FL; and (iv) transfer ownership of both the Wilmington, NC and Dumfries, VA terminals to Axeon. Please refer to Note 10 of the Notes to Consolidated Financial Statements in Item 8. “Financial Statements and Supplementary Data” for additional information on the Axeon Term Loan.
2013 Goodwill ImpairmentIn the fourth quarter of 2013, we recognized a $304.5 million goodwill impairment loss in the storage segment, which represents the write-down of the carrying value of goodwill associated with our St. Eustatius and Point Tupper terminal operations. Please refer to Note 11 of the Notes to Consolidated Financial Statements in Item 8. “Financial Statements and Supplementary Data” for a discussion of the goodwill impairment loss.
OperationsWe conduct our operations through our subsidiaries, primarily NuStar Logistics, L.P. (NuStar Logistics) and NuStar Pipeline Operating Partnership L.P. (NuPOP). Our operations are divided into three reportable business segments: pipeline, storage and fuels marketing. For a more detailed description of our segments, please refer to “Segments” under Item 1. “Business.”
Pipeline. We own 3,140 miles of refined product pipelines pipelines and 1,200 miles of crude oil pipelines, as well as approximately 4.0 million barrels of storage capacity, which comprise our Central West System. In addition, we own 2,360 miles of refined product pipelines, consisting of the East and North Pipelines, and a 2,000 mile ammonia pipeline, which comprise our Central East System. The East and North Pipelines have storage capacity of approximately 6.4 million barrels.
Storage. We own terminals and storage facilities in the United States, Canada, Mexico, the Netherlands, including St. Eustatius in the Caribbean, and the United Kingdom (UK), with approximately 82.9 million barrels of storage capacity.
Fuels Marketing. Within our fuels marketing operations, we purchase crude oil and refined petroleum products for resale. The results of operations for the fuels marketing segment depend largely on the margin between our cost and the sales prices of the products we market. Therefore, the results of operations for this segment are more sensitive to changes in commodity prices compared to the operations of the pipeline and storage segments. We enter into derivative contracts to attempt to mitigate the effects of commodity price fluctuations. The derivative instruments we use consist primarily of commodity futures and swap contracts. Not all of our derivative instruments qualify for hedge accounting treatment under U.S. generally accepted accounting principles. In such cases, our earnings for a period may include the gain or loss related to derivative instruments without including the offsetting effect of the hedged item, which could result in greater earnings volatility.
Factors That Affect Results of OperationsThe following factors affect the results of our operations:
• company-specific factors, such as facility integrity issues and maintenance requirements that impact the throughput rates of our assets;
• seasonal factors that affect the demand for products transported by and/or stored in our assets and the demand for products we sell;
• industry factors, such as changes in the prices of petroleum products that affect demand and operations of our competitors;
• factors such as commodity price volatility that impact our fuels marketing segment; and• other factors, such as refinery utilization rates and maintenance turnaround schedules, that impact the operations
of refineries served by our pipeline and storage assets.

Table of Contents
36
RESULTS OF OPERATIONSYear Ended December 31, 2015 Compared to Year Ended December 31, 2014
Financial Highlights(Thousands of Dollars, Except Unit and Per Unit Data)
Year Ended December 31, 2015 2014 Change
Statement of Income Data:Revenues:
Service revenues $ 1,114,153 $ 1,026,446 $ 87,707Product sales 969,887 2,048,672 (1,078,785)
Total revenues 2,084,040 3,075,118 (991,078)
Costs and expenses:Cost of product sales 907,574 1,967,528 (1,059,954)Operating expenses 473,031 472,925 106General and administrative expenses 102,521 96,056 6,465Depreciation and amortization expense 210,210 191,708 18,502
Total costs and expenses 1,693,336 2,728,217 (1,034,881)
Operating income 390,704 346,901 43,803Equity in earnings of joint ventures — 4,796 (4,796)Interest expense, net (131,868) (132,281) 413Interest income from related party — 1,055 (1,055)Other income, net 61,822 4,499 57,323
Income from continuing operations before income tax expense 320,658 224,970 95,688Income tax expense 14,712 10,801 3,911
Income from continuing operations 305,946 214,169 91,777Income (loss) from discontinued operations, net of tax 774 (3,791) 4,565
Net income $ 306,720 $ 210,378 $ 96,342
Net income (loss) per unit applicable to limited partners:Continuing operations $ 3.29 $ 2.14 $ 1.15Discontinued operations 0.01 (0.04) 0.05
Total $ 3.30 $ 2.10 $ 1.20
Weighted-average limited partner units outstanding 77,886,078 77,886,078 —

Table of Contents
37
Segment Operating Highlights(Thousands of Dollars, Except Barrel/Day Information)
Year Ended December 31, 2015 2014 Change
Pipeline:Refined products pipelines throughput (barrels/day) 522,146 510,737 11,409Crude oil pipelines throughput (barrels/day) 471,632 437,757 33,875
Total throughput (barrels/day) 993,778 948,494 45,284Throughput revenues $ 508,522 $ 477,030 $ 31,492Operating expenses 153,222 154,106 (884)Depreciation and amortization expense 84,951 77,691 7,260
Segment operating income $ 270,349 $ 245,233 $ 25,116
Storage:Throughput (barrels/day) 899,606 887,607 11,999Throughput revenues $ 130,127 $ 123,051 $ 7,076Storage lease revenues 494,781 441,455 53,326
Total revenues 624,908 564,506 60,402Operating expenses 290,322 277,554 12,768Depreciation and amortization expense 116,768 103,848 12,920
Segment operating income $ 217,818 $ 183,104 $ 34,714
Fuels Marketing:Product sales and other revenue $ 976,216 $ 2,060,017 $ (1,083,801)Cost of product sales 922,906 1,983,339 (1,060,433)
Gross margin 53,310 76,678 (23,368)Operating expenses 39,803 51,857 (12,054)Depreciation and amortization expense — 16 (16)
Segment operating income $ 13,507 $ 24,805 $ (11,298)
Consolidation and Intersegment Eliminations:Revenues $ (25,606) $ (26,435) $ 829Cost of product sales (15,332) (15,811) 479Operating expenses (10,316) (10,592) 276
Total $ 42 $ (32) $ 74
Consolidated Information:Revenues $ 2,084,040 $ 3,075,118 $ (991,078)Cost of product sales 907,574 1,967,528 (1,059,954)Operating expenses 473,031 472,925 106Depreciation and amortization expense 201,719 181,555 20,164
Segment operating income 501,716 453,110 48,606General and administrative expenses 102,521 96,056 6,465Other depreciation and amortization expense 8,491 10,153 (1,662)
Consolidated operating income $ 390,704 $ 346,901 $ 43,803

Table of Contents
38
Annual HighlightsNet income increased $96.3 million for the year ended December 31, 2015, compared to the year ended December 31, 2014, primarily due to an increase of $48.6 million in segment operating income, resulting mainly from improvements in the pipeline and storage segments, and a $56.3 million gain associated with the Linden Acquisition.
PipelineRevenues increased $31.5 million and throughputs increased 45,284 barrels per day for the year ended December 31, 2015, compared to the year ended December 31, 2014, primarily due to:
• an increase in revenues of $17.0 million and an increase in throughputs of 34,564 barrels per day on our Eagle Ford System, primarily resulting from completion of expansion projects that increased our overall capacity;
• an increase in revenues of $11.9 million and an increase in throughputs of 11,676 barrels per day as a result of increased production in 2015 and a turnaround during the first quarter of 2014 at the refinery served by our McKee systems; and
• an increase in revenues of $3.6 million, despite throughputs that remained flat, on our Ammonia Pipeline as a result of increased long-haul deliveries and the annual index adjustment in July 2015.
The increases in pipeline revenues and throughputs were partially offset by a decrease in revenues of $4.4 million and a decrease in throughputs of 2,811 barrels per day due to turnarounds at refineries served by the East Pipeline and unfavorable pricing differentials in markets served by the East Pipeline.
Operating expenses decreased $0.9 million, despite an increase in throughputs, for the year ended December 31, 2015, compared to the year ended December 31, 2014, primarily due to the completion of a capital project to install permanent power along our South Texas Crude System reducing power and rental costs.
Depreciation and amortization expense increased $7.3 million for the year ended December 31, 2015, compared to the year ended December 31, 2014, mainly due to the completion of expansion projects.
StorageThroughput revenues increased $7.1 million and throughputs increased 11,999 barrels per day for the year ended December 31, 2015, compared to the year ended December 31, 2014, primarily due to:
• an increase in revenues of $2.5 million and an increase in throughputs of 19,853 barrels per day at our Corpus Christi North Beach terminal due to an increase in Eagle Ford Shale crude oil being shipped to Corpus Christi and the completion of related expansion projects;
• an increase in revenues of $2.3 million and an increase in throughputs of 6,263 barrels per day at our terminals in Edinburg, Harlingen and Paulsboro, mainly due to increased demand; and
• an increase in revenues of $2.0 million and an increase in throughputs of 12,558 barrels per day as a result of a turnaround during the first quarter of 2014 at the refinery served by our Benicia crude oil refinery tanks.
The increases in storage throughput revenues and throughputs were partially offset by a decrease in revenues of $0.9 million and a decrease in throughputs of 21,107 barrels per day as a result of a turnaround during the first quarter of 2015 at the refinery served by our Texas City crude oil refinery tanks.
Storage lease revenues increased $53.3 million for the year ended December 31, 2015, compared to the year ended December 31, 2014, primarily due to:
• an increase of $41.5 million as a result of the Linden Acquisition; • an increase of $11.8 million at our domestic terminal facilities, mainly due to storage rate escalations and new
customers at our Texas City, West Coast and Asphalt Terminals;• an increase of $9.9 million at our St. Eustatius terminal facility, mainly due to higher demand for storage and
increased throughput and related handling fees; and• an increase of $5.0 million at our Point Tupper terminal facility, due to new customers and rate escalations, as
well as increased throughput and related handling fees.
The increases in storage lease revenues were partially offset by:• a decrease of $8.4 million at our Amsterdam terminal facility, primarily due to the effect of foreign exchange
rates; and• a decrease of $3.5 million at our St. James terminal facility, mainly due to reduced volumes delivered to one of
our unit train offloading facilities, partially offset by increased revenues from storage rate escalations.

Table of Contents
39
Operating expenses increased $12.8 million for the year ended December 31, 2015, compared to the year ended December 31, 2014, primarily due to:
• an increase of $12.6 million as a result of the Linden Acquisition; and• an increase of $4.6 million in regulatory and maintenance expenses, mainly at our St. James and St. Eustatius
terminal facilities.
The increases in storage operating expenses were partially offset by a decrease of $3.4 million in contract services, mainly at our St. James terminal facility due to a reduction in dock and rail labor costs.
Depreciation and amortization expense increased $12.9 million for the year ended December 31, 2015, compared to the year ended December 31, 2014, mainly due to the assets associated with the Linden Acquisition.
Fuels MarketingSegment operating income decreased $11.3 million for the year ended December 31, 2015, compared to the year ended December 31, 2014, primarily due to lower product margins from our bunker fuel operations and refined product sales. The lower product margins were partially offset by a reduction in operating expenses due to decreased marine vessel costs and lower bad debt expense in 2015.
Consolidation and Intersegment EliminationsRevenue and operating expense eliminations primarily relate to storage fees charged to the fuels marketing segment by the storage segment. Cost of product sales eliminations represent expenses charged to the fuels marketing segment for costs associated with inventory that are expensed once the inventory is sold.
GeneralGeneral and administrative expenses increased $6.5 million for the year ended December 31, 2015, compared to the year ended December 31, 2014, primarily due to:
• a $3.6 million increase in outside legal and other professional fees;• a $3.5 million increase in salaries and wages mainly due to increased headcount and higher employee benefit
costs; and• a $3.1 million increase as a result of the termination of a services agreement between Axeon and NuStar GP, LLC
in June 2014, under which Axeon reimbursed us for certain corporate support services.
The increases in general and administrative expenses were partially offset by a decrease of $4.5 million in compensation expense associated with our long-term incentive plans, which fluctuates with our unit price.
Equity in earnings of joint ventures for the year ended December 31, 2014 primarily relates to our equity investment in Linden prior to the Linden Acquisition.
Interest expense, net decreased $0.4 million for the year ended December 31, 2015, compared to the year ended December 31, 2014, mainly due to increased interest income from the Axeon Term Loan. The decrease in interest expense, net was partially offset by increased interest costs associated with higher borrowings under our revolving credit agreement.
Other income, net increased by $57.3 million for the year ended December 31, 2015, compared to the year ended December 31, 2014, mainly due to the $56.3 million gain associated with the Linden Acquisition.
Income tax expense increased $3.9 million for the year ended December 31, 2015, compared to the year ended December 31, 2014, mainly due to estimated withholding taxes on our planned repatriation of cash held by foreign subsidiaries in 2016. Please refer to Note 24 of the Notes to Consolidated Financial Statements in Item 8. “Financial Statements and Supplementary Data” for a discussion on income taxes.
For the year ended December 31, 2015, we recorded income from discontinued operations of $0.8 million, compared to a loss from discontinued operations of $3.8 million for the year ended December 31, 2014. Discontinued operations include the results of operations of certain storage assets that were divested in 2014 and the first quarter of 2015.

Table of Contents
40
Year Ended December 31, 2014 Compared to Year Ended December 31, 2013
Financial Highlights(Thousands of Dollars, Except Unit and Per Unit Data)
Year Ended December 31, 2014 2013 Change
Statement of Income Data:Revenues:
Service revenues $ 1,026,446 $ 938,138 $ 88,308Product sales 2,048,672 2,525,594 (476,922)
Total revenues 3,075,118 3,463,732 (388,614)
Costs and expenses:Cost of product sales 1,967,528 2,453,997 (486,469)Operating expenses 472,925 454,396 18,529General and administrative expenses 96,056 91,086 4,970Depreciation and amortization expense 191,708 178,921 12,787Goodwill impairment loss — 304,453 (304,453)
Total costs and expenses 2,728,217 3,482,853 (754,636)
Operating income (loss) 346,901 (19,121) 366,022Equity in earnings (loss) of joint ventures 4,796 (39,970) 44,766Interest expense, net (132,281) (127,119) (5,162)Interest income from related party 1,055 6,113 (5,058)Other income, net 4,499 7,341 (2,842)
Income (loss) from continuing operations before income tax expense 224,970 (172,756) 397,726Income tax expense 10,801 12,753 (1,952)
Income (loss) from continuing operations 214,169 (185,509) 399,678Loss from discontinued operations, net of tax (3,791) (99,162) 95,371
Net income (loss) $ 210,378 $ (284,671) $ 495,049
Net income (loss) per unit applicable to limited partners:Continuing operations $ 2.14 $ (2.89) $ 5.03Discontinued operations (0.04) (1.11) 1.07
Total $ 2.10 $ (4.00) $ 6.10
Weighted-average limited partner units outstanding 77,886,078 77,886,078 —

Table of Contents
41
Segment Operating Highlights(Thousands of Dollars, Except Barrel/Day Information)
Year Ended December 31, 2014 2013 Change
Pipeline:Refined products pipelines throughput (barrels/day) 510,737 487,021 23,716Crude oil pipelines throughput (barrels/day) 437,757 365,749 72,008
Total throughput (barrels/day) 948,494 852,770 95,724Throughput revenues $ 477,030 $ 411,529 $ 65,501Operating expenses 154,106 134,365 19,741Depreciation and amortization expense 77,691 68,871 8,820
Segment operating income $ 245,233 $ 208,293 $ 36,940
Storage:Throughput (barrels/day) 887,607 781,213 106,394Throughput revenues $ 123,051 $ 104,553 $ 18,498Storage lease revenues 441,455 451,996 (10,541)
Total revenues 564,506 556,549 7,957Operating expenses 277,554 279,712 (2,158)Depreciation and amortization expense 103,848 99,868 3,980Goodwill impairment loss — 304,453 (304,453)
Segment operating income (loss) $ 183,104 $ (127,484) $ 310,588
Fuels Marketing:Product sales and other revenue $ 2,060,017 $ 2,527,698 $ (467,681)Cost of product sales 1,983,339 2,474,612 (491,273)
Gross margin 76,678 53,086 23,592Operating expenses 51,857 53,185 (1,328)Depreciation and amortization expense 16 27 (11)
Segment operating income (loss) $ 24,805 $ (126) $ 24,931
Consolidation and Intersegment Eliminations:Revenues $ (26,435) $ (32,044) $ 5,609Cost of product sales (15,811) (20,615) 4,804Operating expenses (10,592) (12,866) 2,274
Total $ (32) $ 1,437 $ (1,469)
Consolidated Information:Revenues $ 3,075,118 $ 3,463,732 $ (388,614)Cost of product sales 1,967,528 2,453,997 (486,469)Operating expenses 472,925 454,396 18,529Depreciation and amortization expense 181,555 168,766 12,789Goodwill impairment loss — 304,453 (304,453)
Segment operating income 453,110 82,120 370,990General and administrative expenses 96,056 91,086 4,970Other depreciation and amortization expense 10,153 10,155 (2)
Consolidated operating income (loss) $ 346,901 $ (19,121) $ 366,022

Table of Contents
42
Annual HighlightsSegment operating income increased $371.0 million for the year ended December 31, 2014, compared to the year ended December 31, 2013, mainly due to an operating loss of $127.5 million in the storage segment in 2013, which included a goodwill impairment charge of $304.5 million. Segment operating income in the pipeline segment increased $36.9 million for the year ended December 31, 2014 compared to the prior year, mainly due to increased throughputs on our Eagle Ford System. The fuels marketing segment operating income increased by $24.9 million for the year ended December 31, 2014, compared to the prior year, mainly due to improved product margins and lower operating expense in our bunker fuel operations. Additionally, we recorded equity in earnings of joint ventures of $4.8 million for the year ended December 31, 2014, compared to a loss in equity of joint ventures of $40.0 million for the year ended December 31, 2013, primarily due to losses from our investment in Axeon in 2013.
Loss from discontinued operations decreased $95.4 million for the year ended December 31, 2014, compared to the prior year, mainly due to an asset impairment charge of $102.5 million in 2013 associated with certain storage assets. Therefore, we reported net income of $210.4 million for the year ended December 31, 2014, compared to a loss of $284.7 million for the year ended December 31, 2013.
PipelineRevenues increased $65.5 million and throughputs increased 95,724 barrels per day for the year ended December 31, 2014, compared to the year ended December 31, 2013, primarily due to:
• an increase in revenues of $39.3 million and an increase in throughputs of 61,947 barrels per day on our Eagle Ford System, primarily resulting from continued growth in the region and the completion of expansion projects in 2014 and the third quarter of 2013 that increased our overall capacity;
• an increase in revenues of $9.1 million and an increase in throughputs of 26,369 barrels per day on our McKee systems mainly due to increased production by the McKee refinery in 2014;
• an increase in revenues of $7.1 million and an increase in throughputs of 2,341 barrels per day on the East Pipeline due to higher average tariffs resulting from the annual index adjustments and increased long-haul deliveries, as well as higher demand due to favorable weather conditions during 2014 compared to last year; and
• an increase in revenues of $4.9 million and an increase in throughputs of 3,140 barrels per day on the Ammonia Pipeline mainly due to favorable weather conditions during 2014 compared to last year.
Operating expenses increased $19.7 million for the year ended December 31, 2014, compared to the year ended December 31, 2013, primarily due to:
• an $8.0 million gain in 2013 for the reduction of the contingent consideration liability recorded in association with our acquisition of certain assets from TexStar Midstream Services, LP;
• an increase of $6.3 million in maintenance and regulatory expenses, mainly associated with our East Pipeline and Ammonia Pipeline; and
• an increase of $5.0 million in power costs, mainly due to the increase in throughputs on our Eagle Ford System and the East Pipeline.
Depreciation and amortization expense increased $8.8 million for the year ended December 31, 2014, compared to the year ended December 31, 2013, mainly due to the completion of various projects that serve Eagle Ford Shale production.
StorageThroughput revenues increased $18.5 million and throughputs increased 106,394 barrels per day for the year ended December 31, 2014, compared to the year ended December 31, 2013, primarily due to:
• an increase in revenues of $12.5 million and an increase in throughputs of 56,908 barrels per day at our Corpus Christi North Beach terminal due to an increase in Eagle Ford Shale crude oil being shipped to Corpus Christi and the completion of a new dock in the first quarter of 2014;
• an increase in revenues of $3.0 million and an increase in throughputs of 37,822 barrels per day as a result of turnarounds and operational issues during the first quarter of 2013 at the refineries served by our Corpus Christi and Texas City crude oil refinery storage tanks; and
• an increase in revenues of $1.7 million and an increase in throughputs of 7,727 barrels per day at our McKee system terminals due to higher demand in those markets.
Storage lease revenues decreased $10.5 million for the year ended December 31, 2014, compared to the year ended December 31, 2013, primarily due to:
• a decrease of $15.8 million at various domestic terminals, mainly as a result of reduced demand in several markets, resulting in lower throughputs and storage fees;
• a decrease of $1.6 million at our Point Tupper, Canada terminal facility, mainly due to lower throughput and related handling fees; and

Table of Contents
43
• a decrease of $0.9 million at our St. James terminal, mainly due to the narrowing price differential on two traded crude oil grades (WTI and LLS) that reduced our profit sharing and volumes delivered to one of our unit train offloading facilities. This decrease was partially offset by increased revenues resulting from the completion of another unit train offloading facility in the fourth quarter of 2013, new contracts and rate increases.
The declines in storage lease revenues were partially offset by an increase of $5.5 million at our UK terminal facilities, mainly due to the effect of foreign exchange rates and increased throughput and related handling fees. In addition, our asphalt terminals increased $3.6 million due to renegotiating the storage contracts.
Operating expenses decreased $2.2 million for the year ended December 31, 2014, compared to the year ended December 31, 2013, primarily due to reduced maintenance and regulatory expenses of $2.8 million, mainly at our West Coast and Gulf Coast terminals.
Depreciation and amortization expense increased $4.0 million for the year ended December 31, 2014, compared to the year ended December 31, 2013, primarily due to the completion of a unit train offloading facility in the fourth quarter of 2013 at our St. James terminal.
Fuels MarketingSegment operating income increased $24.9 million for the year ended December 31, 2014, compared to the year ended December 31, 2013, primarily due to higher earnings of $36.2 million from our bunker fuel operations, which benefitted from improved product margins and decreased vessel lease and fuel costs. The increase in segment operating income from our bunker fuel operations was partially offset by lower earnings of $7.6 million in fuel oil trading, mainly resulting from lower product margins due to a lack of supply for blend components. In addition, operating expense in our bunker fuel and fuel oil trading operations increased by $7.5 million related to an allowance for doubtful accounts recorded in the fourth quarter of 2014. For the year ended December 31, 2014, we recognized a $3.8 million lower of cost or market adjustment, mainly impacting fuel oil trading operations.
Consolidation and Intersegment EliminationsRevenue and operating expense eliminations primarily relate to storage fees charged to the fuels marketing segment by the storage segment. Cost of product sales eliminations represent expenses charged to the fuels marketing segment for costs associated with inventory that are expensed once the inventory is sold.
GeneralGeneral and administrative expenses increased $5.0 million for the year ended December 31, 2014, compared to the year ended December 31, 2013, primarily as a result of higher compensation expense associated with satisfying obligations under our long-term incentive plans, which fluctuates with our unit price, and the termination of a services agreement between Axeon and NuStar GP, LLC in June 2014, under which Axeon reimbursed us for certain corporate support services. These increases were partially offset by reduced employee benefit costs.
We recorded equity in earnings of joint ventures of $4.8 million for the year ended December 31, 2014, compared to a loss in equity of joint ventures of $40.0 million for the year ended December 31, 2013, primarily due to losses from our investment in Axeon for the year ended December 31, 2013.
Interest expense, net increased $5.2 million for the year ended December 31, 2014, compared to the year ended December 31, 2013, mainly due to the issuance of the $300.0 million of 6.75% senior notes in August 2013. Interest income from related party represents the interest earned on the NuStar JV Facility prior to the 2014 Asphalt Sale. Interest income from the Axeon Term Loan after the 2014 Asphalt Sale is not a related party transaction and, therefore, is reported in “Interest expense, net” on the consolidated statements of income.
Other income, net decreased by $2.8 million for the year ended December 31, 2014, compared to the year ended December 31, 2013, mainly due to changes in foreign exchange rates related to our foreign subsidiaries.
Income tax expense decreased $2.0 million for the year ended December 31, 2014, compared to the year ended December 31, 2013, mainly due to a decrease in the margin tax in Texas.
The loss from discontinued operations decreased $95.4 million for the year ended December 31, 2014, compared to the year ended December 31, 2013, mainly due to the asset impairment charges of $102.5 million associated with certain storage terminals, partially offset by a gain of $9.3 million related to the San Antonio Refinery Sale.

Table of Contents
44
TRENDS AND OUTLOOKCurrent Market ConditionsDuring 2015 and early 2016, the price of crude oil has continued to decline, reaching lows not seen in 13 years. The sustained period of low prices has forced most crude oil producers to reduce their capital spending and drilling activity and narrow their focus to assets in the most cost-advantaged regions. On the other hand, refiners generally have benefitted from lower crude prices, particularly to the extent the lower feedstock price has been coupled with higher demand for certain refined products in some regional markets.
We believe a number of factors serve to minimize our direct exposure to the risks associated with fluctuating commodity prices. We own assets and offer services in regional markets across the United States and around the world, and we are not dependent on the regions or markets that have been hardest hit by depressed crude oil prices, the domestic shale play regions: in 2015, revenue from our Eagle Ford pipeline and storage assets constituted less than 16% of our total pipeline and storage segment revenue. In our view, the fact that our pipeline segment and our storage segment are approximately equal serves to balance the impact of market fluctuations. High crude prices have tended to correlate with high pipeline demand, while low prices have tended to correlate with high storage demand. In addition, many of our commercial contracts are long-term, take-or-pay arrangements for committed storage or throughput capacity, which mitigates the short-term impact of low crude oil prices on our results of operations. However, a protracted period of depressed crude oil prices and overall economic downturn could have a negative impact on our results of operations.
Regardless of insulation from or the lack of exposure to commodity prices, continued low crude oil prices seem to be having a direct, negative impact on the unit price of many master limited partnerships, including our own. Unfavorable market conditions have increased the cost of financing capital spending through the public debt and equity markets, and, as a result, we have reduced our overall capital spending budget for 2016 and have prioritized our capital projects to minimize the need to access the public capital markets.
Pipeline SegmentWe expect our pipeline segment to benefit from higher forecasted volumes on our refined product pipelines. However, we expect these increases to be more than offset by reduced throughput volumes on our Eagle Ford crude pipelines due to lower domestic shale production, resulting in lower earnings in the first quarter and full-year 2016 as compared to the comparable periods of 2015.
Storage SegmentWe expect storage segment earnings for the first quarter 2016 to be slightly higher than the first quarter 2015 mainly due to favorable storage contract renewals at several of our terminal facilities. However, we expect that the reduced throughput on our Eagle Ford crude pipelines, as referred to and with regard to our Pipeline Segment, will also result in lower throughputs in the first quarter at our Corpus Christi North Beach terminal.
We expect the full-year earnings for 2016 to benefit from favorable storage contract renewals and higher forecasted throughput volumes at several of our terminal facilities. However, we expect these increases to be more than offset by lower throughputs at our Corpus Christi North Beach terminal and overall lower revenue from some of our foreign terminal facilities, resulting in lower earnings in the full-year 2016 as compared to 2015.
Fuels Marketing SegmentWe expect first quarter 2016 results for our fuels marketing segment to be lower than the first quarter 2015 and full-year 2016 results in this segment to be comparable or higher than 2015. However, earnings in this segment, as in any margin-based business, are subject to many factors that can increase or reduce margins, which may cause the segment’s actual results to vary significantly from our forecast.
Our outlook for the partnership, both overall and for any of our segments, may change, as we base our expectations on our continuing evaluation of a number of factors, many of which are outside our control, including the price of crude oil, the state of the economy and the capital markets, changes to refinery maintenance schedules and unplanned refinery downtime, supply of and demand for crude oil, refined products and anhydrous ammonia, demand for our transportation and storage services and changes in laws or regulations affecting our assets.

Table of Contents
45
LIQUIDITY AND CAPITAL RESOURCESOverviewPrimary Cash Requirements. Our primary cash requirements are for distributions to our partners, capital expenditures, debt service and operating expenses.
Our partnership agreement requires that we distribute all “Available Cash” to our partners each quarter, and this term is defined in the partnership agreement as cash on hand at the end of the quarter, plus certain permitted borrowings made subsequent to the end of the quarter, less cash reserves determined by our board of directors.
Sources of Funds. Each year, our objective is to fund our total annual reliability capital expenditures and distribution requirements with our net cash provided by operating activities during that year. If we do not generate sufficient cash from operations to meet that objective, we utilize other sources of cash flow, which in the past have primarily included borrowings under our revolving credit agreement, sales of non-strategic assets and, to the extent necessary, funds raised through equity or debt offerings under our shelf registration statements. We have typically funded our strategic capital expenditures and acquisitions from external sources, primarily borrowings under our revolving credit agreement or funds raised through equity or debt offerings. However, our ability to raise funds by issuing debt or equity depends on many factors beyond our control. Our risk factors in Item 1A. “Risk Factors” describe the risks inherent to these sources of funding and the availability thereof.
During periods when our cash flow from operations is less than our distribution and reliability capital requirements, we may maintain our distribution level because we can use other sources of Available Cash, as provided in our partnership agreement, including borrowings under our revolving credit agreement and proceeds from the sales of assets. Our risk factors in Item 1A. “Risk Factors” describe the risks inherent in our ability to maintain or grow our distribution.
For the years ended December 31, 2015, 2014 and 2013, our cash flow from operations exceeded our distributions to our partners and our reliability capital expenditures. For 2016, we currently expect to continue to produce cash from operations in excess of our distribution and reliability capital expenditures.
As described above, we and many other master limited partnerships have experienced significant declines in our unit prices, and current market conditions have increased the cost of financing capital spending through public debt and equity offerings. As a result, we have prioritized our capital budget for 2016 to minimize our need to access the public debt and equity markets in 2016, and we intend to first utilize other sources of funding, including cash on hand and borrowings under our revolver, for our strategic capital spending, before availing ourselves of cost-prohibitive public debt or equity financing. Our current 2016 strategic capital program includes projects that we can reduce in scope or forego entirely, depending on our evaluation of changing market conditions and our analysis of each project’s relative expected returns, strategic importance and overall capital requirements.
Cash Flows for the Years Ended December 31, 2015, 2014 and 2013 The following table summarizes our cash flows from operating, investing and financing activities:
Year Ended December 31, 2015 2014 2013
(Thousands of Dollars)
Net cash provided by (used in):Operating activities $ 524,937 $ 518,523 $ 485,219Investing activities (452,029) (340,231) (310,961)Financing activities (29,229) (188,185) (149,350)Effect of foreign exchange rate changes on cash (12,729) (2,938) (7,767)
Net increase (decrease) in cash and cash equivalents $ 30,950 $ (12,831) $ 17,141
Net cash provided by operating activities remained relatively flat for the year ended December 31, 2015 compared to the year ended December 31, 2014, despite higher net income in 2015. Net income for the year ended December 31, 2015 includes the $56.3 million non-cash gain associated with the Linden Acquisition. In addition, changes in working capital provided cash flow of $50.6 million for the year ended December 31, 2015 compared to $82.4 million for the year ended December 31, 2014. Please refer to the Working Capital Requirements section below for a discussion of the changes in working capital.
For the year ended December 31, 2015, the majority of net cash provided by operating activities was used to fund our distributions to unitholders and our general partner in the aggregate amount of $392.2 million and to fund $40.0 million of

Table of Contents
46
reliability capital expenditures. The proceeds from debt borrowings, net of repayments, combined a portion of net cash provided by operating activities, were used to fund our strategic capital expenditures, including the Linden Acquisition.
For the year ended December 31, 2014, the majority of net cash provided by operating activities was used to fund our distributions to unitholders and our general partner in the aggregate amount of $392.2 million and to fund $28.6 million of reliability capital expenditures. The proceeds from debt borrowings, net of repayments, combined with net cash provided by operating activities and proceeds from the sales of assets, were used to fund our strategic capital expenditures primarily related to our pipeline and storage segments and advances to Axeon under the NuStar JV Facility.
For the year ended December 31, 2013, net cash provided by operating activities exceeded our distribution requirements and reliability capital expenditures. Proceeds from the San Antonio Refinery Sale and proceeds from long-term debt borrowings, net of repayments, combined with net cash provided by operating activities, were used to fund our strategic capital expenditures and advances to Axeon under the NuStar JV Facility.
Revolving Credit AgreementNuStar Logistics is a party to a $1.5 billion five-year revolving credit agreement (Revolving Credit Agreement), which matures on October 29, 2019. The Revolving Credit Agreement includes an option allowing NuStar Logistics to request an aggregate increase in the commitments from the lenders of up to $250.0 million (after which increase the aggregate commitment from all lenders shall not exceed $1.75 billion). The Revolving Credit Agreement also includes the ability to borrow up to the equivalent of $250.0 million in Euros and up to the equivalent of $250.0 million in British Pounds Sterling. Obligations under the Revolving Credit Agreement are guaranteed by NuStar Energy and NuPOP.
The Revolving Credit Agreement contains customary restrictive covenants, such as limitations on indebtedness, liens, mergers, asset transfers and certain investing activities. In addition, the Revolving Credit Agreement requires us to maintain, as of the end of each rolling period of four consecutive fiscal quarters, a consolidated debt coverage ratio (consolidated debt to consolidated EBITDA, each as defined in the Revolving Credit Agreement) not to exceed 5.00-to-1.00. If we consummate an acquisition for an aggregate net consideration of at least $50.0 million, the maximum consolidated debt coverage ratio will increase to 5.50-to-1.00 for two rolling periods. The requirement not to exceed a maximum consolidated debt coverage ratio may limit the amount we can borrow under the Revolving Credit Agreement to an amount less than the total amount available for borrowing. As of December 31, 2015, our consolidated debt coverage ratio was 4.5x, and we had $587.3 million available for borrowing.
Letters of credit issued under our Revolving Credit Agreement totaled $30.1 million as of December 31, 2015. Letters of credit are limited to $750.0 million (including up to the equivalent of $25.0 million in Euros and up to the equivalent of $25.0 million in British Pounds Sterling) and also restrict the amount we can borrow under the Revolving Credit Agreement.
Please refer to Note 13 of the Notes to Consolidated Financial Statements in Item 8. “Financial Statements and Supplementary Data” for a discussion of our debt agreements.
Other Sources of LiquidityOther sources of liquidity consist of the following:
• $365.4 million in revenue bonds pursuant to the Gulf Opportunity Zone Act of 2005 (the Gulf Opportunity Zone Revenue Bonds), with $54.8 million remaining in trust as of December 31, 2015, supported by $370.2 million letters of credit issued by individual banks that do no restrict the amount we can borrow under our Revolving Credit Agreement;
• a $125.0 million receivables financing agreement between NuStar Energy, NuStar Finance LLC and third-party lenders (the Receivables Financing Agreement), with the amount available for borrowing based on the availability of eligible receivables and other customary factors and conditions; and
• two short-term line of credit agreements with an aggregate uncommitted borrowing capacity of up to $105.0 million with $84.0 million outstanding as of December 31, 2015.
Please refer to Note 13 of the Notes to Consolidated Financial Statements in Item 8. “Financial Statements and Supplementary Data” for a more detailed discussion of these debt agreements.
LOC AgreementNuStar Logistics is a party to a $100.0 million uncommitted letter of credit agreement, which provides for standby letters of credit or guarantees with a term of up to one year (LOC Agreement). Any letters of credit issued under the LOC Agreement do not reduce availability under our Revolving Credit Agreement. As of December 31, 2015, letters of credit issued under the LOC Agreement totaled $14.7 million. The interest rate and maturity vary and are determined at the time of borrowing.

Table of Contents
47
Issuance of DebtOn August 19, 2013, NuStar Logistics issued $300.0 million of 6.75% senior notes due February 1, 2021 (the 6.75% Senior Notes). We received net proceeds of approximately $296.0 million, which we used for general partnership purposes, including repayment of outstanding borrowings under our Revolving Credit Agreement.
On January 22, 2013, NuStar Logistics issued $402.5 million of 7.625% fixed-to-floating rate subordinated notes due January 15, 2043 (the Subordinated Notes), including the underwriters’ option to purchase up to an additional $52.5 million principal amount of the notes, which was exercised in full. We received net proceeds of approximately $390.9 million, which we used for general partnership purposes, including repayment of outstanding borrowings under our Revolving Credit Agreement. The Subordinated Notes bear interest at a fixed annual rate of 7.625%, payable quarterly in arrears beginning on April 15, 2013 and ending on January 15, 2018. Thereafter, the Subordinated Notes will bear interest at an annual rate equal to the sum of the three-month LIBOR rate for the related quarterly interest period, plus 6.734% payable quarterly, commencing April 15, 2018, unless payment is deferred in accordance with the terms of the notes.
Shelf Registration Statement On June 2, 2015, the Securities and Exchange Commission declared our shelf registration statement on Form S-3 effective, which permits us to offer and sell NuStar Energy common units having an aggregate purchase price of up to $500.0 million (the Shelf Registration Statement).
On September 30, 2015, in connection with the Shelf Registration Statement, we entered into an Equity Distribution Agreement (the Equity Distribution Agreement) with various banks (each a Manager, and collectively, the Managers). Under the Equity Distribution Agreement, we may from time to time sell NuStar Energy common units representing limited partner interests having an aggregate offering price of up to $500.0 million, using the Managers as our sales agents. Sales of common units will be made by means of ordinary brokers’ transactions on the New York Stock Exchange at market prices, in block transactions or as otherwise agreed by us and the Managers. Under the terms of the Equity Distribution Agreement, we may also sell common units to any Manager as principal for its own account at a price to be agreed upon at the time of sale. As of December 31, 2015, we have not sold any NuStar Energy common units under the Equity Distribution Agreement.
Capital RequirementsOur operations require significant investments to maintain, upgrade or enhance the operating capacity of our existing assets. Our capital expenditures consist of:
• reliability capital expenditures, such as those required to maintain the existing operating capacity of existing assets or extend their useful lives, as well as those required to maintain equipment reliability and safety; and
• strategic capital expenditures, such as those to expand or upgrade the operating capacity, increase efficiency or increase the earnings potential of existing assets, whether through construction or acquisition, as well as certain capital expenditures related to support functions.
The following table summarizes our capital expenditures, and the amount we expect to spend for 2016:
Reliability CapitalExpenditures (a)
Strategic CapitalExpenditures (b) Total
(Thousands of Dollars)
For the year ended December 31:2013 $ 41,319 $ 302,001 $ 343,3202014 $ 28,635 $ 328,330 $ 356,9652015 (c) $ 40,002 $ 430,870 $ 470,872Expected for the year ended December 31, 2016 $ 35,000 - 45,000 $ 360,000 - 380,000 $ 395,000 - 425,000
(a) Reliability capital primarily relates to maintenance upgrade projects at our terminals.(b) For each of 2013, 2014 and 2015, strategic capital expenditures primarily related to projects associated with the Eagle Ford Shale
region in South Texas. In 2015, strategic capital also included $142.5 million for the Linden Acquisition. In 2014 and 2015, strategic capital also included the reactivation and conversion of our 200-mile pipeline between Mont Belvieu and Corpus Christi, Texas. In 2013, strategic capital also included projects at our St. James, Louisiana terminal.
(c) In 2015, our completed Eagle Ford Shale region capital projects included the expansion of our South Texas Crude System, which increased throughput capacity of the system, construction of additional storage at our Corpus Christi North Beach and Oakville terminals and projects that connected our South Texas Crude System to two major refineries in the Corpus Christi area.
For 2016, we continue to evaluate our capital budget and make changes as economic conditions warrant, and our actual capital expenditures for 2016 may increase or decrease from the budgeted amounts. We believe cash on hand, combined with other

Table of Contents
48
sources of liquidity previously described, will be sufficient to fund our capital expenditures in 2016, and our internal growth projects can be accelerated or scaled back depending on the condition of the capital markets.
Working Capital RequirementsWorking capital requirements, particularly in our fuels marketing segment, may vary with the seasonality of demand and the volatility of commodity prices for the products we market. This seasonality in demand and the volatility of commodity prices affect our accounts receivable and accounts payable balances, which vary depending on timing of payments.
Inventories decreased $16.8 million during the year ended December 31, 2015, mainly due to the continued decline in crude oil prices. In addition, inventory volumes decreased in 2015 primarily due to decreased bunker fuel operations activity. During the year ended December 31, 2015, accounts receivable decreased $67.3 million and accounts payable decreased $32.2 million primarily due to decreased bunker fuel operations and crude oil trading activity.
Inventories decreased $82.1 million during the year ended December 31, 2014, primarily due to a steep decline in crude oil market price during the fourth quarter of 2014. We also continued to further reduce the volume of our inventory carried in our bunker fuel operations and our heavy fuel oil trading operations. During the year ended December 31, 2014, accounts receivable decreased $72.3 million and accounts payable decreased $153.7 million mainly due to the bunker fuel supply strategy and less crude oil trading activity. In addition, the termination of the crude oil supply agreement with Axeon on January 1, 2014 caused a decrease in both accounts payable and the receivable from related parties.
Within working capital, inventories decreased $32.0 million during the year ended December 31, 2013, primarily as a result of a new bunker fuel supply agreement that reduced the inventory carried in our St. Eustatius bunker fuel operations. In addition, accounts receivable decreased $107.2 million and accounts payable decreased $96.3 million during the year ended December 31, 2013, primarily due to less crude oil trading and bunker fuel operations activity in 2013 and the San Antonio Refinery Sale. Accounts payable also decreased during 2013 due to timing of payments for crude oil purchases related to Axeon, which corresponds with the decrease in the receivable from related parties of $58.7 million during the year ended December 31, 2013.
Axeon Term Loan and Credit SupportThe Axeon Term Loan includes scheduled repayments to reduce the outstanding amount from $190.0 million to $175.0 million as of December 31, 2014 and then to $150.0 million on September 30, 2015. Any repayments of the Axeon Term Loan, including those that were scheduled in 2014 and 2015, are subject to Axeon meeting certain restrictive requirements contained in its third-party asset-based revolving credit facility. Axeon failed to make the two scheduled principal payments, increasing the interest rate payable by Axeon until Axeon makes the payments. While the Axeon Term Loan does not provide for any other scheduled payments, Axeon is required to use all of its excess cash, as defined in the Axeon Term Loan, to repay the Axeon Term Loan, which must be repaid in full no later than September 28, 2019. The Axeon Term Loan bears interest based on either an alternative base rate or a LIBOR-based rate. We recognize interest income over the term of the loan in “Interest expense, net” on the consolidated statements of income. During the year ended December 31, 2015, the weighted average interest rate was 5.2%.
We also are obligated to provide credit support, such as guarantees, letters of credit and cash collateral, as applicable, of up to $150.0 million to Axeon, until February 26, 2016, at which point the amount of credit support will decrease by $25.0 million. Our obligation will continue to decrease until the obligation is terminated no later than September 28, 2019. As of December 31, 2015, we provided guarantees for Axeon with an aggregate maximum potential exposure of $71.9 million, plus two guarantees to suppliers that do not specify a maximum amount, but for which we believe any amounts due would be minimal. As of December 31, 2015, we have also provided $36.2 million in letters of credit on behalf of Axeon. In the event that we are obligated to perform under any of these guarantees or letters of credit, the amount paid by us will be treated as additional borrowings under the Axeon Term Loan.
DistributionsNuStar Energy’s partnership agreement, as amended, determines the amount and priority of cash distributions that our common unitholders and general partner may receive. The general partner receives a 2% distribution with respect to its general partner interest. The general partner is also entitled to incentive distributions if the amount we distribute with respect to any quarter exceeds $0.60 per unit. For a detailed discussion of the incentive distribution targets, please read Item 5. “Market for Registrant’s Common Units, Related Unitholder Matters and Issuer Purchases of Common Units.”

Table of Contents
49
The following table reflects the allocation of total cash distributions to the general and limited partners applicable to the period in which the distributions were earned:
Year Ended December 31, 2015 2014 2013 (Thousands of Dollars, Except Per Unit Data)
General partner interest $ 7,844 $ 7,844 $ 7,844General partner incentive distribution 43,220 43,220 43,220
Total general partner distribution 51,064 51,064 51,064Limited partners’ distribution 341,140 341,140 341,140
Total cash distributions $ 392,204 $ 392,204 $ 392,204
Cash distributions per unit applicable to limited partners $ 4.380 $ 4.380 $ 4.380
Actual distribution payments are made within 45 days after the end of each quarter as of a record date that is set after the end of each quarter. The following table summarizes information related to our quarterly cash distributions:
Quarter Ended
CashDistributions
Per UnitTotal Cash
Distributions Record Date Payment Date(Thousands of Dollars)
December 31, 2015 (a) $ 1.095 $ 98,051 February 8, 2016 February 12, 2016September 30, 2015 $ 1.095 $ 98,051 November 9, 2015 November 13, 2015June 30, 2015 $ 1.095 $ 98,051 August 7, 2015 August 13, 2015March 31, 2015 $ 1.095 $ 98,051 May 8, 2015 May 14, 2015
(a) The distribution was announced on January 29, 2016.
Debt ObligationsAs of December 31, 2015, we were a party to the following debt agreements:
• the Revolving Credit Agreement due October 29, 2019, with a balance of $882.7 million as of December 31, 2015;
• 7.65% senior notes due April 15, 2018 with a face value of $350.0 million; 4.80% senior notes due September 1, 2020 with a face value of $450.0 million; 6.75% senior notes due February 1, 2021 with a face value of $300.0 million; 4.75% senior notes due February 1, 2022 with a face value of $250.0 million; and 7.625% subordinated notes due January 15, 2043 with a face value of $402.5 million;
• $365.4 million Gulf Opportunity Zone Revenue Bonds due from 2038 to 2041;• $105.0 million line of credit agreements with $84.0 million outstanding as of December 31, 2015; and• Receivables Financing Agreement due June 15, 2018, with $53.5 million of borrowings outstanding as of
December 31, 2015.
Management believes that we are in compliance with the ratios and covenants contained under our debt instruments. A default under certain of our debt agreements would be considered an event of default under other of our debt instruments. Please refer to Note 13 of the Notes to Consolidated Financial Statements in Item 8. “Financial Statements and Supplementary Data” for a more detailed discussion of our debt agreements.
Credit RatingsThe following table reflects the current outlook and ratings that have been assigned to our debt:
Standard & Poor’s Ratings Services
Moody’s Investor Service Inc. Fitch, Inc.
Ratings BB+ Ba1 BBOutlook Stable Stable Stable
The interest rate payable on the 7.65% senior notes due 2018 and the Revolving Credit Agreement is subject to adjustment if our debt rating is downgraded (or upgraded) by certain credit rating agencies. We may also be required to provide additional

Table of Contents
50
credit support for certain contracts, although as of December 31, 2015, we have not been required to provide any additional credit support under those contracts due to credit ratings.
Interest Rate SwapsWe are a party to forward-starting interest rate swap agreements for the purpose of hedging interest rate risk. During the year ended December 31, 2015, we entered into forward-starting interest rate agreements with an aggregate notional amount of $600.0 million related to forecasted probable debt issuances in 2018 and 2020. Please refer to Note 2 and Note 17 of the Notes to Consolidated Financial Statements in Item 8. “Financial Statements and Supplementary Data” for a more detailed discussion on our interest rate swaps.
Long-Term Contractual ObligationsThe following table presents our long-term contractual obligations and commitments and the related payments due, in total and by period, as of December 31, 2015:
Payments Due by Period
2016 2017 2018 2019 2020 Thereafter Total (Thousands of Dollars)
Long-term debt maturities $ — $ — $ 403,500 $ 882,664 $ 450,000 $ 1,317,940 $ 3,054,104Interest payments 138,212 138,212 127,131 109,890 94,669 971,751 1,579,865Operating leases 31,969 27,919 25,175 18,522 6,991 65,258 175,834Purchase obligations 6,920 3,673 2,286 1,441 9 — 14,329
The interest payments calculated for our variable-rate debt are based on the outstanding borrowings and the interest rates and payment dates as of December 31, 2015. The interest payments on our fixed-rate debt are based on the stated interest rates, the outstanding balances as of December 31, 2015 and interest payment dates.
Our operating leases consist primarily of leases for tugs and barges utilized at our St. Eustatius facility and land leases at various terminal facilities.
A purchase obligation is an enforceable and legally binding agreement to purchase goods or services that specifies significant terms, including (i) fixed or minimum quantities to be purchased, (ii) fixed, minimum or variable price provisions and (iii) the approximate timing of the transaction.
Environmental, Health and SafetyWe are subject to extensive federal, state and local environmental laws and regulations, including those relating to the discharge of materials into the environment, waste management and pollution prevention measures, among others. Our operations are also subject to extensive federal, state and local health and safety laws and regulations, including those relating to worker and pipeline safety, pipeline integrity and operator qualifications. Because more stringent environmental and safety laws and regulations are continuously being enacted or proposed, the level of future expenditures required for environmental, health and safety matters is expected to increase in the future.
The balance of and changes in our accruals for environmental matters as of and for the years ended December 31, 2015 and 2014 are included in Note 14 of the Notes to Consolidated Financial Statements in Item 8. “Financial Statements and Supplemental Data.” We believe that we have adequately accrued for our environmental exposures.
ContingenciesWe are subject to certain loss contingencies, the outcomes of which could have an adverse effect on our cash flows and results of operations, as further disclosed in Note 15 of the Notes to Consolidated Financial Statements in Item 8. “Financial Statements and Supplemental Data.”
RELATED PARTY TRANSACTIONSOur operations are managed by NuStar GP, LLC, the general partner of our general partner. Under a services agreement between NuStar Energy and NuStar GP, LLC, employees of NuStar GP, LLC currently provide services to both NuStar Energy and NuStar GP Holdings and we reimburse NuStar GP, LLC for all costs related to its employees, other than costs associated with NuStar GP Holdings. Please refer to Note 18 of the Notes to Consolidated Financial Statements in Item 8. “Financial Statements and Supplementary Data” for a more detailed discussion of our related party transactions.

Table of Contents
51
On March 1, 2016, NuStar GP, LLC intends to transfer and assign to NuStar Services Company LLC, a wholly owned subsidiary of NuStar Energy, all of NuStar GP, LLC’s employees and related benefit plans. Following the transfer of employees, we will pay employee costs directly and sponsor the following related benefit plans, among others:
• The NuStar Thrift Plan (the Thrift Plan), a qualified employee profit-sharing plan;• The NuStar Pension Plan, a qualified non-contributory defined benefit pension plan;• The NuStar Excess Thrift Plan, a benefit plan to those employees whose compensation and/or annual contributions
under the Thrift Plan are subject to the limitations applicable to qualified retirement plans;• The NuStar Excess Pension Plan, a benefit plan to a select group of management or other highly compensated
employees; and• The NuStar GP, LLC Retiree Welfare Benefits Plan, a medical benefits plan for certain retired employees.
We do not expect this transfer of employees and related benefit plans to materially change our expenses since we currently reimburse NuStar GP, LLC for all employee costs attributable to us. Our consolidated balance sheet will reflect employee-related obligations to external parties instead of related party payables to NuStar GP, LLC.
On January 28, 2016, at a special meeting of unitholders, NuStar Energy’s unitholders approved the Fifth Amended and Restated 2000 Long-Term Incentive Plan (the Amended Plan), which, among other items, provided that NuStar Energy could use newly issued units from NuStar Energy to satisfy unit awards. The unitholder vote approving the Amended Plan on January 28, 2016, coupled with the subsequent transfer of the employees of NuStar GP, LLC into NuStar Services Company LLC, will result in the classification of substantially all of our currently outstanding and subsequently issued awards as equity awards. At the time of the transfer of employees, NuStar Services Company LLC will assume obligations associated therewith, including all outstanding awards, and we intend to satisfy substantively all of the vestings of such awards with newly issued units of NuStar Energy.
CRITICAL ACCOUNTING POLICIESThe preparation of financial statements in accordance with U.S. generally accepted accounting principles requires management to select accounting policies and to make estimates and assumptions related thereto that affect the amounts reported in the consolidated financial statements and accompanying notes. Actual results could differ from those estimates. The accounting policies below are considered critical due to judgments made by management and the sensitivity of these estimates to deviations of actual results from management’s assumptions. The critical accounting policies should be read in conjunction with Note 2 of the Notes to the Consolidated Financial Statements in Item 8. “Financial Statements and Supplemental Data,” which summarizes our significant accounting policies.
DepreciationWe calculate depreciation expense using the straight-line method over the estimated useful lives of our property, plant and equipment. Due to the expected long useful lives of our property, plant and equipment, we depreciate our property, plant and equipment over periods ranging from 10 years to 40 years. Changes in the estimated useful lives of our property, plant and equipment could have a material adverse effect on our results of operations.
Impairment of Long-Lived Assets We test long-lived assets for recoverability whenever events or changes in circumstances indicate that the carrying amount of the asset may not be recoverable. We evaluate recoverability using undiscounted estimated net cash flows generated by the related asset or asset group. If the results of that evaluation indicate that the undiscounted cash flows are less than the carrying amount of the asset (i.e., the asset is not recoverable) we perform an impairment analysis. If our intent is to hold the asset for continued use, we determine the amount of impairment as the amount by which the net carrying value exceeds its fair value. If our intent is to sell the asset, and the criteria required to classify an asset as held for sale are met, we determine the amount of impairment as the amount by which the net carrying amount exceeds its fair value less costs to sell.
Impairment of GoodwillWe perform an assessment of goodwill annually or more frequently if events or changes in circumstances warrant. Our qualitative annual assessment includes, among other things, industry and market considerations, overall financial performance, other entity-specific events and events affecting individual reporting units. If after assessing the totality of events or circumstances for each reporting unit, we determine that it is more likely than not that the carrying value exceeds its fair value, then we perform an impairment test for that reporting unit.
We recognize an impairment of goodwill if the carrying value of goodwill exceeds its estimated fair value. In order to estimate the fair value of goodwill, management must make certain estimates and assumptions that affect the total fair value of the reporting unit including, among other things, an assessment of market conditions, projected cash flows, discount rates and growth rates. Management’s estimates of projected cash flows related to the reporting unit include, but are not limited to, future

Table of Contents
52
earnings of the reporting unit, assumptions about the use or disposition of the asset, estimated remaining life of the asset, and future expenditures necessary to maintain the asset’s existing service potential.
We calculate the estimated fair value of each of our reporting units using a weighted-average of values calculated using an income approach and a market approach. The income approach involves estimating the fair value of each reporting unit by discounting its estimated future cash flows using a discount rate, consistent with a market participant’s assumption. The market approach bases the fair value measurement on information obtained from observed stock prices of public companies and recent merger and acquisition transaction data of comparable entities.
We determined that no impairment charges resulted from our October 1, 2015 impairment assessment. Furthermore, our assessment did not reflect any reporting units at risk of failing step one of the goodwill impairment test, which compares the fair value of the reporting unit to its carrying value including goodwill.
Derivative Financial InstrumentsWe utilize various derivative instruments to manage our exposure to interest rate risk and commodity price risk. We record derivative instruments in the consolidated balance sheets at fair value, and apply hedge accounting when appropriate. We record changes to the fair values of derivative instruments in earnings for fair value hedges or as part of “Accumulated other comprehensive income” (AOCI) for the effective portion of cash flow hedges. We reclassify the effective portion of cash flow hedges from AOCI to earnings when the underlying forecasted transaction occurs or becomes probable not to occur. We recognize ineffectiveness resulting from our derivatives immediately in earnings. With respect to cash flow hedges, we must exercise judgment to assess the probability of the forecasted transaction, which, among other things, depends upon market factors and our ability to reliably operate our assets.
Environmental LiabilitiesEnvironmental remediation costs are expensed and an associated accrual is established when site restoration and environmental remediation and cleanup obligations are either known or considered probable and can be reasonably estimated. These environmental obligations are based on estimates of probable undiscounted future costs over a 20-year time period using currently available technology and applying current regulations, as well as our own internal environmental policies. The environmental liabilities have not been reduced by possible recoveries from third parties. Environmental costs include initial site surveys, costs for remediation and restoration and ongoing monitoring costs, as well as fines, damages and other costs, when estimable. Adjustments to initial estimates are recorded, from time to time, to reflect changing circumstances and estimates based upon additional information developed in subsequent periods. Environmental liabilities are difficult to assess and estimate due to unknown factors, such as the timing and extent of remediation, the determination of our liability in proportion to other parties, improvements in cleanup technologies and the extent to which environmental laws and regulations may change in the future. We believe that we have adequately accrued for our environmental exposures.
ContingenciesWe accrue for costs relating to litigation, claims and other contingent matters, including tax contingencies, when such liabilities become probable and reasonably estimable. Such estimates may be based on advice from third parties or on management’s judgment, as appropriate. Due to the inherent uncertainty of litigation, actual amounts paid may differ from amounts estimated, and such differences will be charged to income in the period when final determination is made.
NEW ACCOUNTING PRONOUNCEMENTSPlease refer to Note 3 of the Notes to Consolidated Financial Statements in Item 8. “Financial Statements and Supplementary Data” for a discussion of new accounting pronouncements.

Table of Contents
53
ITEM 7A. QUANTITATIVE AND QUALITATIVE DISCLOSURES ABOUT MARKET RISK
Interest Rate RiskWe manage our exposure to changing interest rates principally through the use of a combination of fixed-rate debt and variable-rate debt. In addition, we utilize forward-starting interest rate swap agreements to lock in the rate on the interest payments related to forecasted debt issuances. Borrowings under our variable rate debt expose us to increases in interest rates.
During the year ended December 31, 2015, we entered into forward-starting interest rate swap agreements, with a notional amount of $600.0 million. Please refer to Note 2 and Note 17 of the Notes to Consolidated Financial Statements in Item 8. “Financial Statements and Supplemental Data” for a more detailed discussion of our interest rate swaps. The following tables present principal cash flows and related weighted-average interest rates by expected maturity dates for our long-term debt:
December 31, 2015 Expected Maturity Dates
2016 2017 2018 2019 2020There-after Total
FairValue
(Thousands of Dollars, Except Interest Rates)
Long-term Debt:Fixed rate $ — $ — $350,000 $ — $450,000 $952,500 $1,752,500 $1,626,785Weighted-average
interest rate — — 8.2% — 4.8% 6.6% 6.4%Variable rate $ — $ — $ 53,500 $882,664 $ — $365,440 $1,301,604 $1,302,653Weighted-average
interest rate — — 1.2% 2.1% — 0.1% 1.5%
December 31, 2014 Expected Maturity Dates
2015 2016 2017 2018 2019There-after Total
FairValue
(Thousands of Dollars, Except Interest Rates)
Long-term Debt:Fixed rate $ — $ — $ — $ 350,000 $ — $ 1,402,500 $1,752,500 $1,796,536Weighted-average
interest rate — — — 8.2% — 6.0% 6.4%Variable rate $ — $ — $ — $ — $ 601,496 $ 365,440 $ 966,936 $ 967,706Weighted-average
interest rate — — — — 2.0% 0.1% 1.2%
The following table presents information regarding our forward-starting interest rate swap agreements:
Notional Amount Fair ValueDecember 31, 2015 Period of Hedge Weighted-Average Fixed Rate December 31, 2015
(Thousands of Dollars) (Thousands of Dollars)
$ 350,000 04/2018 - 04/2028 2.6% $ 140250,000 09/2020 - 09/2030 2.8% 1,163
$ 600,000 2.7% $ 1,303

Table of Contents
54
Commodity Price RiskSince the operations of our fuels marketing segment expose us to commodity price risk, we use derivative instruments to attempt to mitigate the effects of commodity price fluctuations. The derivative instruments we use consist primarily of commodity futures and swap contracts. Please refer to our derivative financial instruments accounting policy in Note 2 of the Notes to Consolidated Financial Statements in Item 8. “Financial Statements and Supplemental Data” for further information on our various types of derivatives.
We have a risk management committee that oversees our trading policies and procedures and certain aspects of risk management. Our risk management committee also reviews all new risk management strategies in accordance with our risk management policy, as approved by our board of directors.
The commodity contracts disclosed below represent only those contracts exposed to commodity price risk at the end of the period. Please refer to Note 17 of the Notes to Consolidated Financial Statements in Item 8. “Financial Statements and Supplemental Data” for the volume and related fair value of all commodity contracts.
December 31, 2015
ContractVolumes
Weighted Average Fair Value ofCurrent
Asset (Liability)Pay Price Receive Price
(Thousandsof Barrels)
(Thousands ofDollars)
Fair Value Hedges:Futures – long:
(crude oil and refined products) 38 $ 37.85 N/A $ 1Futures – short:
(crude oil and refined products) 59 N/A $ 39.07 $ 68Swaps – long:
(refined products) 129 $ 23.83 N/A $ (18)Swaps – short:
(refined products) 784 N/A $ 26.28 $ 1,864
Economic Hedges and Other Derivatives:Futures – long:
(crude oil and refined products) 87 $ 44.81 N/A $ (48)Futures – short:
(crude oil and refined products) 196 N/A $ 43.54 $ 149Swaps – long:
(refined products) 1,532 $ 28.19 N/A $ (8,529)Swaps – short:
(refined products) 1,435 N/A $ 33.01 $ 14,931Forward purchase contracts:
(crude oil) 248 $ 36.99 N/A $ 193Forward sales contracts:
(crude oil) 248 N/A $ 36.82 $ (235)
Total fair value of open positions exposed to commodity price risk $ 8,376

Table of Contents
55
December 31, 2014
ContractVolumes
Weighted Average Fair Value ofCurrent
Asset (Liability)Pay Price Receive Price
(Thousandsof Barrels)
(Thousands ofDollars)
Fair Value Hedges:Futures – long:
(crude oil) 162 $ 59.82 N/A $ (1,060)Futures – short:
(crude oil) 169 N/A $ 59.56 $ 1,064Swaps – long:
(crude oil and refined products) 251 $ 48.86 N/A $ (1,341)Swaps – short:
(crude oil and refined products) 1,005 N/A $ 55.66 $ 11,861
Economic Hedges and Other Derivatives:Futures – long:
(refined products) 24 $ 75.91 N/A $ 26Swaps – long:
(refined products) 106 $ 44.97 N/A $ (120)Swaps – short:
(crude oil and refined products) 50 N/A $ 54.98 $ 553Forward purchase contracts:
(crude oil) 812 $ 65.81 N/A $ (11,624)Forward sales contracts:
(crude oil) 812 N/A $ 65.95 $ 12,109
Total fair value of open positions exposed to commodity price risk $ 11,468

Table of Contents
56
ITEM 8. FINANCIAL STATEMENTS AND SUPPLEMENTARY DATA
Management’s Report on Internal Control over Financial Reporting
Our management is responsible for establishing and maintaining effective internal control over financial reporting as defined in Rule 13a-15(f) under the Securities Exchange Act of 1934. Our management assessed the effectiveness of NuStar Energy L.P’s internal control over financial reporting as of December 31, 2015. In its evaluation, management used the criteria set forth by the Committee of Sponsoring Organization of the Treadway Commission (COSO) in Internal Control-Integrated Framework (2013). Based on this assessment, management believes that, as of December 31, 2015, our internal control over financial reporting was effective based on those criteria.
Because of its inherent limitations, internal control over financial reporting may not prevent or detect misstatements. Therefore, even those systems determined to be effective can provide only reasonable assurance with respect to financial statement preparation and presentation.
The effectiveness of internal control over financial reporting as of December 31, 2015 has been audited by KPMG LLP, the independent registered public accounting firm who audited our consolidated financial statements included in this Form 10-K. KPMG LLP’s attestation on the effectiveness of our internal control over financial reporting appears on page 58.

Table of Contents
57
Report of Independent Registered Public Accounting Firm
The Board of Directors of NuStar GP, LLCand Unitholders of NuStar Energy L.P.:
We have audited the accompanying consolidated balance sheets of NuStar Energy L.P. (a Delaware limited partnership) and subsidiaries (the Partnership) as of December 31, 2015 and 2014, and the related consolidated statements of income (loss), comprehensive income (loss), partners’ equity, and cash flows for each of the years in the three-year period ended December 31, 2015. These consolidated financial statements are the responsibility of the Partnership’s management. Our responsibility is to express an opinion on these consolidated financial statements based on our audits.
We conducted our audits in accordance with the standards of the Public Company Accounting Oversight Board (United States). Those standards require that we plan and perform the audit to obtain reasonable assurance about whether the financial statements are free of material misstatement. An audit includes examining, on a test basis, evidence supporting the amounts and disclosures in the financial statements. An audit also includes assessing the accounting principles used and significant estimates made by management, as well as evaluating the overall financial statement presentation. We believe that our audits provide a reasonable basis for our opinion.
In our opinion, the consolidated financial statements referred to above present fairly, in all material respects, the financial position of NuStar Energy L.P. and subsidiaries as of December 31, 2015 and 2014, and the results of their operations and their cash flows for each of the years in the three-year period ended December 31, 2015, in conformity with U.S. generally accepted accounting principles.
We also have audited, in accordance with the standards of the Public Company Accounting Oversight Board (United States), NuStar Energy L.P. and subsidiaries’ internal control over financial reporting as of December 31, 2015, based on criteria established in Internal Control—Integrated Framework (2013) issued by the Committee of Sponsoring Organizations of the Treadway Commission (COSO), and our report dated February 25, 2016 expressed an unqualified opinion on the effectiveness of the Partnership’s internal control over financial reporting.
/s/ KPMG LLP
San Antonio, TexasFebruary 25, 2016

Table of Contents
58
Report of Independent Registered Public Accounting Firm
The Board of Directors of NuStar GP, LLCand Unitholders of NuStar Energy L.P.:
We have audited NuStar Energy L.P. (a Delaware limited partnership) and subsidiaries’ (the Partnership’s) internal control over financial reporting as of December 31, 2015, based on criteria established in Internal Control – Integrated Framework (2013) issued by the Committee of Sponsoring Organizations of the Treadway Commission (COSO). The Partnership’s management is responsible for maintaining effective internal control over financial reporting and for its assessment of the effectiveness of internal control over financial reporting, included in the accompanying Management’s Report on Internal Control over Financial Reporting. Our responsibility is to express an opinion on the Partnership’s internal control over financial reporting based on our audit.
We conducted our audit in accordance with the standards of the Public Company Accounting Oversight Board (United States). Those standards require that we plan and perform the audit to obtain reasonable assurance about whether effective internal control over financial reporting was maintained in all material respects. Our audit included obtaining an understanding of internal control over financial reporting, assessing the risk that a material weakness exists, and testing and evaluating the design and operating effectiveness of internal control based on the assessed risk. Our audit also included performing such other procedures as we considered necessary in the circumstances. We believe that our audit provides a reasonable basis for our opinion.
A company’s internal control over financial reporting is a process designed to provide reasonable assurance regarding the reliability of financial reporting and the preparation of financial statements for external purposes in accordance with generally accepted accounting principles. A company’s internal control over financial reporting includes those policies and procedures that (1) pertain to the maintenance of records that, in reasonable detail, accurately and fairly reflect the transactions and dispositions of the assets of the company; (2) provide reasonable assurance that transactions are recorded as necessary to permit preparation of financial statements in accordance with generally accepted accounting principles, and that receipts and expenditures of the company are being made only in accordance with authorizations of management and directors of the company; and (3) provide reasonable assurance regarding prevention or timely detection of unauthorized acquisition, use, or disposition of the company’s assets that could have a material effect on the financial statements.
Because of its inherent limitations, internal control over financial reporting may not prevent or detect misstatements. Also, projections of any evaluation of effectiveness to future periods are subject to the risk that controls may become inadequate because of changes in conditions, or that the degree of compliance with the policies or procedures may deteriorate.
In our opinion, NuStar Energy L.P. and subsidiaries maintained, in all material respects, effective internal control over financial reporting as of December 31, 2015, based on criteria established in Internal Control – Integrated Framework (2013) issued by COSO.
We also have audited, in accordance with the standards of the Public Company Accounting Oversight Board (United States), the consolidated balance sheets of NuStar Energy L.P. and subsidiaries as of December 31, 2015 and 2014, and the related consolidated statements of income (loss), comprehensive income (loss), partners’ equity, and cash flows for each of the years in the three-year period ended December 31, 2015, and our report dated February 25, 2016 expressed an unqualified opinion on those consolidated financial statements.
/s/ KPMG LLP
San Antonio, TexasFebruary 25, 2016

Table of Contents
59
NUSTAR ENERGY L.P. AND SUBSIDIARIESCONSOLIDATED BALANCE SHEETS(Thousands of Dollars, Except Unit Data)
December 31, 2015 2014
AssetsCurrent assets:
Cash and cash equivalents $ 118,862 $ 87,912Accounts receivable, net of allowance for doubtful accounts of $8,473 and $7,808
as of December 31, 2015 and 2014, respectively 145,064 208,314Receivable from related parties — 164Inventories 38,749 55,713Other current assets 31,176 35,944Assets held for sale — 1,100
Total current assets 333,851 389,147Property, plant and equipment, at cost 5,209,160 4,815,396Accumulated depreciation and amortization (1,525,589) (1,354,664)
Property, plant and equipment, net 3,683,571 3,460,732Intangible assets, net 112,011 58,670Goodwill 696,637 617,429Investment in joint venture — 74,223Deferred income tax asset 2,858 4,429Other long-term assets, net 320,334 314,166
Total assets $ 5,149,262 $ 4,918,796Liabilities and Partners’ Equity
Current liabilities:Accounts payable $ 125,147 $ 162,056Payable to related party 14,799 15,128Short-term debt 84,000 77,000Accrued interest payable 34,286 33,345Accrued liabilities 55,194 61,025Taxes other than income tax 12,810 14,121Income tax payable 5,977 2,517
Total current liabilities 332,213 365,192Long-term debt 3,079,349 2,749,452Long-term payable to related party 32,080 33,537Deferred income tax liability 24,810 27,308Other long-term liabilities 70,966 27,097Commitments and contingencies (Note 15)Partners’ equity:
Limited partners (77,886,078 common units outstandingas of December 31, 2015 and 2014) 1,661,900 1,744,810
General partner 36,738 39,312Accumulated other comprehensive loss (88,794) (67,912)
Total partners’ equity 1,609,844 1,716,210Total liabilities and partners’ equity $ 5,149,262 $ 4,918,796
See Notes to Consolidated Financial Statements.

Table of Contents
60
NUSTAR ENERGY L.P. AND SUBSIDIARIESCONSOLIDATED STATEMENTS OF INCOME (LOSS)
(Thousands of Dollars, Except Unit and Per Unit Data)
Year Ended December 31, 2015 2014 2013
Revenues:Service revenues $ 1,114,153 $ 1,026,446 $ 938,138Product sales 969,887 2,048,672 2,525,594
Total revenues 2,084,040 3,075,118 3,463,732Costs and expenses:
Cost of product sales 907,574 1,967,528 2,453,997Operating expenses:
Third parties 337,466 347,189 331,719Related party 135,565 125,736 122,677
Total operating expenses 473,031 472,925 454,396General and administrative expenses:
Third parties 35,752 29,146 32,484Related party 66,769 66,910 58,602
Total general and administrative expenses 102,521 96,056 91,086Depreciation and amortization expense 210,210 191,708 178,921Goodwill impairment loss — — 304,453
Total costs and expenses 1,693,336 2,728,217 3,482,853Operating income (loss) 390,704 346,901 (19,121)
Equity in earnings (loss) of joint ventures — 4,796 (39,970)Interest expense, net (131,868) (132,281) (127,119)Interest income from related party — 1,055 6,113Other income, net 61,822 4,499 7,341
Income (loss) from continuing operations before income tax expense 320,658 224,970 (172,756)Income tax expense 14,712 10,801 12,753
Income (loss) from continuing operations 305,946 214,169 (185,509)Income (loss) from discontinued operations, net of tax 774 (3,791) (99,162)
Net income (loss) 306,720 210,378 (284,671)Less loss attributable to noncontrolling interest — (395) (10,901)
Net income (loss) attributable to NuStar Energy L.P. $ 306,720 $ 210,773 $ (273,770)
Net income (loss) per unit applicable to limited partners:Continuing operations $ 3.29 $ 2.14 $ (2.89)Discontinued operations 0.01 (0.04) (1.11)
Total (Note 22) $ 3.30 $ 2.10 $ (4.00)
Weighted-average limited partner units outstanding 77,886,078 77,886,078 77,886,078
See Notes to Consolidated Financial Statements.

Table of Contents
61
NUSTAR ENERGY L.P. AND SUBSIDIARIESCONSOLIDATED STATEMENTS OF COMPREHENSIVE INCOME (LOSS)
(Thousands of Dollars)
Year Ended December 31,2015 2014 2013
Net income (loss) $ 306,720 $ 210,378 $ (284,671)
Other comprehensive loss:Foreign currency translation adjustment (31,987) (15,614) (19,364)Net unrealized gain on cash flow hedges 1,303 — 7,213Net loss reclassified into income on cash flow hedges 9,802 10,663 7,570
Total other comprehensive loss (20,882) (4,951) (4,581)
Comprehensive income (loss) 285,838 205,427 (289,252)Less comprehensive loss attributable to noncontrolling interest — (828) (10,953)
Comprehensive income (loss) attributable to NuStar Energy L.P. $ 285,838 $ 206,255 $ (278,299)
See Notes to Consolidated Financial Statements.

Table of Contents
62
NUSTAR ENERGY L.P. AND SUBSIDIARIESCONSOLIDATED STATEMENTS OF CASH FLOWS
(Thousands of Dollars)
Year Ended December 31, 2015 2014 2013
Cash Flows from Operating Activities:Net income (loss) $ 306,720 $ 210,378 $ (284,671)Adjustments to reconcile net income (loss) to net cash provided by
operating activities:Depreciation and amortization expense 210,210 191,708 184,363Amortization of debt related items 8,840 8,969 4,329Gain on sale or disposition of assets (1,617) (3,853) (7,829)Gain associated with the Linden Acquisition (56,277) — —Asset and goodwill impairment loss — 4,201 406,982Deferred income tax expense (benefit) 2,058 3,467 (6,739)Equity in (earnings) loss of joint ventures — (4,796) 39,970Distributions of equity in earnings of joint ventures 2,500 7,587 7,956Changes in current assets and current liabilities (Note 23) 50,559 82,418 112,776Other, net 1,944 18,444 28,082
Net cash provided by operating activities 524,937 518,523 485,219
Cash Flows from Investing Activities:Capital expenditures (324,808) (356,965) (343,320)Change in accounts payable related to capital expenditures (3,156) 4,903 (5,384)Acquisitions (142,500) — —Increase in other long-term assets (3,564) — —Proceeds from sale or disposition of assets 17,132 26,012 119,006Proceeds from insurance recoveries 4,867 — —Increase in note receivable from Axeon — (13,328) (80,961)Other, net — (853) (302)
Net cash used in investing activities (452,029) (340,231) (310,961)
Cash Flows from Financing Activities:Proceeds from long-term debt borrowings 860,131 743,719 1,738,451Proceeds from short-term debt borrowings 823,500 574,900 —Proceeds from note offering, net of issuance costs — — 686,863Long-term debt repayments (500,410) (623,770) (2,150,743)Short-term debt repayments (816,500) (497,900) —Distributions to unitholders and general partner (392,204) (392,204) (392,204)Payments for termination of interest rate swaps — — (33,697)(Decrease) increase in cash book overdrafts (2,954) 12,851 2,851Other, net (792) (5,781) (871)
Net cash used in financing activities (29,229) (188,185) (149,350)
Effect of foreign exchange rate changes on cash (12,729) (2,938) (7,767)Net increase (decrease) in cash and cash equivalents 30,950 (12,831) 17,141Cash and cash equivalents as of the beginning of the period 87,912 100,743 83,602Cash and cash equivalents as of the end of the period $ 118,862 $ 87,912 $ 100,743
See Notes to Consolidated Financial Statements.

Table of Contents
63
NUSTAR ENERGY L.P. AND SUBSIDIARIESCONSOLIDATED STATEMENTS OF PARTNERS’ EQUITY
Years Ended December 31, 2015, 2014 and 2013 (Thousands of Dollars, Except Unit Data)
Limited Partners GeneralPartner
Accumulated Other
Comprehensive Loss
Total NuStarEnergy L.P.
Partners’Equity
NoncontrollingInterest
Total Partners’
Equity Units Amount
Balance as of January 1, 2013 77,886,078 $ 2,573,263 $ 57,986 $ (58,865) $ 2,572,384 $ 12,611 $ 2,584,995Net (loss) income — (310,652) 36,882 — (273,770) (10,901) (284,671)Other comprehensive
loss — — — (4,529) (4,529) (52) (4,581)Cash distributions
to partners — (341,140) (51,064) — (392,204) — (392,204)Other — 255 — — 255 — 255
Balance as ofDecember 31, 2013 77,886,078 1,921,726 43,804 (63,394) 1,902,136 1,658 1,903,794Net income (loss) — 164,201 46,572 — 210,773 (395) 210,378Other comprehensive
loss — — — (4,518) (4,518) (433) (4,951)Cash distributions
to partners — (341,140) (51,064) — (392,204) — (392,204)Other — 23 — — 23 (830) (807)
Balance as of December 31, 2014 77,886,078 1,744,810 39,312 (67,912) 1,716,210 — 1,716,210Net income — 258,230 48,490 — 306,720 — 306,720Other comprehensive
loss — — — (20,882) (20,882) — (20,882)Cash distributions
to partners — (341,140) (51,064) — (392,204) — (392,204)Balance as ofDecember 31, 2015 77,886,078 $ 1,661,900 $ 36,738 $ (88,794) $ 1,609,844 $ — $ 1,609,844
See Notes to Consolidated Financial Statements.

Table of Contents
64
NUSTAR ENERGY L.P. AND SUBSIDIARIESNOTES TO CONSOLIDATED FINANCIAL STATEMENTS
Years Ended December 31, 2015, 2014 and 2013
1. ORGANIZATION AND OPERATIONS
OrganizationNuStar Energy L.P. (NYSE: NS) is engaged in the transportation of petroleum products and anhydrous ammonia, the terminalling and storage of petroleum products and the marketing of petroleum products. Unless otherwise indicated, the terms “NuStar Energy,” “NS,” “the Partnership,” “we,” “our” and “us” are used in this report to refer to NuStar Energy L.P., to one or more of our consolidated subsidiaries or to all of them taken as a whole. NuStar GP Holdings, LLC (NuStar GP Holdings or NSH) (NYSE: NSH) owns our general partner, Riverwalk Logistics, L.P., and owns a 14.9% total interest in us as of December 31, 2015.
OperationsWe conduct our operations through our subsidiaries, primarily NuStar Logistics, L.P. (NuStar Logistics) and NuStar Pipeline Operating Partnership L.P. (NuPOP). We have three business segments: pipeline, storage and fuels marketing.
Pipeline. We own 3,140 miles of refined product pipelines and 1,200 miles of crude oil pipelines, as well as approximately 4.0 million barrels of storage capacity, which comprise our Central West System. In addition, we own 2,360 miles of refined product pipelines, consisting of the East and North Pipelines, and a 2,000 mile ammonia pipeline, which comprise our Central East System. The East and North Pipelines have storage capacity of approximately 6.4 million barrels. We charge tariffs on a per barrel basis for transporting refined products, crude oil and other feedstocks in our refined product and crude oil pipelines and on a per ton basis for transporting anhydrous ammonia in the Ammonia Pipeline.
Storage. We own terminal and storage facilities in the United States, Canada, Mexico, the Netherlands, including St. Eustatius in the Caribbean, and the United Kingdom, with approximately 82.9 million barrels of storage capacity. Our terminal and storage facilities provide storage, handling and other services on a fee basis for petroleum products, crude oil, specialty chemicals and other liquids.
Fuels Marketing. Within our fuels marketing operations, we purchase crude oil and refined petroleum products for resale. The activities of the fuels marketing segment expose us to the risk of fluctuations in commodity prices, which has a direct impact on the segment’s results of operations. We enter into derivative contracts to attempt to mitigate the effect of commodity price fluctuations.
2. SUMMARY OF SIGNIFICANT ACCOUNTING POLICIES
ConsolidationThe accompanying consolidated financial statements represent the consolidated operations of the Partnership and our subsidiaries. Noncontrolling interests are separately disclosed on the financial statements. Inter-partnership balances and transactions have been eliminated in consolidation. The operations of certain pipelines and terminals in which we own an undivided interest are proportionately consolidated in the accompanying consolidated financial statements.
Use of EstimatesThe preparation of consolidated financial statements in conformity with U.S. generally accepted accounting principles (GAAP) requires management to make estimates and assumptions that affect the amounts reported in the consolidated financial statements and accompanying notes. Actual results could differ from those estimates. On an ongoing basis, management reviews their estimates based on currently available information. Management may revise estimates due to changes in facts and circumstances.
Cash and Cash EquivalentsCash equivalents are all highly liquid investments with an original maturity of three months or less when acquired.
Accounts ReceivableAccounts receivable represent valid claims against non-affiliated customers for products sold or services rendered. We extend credit terms to certain customers after review of various credit indicators, including the customer’s credit rating. Outstanding customer receivable balances are regularly reviewed for possible non-payment indicators and allowances for doubtful accounts are recorded based upon management’s estimate of collectability at the time of their review.

Table of Contents NUSTAR ENERGY L.P. AND SUBSIDIARIES
NOTES TO CONSOLIDATED FINANCIAL STATEMENTS – (Continued)
65
InventoriesInventories consist of crude oil, refined petroleum products, and materials and supplies. Inventories, except those associated with a qualifying fair value hedge, are valued at the lower of cost or market. Cost is determined using the weighted-average cost method. Our inventory, other than materials and supplies, consists of one end-product category, petroleum products, which we include in the fuels marketing segment. Accordingly, we determine lower of cost or market adjustments on an aggregate basis. Inventories associated with qualifying fair value hedges are valued at current market prices. Materials and supplies are valued at the lower of average cost or market.
Property, Plant and EquipmentWe record additions to property, plant and equipment, including reliability and strategic capital expenditures, at cost. Repair and maintenance costs associated with existing assets that are minor in nature and do not extend the useful life of existing assets are charged to operating expenses as incurred. Depreciation of property, plant and equipment is recorded on a straight-line basis over the estimated useful lives of the related assets. When property or equipment is retired, sold or otherwise disposed of, the difference between the carrying value and the net proceeds is recognized in “Other income, net” in the consolidated statements of income in the year of disposition.
We capitalize overhead costs and interest costs incurred on funds used to construct property, plant and equipment while the asset is under construction. The overhead costs and capitalized interest are recorded as part of the asset to which it relates and is amortized over the asset’s estimated useful life as a component of depreciation expense.
GoodwillWe assess goodwill for impairment annually on October 1, or more frequently if events or changes in circumstances indicate it might be impaired. We have the option to first assess qualitative factors to determine whether it is necessary to perform a quantitative goodwill impairment test. We performed a quantitative goodwill impairment test as of October 1, 2015 and 2014, and we determined that no impairment charges occurred. See Note 11 for a discussion of the goodwill impairment recognized in 2013.
We calculate the estimated fair value of each of our reporting units using a weighted-average of values calculated using an income approach and a market approach. The income approach involves estimating the fair value of each reporting unit by discounting its estimated future cash flows using a discount rate that would be consistent with a market participant’s assumption. The market approach bases the fair value measurement on information obtained from observed stock prices of public companies and recent merger and acquisition transaction data of comparable entities.
Our reporting units to which goodwill has been allocated consist of the following:• crude oil pipelines;• refined product pipelines;• refined product terminals, excluding our St. Eustatius and Point Tupper facilities; and• bunkering activity at our St. Eustatius and Point Tupper facilities.
The quantitative impairment test for goodwill consists of a two-step process. Step 1 compares the fair value of the reporting unit to its carrying value including goodwill. The carrying value of each reporting unit equals the total identified assets (including goodwill) less the sum of each reporting unit’s identified liabilities. We used reasonable and supportable methods to assign the assets and liabilities to the appropriate reporting units in a consistent manner. If the carrying value exceeds fair value, there is a potential impairment and step 2 must be performed to determine the amount of goodwill impairment. Step 2 compares the carrying value of the reporting unit’s goodwill to its implied fair value using a hypothetical allocation of the reporting unit’s fair value. If the goodwill carrying value exceeds its implied fair value, the excess is reported as impairment.
Investment in Joint VenturesWe account for investment in the joint ventures using the equity method of accounting. We reported our ownership interest in our equity method investments within “Investment in joint ventures” on the consolidated balance sheet and our portion of the results of operations for our equity method investments in “Equity in earnings (loss) of joint ventures” in the consolidated statements of income (loss). On January 2, 2015, we acquired full ownership of ST Linden Terminal, LLC (Linden), which owns a refined products terminal in Linden, NJ with 4.3 million barrels of storage capacity (the Linden Acquisition). See Note 4 for additional information on the Linden Acquisition. On February 26, 2014, we sold our remaining 50% ownership interest in Axeon Specialty Products LLC. See Note 5 for additional discussion.

Table of Contents NUSTAR ENERGY L.P. AND SUBSIDIARIES
NOTES TO CONSOLIDATED FINANCIAL STATEMENTS – (Continued)
66
Impairment of Long-Lived AssetsWe review long-lived assets, including property, plant and equipment, for impairment whenever events or changes in circumstances indicate that the carrying amount may not be recoverable. We evaluate recoverability using undiscounted estimated net cash flows generated by the related asset or asset group. If the results of that evaluation indicate that the undiscounted cash flows are less than the carrying amount of the asset (i.e., the asset is not recoverable) we perform an impairment analysis. If our intent is to hold the asset for continued use, we determine the amount of impairment as the amount by which the net carrying value exceeds its fair value. If our intent is to sell the asset, and the criteria required to classify an asset as held for sale are met, we determine the amount of impairment as the amount by which the net carrying amount exceeds its fair value less costs to sell. We believe that the carrying amounts of our long-lived assets as of December 31, 2015 are recoverable. See Note 5 for a discussion of impairments of long-lived assets recognized in 2013.
Income TaxesWe are a limited partnership and generally are not subject to federal or state income taxes. Accordingly, our taxable income or loss, which may vary substantially from income or loss reported for financial reporting purposes, is generally included in the federal and state income tax returns of our partners. For transfers of publicly held units subsequent to our initial public offering, we have made an election permitted by Section 754 of the Internal Revenue Code (the Code) to adjust the common unit purchaser’s tax basis in our underlying assets to reflect the purchase price of the units. This results in an allocation of taxable income and expenses to the purchaser of the common units, including depreciation deductions and gains and losses on sales of assets, based upon the new unitholder’s purchase price for the common units.
We conduct certain of our operations through taxable wholly owned corporate subsidiaries. We account for income taxes related to our taxable subsidiaries using the asset and liability method. Under this method, we recognize deferred tax assets and liabilities for the future tax consequences attributable to differences between the financial statement carrying amounts of existing assets and liabilities and their respective tax bases. We measure deferred taxes using enacted tax rates expected to apply to taxable income in the year those temporary differences are expected to be recovered or settled.
We recognize a tax position if it is more-likely-than-not that the tax position will be sustained, based on the technical merits of the position, upon examination. We record uncertain tax positions in the financial statements at the largest amount of benefit that is more-likely-than-not to be realized. We had no unrecognized tax benefits as of December 31, 2015 and 2014. NuStar Energy and certain of its subsidiaries file income tax returns in the U.S. federal jurisdiction and various state and foreign jurisdictions. For U.S. federal and state purposes, as well as for our major non-U.S. jurisdictions, tax years subject to examination are 2011 through 2014, according to standard statute of limitations.
Asset Retirement ObligationsWe record a liability for asset retirement obligations at the fair value of the estimated costs to retire a tangible long-lived asset at the time we incur that liability, which is generally when the asset is purchased, constructed or leased, when we have a legal obligation to incur costs to retire the asset and when a reasonable estimate of the fair value of the obligation can be made. If a reasonable estimate cannot be made at the time the liability is incurred, we record the liability when sufficient information is available to estimate the fair value.
We have asset retirement obligations with respect to certain of our assets due to various legal obligations to clean and/or dispose of those assets at the time they are retired. However, these assets can be used for an extended and indeterminate period of time as long as they are properly maintained and/or upgraded. It is our practice and current intent to maintain our assets and continue making improvements to those assets based on technological advances. As a result, we believe that our assets have indeterminate lives for purposes of estimating asset retirement obligations because dates or ranges of dates upon which we would retire these assets cannot reasonably be estimated at this time. When a date or range of dates can reasonably be estimated for the retirement of any asset, we estimate the costs of performing the retirement activities and record a liability for the fair value of these costs.
We also have legal obligations in the form of leases and right-of-way agreements, which require us to remove certain of our assets upon termination of the agreement. However, these lease or right-of-way agreements generally contain automatic renewal provisions that extend our rights indefinitely or we have other legal means available to extend our rights. We have recorded a liability of approximately $0.6 million and $0.8 million as of December 31, 2015 and 2014, respectively, which is included in “Other long-term liabilities” in the consolidated balance sheets, for conditional asset retirement obligations related to the retirement of terminal assets with lease and right-of-way agreements.

Table of Contents NUSTAR ENERGY L.P. AND SUBSIDIARIES
NOTES TO CONSOLIDATED FINANCIAL STATEMENTS – (Continued)
67
Environmental Remediation CostsEnvironmental remediation costs are expensed and an associated accrual established when site restoration and environmental remediation and cleanup obligations are either known or considered probable and can be reasonably estimated. These environmental obligations are based on estimates of probable undiscounted future costs over a 20-year time period using currently available technology and applying current regulations, as well as our own internal environmental policies. The environmental liabilities have not been reduced by possible recoveries from third parties. Environmental costs include initial site surveys, costs for remediation and restoration and ongoing monitoring costs, as well as fines, damages and other costs, when estimable. Adjustments to initial estimates are recorded, from time to time, to reflect changing circumstances and estimates based upon additional information developed in subsequent periods.
Product ImbalancesWe incur product imbalances as a result of variances in pipeline meter readings and volume fluctuations within the East Pipeline system due to pressure and temperature changes. We use quoted market prices as of the reporting date to value our assets and liabilities related to product imbalances. Product imbalance liabilities are included in “Accrued liabilities” and product imbalance assets are included in “Other current assets” in the consolidated balance sheets.
Revenue RecognitionRevenues for the pipeline segment are derived from interstate and intrastate pipeline transportation of refined product, crude oil and anhydrous ammonia. Transportation revenues (based on pipeline tariffs) are recognized as the refined product, crude oil or anhydrous ammonia is delivered out of the pipelines.
Revenues for the storage segment include fees for tank storage agreements, whereby a customer agrees to pay for a certain amount of storage in a tank over a period of time (storage lease revenues), and throughput agreements, whereby a customer pays a fee per barrel for volumes moving through our terminals for which we charge additional fees (throughput revenues). Our terminals also provide blending, additive injections, handling and filtering services for which we charge additional fees. Certain of our facilities charge fees to provide marine services such as pilotage, tug assistance, line handling, launch service, emergency response services and other ship services. Storage lease revenues are recognized when services are provided to the customer. Throughput revenues are recognized as refined products or crude oil are received in or delivered out of our terminal and as crude oil and certain other refinery feedstocks are received by the related refinery. Revenues for marine services are recognized as those services are provided.
Revenues from the sale of petroleum products, which are included in our fuels marketing segment, are recognized when product is delivered to the customer and title and risk pass to the customer.
We collect taxes on certain revenue transactions to be remitted to governmental authorities, which may include sales, use, value added and some excise taxes. These taxes are not included in revenue.
Income AllocationOur net income for each quarterly reporting period is first allocated to the general partner in an amount equal to the general partner’s incentive distribution calculated based upon the declared distribution for the respective reporting period. We allocate the remaining net income among the limited and general partners in accordance with their respective 98% and 2% interests.
Net Income per Unit Applicable to Limited PartnersWe have identified the general partner interest and incentive distribution rights as participating securities and use the two-class method when calculating the net income per unit applicable to limited partners, which is based on the weighted-average number of common units outstanding during the period. Basic and diluted net income per unit applicable to limited partners are the same as we have no potentially dilutive securities outstanding.
Derivative Financial InstrumentsWe formally document all relationships between hedging instruments and hedged items. This process includes identification of the hedging instrument and the hedged transaction, the nature of the risk being hedged and how the hedging instrument’s effectiveness will be assessed. To qualify for hedge accounting, at inception of the hedge we assess whether the derivative instruments that are used in our hedging transactions are expected to be highly effective in offsetting changes in cash flows or the fair value of the hedged items. Throughout the designated hedge period and at least quarterly, we assess whether the derivative instruments are highly effective and continue to qualify for hedge accounting. To assess the effectiveness of the hedging relationship both prospectively and retrospectively, we use regression analysis to calculate the correlation of the changes in the fair values of the derivative instrument and related hedged item.

Table of Contents NUSTAR ENERGY L.P. AND SUBSIDIARIES
NOTES TO CONSOLIDATED FINANCIAL STATEMENTS – (Continued)
68
We record commodity derivative instruments in the consolidated balance sheets at fair value. We recognize mark-to-market adjustments for derivative instruments designated and qualifying as fair value hedges (Fair Value Hedges) and the related change in the fair value of the associated hedged physical inventory or firm commitment within “Cost of product sales.” For derivative instruments designated and qualifying as cash flow hedges (Cash Flow Hedges), we record the effective portion of mark-to-market adjustments as a component of “Accumulated other comprehensive income” (AOCI) until the underlying hedged forecasted transactions occur. Any hedge ineffectiveness is recognized immediately in “Cost of product sales.” Once a hedged transaction occurs, we reclassify the effective portion from AOCI to “Cost of product sales.” If it becomes probable that a hedged transaction will not occur, then the associated gains or losses are reclassified from AOCI to “Cost of product sales” immediately. For derivative instruments that have associated underlying physical inventory but do not qualify for hedge accounting (Economic Hedges and Other Derivatives), we record the mark-to-market adjustments in “Cost of product sales.”
Under the terms of our forward-starting interest rate swap agreements, we pay a fixed rate and receive a variable rate. We entered into the forward-starting swaps in order to hedge the risk of changes in the interest payments attributable to changes in the benchmark interest rate during the period from the effective date of the swap to the issuance of the forecasted debt. We account for the forward-starting interest rate swaps as Cash Flow Hedges, and we recognize the fair value of each interest rate swap in the consolidated balance sheets. We record the effective portion of mark-to-market adjustments as a component of AOCI, and any hedge ineffectiveness is recognized immediately in “Interest expense, net.” The amount accumulated in AOCI is amortized into “Interest expense, net” as the forecasted interest payments occur or if the interest payments are probable not to occur.
We classify cash flows associated with our derivative instruments as operating cash flows in the consolidated statements of cash flows, except for receipts or payments associated with terminated forward-starting interest rate swap agreements, which are included in cash flows from financing activities. See Note 17 for additional information regarding our derivative financial instruments.
Operating LeasesWe recognize rent expense on a straight-line basis over the lease term, including the impact of both scheduled rent increases and free or reduced rents (commonly referred to as “rent holidays”).
Unit-based CompensationNuStar GP, LLC, a wholly owned subsidiary of NuStar GP Holdings, has adopted various long-term incentive plans that provide the Compensation Committee of the Board of Directors of NuStar GP, LLC with the right to grant employees and directors of NuStar GP, LLC and its affiliates providing services to NuStar Energy the right to receive NS common units. NuStar GP, LLC accounts for awards of NS common unit options, restricted units and performance awards at fair value as a derivative, whereby a liability for the award is recorded at inception. Subsequent changes in the fair value of the award are included in the determination of net income. NuStar GP, LLC determines the fair value of NS unit options using the Black-Scholes model at each reporting date. NuStar GP, LLC determines the fair value of NS restricted units and performance awards using the market price of NS common units at each reporting date. However, performance awards are earned only upon NuStar Energy’s achievement of an objective performance measure. NuStar GP, LLC records compensation expense each reporting period such that the cumulative compensation expense recognized equals the current fair value of the percentage of the award that has vested. NuStar GP, LLC records compensation expense related to NS unit options until such options are exercised, and compensation expense related to NS restricted units until the date of vesting.
NuStar GP Holdings has adopted a long-term incentive plan that provides the Compensation Committee of the Board of Directors of NuStar GP Holdings with the right to grant employees, consultants and directors of NuStar GP Holdings and its affiliates, including NuStar GP, LLC, rights to receive NSH common units. NuStar GP Holdings accounts for awards of NSH restricted units and unit options granted to its directors or employees of NuStar GP, LLC at fair value. The fair value of NSH unit options is determined using the Black-Scholes model at the grant date, and the fair value of the NSH restricted unit equals the market price of NSH common units at the grant date. NuStar GP Holdings recognizes compensation expense for NSH restricted units and unit options ratably over the vesting period based on the fair value of the units at the grant date.
Under these long-term incentive plans, certain awards provide that the grantee’s award vests immediately upon retirement. Compensation expense is recognized immediately if these awards are granted to retirement-eligible employees, as defined in each award. In addition, if, during a vesting period of a grant, the grantee will become retirement-eligible, then compensation expense associated with the grant is recognized from the grant date through the grantee’s retirement eligibility date.
We reimburse NuStar GP, LLC for the expenses resulting from grants of NS and NSH awards under our long-term incentive plans to employees and directors of NuStar GP, LLC. We include such compensation expense in “General and administrative

Table of Contents NUSTAR ENERGY L.P. AND SUBSIDIARIES
NOTES TO CONSOLIDATED FINANCIAL STATEMENTS – (Continued)
69
expenses” on the consolidated statements of income. We do not reimburse NuStar GP, LLC for the expense resulting from NSH awards to non-employee directors of NuStar GP Holdings.
Margin DepositsMargin deposits relate to our exchange-traded derivative contracts and generally vary based on changes in the value of the contracts. Margin deposits are included in “Other current assets” in the consolidated balance sheets.
Foreign Currency TranslationThe functional currencies of our foreign subsidiaries are the local currency of the country in which the subsidiary is located, except for our subsidiaries located in St. Eustatius in the Caribbean (formerly the Netherlands Antilles), whose functional currency is the U.S. dollar. The assets and liabilities of our foreign subsidiaries with local functional currencies are translated to U.S. dollars at period-end exchange rates, and income and expense items are translated to U.S. dollars at weighted-average exchange rates in effect during the period. These translation adjustments are included in “Accumulated other comprehensive loss” in the equity section of the consolidated balance sheets. Gains and losses on foreign currency transactions are included in “Other income, net” in the consolidated statements of income.
3. NEW ACCOUNTING PRONOUNCEMENTS
Financial InstrumentsIn January 2016, the Financial Accounting Standards Board (FASB) issued new guidance that addresses certain aspects of recognition, measurement, presentation and disclosure of financial instruments. The changes are effective for annual and interim periods beginning after December 15, 2017, and amendments should be applied by means of a cumulative-effect adjustment to the balance sheet as of the beginning of the fiscal year of adoption. We will adopt these provisions January 1, 2018, and we do not expect the guidance to have a material impact on our financial position, results of operations or disclosures.
Deferred Taxes In November 2015, the FASB issued amended guidance that requires deferred tax assets and liabilities to be classified as noncurrent on the balance sheet. The changes are effective for annual and interim periods beginning after December 15, 2016, using either a prospective or retrospective transition method, and early adoption is permitted. Accordingly, we adopted these provisions during 2015 on a prospective basis, and they did not have a material impact on our financial position, results of operations or disclosures. Prior periods were not retrospectively adjusted.
Business CombinationsIn September 2015, the FASB issued amended guidance for business combinations that eliminates the requirement to restate prior period financial statements for measurement period adjustments. The new guidance requires that the cumulative impact of a measurement period adjustment be recognized in the reporting period in which the adjustment is identified. The changes are effective for annual and interim periods beginning after December 15, 2015. Accordingly, we adopted the amended guidance on January 1, 2016, and it will not impact our financial position, results of operations or disclosures.
InventoryIn July 2015, the FASB issued amended guidance that requires inventory to be measured at the lower of cost or net realizable value. The changes are effective for annual and interim periods beginning after December 15, 2016, and must be applied prospectively after the date of adoption. We will adopt these provisions January 1, 2017, and we do not expect the amended guidance to have a material impact on our financial position, results of operations or disclosures.
Debt Issuance CostsIn April 2015, the FASB issued amended guidance for the presentation of debt issuance costs. Under the amended guidance, debt issuance costs will be presented on the balance sheet as a deduction from the carrying value of the associated debt liability. In August 2015, the FASB issued amended guidance that would allow debt issuance costs related to line-of-credit agreements to continue to be presented as an asset on the balance sheet. The changes are effective for annual and interim periods beginning after December 15, 2015, and retrospective application is required. Accordingly, we adopted the amended guidance on January 1, 2016 and it will not have a material impact on our financial position, results of operations or disclosures.
ConsolidationIn February 2015, the FASB issued new consolidation guidance that modifies the criterion involved in a reporting organization’s evaluation of whether certain legal entities are subject to consolidation under the standard. The standard is

Table of Contents NUSTAR ENERGY L.P. AND SUBSIDIARIES
NOTES TO CONSOLIDATED FINANCIAL STATEMENTS – (Continued)
70
effective for public companies for annual and interim reporting periods beginning after December 15, 2015, using one of two retrospective transition methods. Accordingly, we adopted the guidance on January 1, 2016, and it will not impact our financial position, results of operations or disclosures.
Revenue RecognitionIn May 2014, the FASB and the International Accounting Standards Board jointly issued a comprehensive new revenue recognition standard. In August 2015, the FASB deferred the effective date by one year. The standard is now effective for public entities for annual and interim periods beginning after December 15, 2017, using one of two retrospective transition methods. Early adoption is permitted, but not before the original effective date. We are currently assessing the impact of this new guidance on our financial statements and disclosures, and we have not yet selected a transition method.
4. ACQUISITIONS
Linden Acquisition. On January 2, 2015, we acquired full ownership of Linden, which owns a refined products terminal in Linden, NJ with 4.3 million barrels of storage capacity. Linden is located on a 44-acre facility that provides deep-water terminalling capabilities in the New York Harbor and primarily stores petroleum products, including gasoline, jet fuel and fuel oils. Prior to the Linden Acquisition, Linden operated as a joint venture between us and Linden Holding Corp., with each party owning 50%.
In connection with the Linden Acquisition, we ceased applying the equity method of accounting and consolidated Linden, which is included in our storage segment. The consolidated statements of income include the results of operations for Linden commencing on January 2, 2015. On the acquisition date, we remeasured our existing 50% equity investment in Linden to its fair value of $128.0 million and we recognized a gain of $56.3 million in “Other income, net” in the consolidated statements of income for the year ended December 31, 2015. We estimated the fair value using a market approach and an income approach. The market approach estimates the enterprise value based on an earnings multiple. The income approach calculates fair value by discounting the estimated net cash flows. We funded the acquisition with borrowings under our revolving credit agreement. The acquisition complements our existing storage operations, and having sole ownership of Linden strengthens our presence in the New York Harbor and the East Coast market.
We accounted for the Linden Acquisition using the acquisition method. The purchase price has been allocated based on the estimated fair values of the individual assets acquired and liabilities assumed at the date of the acquisition.
The final purchase price allocation was as follows (in thousands of dollars):
Cash paid for the Linden Acquisition $ 142,500Fair value of liabilities assumed 22,865
Consideration 165,365Acquisition date fair value of previously held equity interest 128,000
Total $ 293,365
Current assets (a) $ 9,513Property, plant and equipment 134,484Goodwill 79,208Intangible assets (b) 70,050Other long-term assets 110
Purchase price allocation $ 293,365
(a) Current assets include a receivable of $7.8 million related to a pre-acquisition insurance claim, for which proceeds were received in 2015.
(b) Intangible assets primarily consist of customer contracts and relationships and are being amortized over 10 years.

Table of Contents NUSTAR ENERGY L.P. AND SUBSIDIARIES
NOTES TO CONSOLIDATED FINANCIAL STATEMENTS – (Continued)
71
5. DISPOSITIONS
Discontinued OperationsTerminal Dispositions. In January 2015, we sold our terminal in Alamogordo, NM with storage capacity of 0.1 million barrels for proceeds of $1.1 million. We classified the associated property, plant and equipment as “Assets held for sale” on the consolidated balance sheet as of December 31, 2014. In 2014, we divested our terminals in Mobile AL, Wilmington, NC and Dumfries, VA and our 75% interest in our facility in Mersin, Turkey (the Turkey Sale). We recognized a gain of $3.7 million on the Turkey Sale for the year ended December 31, 2014. We presented the results of operations for those facilities as discontinued operations.
We allocated interest expense of $0.8 million and $1.4 million for the years ended December 31, 2014 and 2013, respectively, to discontinued operations based on the ratio of net assets discontinued to consolidated net assets.
In connection with the decision to dispose of these terminal facilities, we determined that the estimated fair value, less cost to sell, was less than the carrying amount of each disposal group, resulting in an impairment loss of $102.5 million for the year ended December 31, 2013. We recorded the impairment loss in “Loss from discontinued operations, net of tax” on the consolidated statement of income. The impairment loss consisted of the following (in thousands of dollars):
Property, plant and equipment, net $ 68,213Intangible assets, net (customer relationships) 6,856Goodwill 27,460
Asset impairment loss $ 102,529
San Antonio Refinery Disposition. On January 1, 2013, we sold our fuels refinery in San Antonio, Texas (the San Antonio Refinery) and related assets for approximately $117.0 million (the San Antonio Refinery Sale) and recognized a gain of $9.3 million on the sale for the year ended December 31, 2013. We presented the results of operations for the San Antonio Refinery and related assets as discontinued operations.
The following table summarizes the results from discontinued operations:
Year Ended December 31, 2015 2014 2013 (Thousands of Dollars)
Revenues $ 208 $ 4,265 $ 7,758Income (loss) before income tax expense $ 774 $ (3,791) $ (106,033)
2014 Asphalt Sale On February 26, 2014, we sold our remaining 50% ownership interest in NuStar Asphalt LLC to Lindsay Goldberg LLC, a private investment firm (the 2014 Asphalt Sale). Effective February 27, 2014, NuStar Asphalt LLC changed its name to Axeon Specialty Products LLC (Axeon). As a result of the 2014 Asphalt Sale, we ceased applying the equity method of accounting. Therefore, the results of our investment in Axeon were reported in “Equity in earnings (loss) of joint ventures” in the consolidated statements of income through February 25, 2014. Upon completion of the 2014 Asphalt Sale, the parties agreed to: (i) convert the $250.0 million unsecured revolving credit facility provided by us to Axeon (the NuStar JV Facility) from a revolving credit agreement into a $190.0 million term loan (the Axeon Term Loan); (ii) terminate the terminal services agreements with respect to our terminals in Rosario, NM, Catoosa, OK and Houston, TX; (iii) amend the terminal services agreements for our terminals in Baltimore, MD and Jacksonville, FL; and (iv) transfer ownership of both the Wilmington, NC and Dumfries, VA terminals to Axeon. We ceased reporting transactions between us and Axeon as related party transactions in our consolidated financial statements on February 26, 2014. See Note 10 for additional information on the Axeon Term Loan.

Table of Contents NUSTAR ENERGY L.P. AND SUBSIDIARIES
NOTES TO CONSOLIDATED FINANCIAL STATEMENTS – (Continued)
72
6. ALLOWANCE FOR DOUBTFUL ACCOUNTS
The changes in the allowance for doubtful accounts consisted of the following:
Year Ended December 31, 2015 2014 2013 (Thousands of Dollars)
Balance as of beginning of year $ 7,808 $ 1,224 $ 808Increase in allowance, net 965 7,649 1,039Accounts charged against the allowance (300) (1,065) (625)Foreign currency translation — — 2
Balance as of end of year $ 8,473 $ 7,808 $ 1,224
7. INVENTORIES
Inventories consisted of the following:
December 31, 2015 2014 (Thousands of Dollars)
Crude oil and refined petroleum products $ 30,154 $ 46,733Materials and supplies 8,595 8,980
Total $ 38,749 $ 55,713
We purchase crude oil and refined petroleum products for resale. Our refined petroleum products consist of intermediates, gasoline, distillates and other petroleum products. Materials and supplies mainly consist of blending and additive chemicals and maintenance materials used in our pipeline and storage segments.
8. OTHER CURRENT ASSETS
Other current assets consisted of the following:
December 31, 2015 2014 (Thousands of Dollars)
Prepaid expenses $ 16,331 $ 16,140Derivative assets 11,402 16,362Other 3,443 3,442
Other current assets $ 31,176 $ 35,944

Table of Contents NUSTAR ENERGY L.P. AND SUBSIDIARIES
NOTES TO CONSOLIDATED FINANCIAL STATEMENTS – (Continued)
73
9. PROPERTY, PLANT AND EQUIPMENT
Property, plant and equipment, at cost, consisted of the following:
Estimated UsefulLives
December 31, 2015 2014 (Years) (Thousands of Dollars)
Land - $ 140,292 $ 120,351Land and leasehold improvements 5 - 40 186,848 160,283Buildings 15 - 40 137,269 134,857Pipelines, storage and terminals 20 - 40 4,399,378 3,963,134Rights-of-way 20 - 40 194,055 160,008Construction in progress - 151,318 276,763
Total 5,209,160 4,815,396Less accumulated depreciation and amortization (1,525,589) (1,354,664)
Property, plant and equipment, net $ 3,683,571 $ 3,460,732
Capitalized interest costs added to property, plant and equipment totaled $5.5 million, $5.7 million and $4.5 million for the years ended December 31, 2015, 2014 and 2013, respectively. Depreciation and amortization expense for property, plant and equipment totaled $192.3 million, $177.3 million and $168.8 million for the years ended December 31, 2015, 2014 and 2013, respectively, which includes depreciation expense included in “Income (loss) from discontinued operations, net of tax” on the consolidated statements of income (loss).
10. INTANGIBLE ASSETS AND OTHER LONG-TERM ASSETS
Intangible Assets Intangible assets are recorded at cost and are amortized on a straight-line basis over 10 to 47 years. Intangible assets consisted of the following:
December 31, 2015 December 31, 2014
CostAccumulatedAmortization Cost
AccumulatedAmortization
(Thousands of Dollars)
Customer relationships $ 196,616 $ (86,370) $ 126,566 $ (69,711)Other 2,359 (594) 2,359 (544)
Total $ 198,975 $ (86,964) $ 128,925 $ (70,255)
All of our intangible assets are subject to amortization. Amortization expense for intangible assets was $16.7 million, $12.6 million and $13.8 million for the years ended December 31, 2015, 2014 and 2013, respectively. The estimated aggregate amortization expense is $13.8 million for the each of the years 2016 through 2020.
Other Long-Term Assets, Net Other long-term assets, net consisted of the following:
December 31, 2015 2014 (Thousands of Dollars)
Axeon Term Loan $ 170,352 $ 169,235Amount remaining in trust for the Gulf Opportunity Zone revenue bonds (Note 13) 54,822 72,240Ammonia pipeline linefill and tank heel inventory 35,178 35,686Deferred financing costs 29,939 32,957Other 30,043 4,048
Other long-term assets, net $ 320,334 $ 314,166

Table of Contents NUSTAR ENERGY L.P. AND SUBSIDIARIES
NOTES TO CONSOLIDATED FINANCIAL STATEMENTS – (Continued)
74
As of December 31, 2015, the carrying amount of the Axeon Term Loan is $170.4 million, consisting of the following: (i) the outstanding principal amount from the Axeon Term Loan of $190.0 million; (ii) plus the fair value of guarantees of $1.7 million; and (iii) less equity losses from our investment in Axeon of $21.3 million incurred prior to the 2014 Asphalt Sale and after the carrying value of our equity investment in Axeon was reduced to zero. We recognize interest income associated with the Axeon Term Loan ratably over the term of the loan in “Interest income, net” on the consolidated statements of income.
We provide credit support, such as guarantees, letters of credit and cash collateral, as applicable, of up to $150.0 million to Axeon, until February 26, 2016, at which point the amount of credit support will decrease by $25.0 million. Our obligation will continue to decrease until the obligation is terminated no later than September 28, 2019. In the event that we are obligated to perform under any of these guarantees or letters of credit, that amount paid by us will be treated as additional borrowings under the Axeon Term Loan. As a result, we adjust the carrying value of the Axeon Term Loan by the same amount as the liability for the fair value of the guarantees outstanding. As of December 31, 2015, we have provided $36.2 million in letters of credit on behalf of Axeon. Please refer to Note 16 for a discussion of the guarantees.
We review the financial information of Axeon monthly for possible credit loss indicators. Any repayments of the Axeon Term Loan, including those that were scheduled in 2014 and 2015, are subject to Axeon meeting certain restrictive requirements contained in its third-party asset-based revolving credit facility. In 2015 and 2014, Axeon failed to make two scheduled principal payments, increasing the interest rate payable by Axeon until Axeon makes the payments. While the Axeon Term Loan does not provide for any other scheduled payments, Axeon is required to use all of its excess cash, as defined in the Axeon Term Loan, to repay the Axeon Term Loan. The Axeon Term Loan must be repaid in full no later than September 28, 2019.
11. GOODWILL
Changes in the carrying amount of goodwill by segment were as follows:
Pipeline StorageFuels
Marketing Total (Thousands of Dollars)
Balances as of January 1, 2014 and December 31, 2014:Goodwill $ 306,207 $ 612,012 $ 53,255 $ 971,474Accumulated impairment losses — (331,913) (22,132) (354,045)
Net goodwill 306,207 280,099 31,123 617,429
Activity for the year ended December 31, 2015:Linden Acquisition final purchase price allocation — 79,208 — 79,208
Balances as of December 31, 2015:Goodwill 306,207 691,220 53,255 1,050,682Accumulated impairment losses — (331,913) (22,132) (354,045)
Net goodwill $ 306,207 $ 359,307 $ 31,123 $ 696,637
2013 Goodwill ImpairmentIn 2013, the estimated fair value of the Statia Terminals reporting unit was less than its carrying value. To determine the amount of goodwill impairment loss, we first considered whether any other assets assigned to the Statia Terminals reporting unit were impaired. The only significant assets of this reporting unit, other than goodwill, consist of property, plant and equipment, which we determined were fully recoverable. The hypothetical fair value allocation for the Statia Terminals reporting unit indicated the estimated fair value of goodwill was $0. As a result, we recognized a $304.5 million goodwill impairment charge in the fourth quarter of 2013, which represented all of the goodwill allocated to the Statia Terminals reporting unit.
The goodwill impairment charge resulted from changes in demand for storage at our St. Eustatius and Point Tupper terminal locations. Increased supply from various shale formations within the U.S. has reduced the need for storage at these locations, which historically functioned as break bulk facilities for light crude moving from foreign sources into the U.S. These changes in crude flow patterns, as well as the backwardation of the forward pricing curve, reduced demand at these terminals. Primarily

Table of Contents NUSTAR ENERGY L.P. AND SUBSIDIARIES
NOTES TO CONSOLIDATED FINANCIAL STATEMENTS – (Continued)
75
resulting from those factors, a customer at our St. Eustatius terminal vacated a significant portion of its storage in the fourth quarter of 2013.
12. ACCRUED LIABILITIES
Accrued liabilities consisted of the following:
December 31, 2015 2014 (Thousands of Dollars)
Derivative liabilities $ 121 $ 4,623Employee wages and benefit costs 31,143 32,349Unearned income 14,290 10,884Other 9,640 13,169
Accrued liabilities $ 55,194 $ 61,025
13. DEBT
Long-term debt consisted of the following:
December 31, Maturity 2015 2014 (Thousands of Dollars)
$1.5 billion revolving credit agreement 2019 $ 882,664 $ 601,4964.75% senior notes 2022 250,000 250,0006.75% senior notes 2021 300,000 300,0004.80% senior notes 2020 450,000 450,0007.65% senior notes 2018 350,000 350,0007.625% subordinated notes 2043 402,500 402,500Gulf Opportunity Zone revenue bonds 2038 thru 2041 365,440 365,440Receivables Financing Agreement 2018 53,500 —Net fair value adjustments and unamortized discounts N/A 25,245 30,016
Total long-term debt $ 3,079,349 $ 2,749,452
The long-term debt repayments are due as follows (in thousands):
2016 - 2017 $ —2018 403,5002019 882,6642020 450,000Thereafter 1,317,940Total repayments 3,054,104Net fair value adjustments and unamortized discounts 25,245Total long-term debt $ 3,079,349
Interest payments totaled $138.9 million, $135.0 million and $118.3 million for the years ended December 31, 2015, 2014 and 2013, respectively.
Revolving Credit AgreementNuStar Logistics is party to a $1.5 billion five-year revolving credit agreement (the Revolving Credit Agreement), which matures on October 29, 2019. The Revolving Credit Agreement includes an option allowing NuStar Logistics to request an aggregate increase in the commitments from the lenders of up to $250.0 million (after which increase the aggregate commitment from all lenders shall not exceed $1.75 billion). The Revolving Credit Agreement also includes the ability to

Table of Contents NUSTAR ENERGY L.P. AND SUBSIDIARIES
NOTES TO CONSOLIDATED FINANCIAL STATEMENTS – (Continued)
76
borrow up to the equivalent of $250.0 million in Euros and up to the equivalent of $250.0 million in British Pounds Sterling. Obligations under the Revolving Credit Agreement are guaranteed by NuStar Energy and NuPOP.
The Revolving Credit Agreement bears interest, at our option, based on an alternative base rate, a LIBOR-based rate or a EURIBOR-based rate. The interest rate on the Revolving Credit Agreement is subject to adjustment if our debt rating is downgraded (or upgraded) by certain credit rating agencies. As of December 31, 2015, our weighted-average interest rate was 2.1%. During the year ended December 31, 2015, the weighted-average interest rate related to borrowings under the Revolving Credit Agreement was 2.0%.
The Revolving Credit Agreement contains customary restrictive covenants, such as limitations on indebtedness, liens, mergers, asset transfers and certain investing activities. In addition, the Revolving Credit Agreement requires us to maintain, as of the end of each rolling period of four consecutive fiscal quarters, a consolidated debt coverage ratio (consolidated debt to consolidated EBITDA, each as defined in the Revolving Credit Agreement) not to exceed 5.00-to-1.00. If we consummate an acquisition for an aggregate net consideration of at least $50.0 million, the maximum consolidated debt coverage ratio will increase to 5.50-to-1.00 for two rolling periods. The requirement not to exceed a maximum consolidated debt coverage ratio may limit the amount we can borrow under the Revolving Credit Agreement to an amount less than the total amount available for borrowing. As of December 31, 2015, our consolidated debt coverage ratio was 4.5x, and we had $587.3 million available for borrowing.
Letters of credit issued under our Revolving Credit Agreement totaled $30.1 million as of December 31, 2015. Letters of credit are limited to $750.0 million (including up to the equivalent of $25.0 million in Euros and up to the equivalent of $25.0 million in British Pounds Sterling) and also may restrict the amount we can borrow under the Revolving Credit Agreement.
NotesNuStar Logistics Senior Notes. Interest is payable semi-annually in arrears for the $250.0 million of 4.75% senior notes, $300.0 million of 6.75% senior notes, $450.0 million of 4.80% senior notes and $350.0 million of 7.65% senior notes (collectively, the NuStar Logistics Senior Notes). The interest rate payable on the 7.65% senior notes is subject to adjustment if our debt rating is downgraded (or upgraded) by certain credit rating agencies and is at 8.2% as of December 31, 2015. The NuStar Logistics Senior Notes do not have sinking fund requirements. These notes rank equally with existing senior unsecured indebtedness of NuStar Logistics and contain restrictions on NuStar Logistics’ ability to incur additional secured indebtedness unless the same security is also provided for the benefit of holders of the NuStar Logistics Senior Notes. In addition, the NuStar Logistics Senior Notes limit NuStar Logistics’ ability to incur indebtedness secured by certain liens and to engage in certain sale-leaseback transactions. At the option of NuStar Logistics, the NuStar Logistics Senior Notes may be redeemed in whole or in part at any time at a redemption price, which includes a make-whole premium, plus accrued and unpaid interest to the redemption date. The NuStar Logistics Senior Notes are fully and unconditionally guaranteed by NuStar Energy and NuPOP.
NuStar Logistics 7.625% Fixed-to-Floating Rate Subordinated Notes. NuStar Logistics’ $402.5 million of 7.625% fixed-to-floating rate subordinated notes are due January 15, 2043 (the Subordinated Notes). The Subordinated Notes are fully and unconditionally guaranteed on an unsecured and subordinated basis by NuStar Energy and NuPOP. The Subordinated Notes bear interest at a fixed annual rate of 7.625%, payable quarterly in arrears beginning on April 15, 2013 and ending on January 15, 2018. Thereafter, the Subordinated Notes will bear interest at an annual rate equal to the sum of the three-month LIBOR rate for the related quarterly interest period, plus 6.734% payable quarterly, commencing April 15, 2018, unless payment is deferred in accordance with the terms of the notes. NuStar Logistics may elect to defer interest payments on the Subordinated Notes on one or more occasions for up to five consecutive years. Deferred interest will accumulate additional interest at a rate equal to the interest rate then applicable to the Subordinated Notes until paid. If NuStar Logistics elects to defer interest payments, NuStar Energy cannot declare or make cash distributions to its unitholders during the period that interest payments are deferred.
The Subordinated Notes do not have sinking fund requirements and are subordinated to existing senior unsecured indebtedness of NuStar Logistics and NuPOP. The Subordinated Notes do not contain restrictions on NuStar Logistics’ ability to incur additional indebtedness, including debt that ranks senior in priority of payment to the notes. In addition, the Subordinated Notes do not limit NuStar Logistics’ ability to incur indebtedness secured by liens or to engage in certain sale-leaseback transactions. At the option of NuStar Logistics, the Subordinated Notes may be redeemed in whole or in part at any time at a redemption price, which may include a make-whole premium, plus accrued and unpaid interest to the redemption date.
Gulf Opportunity Zone Revenue BondsIn 2008, 2010 and 2011, the Parish of St. James, where our St. James, Louisiana, terminal is located, issued Revenue Bonds Series 2008, Series 2010, Series 2010A, Series 2010B and Series 2011 associated with our St. James terminal expansion pursuant to the Gulf Opportunity Zone Act of 2005 (collectively, the Gulf Opportunity Zone Revenue Bonds). The interest rates

Table of Contents NUSTAR ENERGY L.P. AND SUBSIDIARIES
NOTES TO CONSOLIDATED FINANCIAL STATEMENTS – (Continued)
77
on these bonds are based on a weekly tax-exempt bond market interest rate, and interest is paid monthly. Following the issuance, the proceeds were deposited with a trustee and are disbursed to us upon our request for reimbursement of expenditures related to our St. James terminal expansion. We include the amount remaining in trust in “Other long-term assets, net,” and we include the amount of bonds issued in “Long-term debt” in our consolidated balance sheets. For the years ended December 31, 2015 and 2014, the amount received from the trustee totaled $17.5 million and $11.9 million, respectively.
NuStar Logistics is solely obligated to service the principal and interest payments associated with the Gulf Opportunity Zone Revenue Bonds. Letters of credit were issued by various individual banks on our behalf to guarantee the payment of interest and principal on the bonds. All letters of credit rank equally with existing senior unsecured indebtedness of NuStar Logistics. Obligations under the letters of credit issued are guaranteed by NuStar Energy and NuPOP. The letters of credit issued by individual banks do not restrict the amount we can borrow under the Revolving Credit Agreement.
The following table summarizes the Gulf Opportunity Zone Revenue Bonds outstanding as of December 31, 2015:
Date Issued Maturity DateAmount
Outstanding
Amount ofLetter ofCredit
Amount Received from
Trustee
Amount Remaining in
TrustAverage Annual
Interest Rate
(Thousands of Dollars)
June 26, 2008 June 1, 2038 $ 55,440 $ 56,169 $ 55,440 $ — 0.1%July 15, 2010 July 1, 2040 100,000 101,315 100,000 — 0.1%
October 7, 2010 October 1, 2040 50,000 50,658 43,441 6,806 0.1%December 29, 2010 December 1, 2040 85,000 86,118 37,528 48,016 0.1%
August 29, 2011 August 1, 2041 75,000 75,986 75,000 — 0.1%Total $ 365,440 $ 370,246 $ 311,409 $ 54,822
Receivables Financing AgreementNuStar Energy and NuStar Finance LLC (NuStar Finance), a special purpose entity and wholly owned subsidiary of NuStar Logistics, are parties to a $125.0 million receivables financing agreement with third-party lenders (the Receivables Financing Agreement) and agreements with certain of NuStar Energy’s wholly owned subsidiaries (collectively with the Receivables Financing Agreement, the Securitization Program). Under the Securitization Program, certain of NuStar Energy’s wholly owned subsidiaries, NuStar Logistics, NuPOP, NuStar Energy Services, Inc. and NuStar Supply & Trading LLC (collectively, the Originators), sell their accounts receivable to NuStar Finance on an ongoing basis, and NuStar Finance provides the newly acquired accounts receivable as collateral for its revolving borrowings under the Receivables Financing Agreement. NuStar Energy provides a performance guarantee in connection with the Securitization Program. The maximum amount available for borrowing by NuStar Finance under the Receivables Financing Agreement is $125.0 million, with an option for NuStar Finance to request an increase of up to $75.0 million from the lenders (for aggregate total borrowings not to exceed $200.0 million). The amount available for borrowing is based on the availability of eligible receivables and other customary factors and conditions. The Securitization Program contains various customary affirmative and negative covenants and default, indemnification and termination provisions, and the Receivables Financing Agreement provides for acceleration of amounts owed upon the occurrence of certain specified events.
Borrowings by NuStar Finance under the Receivables Financing Agreement bear interest at either the applicable commercial paper rate or the applicable bank rate, each as defined under the Receivables Financing Agreement. The Securitization Program has an initial termination date of June 15, 2018, with the option to renew for additional 364-day periods thereafter. As of December 31, 2015, $97.9 million of our accounts receivable are included in the Securitization Program. The weighted average interest rate related to outstanding borrowings under the Securitization Program during the year ended December 31, 2015 was 1.1%.
NuStar Finance’s sole business consists of purchasing such receivables and providing them as collateral under the Securitization Program. NuStar Finance is a separate legal entity and the assets of NuStar Finance, including these accounts receivable, are not available to satisfy the claims of creditors of NuStar Energy, the Originators or their affiliates.
Short-Term Lines of CreditNuStar Logistics is party to two short-term line of credit agreements with an aggregate uncommitted borrowing capacity of up to $105.0 million, which allow us to better manage fluctuations in our daily cash requirements and minimize our excess cash balances. The interest rate and maturity vary and are determined at the time of borrowing. We had $84.0 million outstanding under these lines of credit as of December 31, 2015. Obligations under these short-term line of credit agreements are

Table of Contents NUSTAR ENERGY L.P. AND SUBSIDIARIES
NOTES TO CONSOLIDATED FINANCIAL STATEMENTS – (Continued)
78
guaranteed by NuStar Energy. As of December 31, 2015 and 2014, the weighted-average interest rates related to outstanding borrowings under our short-term lines of credit were 1.9% and 1.8%, respectively.
14. HEALTH, SAFETY AND ENVIRONMENTAL MATTERS
Our operations are subject to extensive federal, state and local environmental laws and regulations, including those relating to the discharge of materials into the environment, waste management and pollution prevention measures, among others. Our operations are also subject to extensive federal, state and local health and safety laws and regulations, including those relating to worker and pipeline safety, pipeline integrity and operator qualifications. The principal environmental and safety risks associated with our operations relate to unauthorized or unpermitted emissions into the air, unauthorized releases into soil, surface water or groundwater, and personal injury and property damage. Compliance with these environmental, health and safety laws, regulations and related permits increases our capital expenditures and our overall cost of business, and violations of these laws, regulations or permits can result in significant civil and criminal liabilities, injunctions or other penalties.
Most of our pipelines are subject to federal regulation by one or more of the following governmental agencies: the Federal Energy Regulatory Commission (the FERC), the Surface Transportation Board (the STB), the Department of Transportation (DOT), the Environmental Protection Agency (EPA) and Homeland Security. Additionally, the operations and integrity of the pipelines are subject to the respective state jurisdictions along the route of the systems.
We have adopted policies, practices and procedures including in the areas of pollution control, pipeline integrity, operator qualifications, public relations and education, process safety management, risk management planning, hazard communication, emergency response planning, community right-to-know, occupational health and the handling, storage, use and disposal of hazardous materials, that are designed to comply with applicable federal, state and local regulations and to prevent material environmental or other damage, to ensure the safety of our pipelines, our employees, the public and the environment and to limit the financial liability that could result from such events. Future governmental action and regulatory initiatives could result in changes to expected operating permits and procedures, additional remedial actions or increased capital expenditures and operating costs that cannot be assessed with certainty at this time. In addition, contamination resulting from spills of petroleum and other products occurs within the industry. Risks of additional costs and liabilities are inherent within the industry, and there can be no assurances that significant costs and liabilities will not be incurred in the future.
Environmental and safety exposures and liabilities are difficult to assess and estimate due to unknown factors such as the timing and extent of remediation, the determination of our liability in proportion to other parties, improvements in cleanup technologies and the extent to which environmental and safety laws and regulations may change in the future. Although environmental and safety costs may have a significant impact on the results of operations for any single period, we believe that such costs will not have a material adverse effect on our financial position.
The balance of and changes in the accruals for environmental matters were as follows:
Year Ended December 31, 2015 2014 (Thousands of Dollars)
Balance as of the beginning of year $ 6,598 $ 6,233Additions to accrual 3,685 3,292Payments (2,574) (2,878)Foreign currency translation (42) (49)
Balance as of the end of year $ 7,667 $ 6,598 Accruals for environmental matters are included in the consolidated balance sheets as follows:
December 31, 2015 2014 (Thousands of Dollars)
Accrued liabilities $ 4,350 $ 3,518Other long-term liabilities 3,317 3,080
Accruals for environmental matters $ 7,667 $ 6,598

Table of Contents NUSTAR ENERGY L.P. AND SUBSIDIARIES
NOTES TO CONSOLIDATED FINANCIAL STATEMENTS – (Continued)
79
15. COMMITMENTS AND CONTINGENCIES
Contingencies We have contingent liabilities resulting from various litigation, claims and commitments. We record accruals for loss contingencies when losses are considered probable and can be reasonably estimated. Legal fees associated with defending the Partnership in legal matters are expensed as incurred. As of December 31, 2015, we have accrued $4.8 million for contingent losses. The amount that will ultimately be paid related to these matters may differ from the recorded accruals, and the timing of such payments is uncertain. In addition, due to the inherent uncertainty of litigation, there can be no assurance that the resolution of any particular claim or proceeding would not have a material adverse effect on our results of operations, financial position or liquidity.
CommitmentsFuture minimum rental payments applicable to all noncancellable operating leases and purchase obligations as of December 31, 2015 are as follows:
Payments Due by Period
2016 2017 2018 2019 2020There-after Total
(Thousands of Dollars)
Operating leases $ 31,969 $ 27,919 $ 25,175 $ 18,522 $ 6,991 $ 65,258 $ 175,834Purchase obligations 6,920 3,673 2,286 1,441 9 — 14,329
Rental expense for all operating leases totaled $39.7 million, $46.1 million and $52.9 million for the years ended December 31, 2015, 2014 and 2013, respectively. Our operating leases consist primarily of the following:
• a ten-year lease for tugs and barges utilized at our St. Eustatius facility for bunker fuel sales, with two five-year renewal options; and
• land leases at various terminal facilities, with original terms ranging from 10 to 100 years.

Table of Contents NUSTAR ENERGY L.P. AND SUBSIDIARIES
NOTES TO CONSOLIDATED FINANCIAL STATEMENTS – (Continued)
80
16. FAIR VALUE MEASUREMENTS
We segregate the inputs used in measuring fair value into three levels: Level 1, defined as observable inputs such as quoted prices for identical assets or liabilities in active markets; Level 2, defined as inputs other than quoted prices in active markets that are either directly or indirectly observable, such as quoted prices for similar assets or liabilities in active markets or quoted prices for identical assets or liabilities in markets that are not active; and Level 3, defined as unobservable inputs for which little or no market data exists. We consider counterparty credit risk and our own credit risk in the determination of all estimated fair values.
Recurring Fair Value MeasurementsThe following assets and liabilities are measured at fair value on a recurring basis:
December 31, 2015 Level 1 Level 2 Level 3 Total (Thousands of Dollars)
Assets:Other current assets:
Product imbalances $ 179 $ — $ — $ 179Commodity derivatives 11,325 77 — 11,402
Other long-term assets, net:Interest rate swaps — 2,755 — 2,755
Total $ 11,504 $ 2,832 $ — $ 14,336Liabilities:
Accrued liabilities:Product imbalances $ (419) $ — $ — $ (419)Commodity derivatives — (120) — (120)
Other long-term liabilities:Guarantee liability — — (1,697) (1,697)Interest rate swaps — (1,452) — (1,452)
Total $ (419) $ (1,572) $ (1,697) $ (3,688)
December 31, 2014Level 1 Level 2 Level 3 Total
(Thousands of Dollars)
Assets:Other current assets:
Product imbalances $ 117 $ — $ — $ 117Commodity derivatives 11,009 5,353 — 16,362
Total $ 11,126 $ 5,353 $ — $ 16,479Liabilities:
Accrued liabilities:Product imbalances $ (1,388) $ — $ — $ (1,388)Commodity derivatives — (4,623) — (4,623)
Other long-term liabilities:Guarantee liability — — (580) (580)
Total $ (1,388) $ (4,623) $ (580) $ (6,591)
Product Imbalances. We value our assets and liabilities related to product imbalances using quoted market prices in active markets as of the reporting date. Therefore, we include these product imbalances in Level 1 of the fair value hierarchy.

Table of Contents NUSTAR ENERGY L.P. AND SUBSIDIARIES
NOTES TO CONSOLIDATED FINANCIAL STATEMENTS – (Continued)
81
Interest Rate Swaps. We estimate the fair value of our forward-starting interest rate swaps using discounted cash flows, which use observable inputs such as time to maturity and market interest rates. Therefore, we include these interest rate swaps in Level 2 of the fair value hierarchy.
Commodity Derivatives. We base the fair value of certain of our commodity derivative instruments on quoted prices on an exchange; accordingly, we include these in Level 1 of the fair value hierarchy. We also have derivative instruments for which we determine fair value using industry pricing services and other observable inputs, such as quoted prices on an exchange for similar derivative instruments. Therefore, we include these derivative instruments in Level 2 of the fair value hierarchy. See Note 17 for a discussion of our derivative instruments.
Guarantees. As of December 31, 2015 and 2014, we recorded a liability of $1.7 million and $0.6 million, respectively, representing the fair value of guarantees we have issued on behalf of Axeon. We estimated the fair value considering the probability of default by Axeon and an estimate of the amount we would be obligated to pay under the guarantees at the time of default. We calculated the fair value based on the guarantees outstanding as of December 31, 2015 and 2014, totaling $71.9 million and $25.3 million, respectively, plus two guarantees that do not specify a maximum amount. We provide guarantees for commodity purchases, lease obligations and certain utilities for Axeon. A majority of these guarantees have no expiration date. Our estimate of the fair value is based on significant inputs not observable in the market and thus falls within Level 3 of the fair value hierarchy.
The following table summarizes the activity in our Level 3 liabilities:
Year Ended December 31, 2015
(Thousands of Dollars)
Beginning balance $ 580Adjustment to guarantee liability 1,117Ending balance $ 1,697
Fair Value of Financial InstrumentsWe recognize cash equivalents, receivables, note receivables, payables and debt in our consolidated balance sheets at their carrying amounts. The fair values of these financial instruments, except for the Axeon Term Loan and long-term debt, approximate their carrying amounts.
The estimated fair values and carrying amounts of the long-term debt and the Axeon Term Loan were as follows:
December 31, 2015 December 31, 2014Fair Value Carrying Amount Fair Value Carrying Amount
(Thousands of Dollars)
Long-term debt $ 2,929,438 $ 3,079,349 $ 2,764,242 $ 2,749,452Axeon Term Loan $ 172,123 $ 170,352 $ 164,386 $ 169,235
We estimated the fair value of our publicly-traded senior notes based upon quoted prices in active markets; therefore, we determined the fair value of our publicly-traded senior notes falls in Level 1 of the fair value hierarchy. For our other debt, for which a quoted market price is not available, we estimated the fair value using a discounted cash flow analysis using current incremental borrowing rates for similar types of borrowing arrangements and determined the fair value falls in Level 2 of the fair value hierarchy.
We estimated the fair value of the Axeon Term Loan using discounted cash flows, which use observable inputs such as time to maturity and market interest rates, and determined the fair value falls in Level 2 of the fair value hierarchy. The carrying value of the Axeon Term Loan is included in “Other long-term assets, net” on the consolidated balance sheets.

Table of Contents NUSTAR ENERGY L.P. AND SUBSIDIARIES
NOTES TO CONSOLIDATED FINANCIAL STATEMENTS – (Continued)
82
17. DERIVATIVES AND RISK MANAGEMENT ACTIVITIES
We utilize various derivative instruments to manage our exposure to interest rate risk and commodity price risk. Our risk management policies and procedures are designed to monitor interest rates, futures and swap positions and over-the-counter positions, as well as physical volumes, grades, locations and delivery schedules, to help ensure that our hedging activities address our market risks. Our risk management committee oversees our trading controls and procedures and certain aspects of commodity and trading risk management. Our risk management committee also reviews all new commodity and trading risk management strategies in accordance with our risk management policy, as approved by our board of directors.
Interest Rate RiskWe are a party to certain interest rate swap agreements to manage our exposure to changes in interest rates. During the year ended December 31, 2015, we entered into forward-starting interest rate swap agreements with an aggregate notional amount of $600.0 million. Under the terms of the swaps, we pay a fixed rate and receive a rate based on three month USD LIBOR. We entered into these swaps in order to hedge the risk of changes in the interest payments attributable to changes in the benchmark interest rate during the period from the effective date of the swap to the issuance of the forecasted debt. These swaps qualified, and we designated them, as cash flow hedges of future interest payments associated with forecasted debt issuances in 2018 and 2020. We record the effective portion of mark-to-market adjustments as a component of “Accumulated other comprehensive income” (AOCI), and the amount in AOCI will be recognized in “Interest expense, net” as the forecasted interest payments occur or if the interest payments are probable not to occur.
In 2013, in connection with the maturity of the 6.05% senior notes due March 15, 2013 and 5.875% senior notes due June 1, 2013, we terminated forward-starting interest rate swap agreements with an aggregate notional amount of $275.0 million. We paid $33.7 million in connection with the terminations, which we reclassify from “Accumulated other comprehensive loss” into “Interest expense, net” as the interest payments occur or if the interest payments are probable not to occur. During the second quarter of 2013, we determined that one forecasted interest payment was probable not to occur, and we reclassified $2.0 million from “Accumulated other comprehensive loss” to “Interest expense, net.” The termination payments are included in cash flows from financing activities on the consolidated statements of cash flows. We had no forward-starting interest rate swaps as of December 31, 2014.
As of December 31, 2015, the remaining fair value amount associated with unwound fixed-to-floating interest rate swap agreements totaled $26.3 million gain and is included in “Long-term debt” on the consolidated balance sheets. The remaining fair value amount associated with unwound forward-starting interest rate swap agreements totaled $29.3 million loss as of December 31, 2015 and is included in AOCI on the consolidated balance sheets. These amounts are amortized ratably over the remaining life of the related debt instrument into “Interest expense, net” on the consolidated statements of income.
Commodity Price RiskWe are exposed to market risks related to the volatility of crude oil and refined product prices. In order to reduce the risk of commodity price fluctuations with respect to our crude oil and refined product inventories and related firm commitments to purchase and/or sell such inventories, we utilize commodity futures and swap contracts, which qualify and we designate as fair value hedges. Derivatives that are intended to hedge our commodity price risk, but fail to qualify as fair value or cash flow hedges, are considered economic hedges, and we record associated gains and losses in net income.
The volume of commodity contracts is based on open derivative positions and represents the combined volume of our long and short open positions on an absolute basis, which totaled 8.0 million barrels and 4.7 million barrels as of December 31, 2015 and 2014, respectively.

Table of Contents NUSTAR ENERGY L.P. AND SUBSIDIARIES
NOTES TO CONSOLIDATED FINANCIAL STATEMENTS – (Continued)
83
The fair values of our derivative instruments included in our consolidated balance sheets were as follows:
Asset Derivatives Liability Derivatives
Balance Sheet LocationDecember 31,
2015 2014 2015 2014 (Thousands of Dollars)
Derivatives Designated asHedging Instruments:Commodity contracts Other current assets $ 1,937 $ 5,609 $ (23) $ —Interest rate swaps Other long-term assets, net 2,755 — — —Interest rate swaps Other long-term liabilities — — (1,452) —
Total 4,692 5,609 (1,475) —
Derivatives Not Designatedas Hedging Instruments:Commodity contracts Other current assets 34,016 38,704 (24,528) (27,951)Commodity contracts Accrued liabilities 117 13,081 (237) (17,704)
Total 34,133 51,785 (24,765) (45,655)
Total Derivatives $ 38,825 $ 57,394 $ (26,240) $ (45,655) Certain of our derivative instruments are eligible for offset in the consolidated balance sheets and subject to master netting arrangements. Under our master netting arrangements, there is a legally enforceable right to offset amounts, and we intend to settle such amounts on a net basis. The following are the net amounts presented on the consolidated balance sheets:
December 31,Commodity Contracts 2015 2014
(Thousands of Dollars)
Net amounts of assets presented in the consolidated balance sheets $ 11,402 $ 16,362Net amounts of liabilities presented in the consolidated balance sheets $ (120) $ (4,623)
The earnings impact of our commodity contracts, for which gains and/or losses are recognized in "Cost of product sales" on the consolidated income statements, was as follows:
Year Ended December 31,2015 2014 2013
(Thousands of Dollars)
Derivatives Designated as Fair Value Hedging Instruments:Gain (loss) recognized in income on derivative $ 21,589 $ 21,951 $ 3,964Gain (loss) recognized in income on hedged item (18,047) (21,587) (6,327)Gain (loss) recognized in income for ineffective portion 3,542 364 (2,363)
Derivatives Not Designated as Hedging Instruments:Gain (loss) recognized in income on derivative $ 2,208 $ 18,407 $ (5,323)
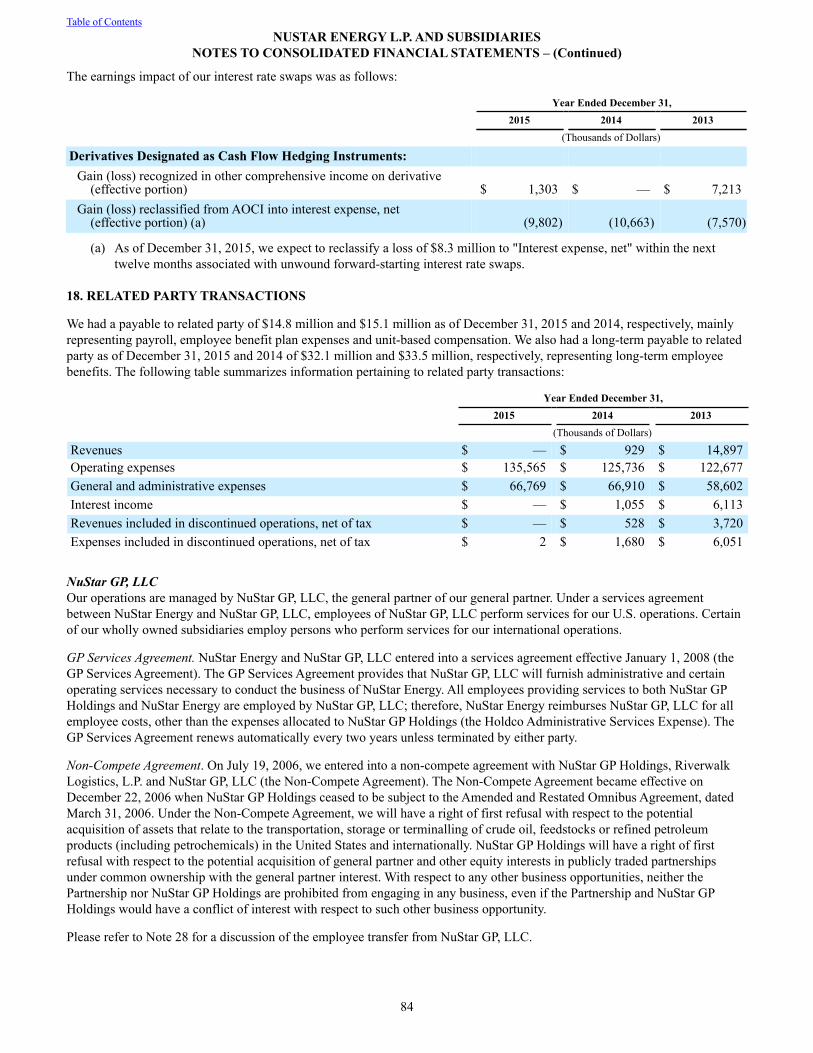
Table of Contents NUSTAR ENERGY L.P. AND SUBSIDIARIES
NOTES TO CONSOLIDATED FINANCIAL STATEMENTS – (Continued)
84
The earnings impact of our interest rate swaps was as follows:
Year Ended December 31,2015 2014 2013
(Thousands of Dollars)
Derivatives Designated as Cash Flow Hedging Instruments:Gain (loss) recognized in other comprehensive income on derivative (effective portion) $ 1,303 $ — $ 7,213Gain (loss) reclassified from AOCI into interest expense, net (effective portion) (a) (9,802) (10,663) (7,570)
(a) As of December 31, 2015, we expect to reclassify a loss of $8.3 million to "Interest expense, net" within the next twelve months associated with unwound forward-starting interest rate swaps.
18. RELATED PARTY TRANSACTIONS
We had a payable to related party of $14.8 million and $15.1 million as of December 31, 2015 and 2014, respectively, mainly representing payroll, employee benefit plan expenses and unit-based compensation. We also had a long-term payable to related party as of December 31, 2015 and 2014 of $32.1 million and $33.5 million, respectively, representing long-term employee benefits. The following table summarizes information pertaining to related party transactions:
Year Ended December 31, 2015 2014 2013 (Thousands of Dollars)
Revenues $ — $ 929 $ 14,897Operating expenses $ 135,565 $ 125,736 $ 122,677General and administrative expenses $ 66,769 $ 66,910 $ 58,602Interest income $ — $ 1,055 $ 6,113Revenues included in discontinued operations, net of tax $ — $ 528 $ 3,720Expenses included in discontinued operations, net of tax $ 2 $ 1,680 $ 6,051
NuStar GP, LLCOur operations are managed by NuStar GP, LLC, the general partner of our general partner. Under a services agreement between NuStar Energy and NuStar GP, LLC, employees of NuStar GP, LLC perform services for our U.S. operations. Certain of our wholly owned subsidiaries employ persons who perform services for our international operations.
GP Services Agreement. NuStar Energy and NuStar GP, LLC entered into a services agreement effective January 1, 2008 (the GP Services Agreement). The GP Services Agreement provides that NuStar GP, LLC will furnish administrative and certain operating services necessary to conduct the business of NuStar Energy. All employees providing services to both NuStar GP Holdings and NuStar Energy are employed by NuStar GP, LLC; therefore, NuStar Energy reimburses NuStar GP, LLC for all employee costs, other than the expenses allocated to NuStar GP Holdings (the Holdco Administrative Services Expense). The GP Services Agreement renews automatically every two years unless terminated by either party.
Non-Compete Agreement. On July 19, 2006, we entered into a non-compete agreement with NuStar GP Holdings, Riverwalk Logistics, L.P. and NuStar GP, LLC (the Non-Compete Agreement). The Non-Compete Agreement became effective on December 22, 2006 when NuStar GP Holdings ceased to be subject to the Amended and Restated Omnibus Agreement, dated March 31, 2006. Under the Non-Compete Agreement, we will have a right of first refusal with respect to the potential acquisition of assets that relate to the transportation, storage or terminalling of crude oil, feedstocks or refined petroleum products (including petrochemicals) in the United States and internationally. NuStar GP Holdings will have a right of first refusal with respect to the potential acquisition of general partner and other equity interests in publicly traded partnerships under common ownership with the general partner interest. With respect to any other business opportunities, neither the Partnership nor NuStar GP Holdings are prohibited from engaging in any business, even if the Partnership and NuStar GP Holdings would have a conflict of interest with respect to such other business opportunity.
Please refer to Note 28 for a discussion of the employee transfer from NuStar GP, LLC.

Table of Contents NUSTAR ENERGY L.P. AND SUBSIDIARIES
NOTES TO CONSOLIDATED FINANCIAL STATEMENTS – (Continued)
85
AxeonAs a result of the 2014 Asphalt Sale, we ceased reporting transactions between us and Axeon as related party transactions in our consolidated financial statements on February 26, 2014.
Terminal Service Agreements. We were a party to four terminal service agreements with Axeon for our terminals in Wilmington, NC, Rosario, NM, Catoosa, OK and Houston, TX. Pursuant to the terms of the agreements, we provided aggregate storage capacity of 0.8 million barrels and blending services to Axeon for a service charge of $1.5 million per year. In addition, we had terminal service agreements with Axeon for our terminals in Jacksonville, FL, Dumfries, VA, and Baltimore, MD. Pursuant to the terms of the agreements, we provided aggregate storage capacity of approximately 0.6 million barrels to Axeon for a storage charge of approximately $6.3 million per year, plus applicable throughput and handling fees. As a result of the 2014 Asphalt Sale, these terminal service agreements were either amended or terminated.
Crude Oil Supply Agreement. We were a party to a crude oil supply agreement with Axeon (the Axeon Crude Oil Supply Agreement) that committed Axeon to purchase from us a minimum number of barrels of crude oil in a given year. The Axeon Crude Oil Supply Agreement terminated effective January 1, 2014.
Services Agreement. NuStar GP, LLC and Axeon were a party to a services agreement, which provided that NuStar GP, LLC would furnish certain administrative and other operating services necessary to conduct the business of Axeon for an annual fee totaling $10.0 million, subject to adjustment (the Axeon Services Agreement). The Axeon Services Agreement terminated on June 30, 2014.
19. EMPLOYEE BENEFIT PLANS AND LONG-TERM INCENTIVE PLANS
Employee Benefit Plans We rely on employees of NuStar GP, LLC to provide the necessary services to conduct our U.S. operations. NuStar GP, LLC sponsors various employee benefit plans.
The NuStar Pension Plan (the Pension Plan) is a qualified non-contributory defined benefit pension plan that provides eligible employees with retirement income as calculated under a cash balance formula. Under the cash balance formula, benefits are based on age, service and interest credits, and employees become fully vested in their benefits upon attaining three years of vesting service. Prior to January 1, 2014, eligible employees were covered under either a cash balance formula or a final average pay formula (FAP). Effective January 1, 2014, the Pension Plan was amended to freeze the FAP benefits as of December 31, 2013, and going forward, all eligible employees are covered under the cash balance formula discussed above.
NuStar GP, LLC also maintains an excess pension plan (the Excess Pension Plan) which is a nonqualified deferred compensation plan that provides benefits to a select group of management or other highly compensated employees of NuStar GP, LLC. The supplemental executive retirement plan has no participants following final payouts in 2014.
The NuStar Thrift Plan (the Thrift Plan) is a qualified defined contribution plan that became effective June 26, 2006. Participation in the Thrift Plan is voluntary and is open to substantially all NuStar GP, LLC employees upon their date of hire. Thrift Plan participants can contribute from 1% up to 30% of their total annual compensation to the Thrift Plan in the form of pre-tax and/or after tax employee contributions. NuStar GP, LLC makes matching contributions in an amount equal to 100% of each participant’s employee contributions up to a maximum of 6% of the participant’s total annual compensation. NuStar GP, LLC also maintains an excess thrift plan (the Excess Thrift Plan) that became effective July 1, 2006. The Excess Thrift Plan is a nonqualified deferred compensation plan that provides benefits to those employees of NuStar GP, LLC whose compensation and/or annual contributions under the Thrift Plan are subject to the limitations applicable to qualified retirement plans under the Code.
Neither the Excess Thrift Plan nor the Excess Pension Plan is intended to constitute either a qualified plan under the provisions of Section 401 of the Code or a funded plan subject to the Employee Retirement Income Security Act.
NuStar GP, LLC also sponsors a contributory medical benefits plan for employees that retired prior to April 1, 2014. For employees that retire on or after April 1, 2014, NuStar GP, LLC provides partial reimbursement for eligible third-party health care premiums.
We also maintain several other defined contribution plans for certain international employees located in Canada, the Netherlands and the United Kingdom. For the years ended December 31, 2015, 2014 and 2013, our costs for these plans totaled $2.6 million, $2.7 million and $2.5 million, respectively.

Table of Contents NUSTAR ENERGY L.P. AND SUBSIDIARIES
NOTES TO CONSOLIDATED FINANCIAL STATEMENTS – (Continued)
86
Long-Term Incentive PlansAs of December 31, 2015, NuStar GP, LLC sponsored the following:
• The Fourth Amended and Restated 2000 Long-Term Incentive Plan (the 2000 LTIP), under which NuStar GP, LLC may award up to 3,250,000 NS common units. Awards under the 2000 LTIP can include NS unit options, restricted units, performance awards, distribution equivalent rights (DER) and contractual rights to receive common units. As of December 31, 2015, NS common units that remained available to be awarded totaled 1,260,634 under the 2000 LTIP.
• The 2006 Long-Term Incentive Plan (the 2006 LTIP) under which NuStar GP Holdings may award up to 2,000,000 NSH units to employees, consultants and directors of NuStar GP Holdings and its affiliates, including us. Awards under the 2006 LTIP can include NSH unit options, performance awards, DER, restricted units, phantom units, unit grants and unit appreciation rights. As of December 31, 2015, a total of 1,492,327 NSH units remained available to be awarded under the 2006 LTIP.
The 2003 Employee Unit Incentive Plan (the UIP), under which NuStar GP, LLC awarded NS common units to employees of NuStar GP, LLC or its affiliates, terminated on June 16, 2013.
The number of awards granted under the above-noted plans were as follows:
Year Ended December 31,Vesting 2015 2014 2013
2000 LTIP:Performance awards (a) 29,633 28,841 38,786Restricted units (b) 1/5 per year 250,563 208,714 269,182Restricted units (grants to non-employee directors of NuStarGP, LLC) 1/3 per year 7,553 7,009 8,904
2006 LTIP:Restricted units 1/5 per year 26,240 16,895 18,620Restricted units (grants to non-employee directors of NuStarGP Holdings) (c) 1/3 per year 12,814 8,911 13,183
(a) Performance awards vest 1/3 per year if certain performance measures are met, as defined in the award terms.(b) The 2000 LTIP restricted unit grants include 2,835, 2,844 and 3,882 restricted unit awards granted to certain
international employees for the years ended December 31, 2015, 2014 and 2013 respectively, that vest 1/3 per year, as defined in the award terms.
(c) We do not reimburse NuStar GP, LLC for compensation expense relating to these awards.
Our share of compensation expense related to the benefit plans and long-term incentive plans sponsored by NuStar GP, LLC described above is as follows:
Year Ended December 31, 2015 2014 2013 (Thousands of Dollars)
Benefit plans $ 13,215 $ 11,385 $ 27,741Long-term incentive plans $ 6,397 $ 10,934 $ 7,369
Please refer to Note 28 for a discussion of the employee transfer from NuStar GP, LLC.

Table of Contents NUSTAR ENERGY L.P. AND SUBSIDIARIES
NOTES TO CONSOLIDATED FINANCIAL STATEMENTS – (Continued)
87
20. OTHER INCOME
Other income consisted of the following:
Year Ended December 31, 2015 2014 2013 (Thousands of Dollars)
Gain associated with Linden Acquisition $ 56,277 $ — $ —Foreign exchange gains 3,891 2,057 7,707Gain from sale or disposition of assets 1,617 642 (524)Other, net 37 1,800 158
Other income, net $ 61,822 $ 4,499 $ 7,341
21. PARTNERS’ EQUITY
Accumulated Other Comprehensive Income (Loss)The balance of and changes in the components included in “Accumulated other comprehensive income (loss)” were as follows:
ForeignCurrency
TranslationCash Flow
Hedges Total(Thousands of Dollars)
Balance as of January 1, 2013 $ 5,654 $ (64,519) $ (58,865)Other comprehensive (loss) income before reclassifications (19,312) 7,213 (12,099)Net loss reclassified into interest expense, net — 7,570 7,570
Other comprehensive (loss) income (19,312) 14,783 (4,529)
Balance as of December 31, 2013 (13,658) (49,736) (63,394)Other comprehensive loss before reclassifications (15,181) — (15,181)Net loss reclassified into interest expense, net — 10,663 10,663
Other comprehensive (loss) income (15,181) 10,663 (4,518)
Balance as of December 31, 2014 (28,839) (39,073) (67,912)Other comprehensive (loss) income before reclassifications (31,987) 1,303 (30,684)Net loss reclassified into interest expense, net — 9,802 9,802
Other comprehensive (loss) income (31,987) 11,105 (20,882)
Balance as of December 31, 2015 $ (60,826) $ (27,968) $ (88,794)
Allocations of Net IncomeGeneral Partner. Our partnership agreement, as amended, sets forth the calculation to be used to determine the amount and priority of cash distributions that the common unitholders and general partner will receive. The partnership agreement also contains provisions for the allocation of net income and loss to the unitholders and the general partner. For purposes of maintaining partner capital accounts, the partnership agreement specifies that items of income and loss shall be allocated among the partners in accordance with their respective percentage interests. Normal allocations according to percentage interests are made after giving effect to priority income allocations, if any, in an amount equal to incentive cash distributions allocated 100% to the general partner.

Table of Contents NUSTAR ENERGY L.P. AND SUBSIDIARIES
NOTES TO CONSOLIDATED FINANCIAL STATEMENTS – (Continued)
88
The following table details the calculation of net income applicable to the general partner:
Year Ended December 31, 2015 2014 2013 (Thousands of Dollars)
Net income (loss) attributable to NuStar Energy L.P. $ 306,720 $ 210,773 $ (273,770)Less general partner incentive distribution 43,220 43,220 43,220Net income (loss) after general partner incentive distribution 263,500 167,553 (316,990)General partner interest 2% 2% 2%General partner allocation of net income (loss) after general partner
incentive distribution 5,270 3,352 (6,338)General partner incentive distribution 43,220 43,220 43,220Net income applicable to general partner $ 48,490 $ 46,572 $ 36,882
Cash DistributionsWe make quarterly distributions of 100% of our available cash, generally defined as cash receipts less cash disbursements and cash reserves established by the general partner, in its sole discretion. These quarterly distributions are declared and paid within 45 days subsequent to each quarter-end. The limited partner unitholders are entitled to receive a minimum quarterly distribution of $0.60 per unit each quarter ($2.40 annualized). Our cash is first distributed 98% to the limited partners and 2% to the general partner until the amount distributed to our unitholders is equal to the minimum quarterly distribution and arrearages in the payment of the minimum quarterly distribution for any prior quarter. Cash in excess of the minimum quarterly distributions is distributed to our unitholders and our general partner based on the percentages shown below.
Our general partner is entitled to incentive distributions if the amount we distribute with respect to any quarter exceeds specified target levels shown below:
Percentage of Distribution
Quarterly Distribution Amount per Unit Unitholders General Partner
Up to $0.60 98% 2%Above $0.60 up to $0.66 90% 10%Above $0.66 75% 25%
The following table reflects the allocation of total cash distributions to the general and limited partners applicable to the period in which the distributions were earned:
Year Ended December 31, 2015 2014 2013 (Thousands of Dollars, Except Per Unit Data)
General partner interest $ 7,844 $ 7,844 $ 7,844General partner incentive distribution 43,220 43,220 43,220
Total general partner distribution 51,064 51,064 51,064Limited partners’ distribution 341,140 341,140 341,140
Total cash distributions $ 392,204 $ 392,204 $ 392,204
Cash distributions per unit applicable to limited partners $ 4.380 $ 4.380 $ 4.380

Table of Contents NUSTAR ENERGY L.P. AND SUBSIDIARIES
NOTES TO CONSOLIDATED FINANCIAL STATEMENTS – (Continued)
89
The following table summarizes information related to our quarterly cash distributions:
Quarter Ended
CashDistributions
Per UnitTotal Cash
Distributions Record Date Payment Date(Thousands of Dollars)
December 31, 2015 (a) $ 1.095 $ 98,051 February 8, 2016 February 12, 2016September 30, 2015 $ 1.095 $ 98,051 November 9, 2015 November 13, 2015June 30, 2015 $ 1.095 $ 98,051 August 7, 2015 August 13, 2015March 31, 2015 $ 1.095 $ 98,051 May 8, 2015 May 14, 2015
(a) The distribution was announced on January 29, 2016.
22. NET INCOME (LOSS) PER UNIT
The following table details the calculation of earnings per unit:
Year Ended December 31, 2015 2014 2013 (Thousands of Dollars, Except Per Unit Data)
Net income (loss) attributable to NuStar Energy L.P. $ 306,720 $ 210,773 $ (273,770)Less general partner distribution (including incentive distribution rights) 51,064 51,064 51,064Less limited partner distribution 341,140 341,140 341,140
Distributions greater than earnings $ (85,484) $ (181,431) $ (665,974)
General partner earnings:Distributions $ 51,064 $ 51,064 $ 51,064Allocation of distributions greater than earnings (2%) (1,710) (3,630) (13,318)
Total $ 49,354 $ 47,434 $ 37,746
Limited partner earnings:Distributions $ 341,140 $ 341,140 $ 341,140Allocation of distributions greater than earnings (98%) (83,774) (177,801) (652,656)
Total $ 257,366 $ 163,339 $ (311,516)
Weighted-average limited partner units outstanding 77,886,078 77,886,078 77,886,078
Net income (loss) per unit applicable to limited partners $ 3.30 $ 2.10 $ (4.00)

Table of Contents NUSTAR ENERGY L.P. AND SUBSIDIARIES
NOTES TO CONSOLIDATED FINANCIAL STATEMENTS – (Continued)
90
23. STATEMENTS OF CASH FLOWS
Changes in current assets and current liabilities were as follows:
Year Ended December 31, 2015 2014 2013 (Thousands of Dollars)
Decrease (increase) in current assets:Accounts receivable $ 67,257 $ 72,298 $ 107,209Receivable from related parties — 50,918 58,692Inventories 16,776 82,075 31,975Other current assets 4,414 3,785 26,139
Increase (decrease) in current liabilities:Accounts payable (32,152) (153,671) (96,330)Payable to related party (872) 837 6,922Accrued interest payable 941 303 9,370Accrued liabilities (7,834) 22,980 (32,452)Taxes other than income tax (1,522) 4,341 (87)Income tax payable 3,551 (1,448) 1,338
Changes in current assets and current liabilities $ 50,559 $ 82,418 $ 112,776
The above changes in current assets and current liabilities differ from changes between amounts reflected in the applicable consolidated balance sheets due to:
• current assets and current liabilities acquired and disposed during the period; • the change in the amount accrued for capital expenditures; and• the effect of foreign currency translation.
Non-cash financing activities for the years ended December 31, 2015 and 2013 mainly consist of changes in the fair values of our interest rate swap agreements.
Cash flows related to interest and income taxes were as follows:
Year Ended December 31, 2015 2014 2013 (Thousands of Dollars)
Cash paid for interest, net of amount capitalized $ 133,388 $ 129,377 $ 113,805Cash paid for income taxes, net of tax refunds received $ 9,971 $ 6,699 $ 11,386

Table of Contents NUSTAR ENERGY L.P. AND SUBSIDIARIES
NOTES TO CONSOLIDATED FINANCIAL STATEMENTS – (Continued)
91
24. INCOME TAXES
Components of income tax expense related to certain of our continuing operations conducted through separate taxable wholly owned corporate subsidiaries were as follows:
Year Ended December 31, 2015 2014 2013 (Thousands of Dollars)
Current:U.S. $ 908 $ (182) $ 3,098Foreign 9,820 7,516 9,273Foreign withholding tax 1,926 — —
Total current 12,654 7,334 12,371
Deferred:U.S. 1,022 1,889 1,687Foreign (1,464) 1,578 (1,305)Foreign withholding tax 2,500 — —
Total deferred 2,058 3,467 382
Total income tax expense $ 14,712 $ 10,801 $ 12,753
The difference between income tax expense recorded in our consolidated statements of income and income taxes computed by applying the statutory federal income tax rate (35% for all years presented) to income before income tax expense is due to the fact that the majority of our income is not subject to federal income tax due to our status as a limited partnership.
The tax effects of significant temporary differences representing deferred income tax assets and liabilities were as follows:
December 31, 2015 2014 (Thousands of Dollars)
Deferred income tax assets:Net operating losses $ 33,043 $ 35,698Environmental and legal reserves 894 664Allowance for bad debt 2,698 1,261Other 1,758 1,827
Total deferred income tax assets 38,393 39,450Less: Valuation allowance (13,151) (14,532)
Net deferred income tax assets 25,242 24,918
Deferred income tax liabilities:Property, plant and equipment (44,880) (47,797)Foreign withholding tax (2,314) —
Total deferred income tax liabilities (47,194) (47,797)
Net deferred income tax liability $ (21,952) $ (22,879)
Reported on the consolidated balance sheets as:Deferred income tax asset $ 2,858 $ 4,429Deferred income tax liability (24,810) (27,308)
Net deferred income tax liability $ (21,952) $ (22,879)

Table of Contents NUSTAR ENERGY L.P. AND SUBSIDIARIES
NOTES TO CONSOLIDATED FINANCIAL STATEMENTS – (Continued)
92
As of December 31, 2015, our U.S. and foreign corporate operations have net operating loss carryforwards for tax purposes totaling approximately $83.3 million and $13.1 million, respectively, which are subject to various limitations on use and expire in years 2021 through 2024 for U.S. losses and in years 2016 and 2018 for foreign losses.
As of December 31, 2015 and 2014, we recorded a valuation allowance of $13.2 million and $14.5 million, respectively, related to our deferred tax assets. We estimate the amount of valuation allowance based upon our expectations of taxable income in the various jurisdictions in which we operate and the period over which we can utilize those future deductions. The valuation allowance reflects uncertainties related to our ability to utilize certain net operating loss carryforwards before they expire. In 2015, the valuation allowance decreased $1.1 million for the U.S. net operating loss and decreased $0.2 million for the foreign net operating loss, due to changes in our estimates of the amount of those loss carryforwards that will be realized, based upon future taxable income.
The realization of net deferred income tax assets recorded as of December 31, 2015 is dependent upon our ability to generate future taxable income in the United States. We believe it is more likely than not that the net deferred income tax assets as of December 31, 2015 will be realized, based on expected future taxable income.
RepatriationPreviously all undistributed earnings of our foreign subsidiaries were indefinitely reinvested. In the fourth quarter of 2015, management determined that we would begin to repatriate a portion of undistributed foreign earnings in order to provide greater flexibility to meet cash flow needs. As a result, we recognized a current tax liability of $1.9 million and a deferred tax liability of $2.5 million related to foreign withholding taxes on approximately $90.0 million of undistributed foreign earnings.
St. Eustatius Tax Agreement On February 22, 2006, we entered into a Tax and Maritime Agreement with the governments of St. Eustatius and the Netherlands Antilles (the 2005 Tax Agreement). The 2005 Tax Agreement was effective beginning January 1, 2005 and expired on December 31, 2014. The 2005 Tax Agreement provides for annual minimum profit tax of approximately $0.6 million, beginning as of January 1, 2005.
Effective January 1, 2011, the Netherlands Antilles ceased to exist, and St. Eustatius became part of the Netherlands. The Netherlands Tax Ministry (the Ministry) contends that as of January 2011, we are subject to real estate tax rather than profit tax as expressed in our 2005 Tax Agreement. In 2013, the Ministry issued a property tax assessment for years 2011 through 2012. We objected to and appealed the assessment. The Ministry later issued property tax assessments for the years 2013 and 2014, to which we have or will file similar objections. In 2013, we filed a lawsuit in the Netherlands civil court seeking to enforce the terms of our existing 2005 Tax Agreement. In 2014, the Netherlands civil court determined that it did not have jurisdiction and deferred to the jurisdiction of the tax court; we appealed this decision. In 2015, the tax court held that NuStar was obligated to pay the property tax. In February 2016, the civil appellate court also ruled against NuStar, deferring to the decision of the tax court. We are evaluating whether to file a further appeal.
25. SEGMENT INFORMATION
Our reportable business segments consist of pipeline, storage and fuels marketing. Our segments represent strategic business units that offer different services and products. We evaluate the performance of each segment based on its respective operating income, before general and administrative expenses and certain non-segmental depreciation and amortization expense. General and administrative expenses are not allocated to the operating segments since those expenses relate primarily to the overall management at the entity level. Our principal operations include the transportation of petroleum products and anhydrous ammonia, the terminalling and storage of petroleum products and the marketing of petroleum products. Intersegment revenues result from storage agreements with wholly owned subsidiaries of NuStar Energy at lease rates consistent with rates charged to third parties for storage. Related party revenues mainly resulted from storage agreements with our joint ventures.

Table of Contents NUSTAR ENERGY L.P. AND SUBSIDIARIES
NOTES TO CONSOLIDATED FINANCIAL STATEMENTS – (Continued)
93
Results of operations for the reportable segments were as follows:
Year Ended December 31, 2015 2014 2013 (Thousands of Dollars)
Revenues:Pipeline:
Third parties $ 508,522 $ 477,030 $ 411,529Storage:
Third parties 599,302 537,142 518,253Intersegment 25,606 26,435 32,044Related party — 929 6,252
Total storage 624,908 564,506 556,549Fuels marketing:
Third parties 976,216 2,060,017 2,519,053Related party — — 8,645
Total fuels marketing 976,216 2,060,017 2,527,698Consolidation and intersegment eliminations (25,606) (26,435) (32,044)
Total revenues $ 2,084,040 $ 3,075,118 $ 3,463,732
Depreciation and amortization expense:Pipeline $ 84,951 $ 77,691 $ 68,871Storage 116,768 103,848 99,868Fuels marketing — 16 27
Total segment depreciation and amortization expense 201,719 181,555 168,766Other depreciation and amortization expense 8,491 10,153 10,155
Total depreciation and amortization expense $ 210,210 $ 191,708 $ 178,921
Operating income (loss):Pipeline $ 270,349 $ 245,233 $ 208,293Storage 217,818 183,104 (127,484)Fuels marketing 13,507 24,805 (126)Consolidation and intersegment eliminations 42 (32) 1,437
Total segment operating income 501,716 453,110 82,120Less general and administrative expenses 102,521 96,056 91,086Less other depreciation and amortization expense 8,491 10,153 10,155
Total operating income (loss) $ 390,704 $ 346,901 $ (19,121) Revenues by geographic area are shown in the table below.
Year Ended December 31, 2015 2014 2013 (Thousands of Dollars)
United States $ 1,599,088 $ 2,276,609 $ 2,340,694Netherlands 386,282 705,207 1,027,260Other 98,670 93,302 95,778
Consolidated revenues $ 2,084,040 $ 3,075,118 $ 3,463,732

Table of Contents NUSTAR ENERGY L.P. AND SUBSIDIARIES
NOTES TO CONSOLIDATED FINANCIAL STATEMENTS – (Continued)
94
For the years ended December 31, 2015, 2014 and 2013, Valero Energy Corporation accounted for approximately 16%, or $331.7 million, 9%, or $282.9 million, and 15%, or $534.2 million, of our consolidated revenues, respectively. These revenues were included in all of our reportable business segments. No other single customer accounted for 10% or more of our consolidated revenues.
Total amounts of property, plant and equipment, net by geographic area were as follows:
December 31, 2015 2014 (Thousands of Dollars)
United States $ 3,049,334 $ 2,809,462Netherlands 449,406 451,564Other 184,831 199,706
Consolidated long-lived assets $ 3,683,571 $ 3,460,732
Total assets by reportable segment were as follows:
December 31, 2015 2014 (Thousands of Dollars)
Pipeline $ 2,051,866 $ 1,962,821Storage 2,438,621 2,241,573Fuels marketing 156,866 227,642
Total segment assets 4,647,353 4,432,036Other partnership assets 501,909 486,760
Total consolidated assets $ 5,149,262 $ 4,918,796
Capital expenditures, including acquisitions and investments in other noncurrent assets, by reportable segment were as follows:
Year Ended December 31, 2015 2014 2013 (Thousands of Dollars)
Pipeline $ 175,657 $ 244,713 $ 165,096Storage 285,258 108,457 170,637Fuels marketing — — 69Other partnership assets 9,957 3,795 7,518
Total capital expenditures $ 470,872 $ 356,965 $ 343,320

Table of Contents NUSTAR ENERGY L.P. AND SUBSIDIARIES
NOTES TO CONSOLIDATED FINANCIAL STATEMENTS – (Continued)
95
26. CONDENSED CONSOLIDATING FINANCIAL STATEMENTS
NuStar Energy has no operations and its assets consist mainly of its investments in NuStar Logistics and NuPOP, both wholly owned subsidiaries. The senior and subordinated notes issued by NuStar Logistics are fully and unconditionally guaranteed by NuStar Energy and NuPOP. As a result, the following condensed consolidating financial statements are presented as an alternative to providing separate financial statements for NuStar Logistics and NuPOP.
Condensed Consolidating Balance SheetsDecember 31, 2015
(Thousands of Dollars)
NuStarEnergy
NuStarLogistics NuPOP
Non-GuarantorSubsidiaries Eliminations Consolidated
AssetsCash and cash equivalents $ 885 $ 4 $ — $ 117,973 $ — $ 118,862Receivables, net — 419 — 144,645 — 145,064Inventories — 1,776 3,648 33,325 — 38,749Other current assets 140 11,026 497 19,513 — 31,176Intercompany receivable — 1,610,370 — — (1,610,370) —
Total current assets 1,025 1,623,595 4,145 315,456 (1,610,370) 333,851Property, plant and equipment, net — 1,915,370 570,415 1,197,786 — 3,683,571Intangible assets, net — 48,961 — 63,050 — 112,011Goodwill — 149,453 170,652 376,532 — 696,637Investment in wholly owned
subsidiaries 2,205,904 48,547 1,031,162 915,115 (4,200,728) —Deferred income tax asset — — — 4,037 (1,179) 2,858Other long-term assets, net 933 279,063 26,329 14,009 — 320,334
Total assets $ 2,207,862 $ 4,064,989 $ 1,802,703 $ 2,885,985 $(5,812,277) $ 5,149,262
Liabilities and Partners’ EquityPayables $ 12 $ 52,650 $ 11,193 $ 76,091 $ — $ 139,946Short-term debt — 84,000 — — — 84,000Accrued interest payable — 34,271 — 15 — 34,286Accrued liabilities 723 32,816 5,753 15,902 — 55,194Taxes other than income tax 126 6,452 3,325 2,907 — 12,810Income tax payable — 1,362 9 4,606 — 5,977Intercompany payable 508,363 — 858,018 243,989 (1,610,370) —
Total current liabilities 509,224 211,551 878,298 343,510 (1,610,370) 332,213Long-term debt — 3,025,849 — 53,500 — 3,079,349Long-term payable to related party — 26,638 — 5,442 — 32,080Deferred income tax liability — 1,143 36 24,810 (1,179) 24,810Other long-term liabilities — 37,209 9,294 24,463 — 70,966Total partners’ equity 1,698,638 762,599 915,075 2,434,260 (4,200,728) 1,609,844
Total liabilities and partners’ equity $ 2,207,862 $ 4,064,989 $ 1,802,703 $ 2,885,985 $(5,812,277) $ 5,149,262

Table of Contents NUSTAR ENERGY L.P. AND SUBSIDIARIES
NOTES TO CONSOLIDATED FINANCIAL STATEMENTS – (Continued)
96
Condensed Consolidating Balance SheetsDecember 31, 2014
(Thousands of Dollars)
NuStarEnergy
NuStarLogistics NuPOP
Non-GuarantorSubsidiaries Eliminations Consolidated
AssetsCash and cash equivalents $ 923 $ 6 $ — $ 86,983 $ — $ 87,912Receivables, net — 47,038 18,347 143,093 — 208,478Inventories — 1,998 3,768 49,989 (42) 55,713Other current assets — 10,403 418 25,239 (116) 35,944Assets held for sale — — — 1,100 — 1,100Intercompany receivable — 1,438,675 — — (1,438,675) —
Total current assets 923 1,498,120 22,533 306,404 (1,438,833) 389,147Property, plant and equipment, net — 1,820,126 559,808 1,080,798 — 3,460,732Intangible assets, net — 55,801 — 2,869 — 58,670Goodwill — 149,453 170,652 297,324 — 617,429Investment in wholly owned
subsidiaries 2,289,673 37,179 910,394 913,343 (4,150,589) —Investment in joint venture — — — 74,223 — 74,223Deferred income tax asset — — — 4,429 — 4,429Other long-term assets, net 673 279,058 26,329 8,106 — 314,166
Total assets $ 2,291,269 $ 3,839,737 $ 1,689,716 $ 2,687,496 $(5,589,422) $ 4,918,796
Liabilities and Partners’ EquityPayables $ — $ 60,687 $ 8,211 $ 108,286 $ — $ 177,184Short-term debt — 77,000 — — — 77,000Accrued interest payable — 33,340 — 5 — 33,345Accrued liabilities 862 32,178 6,965 21,020 — 61,025Taxes other than income tax 125 7,896 3,099 3,001 — 14,121Income tax payable — — 4 2,629 (116) 2,517Intercompany payable 506,160 — 751,023 181,492 (1,438,675) —
Total current liabilities 507,147 211,101 769,302 316,433 (1,438,791) 365,192Long-term debt — 2,749,452 — — — 2,749,452Long-term payable to related party — 28,094 — 5,443 — 33,537Deferred income tax liability — 528 22 26,758 — 27,308Other long-term liabilities — 13,681 6,963 6,453 — 27,097Total partners’ equity 1,784,122 836,881 913,429 2,332,409 (4,150,631) 1,716,210
Total liabilities and partners’ equity $ 2,291,269 $ 3,839,737 $ 1,689,716 $ 2,687,496 $(5,589,422) $ 4,918,796

Table of Contents NUSTAR ENERGY L.P. AND SUBSIDIARIES
NOTES TO CONSOLIDATED FINANCIAL STATEMENTS – (Continued)
97
Condensed Consolidating Statements of IncomeFor the Year Ended December 31, 2015
(Thousands of Dollars)
NuStarEnergy
NuStarLogistics NuPOP
Non-GuarantorSubsidiaries Eliminations Consolidated
Revenues $ — $ 547,959 $ 215,469 $ 1,322,675 $ (2,063) $ 2,084,040Costs and expenses 1,717 293,708 140,081 1,259,935 (2,105) 1,693,336
Operating (loss) income (1,717) 254,251 75,388 62,740 42 390,704Equity in earnings (loss)
of subsidiaries 308,437 (7,257) 120,768 197,760 (619,708) —Interest (expense) income, net — (137,847) 1,611 4,368 — (131,868)Other income, net — 1,179 5 60,638 — 61,822
Income from continuing operations before income tax (benefit) expense 306,720 110,326 197,772 325,506 (619,666) 320,658
Income tax (benefit) expense — (392) 23 15,081 — 14,712Income from continuing
operations 306,720 110,718 197,749 310,425 (619,666) 305,946Income from discontinued
operations, net of tax — — — 774 — 774Net income $ 306,720 $ 110,718 $ 197,749 $ 311,199 $ (619,666) $ 306,720
Condensed Consolidating Statements of Income (Loss)
For the Year Ended December 31, 2014 (Thousands of Dollars)
NuStarEnergy
NuStarLogistics NuPOP
Non-GuarantorSubsidiaries Eliminations Consolidated
Revenues $ — $ 510,833 $ 229,211 $ 2,344,750 $ (9,676) $ 3,075,118Costs and expenses 1,753 287,614 149,955 2,298,540 (9,645) 2,728,217
Operating (loss) income (1,753) 223,219 79,256 46,210 (31) 346,901Equity in earnings (loss)
of subsidiaries 212,527 (12,798) 62,946 142,238 (404,913) —Equity in (loss) earnings of
joint ventures — (8,278) — 13,074 — 4,796Interest (expense) income, net — (132,274) 89 959 — (131,226)Other income (expense), net — 511 (37) 4,025 — 4,499
Income from continuing operations before income tax expense 210,774 70,380 142,254 206,506 (404,944) 224,970
Income tax expense 1 5 23 10,772 — 10,801Income from continuing
operations 210,773 70,375 142,231 195,734 (404,944) 214,169Loss from discontinued
operations, net of tax — (169) — (3,622) — (3,791)Net income 210,773 70,206 142,231 192,112 (404,944) 210,378
Less net loss attributable tononcontrolling interest — — — (395) — (395)Net income attributable to
NuStar Energy L.P. $ 210,773 $ 70,206 $ 142,231 $ 192,507 $ (404,944) $ 210,773

Table of Contents NUSTAR ENERGY L.P. AND SUBSIDIARIES
NOTES TO CONSOLIDATED FINANCIAL STATEMENTS – (Continued)
98
Condensed Consolidating Statements of Income (Loss)For the Year Ended December 31, 2013
(Thousands of Dollars)
NuStarEnergy
NuStarLogistics NuPOP
Non-GuarantorSubsidiaries Eliminations Consolidated
Revenues $ — $ 415,128 $ 218,591 $ 2,864,160 $ (34,147) $ 3,463,732Costs and expenses 1,908 242,743 147,117 3,125,253 (34,168) 3,482,853
Operating (loss) income (1,908) 172,385 71,474 (261,093) 21 (19,121)Equity in (loss) earnings
of subsidiaries (271,862) 16,531 (347,808) (281,327) 884,466 —Equity in (loss) earnings of
joint ventures — (49,599) — 9,629 — (39,970)Interest (expense) income, net — (116,624) (4,851) 469 — (121,006)Other (expense) income, net — (115) (127) 7,583 — 7,341
(Loss) income from continuing operations before income tax expense (273,770) 22,578 (281,312) (524,739) 884,487 (172,756)
Income tax expense — 579 8 12,166 — 12,753(Loss) income from continuing
operations (273,770) 21,999 (281,320) (536,905) 884,487 (185,509)Loss from discontinued
operations, net of tax — (12,317) — (86,845) — (99,162)Net (loss) income (273,770) 9,682 (281,320) (623,750) 884,487 (284,671)
Less net loss attributable tononcontrolling interest — — — (10,901) — (10,901)Net (loss) income attributable to
NuStar Energy L.P. $ (273,770) $ 9,682 $ (281,320) $ (612,849) $ 884,487 $ (273,770)

Table of Contents NUSTAR ENERGY L.P. AND SUBSIDIARIES
NOTES TO CONSOLIDATED FINANCIAL STATEMENTS – (Continued)
99
Condensed Consolidating Statements of Comprehensive IncomeFor the Year Ended December 31, 2015
(Thousands of Dollars)
NuStarEnergy
NuStarLogistics NuPOP
Non-GuarantorSubsidiaries Eliminations Consolidated
Net income $ 306,720 $ 110,718 $ 197,749 $ 311,199 $ (619,666) $ 306,720
Other comprehensive income:Foreign currency translation adjustment — — — (31,987) — (31,987)Net unrealized gain on cash flow hedges — 1,303 — — — 1,303Net loss reclassified into income on cash flow hedges — 9,802 — — — 9,802
Total other comprehensive income (loss) — 11,105 — (31,987) — (20,882)
Comprehensive income $ 306,720 $ 121,823 $ 197,749 $ 279,212 $ (619,666) $ 285,838
Condensed Consolidating Statements of Comprehensive Income (Loss)For the Year Ended December 31, 2014
(Thousands of Dollars)
NuStarEnergy
NuStarLogistics NuPOP
Non-GuarantorSubsidiaries Eliminations Consolidated
Net income $ 210,773 $ 70,206 $ 142,231 $ 192,112 $ (404,944) $ 210,378
Other comprehensive income (loss):Foreign currency translation
adjustment — 3,723 — (19,337) — (15,614)Net loss reclassified into
income on cash flow hedges — 10,663 — — — 10,663Total other comprehensive
income (loss) — 14,386 — (19,337) — (4,951)
Comprehensive income 210,773 84,592 142,231 172,775 (404,944) 205,427Less comprehensive loss
attributable to noncontrolling interest — — — (828) — (828)
Comprehensive income attributable to NuStar Energy L.P. $ 210,773 $ 84,592 $ 142,231 $ 173,603 $ (404,944) $ 206,255

Table of Contents NUSTAR ENERGY L.P. AND SUBSIDIARIES
NOTES TO CONSOLIDATED FINANCIAL STATEMENTS – (Continued)
100
Condensed Consolidating Statements of Comprehensive Income (Loss)For the Year Ended December 31, 2013
(Thousands of Dollars)
NuStarEnergy
NuStarLogistics NuPOP
Non-GuarantorSubsidiaries Eliminations Consolidated
Net (loss) income $ (273,770) $ 9,682 $ (281,320) $ (623,750) $ 884,487 $ (284,671)
Other comprehensive income (loss):Foreign currency translation
adjustment — (3,090) — (16,274) — (19,364)Net unrealized gain on cash
flow hedges — 7,213 — — — 7,213Net loss reclassified into
income on cash flow hedges — 7,570 — — — 7,570Total other comprehensive
income (loss) — 11,693 — (16,274) — (4,581)
Comprehensive (loss) income (273,770) 21,375 (281,320) (640,024) 884,487 (289,252)Less comprehensive loss
attributable to noncontrolling interest — — — (10,953) — (10,953)
Comprehensive (loss) incomeattributable to NuStar Energy L.P. $ (273,770) $ 21,375 $ (281,320) $ (629,071) $ 884,487 $ (278,299)

Table of Contents NUSTAR ENERGY L.P. AND SUBSIDIARIES
NOTES TO CONSOLIDATED FINANCIAL STATEMENTS – (Continued)
101
Condensed Consolidating Statements of Cash FlowsFor the Year Ended December 31, 2015
(Thousands of Dollars)
NuStarEnergy
NuStarLogistics NuPOP
Non-GuarantorSubsidiaries Eliminations Consolidated
Net cash provided by operating activities $ 389,967 $ 237,780 $ 119,928 $ 365,588 $ (588,326) $ 524,937
Cash flows from investing activities:Capital expenditures — (201,388) (39,533) (83,887) — (324,808)Change in accounts payable
related to capital expenditures — (4,950) 33 1,761 — (3,156)Acquisitions — — — (142,500) — (142,500)Increase in other long-term assets — — — (3,564) — (3,564)Proceeds from sale or disposition
of assets — 10,320 22 6,790 — 17,132Proceeds from insurance recoveries — — — 4,867 — 4,867
Net cash used in investing activities — (196,018) (39,478) (216,533) — (452,029)
Cash flows from financing activities:Debt borrowings — 1,589,131 — 94,500 — 1,683,631Debt repayments — (1,275,910) — (41,000) — (1,316,910)Distributions to unitholders and
general partner (392,204) (196,102) (196,102) (196,122) 588,326 (392,204)Net intercompany activity 2,199 (155,278) 115,652 37,427 — —Other, net — (3,605) — (141) — (3,746)
Net cash used in financing activities (390,005) (41,764) (80,450) (105,336) 588,326 (29,229)
Effect of foreign exchange rate changes on cash — — — (12,729) — (12,729)
Net (decrease) increase in cash and cash equivalents (38) (2) — 30,990 — 30,950Cash and cash equivalents as of the
beginning of the period 923 6 — 86,983 — 87,912Cash and cash equivalents as of the
end of the period $ 885 $ 4 $ — $ 117,973 $ — $ 118,862

Table of Contents NUSTAR ENERGY L.P. AND SUBSIDIARIES
NOTES TO CONSOLIDATED FINANCIAL STATEMENTS – (Continued)
102
Condensed Consolidating Statements of Cash FlowsFor the Year Ended December 31, 2014
(Thousands of Dollars)
NuStarEnergy
NuStarLogistics NuPOP
Non-GuarantorSubsidiaries Eliminations Consolidated
Net cash provided by operating activities $ 390,543 $ 221,422 $ 111,931 $ 333,936 $ (539,309) $ 518,523
Cash flows from investing activities:Capital expenditures — (273,785) (14,625) (68,555) — (356,965)Change in accounts payable
related to capital expenditures — 8,741 789 (4,627) — 4,903Proceeds from sale or disposition
of assets — 651 22 25,339 — 26,012Increase in note receivable from
Axeon — (13,328) — — — (13,328)Investment in subsidiaries (23) — 13,340 — (13,317) —Other, net 23 (45) — (831) — (853)
Net cash used in investing activities — (277,766) (474) (48,674) (13,317) (340,231)
Cash flows from financing activities:Debt borrowings — 1,318,619 — — — 1,318,619Debt repayments — (1,121,670) — — — (1,121,670)Distributions to unitholders and
general partner (392,204) (245,127) (147,077) (147,105) 539,309 (392,204)Contributions from
(distributions to) affiliates — — — (13,340) 13,340 —Net intercompany activity 1,680 83,387 35,620 (120,687) — —Other, net — (1,166) — 8,259 (23) 7,070
Net cash (used in) provided by financing activities (390,524) 34,043 (111,457) (272,873) 552,626 (188,185)
Effect of foreign exchange rate changes on cash — — — (2,938) — (2,938)
Net increase (decrease) in cash and cash equivalents 19 (22,301) — 9,451 — (12,831)
Cash and cash equivalents as of the beginning of the period 904 22,307 — 77,532 — 100,743
Cash and cash equivalents as of the end of the period $ 923 $ 6 $ — $ 86,983 $ — $ 87,912

Table of Contents NUSTAR ENERGY L.P. AND SUBSIDIARIES
NOTES TO CONSOLIDATED FINANCIAL STATEMENTS – (Continued)
103
Condensed Consolidating Statements of Cash FlowsFor the Year Ended December 31, 2013
(Thousands of Dollars)
NuStarEnergy
NuStarLogistics NuPOP
Non-GuarantorSubsidiaries Eliminations Consolidated
Net cash provided by operatingactivities $ 390,002 $ 210,742 $ 84,490 $ 192,228 $ (392,243) $ 485,219
Cash flows from investing activities:Capital expenditures — (224,798) (19,049) (99,473) — (343,320)Change in accounts payable
related to capital expenditures — (9,700) 824 3,492 — (5,384)Proceeds from sale or disposition
of assets — 118,806 35 165 — 119,006Increase in note receivable from
Axeon — (80,961) — — — (80,961)Investment in subsidiaries (302) 527 — 3 (228) —Other, net 302 (604) — — — (302)
Net cash used in investing activities — (196,730) (18,190) (95,813) (228) (310,961)
Cash flows from financing activities:Debt borrowings — 1,738,451 — — — 1,738,451Debt repayments — (1,866,282) (250,000) (34,461) — (2,150,743)Proceeds from note offerings,
net of issuance costs — 686,863 — — — 686,863Distributions to unitholders and
general partner (392,204) (392,204) — (39) 392,243 (392,204)Payments for termination of
interest rate swaps — (33,697) — — — (33,697)Contributions from
(distributions to) affiliates — 302 — (530) 228 —Net intercompany activity (3,880) (128,277) 183,700 (51,543) — —Other, net (47) 2,027 — — — 1,980
Net cash (used in) provided by financing activities (396,131) 7,183 (66,300) (86,573) 392,471 (149,350)
Effect of foreign exchange rate changes on cash — — — (7,767) — (7,767)
Net (decrease) increase in cash and cash equivalents (6,129) 21,195 — 2,075 — 17,141
Cash and cash equivalents as of the beginning of the period 7,033 1,112 — 75,457 — 83,602
Cash and cash equivalents as of the end of the period $ 904 $ 22,307 $ — $ 77,532 $ — $ 100,743

Table of Contents NUSTAR ENERGY L.P. AND SUBSIDIARIES
NOTES TO CONSOLIDATED FINANCIAL STATEMENTS – (Continued)
104
27. QUARTERLY FINANCIAL DATA (UNAUDITED)
The following table summarizes quarterly financial data for the years ended December 31, 2015 and 2014:
FirstQuarter
SecondQuarter
ThirdQuarter
FourthQuarter Total
(Thousands of Dollars, Except Per Unit Data)
2015:Revenues $ 554,944 $ 570,611 $ 493,566 $ 464,919 $ 2,084,040Operating income $ 99,281 $ 92,405 $ 100,994 $ 98,024 $ 390,704
Income from continuing operations $ 127,125 $ 54,325 $ 65,016 $ 59,480 $ 305,946Income from discontinued
operations, net of tax 774 — — — 774Net income $ 127,899 $ 54,325 $ 65,016 $ 59,480 $ 306,720
Net income per unit applicable to limitedpartners:Continuing operations $ 1.46 $ 0.54 $ 0.68 $ 0.61 $ 3.29Discontinued operations 0.01 — — — 0.01
Total $ 1.47 $ 0.54 $ 0.68 $ 0.61 $ 3.30
Cash distributions per unit applicable to limitedpartners $ 1.095 $ 1.095 $ 1.095 $ 1.095 $ 4.380
2014:Revenues $ 849,213 $ 749,745 $ 794,422 $ 681,738 $ 3,075,118Operating income $ 81,103 $ 89,354 $ 95,098 $ 81,346 $ 346,901
Income from continuing operations $ 42,996 $ 57,187 $ 59,117 $ 54,869 $ 214,169(Loss) income from discontinued
operations, net of tax (3,359) (1,788) 2,831 (1,475) (3,791)Net income $ 39,637 $ 55,399 $ 61,948 $ 53,394 $ 210,378
Net income (loss) per unit applicable to limitedpartners:Continuing operations $ 0.40 $ 0.58 $ 0.61 $ 0.55 $ 2.14Discontinued operations (0.04) (0.02) 0.03 (0.01) (0.04)
Total $ 0.36 $ 0.56 $ 0.64 $ 0.54 $ 2.10
Cash distributions per unit applicable to limitedpartners $ 1.095 $ 1.095 $ 1.095 $ 1.095 $ 4.380

Table of Contents NUSTAR ENERGY L.P. AND SUBSIDIARIES
NOTES TO CONSOLIDATED FINANCIAL STATEMENTS – (Continued)
105
28. SUBSEQUENT EVENT
On March 1, 2016, NuStar GP, LLC intends to transfer and assign to NuStar Services Company LLC, a wholly owned subsidiary of NuStar Energy, all of NuStar GP, LLC’s employees and related benefit plans. Following the transfer of employees, we will pay employee costs directly and sponsor the following related benefit plans, among others:
• The NuStar Thrift Plan (the Thrift Plan), a qualified employee profit-sharing plan;• The NuStar Pension Plan, a qualified non-contributory defined benefit pension plan;• The NuStar Excess Thrift Plan, a benefit plan to those employees whose compensation and/or annual contributions
under the Thrift Plan are subject to the limitations applicable to qualified retirement plans;• The NuStar Excess Pension Plan, a benefit plan to a select group of management or other highly compensated
employees; and• The NuStar GP, LLC Retiree Welfare Benefits Plan, a medical benefits plan for certain retired employees.
We do not expect this transfer of employees and related benefit plans to materially change our expenses since we currently reimburse NuStar GP, LLC for all employee costs attributable to us. Our consolidated balance sheet will reflect employee-related obligations to external parties instead of related party payables to NuStar GP, LLC.
On January 28, 2016, at a special meeting of unitholders, NuStar Energy’s unitholders approved the Fifth Amended and Restated 2000 Long-Term Incentive Plan (the Amended Plan), which, among other items, provided that NuStar Energy could use newly issued units from NuStar Energy to satisfy unit awards. The unitholder vote approving the Amended Plan on January 28, 2016, coupled with the subsequent transfer of the employees of NuStar GP, LLC into NuStar Services Company LLC, will result in the classification of substantially all of our currently outstanding and subsequently issued awards as equity awards. At the time of the transfer of employees, NuStar Services Company LLC will assume obligations associated therewith, including all outstanding awards, and we intend to satisfy substantively all of the vestings of such awards with newly issued units of NuStar Energy.

Table of Contents
106
ITEM 9. CHANGES IN AND DISAGREEMENTS WITH ACCOUNTANTS ON ACCOUNTING AND FINANCIAL DISCLOSURE
None.
ITEM 9A. CONTROLS AND PROCEDURES
DISCLOSURE CONTROLS AND PROCEDURES.
Our management has evaluated, with the participation of the principal executive officer and principal financial officer of NuStar GP, LLC, the effectiveness of our disclosure controls and procedures (as defined in Rule 13a-15(e) under the Securities Exchange Act of 1934 (the Exchange Act)) as of the end of the period covered by this report, and has concluded that our disclosure controls and procedures were effective as of December 31, 2015.
INTERNAL CONTROL OVER FINANCIAL REPORTING.(a) Management’s Report on Internal Control over Financial Reporting.
Management’s report on NuStar Energy L.P.’s internal control over financial reporting required by Item 9A. appears in Item 8. of this Form 10-K, and is incorporated herein by reference.
(b) Attestation Report of the Registered Public Accounting Firm.
The report of KPMG LLP on NuStar Energy L.P.’s internal control over financial reporting appears in Item 8. of this Form 10-K, and is incorporated herein by reference.
(c) Changes in Internal Controls over Financial Reporting.
There has been no change in our internal control over financial reporting that occurred during our last fiscal quarter that has materially affected, or is reasonably likely to materially affect, our internal control over financial reporting.
ITEM 9B. OTHER INFORMATION
None.

Table of Contents
107
PART III
ITEM 10. DIRECTORS, EXECUTIVE OFFICERS AND CORPORATE GOVERNANCE
DIRECTORS AND EXECUTIVE OFFICERS OF NUSTAR GP, LLC
We do not have directors or officers. The directors and officers of NuStar GP, LLC, the general partner of our general partner, Riverwalk Logistics, L.P., perform all of our management functions. NuStar GP Holdings, LLC (NuStar GP Holdings), the sole member of NuStar GP, LLC, selects the directors of NuStar GP, LLC (the Board). Officers of NuStar GP, LLC are appointed by its directors.
Set forth below is certain information concerning the directors and executive officers of NuStar GP, LLC, effective as of February 19, 2016.
Name Age Position Held with NuStar GP, LLCWilliam E. Greehey 79 Chairman of the BoardBradley C. Barron 50 President, Chief Executive Officer and DirectorJ. Dan Bates 71 DirectorDan J. Hill 75 DirectorRobert J. Munch 64 DirectorW. Grady Rosier 67 DirectorMary Rose Brown 59 Executive Vice President and Chief Administrative OfficerThomas R. Shoaf 57 Executive Vice President and Chief Financial OfficerJorge A. del Alamo 46 Senior Vice President and ControllerAmy L. Perry 47 Senior Vice President, General Counsel-Corporate & Commercial
Law and Corporate SecretaryKaren M. Thompson 48 Senior Vice President and General Counsel-Litigation, Regulatory &
Environmental
As a limited partnership, we are not required by the NYSE rules to have a nominating committee, and the Board has historically performed the functions served by a nominating committee. However, in 2013, the Board created a Nominating/Governance & Conflicts Committee to identify candidates for membership on the Board. The members of the Nominating/Governance & Conflicts Committee are Mr. Rosier (Chairman), Mr. Bates, Mr. Hill and Mr. Munch. In accordance with our Corporate Governance Guidelines, individuals are considered for membership on the Board based on their character, judgment, integrity, diversity, age, skills (including financial literacy), independence and experience in the context of the overall needs of the Board. Our directors are also selected based on their knowledge about our industry and their respective experience leading or advising large companies. We require that our directors have the ability to work collegially, exercise good judgment and think critically. In addition, we ask that our directors commit to working hard for our company. The Nominating/Governance & Conflicts Committee strives to find the best possible candidates to represent the interests of NuStar Energy L.P. and its unitholders. As part of its annual self-assessment process, the Board and each of its committees evaluates the mix of independent and non-independent directors, as well as the performance of the directors and the committees, and the Board annually elects a presiding director.
The Board is led by its Chairman, Mr. Greehey. The Board has determined that separating the roles of Chairman and CEO is in the best interest of unitholders at this time. In addition, the Board has appointed Mr. Hill as its presiding director to serve as a point of contact for unitholders wishing to communicate with the Board and to lead executive sessions of the non-management directors.
Mr. Greehey became Chairman of the Board in January 2002. He also has been the Chairman of the board of directors of NuStar GP Holdings since March 2006. Mr. Greehey served as Chairman of the board of directors of Valero Energy Corporation (Valero Energy) from 1979 through January 2007. Mr. Greehey was CEO of Valero Energy from 1979 through December 2005, and President of Valero Energy from 1998 until January 2003.

Table of Contents
108
Mr. Barron became Chief Executive Officer, President and a director of NuStar GP, LLC and NuStar GP Holdings in January 2014. He served as Executive Vice President and General Counsel of NuStar GP, LLC and NuStar GP Holdings from February 2012 until his promotion in January 2014. From April 2007 to February 2012, he served as Senior Vice President and General Counsel of NuStar GP, LLC and NuStar GP Holdings. Mr. Barron also served as Secretary of NuStar GP, LLC and NuStar GP Holdings from April 2007 to February 2009. He served as Vice President, General Counsel and Secretary of NuStar GP, LLC from January 2006 until April 2007 and as Vice President, General Counsel and Secretary of NuStar GP Holdings from March 2006 until his promotion in April 2007. He has been with NuStar GP, LLC since July 2003 and, prior to that, was with Valero Energy from January 2001 to July 2003.
Mr. Bates became a director of NuStar GP, LLC in April 2006. He served as President and CEO of the Southwest Research Institute from 1997 until October 2014 and continues to serve as a director and as President Emeritus of the Southwest Research Institute. Mr. Bates also serves as a director of Signature Science L.L.C., Broadway Bank and Broadway Bankshares, Inc. He served as Chairman or Vice Chairman of the board of directors of the Federal Reserve Bank of Dallas’ San Antonio Branch from January 2005 through December 2009.
Mr. Hill became a director of NuStar GP, LLC in July 2004. From February 2001 through May 2004, he served as a consultant to El Paso Corporation. Prior to that, he served as President and CEO of Coastal Refining and Marketing Company. In 1978, Mr. Hill was named as Senior Vice President of the Coastal Corporation and President of Coastal States Crude Gathering. In 1971, he began managing Coastal’s NGL business. Previously, Mr. Hill worked for Amoco and Mobil.
Mr. Munch became a director of NuStar GP, LLC in January 2016. He served as General Manager and Head of Corporate & Investment Banking of Mizuho Bank, Ltd. from 2006 to 2013 and as Deputy General Manager, Origination, of Mizuho Bank, Ltd. from 2005 to 2006. Prior to his service with Mizuho Bank Ltd., Mr. Munch also served in several senior management positions with Canadian Imperial Bank of Commerce and CIBC World Markets from 1980 to 2001 and Fidelity Union Bancorporation (now Wells Fargo) from 1973 to 1980.
Mr. Rosier became a director of NuStar GP, LLC in March 2013. He has been the President and Chief Executive Officer of McLane Company, Inc., a $44 billion supply chain services company and subsidiary of Berkshire Hathaway, Inc., since February 1995. Mr. Rosier has been with McLane Company, Inc. since 1984, serving in various senior management positions prior to his current position. Mr. Rosier also has served as a director of NVR, Inc. since December 2008. He was formerly a director of Tandy Brands Accessories, Inc. from February 2006 to October 2011, serving as the lead director from October 2009 to October 2010.
Ms. Brown became Executive Vice President and Chief Administrative Officer of NuStar GP, LLC and NuStar GP Holdings in April 2013. She served as Executive Vice President - Administration of NuStar GP, LLC and NuStar GP Holdings from February 2012 until her promotion in April 2013. Ms. Brown served as Senior Vice President - Administration of NuStar GP, LLC from April 2008 through February 2012. She served as Senior Vice President - Corporate Communications of NuStar GP, LLC from April 2007 through April 2008. Prior to her service to NuStar GP, LLC, Ms. Brown served as Senior Vice President - Corporate Communications for Valero Energy from September 1997 to April 2007.
Mr. Shoaf became Executive Vice President and Chief Financial Officer of NuStar GP, LLC and NuStar GP Holdings in January 2014. He served as Senior Vice President and Controller of NuStar GP, LLC and NuStar GP Holdings from February 2012 until his promotion in January 2014. Mr. Shoaf served as Vice President and Controller of NuStar GP, LLC from July 2005 to February 2012 and Vice President and Controller of NuStar GP Holdings from March 2006 until February 2012. He served as Vice President - Structured Finance for Valero Corporate Services Company, a subsidiary of Valero Energy, from 2001 until joining NuStar GP, LLC.
Mr. del Alamo became Senior Vice President and Controller of NuStar GP, LLC and NuStar GP Holdings in July 2014. Prior thereto, he served as Vice President and Controller of NuStar GP, LLC and NuStar GP Holdings since January 2014. He served as Vice President and Assistant Controller of NuStar GP, LLC from July 2010 until his promotion in January 2014. From April 2008 to July 2010 he served as Assistant Controller of NuStar GP, LLC. Prior to his service at NuStar GP, LLC, Mr. del Alamo served as Director-Sarbanes Oxley Compliance for Valero Energy.
Ms. Perry became Senior Vice President, General Counsel-Corporate & Commercial Law and Corporate Secretary of NuStar GP, LLC and NuStar GP Holdings in January 2014. She served as Vice President, Assistant General Counsel and Corporate Secretary of NuStar GP, LLC and as Corporate Secretary of NuStar GP Holdings from February 2010 until her promotion in January 2014. From June 2005 to February 2010 she served as Assistant General Counsel and Assistant Secretary of NuStar GP, LLC and, from March 2006 to February 2010, Assistant Secretary of NuStar GP Holdings. Prior to her service at NuStar GP, LLC, Ms. Perry served as Counsel to Valero Energy.

Table of Contents
109
Ms. Thompson became Senior Vice President, General Counsel-Litigation, Regulatory & Environmental of NuStar GP, LLC and NuStar GP Holdings in January 2014. She served as Vice President, Assistant General Counsel and Assistant Secretary of NuStar GP, LLC from February 2010 until her promotion in January 2014. From May 2007 to February 2010 she served as Assistant General Counsel and Assistant Secretary of NuStar GP, LLC. Prior to her service at NuStar GP, LLC, Ms. Thompson served as Managing Counsel to Valero Energy.
SECTION 16(a) BENEFICIAL OWNERSHIP REPORTING COMPLIANCE
Section 16(a) of the Exchange Act requires directors, executive officers and persons who beneficially own more than 10% of NuStar Energy’s equity securities to file certain reports with the Securities and Exchange Commission (SEC) concerning their beneficial ownership of NuStar Energy’s equity securities. We believe that our directors, executive officers and greater than 10% unitholders have filed all Section 16(a) reports by the applicable deadlines with respect to the year ended December 31, 2015, other than one late Form 5 with respect to a gift of units made by Mr. Greehey during December 2015.
CODE OF ETHICS OF SENIOR FINANCIAL OFFICERS
NuStar GP, LLC has adopted a Code of Ethics for Senior Financial Officers that applies to NuStar GP, LLC’s principal executive officer, principal financial officer and controller. This code charges the senior financial officers with responsibilities regarding honest and ethical conduct, the preparation and quality of the disclosures in documents and reports we file with the SEC, compliance with applicable laws, rules and regulations, adherence to the code and reporting of violations of the code.
CORPORATE GOVERNANCE
AUDIT COMMITTEE
The Audit Committee reviews and reports to the Board on various auditing and accounting matters, including the quality, objectivity and performance of NuStar Energy’s internal and external accountants and auditors, the adequacy of its financial controls and the reliability of financial information reported to the public. The Audit Committee also monitors NuStar Energy’s compliance with environmental laws and regulations. The Board has adopted a written charter for the Audit Committee, a copy of which is available on NuStar Energy’s website at www.nustarenergy.com. The members of the Audit Committee are Mr. Bates (Chairman), Mr. Hill, Mr. Munch and Mr. Rosier. The Board has determined that Mr. Bates is an “audit committee financial expert” (as defined by the SEC), and that each of the members of the Audit Committee is “independent” as that term is used in the NYSE Listing Standards and described below in Item 13. The Audit Committee met eight times during 2015. For further information, see the “Audit Committee Report” below.
AUDIT COMMITTEE REPORT
Management of NuStar GP, LLC is responsible for NuStar Energy’s internal controls and the financial reporting process. KPMG LLP (KPMG), NuStar Energy’s independent registered public accounting firm for the year ended December 31, 2015, is responsible for performing an independent audit of NuStar Energy’s consolidated financial statements in accordance with the standards of the Public Company Accounting Oversight Board (PCAOB) and generally accepted auditing standards, and an audit of NuStar Energy’s internal control over financial reporting in accordance with the standards of the PCAOB, and issuing a report thereon. The Audit Committee monitors and oversees these processes and approves the selection and appointment of NuStar Energy’s independent registered public accounting firm and recommends the ratification of such selection and appointment to the Board.
The Audit Committee has reviewed and discussed NuStar Energy’s audited consolidated financial statements with management and KPMG. The Audit Committee has discussed with KPMG the matters required to be discussed by Auditing Standard No. 16, “Communications with Audit Committees,” issued by the PCAOB. The Audit Committee has received written disclosures and the letter from KPMG required by applicable requirements of the PCAOB concerning independence and has discussed with KPMG its independence.

Table of Contents
110
Based on the foregoing review and discussions and such other matters the Audit Committee deemed relevant and appropriate, the Audit Committee recommended to the Board that the audited consolidated financial statements of NuStar Energy be included in NuStar Energy’s Annual Report on Form 10-K for the year ended December 31, 2015.
Members of the Audit Committee:
J. Dan Bates (Chairman)Dan J. HillRobert J. Munch W. Grady Rosier
RISK OVERSIGHT
Although it is the job of management to assess and manage our risk, the Board of Directors and its Audit Committee (each where applicable) discuss the guidelines and policies that govern the process by which risk assessment and management is undertaken and evaluate reports from various functions with the management team on risk assessment and management. The Board interfaces regularly with management and receives periodic reports that include updates on operational, financial, legal and risk management matters. The Audit Committee assists the Board in oversight of the integrity of NuStar Energy’s financial statements and NuStar Energy’s compliance with legal and regulatory requirements, including those related to the health, safety and environmental performance of our company. The Audit Committee also reviews and assesses the performance of NuStar Energy’s internal audit function and its independent auditors. The Board receives regular reports from the Audit Committee. For a description of our evaluation of compensation risk, see “Evaluation of Compensation Risk” in Item 11 below.

Table of Contents
111
ITEM 11. EXECUTIVE COMPENSATION
COMPENSATION COMMITTEE
The Compensation Committee reviews and reports to the Board on matters related to compensation strategies, policies and programs, including certain personnel policies and policy controls, management development, management succession and benefit programs. The Compensation Committee also approves and administers NuStar Energy’s equity compensation plans and incentive bonus plan. The Board has adopted a written charter for the Compensation Committee, a copy of which is available on NuStar Energy’s website at www.nustarenergy.com. The members of the Compensation Committee are Mr. Hill (Chairman), Mr. Bates, Mr. Munch and Mr. Rosier, none of whom is a current or former employee or officer of NuStar GP, LLC and each of whom has been determined by the Board to be “independent,” as described below in Item 13. The Compensation Committee met four times in 2015.
COMPENSATION COMMITTEE REPORT
The Compensation Committee has reviewed and discussed the Compensation Discussion and Analysis with management. Based on its review and discussion and such other matters the Compensation Committee deemed relevant and appropriate, the Compensation Committee recommended to the Board that the Compensation Discussion and Analysis be included in this Annual Report on Form 10-K.
Members of the Compensation Committee:
Dan J. Hill (Chairman)J. Dan BatesRobert J. MunchW. Grady Rosier
COMPENSATION DISCUSSION AND ANALYSIS
Executive Compensation Philosophy
Our philosophy for compensating our named executive officers (NEOs) is based on the belief that a significant portion of executive compensation should be incentive-based and determined by both NuStar Energy’s and the executive’s performance objectives. Our executive compensation programs are designed to accomplish the following long-term objectives:
• increase value to unitholders, while practicing good corporate governance;• support our business strategy and business plan by clearly communicating what is expected of executives
with respect to goals and results;• provide the Compensation Committee with the flexibility to respond to the continually changing
environment in which NuStar Energy operates;• align executive incentive compensation with NuStar Energy’s short- and long-term performance results;
and• provide market-competitive compensation and benefits to enable us to recruit, retain and motivate the
executive talent necessary to produce sustainable growth for our unitholders.
Compensation for our NEOs primarily consists of base salary, an annual incentive bonus and long-term, equity-based incentives. Our NEOs participate in the same group benefit programs available to our salaried employees in the United States. In addition, as discussed in the section titled “Post-Employment Benefits” below in this Compensation Discussion and Analysis, our NEOs may participate in certain non-qualified, retirement-related programs. Our NEOs do not have employment or severance agreements, other than the change of control severance agreements described below under “Potential Payments Upon Termination or Change of Control” in this Item 11. The Compensation Committee targets base salary for our NEOs, as well as annual incentive bonus and long-term incentive opportunities (expressed, in each case, as a percentage of base salary), with reference to predominant practices of our peer companies and information from survey sources. Each NEO’s incentive bonus is awarded in accordance with the same bonus plan and metric that we use for each of our other employees. In determining total compensation, as well as each component thereof, we consider the unique responsibilities of each individual’s position, as well as his or her experience and performance, together with the market information.

Table of Contents
112
Our NEOs for the year ended December 31, 2015 were: Bradley C. Barron, Thomas R. Shoaf, Mary Rose Brown, Amy L. Perry and Karen M. Thompson. On January 1, 2014, Mr. Barron, formerly Executive Vice President (EVP) & General Counsel (GC), was named President & Chief Executive Officer (CEO) and Thomas R. Shoaf, formerly Senior Vice President (SVP) & Controller, was named EVP & Chief Financial Officer (CFO). Also on January 1, 2014, Amy L. Perry, formerly Vice President (VP), Assistant GC-Corporate and Commercial Law & Corporate Secretary, was named SVP, GC-Corporate and Commercial Law & Corporate Secretary and Karen M. Thompson, formerly VP & Assistant GC-Litigation, was named SVP & GC-Litigation, Regulatory and Environmental.
Administration of Executive Compensation Programs
Our executive compensation programs are administered by our Board’s Compensation Committee. The Compensation Committee is composed of independent directors who are not participants in our executive compensation programs. Policies adopted by the Compensation Committee are implemented by our Human Resources department.
Annually, the Compensation Committee reviews market trends in compensation, including the practices of identified competitors, and the alignment of the compensation program with NuStar Energy’s strategy. Specifically, for our NEOs, the Compensation Committee:
• establishes and approves target compensation levels for each NEO;• approves company performance measures and goals;• determines the mix between cash and equity compensation, short-term and long-term incentives and
benefits;• verifies the achievement of previously established performance goals; and• approves the resulting cash or equity awards to our NEOs.
In making determinations about total compensation for our NEOs, the Compensation Committee takes into account a number of factors, including: the competitive market for talent; compensation paid at peer companies; industry-wide trends; NuStar Energy’s performance; the particular NEO’s role, responsibilities, experience and performance; and retention. The Compensation Committee also considers other equitable factors such as the role, contribution and performance of an individual relative to his or her peers at the company. The Compensation Committee does not assign specific weight to these factors, but rather makes a subjective judgment taking all of these factors into account.
The Compensation Committee has retained BDO USA, LLP (BDO) as its independent compensation consultant for BDO’s expertise and guidance with respect to executive compensation matters. In its role as advisor to the Compensation Committee, BDO has been retained directly by the Compensation Committee, which has the authority to select, retain and/or terminate its relationship with a consulting firm. The Compensation Committee determined that there are no conflicts of interest between the company, the Compensation Committee and BDO because BDO provides no other services to NuStar Energy; fees paid to BDO represent less than a fraction of 1% of BDO’s worldwide revenues; BDO has policies in place to prevent a conflict of interest, including a policy that no employee of BDO may own NuStar Energy units; and there is no business or personal relationship between BDO’s consultant and any of NuStar Energy’s officers or directors.
Selection of Compensation Comparative Data
The Compensation Committee has historically relied upon two primary sources of data in developing competitive market reference points for base salaries and annual cash incentive and long-term incentive targets: a group of master limited partnerships (MLPs) and other companies in our industry and broader survey data on comparably sized entities.
To establish compensation for the NEOs, including the CEO, the Compensation Committee, in consultation with management and BDO, identified a specific peer group to evaluate competitive levels of compensation. Prior to 2014, our peer group was composed of MLPs and independent, regional refining companies against which we felt that we competed for executive talent at the time (the Pre-2014 Compensation Comparative Group). During 2014, after we sold our refining assets and our remaining 50% interest in the asphalt business, the Compensation Committee, in consultation with management and BDO, reevaluated our peer group in view of those changes and removed the independent refining companies from our peer group. Since July 2014, our peer group (the Current Compensation Comparative Group) has been composed entirely of MLPs against which we believe we compete for executive talent. The competitive data regarding the companies in the Pre-2014 Compensation Comparative Group

Table of Contents
113
and the Current Compensation Comparative Group is derived from their respective publicly filed annual proxy statements or Annual Reports on Form 10-K.
PRE-2014 COMPENSATION COMPARATIVE GROUP
The companies included in the Pre-2014 Compensation Comparative Group are listed below.
Company Ticker1. Boardwalk Pipeline Partners, LP BWP2. Buckeye Partners L.P. BPL3. EnLink Midstream Partners, LP ENLK4. Enbridge Energy Partners, L.P. EEP5. Energy Transfer Partners, L.P. ETP6. Enterprise Products Partners L.P. EPD7. Kinder Morgan Energy Partners, L.P. KMP8. Magellan Midstream Partners, L.P. MMP9. MarkWest Energy Partners, L.P. MWE10. ONEOK Partners, L.P. OKS11. Plains All American Pipeline, L.P. PAA12. Regency Energy Partners LP RGP13. Sunoco Logistics Partners L.P. SXL14. HollyFrontier Corporation HFC15. Western Refining, Inc. WNR
CURRENT COMPENSATION COMPARATIVE GROUP
Since the Compensation Committee approved the Current Compensation Comparative Group in July 2014, several of the companies on the list have been, or are in the process of, merging or consolidating. The table below lists the companies in the Current Compensation Comparative Group after giving effect to all such transactions that have closed prior to February 19, 2016, with the relevant transactions described in the footnotes following the table.
Company (1) Ticker1. Arc Logistics Partners LP ARCX2. Boardwalk Pipeline Partners, LP BWP3. Buckeye Partners, L.P. BPL4. Enable Midstream Partners, LP ENBL5. Enbridge Energy Partners, L.P. EEP
6. Energy Transfer Partners, L.P. (2) ETP7. EnLink Midstream Partners, LP ENLK8. Enterprise Products Partners L.P. EPD9. Genesis Energy, L.P. GEL10. Holly Energy Partners, L.P. HEP11. Magellan Midstream Partners, L.P. MMP12. MPLX LP MPLX13. Phillips 66 Partners LP PSXP14. Plains All American Pipeline, L.P. PAA15. Sunoco Logistics Partners L.P. SXL16. Tesoro Logistics LP TLLP17. Valero Energy Partners LP VLP18. Western Refining Logistics, LP WNRL

Table of Contents
114
(1) The following companies have been removed from the Current Compensation Comparative Group originally established in July 2014 as a result of the transactions described in this footnote: Access Midstream Partners, L.P. merged with Williams Partners L.P. in February 2015; Atlas Pipeline Partners, L.P. was acquired by Targa Resources Partners LP in February 2015; Kinder Morgan Energy Partners, L.P. was acquired by Kinder Morgan, Inc. in November 2014; MarkWest Energy Partners, L.P. was acquired by MPLX LP in December 2015; Regency Energy Partners LP was acquired by Energy Transfer Partners, L.P. in April 2015; and Targa Resources Partners LP was acquired by Targa Resources Corp. in February 2016.
(2) Energy Transfer Equity, L.P. (ETE) owns the general partner of, 100% of the incentive distribution rights in, and certain common and other units in Energy Transfer Partners, L.P. ETE is working to obtain Federal Trade Commission approval to acquire The Williams Companies, Inc., the general partner of Williams Partners L.P.
Periodically, at the Compensation Committee’s request, BDO reviews survey data reported on a position-by-position basis to obtain additional information regarding compensation of comparable positions. The survey data consists of general industry data for specific executive positions reported in certain Towers Watson Executive Compensation surveys. We refer to the competitive survey data, together with the Pre-2014 Compensation Comparative Group data or the Current Compensation Comparative Group data, as applicable, as the “Compensation Comparative Data.”
Process and Timing of Compensation DecisionsThe Compensation Committee reviews and approves all compensation of the NEOs. Recommendations regarding NEO compensation, other than the CEO’s, are developed by the CEO in consultation with our Human Resources department and with BDO. In making these recommendations, the CEO considers the Compensation Comparative Data and evaluates the individual performance of each NEO and their respective contributions to NuStar Energy. The recommendations are then reviewed by the Compensation Committee, which may accept the recommendations or may make adjustments to the recommended compensation based on the Compensation Committee’s assessment of the individual’s performance and contributions to NuStar Energy.
As required by the Compensation Committee’s charter, the compensation of the CEO is reviewed and approved by the Compensation Committee based on the Compensation Comparative Data and the Compensation Committee’s independent evaluation of the CEO’s contributions to NuStar Energy’s performance.
Each July, the Compensation Committee reviews each NEO’s total compensation, including base salary and the target levels of annual incentive and long-term incentive compensation. The review includes a comparison with competitive market data provided by BDO, an evaluation of the total compensation of the NEOs from an internal equity perspective and review of reports on the compensation history of each NEO. Based on these reviews and evaluations, the Compensation Committee establishes annual salary rates for each NEO for the upcoming 12-month period and sets target levels of annual incentive and long-term incentive compensation. Although the target levels are established in July, the long-term incentives are reviewed again at the time of grant, typically in the fourth quarter for restricted units and in the first quarter for performance units. The Compensation Committee also may review salaries or grant long-term incentive awards at other times during the year because of new appointments, promotions or other extraordinary circumstances.
The following table summarizes the typical timing of some of our significant compensation events:
Event TimingEstablish financial performance objectives for current year’s annual incentive bonus;evaluate achievement of bonus metrics in prior year
First quarter
Review and certify financial performance for performance units granted in prior years;grant performance units
First quarter
Review base salaries for NEOs for the current year and targets for annual incentive bonusand long-term incentive grants
Third quarter
Consider grants of restricted units to employees and NEOs and grant restricted units todirectors
Fourth quarter
Set meeting dates for action by the Compensation Committee for the upcoming year Fourth quarter
Additional information regarding the timing of 2015 long-term incentive grants is discussed below under “Performance Units” and “Restricted Units.”

Table of Contents
115
Elements of Executive Compensation
Our executive compensation programs, including for our NEOs, currently consist of the following material elements:
• base salaries;• annual incentive bonuses;• long-term equity-based incentives, including:
• performance units; and• restricted units; and
• medical and other insurance benefits, retirement benefits and other perquisites.
We use base salary as the foundation for our executive compensation program. We believe that base salary should provide a fixed level of competitive pay that reflects the individual’s primary duties and responsibilities, as well as a foundation for incentive opportunities and benefit levels. Our annual incentive bonuses are designed to focus our NEOs on improving NuStar Energy’s distributable cash flow (DCF), a non-GAAP measure of financial performance, which is widely regarded among the MLP investment community as a significant determinant of an MLP’s operating performance. The calculation of DCF is discussed more fully in the section below titled “Annual Incentive Bonus-Company Performance Objectives.” Our long-term equity incentive awards are designed to directly tie an NEO’s financial reward opportunities with the rewards to unitholders on both an absolute and relative basis, as measured by long-term unit price performance and payment of distributions. Throughout this Item 11, we use the term “Total Direct Compensation” to refer to the sum of an NEO’s base salary, annual incentive bonus and long-term incentive awards for a particular fiscal year. We also offer group medical benefits to provide our employees (including our NEOs) affordable coverage at group rates, as well as pension benefits that reward continued service and a thrift plan that provides a tax-advantaged savings opportunity.
Relative Size of Primary Elements of Compensation
In setting compensation, the Compensation Committee considers the aggregate amount of compensation payable to each NEO and the form of the compensation. The Compensation Committee seeks to achieve the appropriate balance between salary, cash rewards earned for the achievement of company and personal objectives and long-term incentives that align the interests of our NEOs with those of our unitholders. The size of each element is based on competitive market practices, as well as company and individual performance.
The level of incentive compensation typically increases in relation to an NEO’s responsibilities, with the level of incentive compensation for more senior executive officers being a greater percentage of total compensation than for less senior executives. The Compensation Committee believes that tying a significant portion of an NEO’s incentive compensation to NuStar Energy’s performance more closely aligns the NEO’s interests with those of our unitholders.
Because we place such a large proportion of our total executive compensation at risk in the form of variable pay (i.e., annual and long-term incentives), the Compensation Committee does not adjust current compensation based upon realized gains or losses from prior incentive awards. For example, we will not reduce the size of a target long-term incentive grant in a particular year solely because NuStar Energy’s unit price performed well during the immediately preceding years. We believe that adopting a policy of making such adjustments would penalize management’s current compensation for NuStar Energy’s prior success.

Table of Contents
116
The following table summarizes the relative size of base salary and incentive compensation targets for 2015 for each of our NEOs:
Name
Target Percentage of Total Direct Compensation
Base Salary (%)Annual
Incentive Bonus (%)Long-Term
Incentives (%) TOTAL (%) (1)
Barron 25 25 50 100Shoaf 32 19 48 100Brown 32 19 48 100Perry 39 22 39 100Thompson 39 22 39 100
(1) The sum of Base Salary, Annual Incentive Bonus and Long-Term Incentive percentages may vary slightly from 100% due to rounding.
Individual Performance and Personal Objectives
The Compensation Committee evaluates our NEOs’ individual performance and personal objectives with input from our CEO. Our CEO’s performance is evaluated by the Compensation Committee in consultation with other members of the Board.
Assessment of individual performance may include objective criteria, but is a largely subjective process. The criteria used to measure an individual’s performance may include use of quantitative criteria (e.g., execution of projects within budget, improving an operating unit’s profitability, or timely completion of an acquisition or divestiture), as well as more qualitative factors, such as the NEO’s ability to lead, communicate and successfully adhere to NuStar’s core values (i.e., environmental and workplace safety, integrity, work commitment, effective communication and teamwork). There are no specific weights given to any of these various elements of individual performance.
The Compensation Committee uses its evaluation of individual performance to supplement the objective compensation criteria and adjust an NEO’s recommended compensation. For example, although an individual’s indicated bonus may be calculated to be $100,000 based on NuStar Energy’s performance, the individual’s performance evaluation might result in a reduction or increase in that amount.
Base Salaries
The base salaries for our NEOs are reviewed annually by the Compensation Committee based on recommendations of our CEO, with input from BDO and our Human Resources department. Our CEO’s base salary is reviewed and approved by the Compensation Committee based on its review of recommendations by BDO, our Chairman and our compensation and benefits staff.
The competitiveness of base salaries for each NEO’s position is determined by an evaluation of the compensation data described above. Base salaries may be adjusted to achieve what is determined to be a reasonably competitive level or to reflect promotions, the assignment of additional responsibilities, individual performance or the performance of NuStar Energy. Salaries are also periodically adjusted to remain competitive with the Compensation Comparative Data.
Effective January 1, 2014, based on recommendations from BDO, the Chairman (in the case of the CEO’s base salary) and the CEO (in the case of the base salaries for Mr. Shoaf, Ms. Perry and Ms. Thompson), the Compensation Committee raised the base salaries of each of Mr. Barron, Mr. Shoaf, Ms. Perry and Ms. Thompson to reflect their respective promotions and increased responsibilities. In July 2014, BDO performed a comprehensive review of our NEOs’ Total Direct Compensation. Effective July 1, 2014, after consultation with BDO, the Chairman (in the case of the CEO’s base salary) and the CEO (in the case of the base salaries for each other NEO), the Compensation Committee raised the base salaries of each of the NEOs to remain competitive with the Compensation Comparative Data.

Table of Contents
117
For 2015, the Committee considered, among other factors, the Consumer Price Index, the average base salary increase anticipated by nationwide compensation surveys, the increases required by NuStar Energy’s union contracts and the anticipated increases by other local companies. Effective July 1, 2015, after consideration and consultation with BDO, the Chairman (in the case of the CEO’s base salary) and the CEO (in the case of the base salaries for each other NEO), the Compensation Committee raised the base salaries of each of the NEOs to remain competitive, as presented in the table below:
NameAnnualized Base Salary at
December 31, 2015 ($)July 1, 2015 Increase to Prior
Annualized Salary ($)Barron 540,000 50,000Shoaf 339,500 9,900Brown 365,700 10,700Perry 267,800 7,800Thompson 267,800 7,800
Annual Incentive Bonus
Our NEOs participate in the annual incentive plan in which all domestic company employees participate. Under the plan, participants can earn annual incentive bonuses based on the following three factors:
• The individual’s position, which is used to determine a targeted percentage of annual base salary that may be awarded as incentive bonus. Generally, the target amount for the NEOs is set following the analysis of market practices in the Compensation Comparative Group with reference to the median bonus target available to comparable executives in those companies;
• NuStar Energy’s attainment of specific quantitative financial goals, which are established by the Compensation Committee during the first quarter of the year; and
• A discretionary evaluation by the Compensation Committee of both NuStar Energy’s performance and, in the case of the NEOs, the individual’s performance.
In July 2014, following BDO’s comprehensive review of our NEOs’ Total Direct Compensation and after consultation with BDO and the CEO, the Compensation Committee raised the annual incentive bonus targets for Ms. Perry and Ms. Thompson from 50% to 55%. In July 2015, after consultation with BDO and the Chairman, the Compensation Committee raised the annual incentive bonus target for Mr. Barron from 90% to 100%. The Compensation Committee did not make any changes to the annual incentive bonus targets for the other NEOs during 2015.
The following table shows each NEO’s annual bonus target for the fiscal year ended December 31, 2015.
NameAnnual Incentive Bonus Target
(% of Eligible Earnings)Barron 100Shoaf 60Brown 60Perry 55Thompson 55
Determination of Annual Incentive Target OpportunitiesAs illustrated in the table above, each NEO has an annual incentive opportunity generally based on a stated percentage of his or her salary paid that year. The target amount is awarded for achieving a 100% score on our stated financial goal under the bonus plan. For example, in a year with a 100% score, an NEO paid $200,000 with a target annual incentive opportunity equal to 60% of his eligible earnings would receive a bonus of $120,000.
Once the financial goals have been reviewed and measured, the Compensation Committee has the authority to exercise its discretion in evaluating NuStar Energy’s performance. In exercising this discretionary judgment, the Compensation Committee considers such relevant performance factors as growth, attainment of strategic objectives, acquisitions and divestitures, safety and environmental compliance, as well as other considerations. This discretionary judgment may result in an increase or decrease in the aggregate earned award for all employees based upon the attainment of the financial goals noted above.

Table of Contents
118
The CEO develops individual incentive bonus recommendations for the other NEOs based upon the methodology described above. In addition, both the CEO and the Compensation Committee may make adjustments to the recommended incentive bonus amounts based upon an assessment of an individual’s performance and contributions to NuStar Energy. The CEO and the Compensation Committee also review and discuss each NEO’s bonus on a case-by-case basis, considering such factors as teamwork, leadership, individual accomplishments and initiative, and may adjust the bonus awarded to reflect these factors.
The bonus target for the CEO is decided solely by the Compensation Committee, and the Compensation Committee may make discretionary adjustments to the calculated level of bonus based upon its independent evaluation of the CEO’s performance and contributions.
Company Performance ObjectivesIn 2015, as in prior years, the Compensation Committee approved a DCF-based metric for NuStar Energy’s bonus metric, based on management’s recommendations and input from BDO. In the MLP investment community, DCF is widely regarded as a significant determinant of operating performance. As such, the Compensation Committee believes the measure appropriately aligns our management’s interest with our unitholders’ interest in increasing distributions in a prudent manner.
We derive DCF from our financial statements by adjusting our net income for depreciation and amortization expense, equity earnings from joint ventures, unrealized gains and losses arising from certain derivative contracts and other non-cash items, including non-cash gains or losses. We further adjust our earnings by subtracting our aggregate annual reliability capital expenditures, adding the aggregate annual amount of cash distributions received from equity investments in joint ventures and adding certain cash receipts not included in net income.
Each year, the Compensation Committee establishes a target DCF for NuStar Energy to achieve for the year and establishes corresponding levels of performance for which the incentive opportunity would be paid. The Compensation Committee has discretion to raise or lower the incentive opportunity resulting from this calculation by 25%. In addition, the budgeted DCF may be adjusted during the year in order to account for acquisitions or other significant changes not anticipated at the time the target was determined. For 2015, the Compensation Committee determined that a bonus pool for all employees would be established with DCF in excess of the amount needed to attain a distribution coverage ratio of 1.01 times. After achieving a 100% bonus, incremental DCF earned would be shared between the bonus pool and NuStar Energy until employees achieve a 200% bonus.
Determination of AwardsFor the 2015 annual incentive bonus determination, the Compensation Committee reviewed NuStar Energy’s DCF against the established target of attaining a coverage ratio of 1.01 times and considered the performance of each NEO to determine the amount of incentive award earned. Based on this review, the Compensation Committee set the bonus award for our NEOs at 155%. Actual bonuses awarded are shown in the following table:
Name Bonuses Paid For 2015 ($)Barron 800,000Shoaf 311,000Brown 335,000Perry 225,000Thompson 225,000
Long-Term Incentive Awards
We provide unit-based, long-term incentive compensation for employees, including our NEOs, and for our non-employee directors through our 2000 Long-Term Incentive Plan (as amended and restated from time to time, the 2000 LTIP). The 2000 LTIP provides for a variety of unit and unit-based awards, including unit options, restricted units and performance units. Performance units vest (become nonforfeitable) upon the achievement of an objective performance goal. Long-term incentive awards vest over a period determined by the Compensation Committee. On January 28, 2016, at a special meeting of unitholders, NuStar Energy’s unitholders approved the Fifth Amended and Restated 2000 LTIP (the Amended Plan). The Amended Plan differs from the Fourth Amended and Restated 2000 Long-Term Incentive Plan in that, among other things, the Amended Plan:

Table of Contents
119
• permits common units available for issuance under the Amended Plan to be newly issued in addition to outstanding common units acquired from an affiliate;
• has been updated to delete certain obsolete provisions;
• has been updated to reflect certain technical changes in tax laws and for accounting; and
• will not terminate until ten years from the new effective date.
Under the design of our long-term incentive awards, each plan participant, including each NEO, is designated a target long-term incentive award expressed as a percentage of base salary. This percentage reflects the fair value of the awards to be granted.
Effective January 1, 2014, the Compensation Committee raised the long-term incentive targets for 2014 (expressed as a percent of base salary) for each of Mr. Barron, Mr. Shoaf, Ms. Perry and Ms. Thompson to reflect their respective promotions and increased responsibilities. After BDO’s comprehensive review of our NEOs’ Total Direct Compensation in July 2014 and with the recommendations of BDO, the Chairman (in the case of the CEO’s long-term incentive target) and the CEO (in the case of the long-term incentive targets for each other NEO), the Compensation Committee raised the long-term incentive target for each of our NEOs in July 2014. The Compensation Committee did not make any changes to the long-term incentive targets for our NEOs during 2015. The following table shows each NEO’s long-term incentive target for 2015 (expressed as a percent of base salary):
NameLong-Term Incentive Target
(% of base salary)Barron 200Shoaf 150Brown 150Perry 100Thompson 100
The Compensation Committee allocates a percentage of long-term incentive award value to performance-based awards and a percentage to awards that focus on retention and increasing ownership levels of executive officers (including our NEOs). Beginning with the long-term incentive award in the fourth quarter of 2011, the target levels were allocated in the following manner for each individual:
• 35% of the targeted long-term incentive dollar value is awarded to each NEO in a grant of performance units. The number of performance units granted is based upon the expected fair value of a single performance unit at the time of grant; and
• 65% of the targeted long-term incentive dollar value is awarded to each NEO in the form of restricted units. The number of restricted units granted is based upon the expected fair value of a single restricted unit at the time of grant.
The Compensation Committee reviews and approves long-term incentive grants for the NEOs. The CEO develops individual grant recommendations based upon the methodology described above, but both the CEO and the Compensation Committee may make adjustments to the recommended grants based upon an assessment of an individual’s performance and contributions to NuStar Energy. Grants to the CEO are decided solely by the Compensation Committee following the methodology described above, and the Compensation Committee may make discretionary adjustments to the calculated level of long-term incentives based upon its independent evaluation of the CEO’s performance and contributions.
Restricted UnitsRestricted units comprise approximately 65% of each NEO’s total NuStar Energy long-term incentive target. The Compensation Committee presently expects to grant restricted units on an annual basis. The NEOs’ long-term incentive targets include approximately 70% NuStar Energy restricted units to be granted by the Compensation Committee under the 2000 LTIP and 30% NuStar GP Holdings restricted units to be granted by NuStar GP Holdings’ compensation committee under its long-term incentive plan (in both cases, calculated from an assumed unit value based on the average closing price for the first 10 business days of the month prior to the committee meeting at which the awards are to be approved). The restricted units all vest over five years in equal increments on the anniversary of the grant date, and distribution equivalents are paid in cash quarterly for all unvested NuStar

Table of Contents
120
Energy and NuStar GP Holdings restricted units. Restricted units of NuStar GP Holdings were introduced into the compensation program in 2008 to reflect the fact that the performance of NuStar GP Holdings is directly tied to the performance of NuStar Energy, since NuStar GP Holdings’ sole asset is its interest in NuStar Energy. The annual grants of NuStar GP Holdings restricted units, as well as the annual grants of the NuStar Energy restricted units, were approved in a joint meeting of the Compensation Committee and the compensation committee of NuStar GP Holdings’ Board of Directors.
In 2015, the Compensation Committee and management made a determination that the grants for employees, including the NEOs, and for the non-employee directors would be made as soon as administratively practicable and no earlier than the third business day following our third quarter earnings release. Due to the time required to award and implement the grants, the 2015 annual grants were not effective until November 16, 2015. The following table sets forth the restricted units granted to each of our NEOs in 2015.
Name Restricted Units Granted in 2015
NuStar Energy NuStar GP HoldingsBarron 10,000 7,300Shoaf 4,650 3,430Brown 5,005 3,695Perry 2,445 1,805Thompson 2,445 1,805
Performance UnitsPerformance units comprise approximately 35% of each of our NEOs’ total NuStar Energy long-term incentive targets and typically have been granted in the first quarter of each year. Performance units are earned only upon NuStar Energy’s achievement of an objective performance measure for the performance period. The Compensation Committee believes this type of incentive award strengthens the tie between each NEO’s pay and our financial performance.
For performance unit awards granted prior to 2014, the objective performance measure was tied to NuStar Energy’s total unitholder return (TUR) as compared with the Pre-2014 Compensation Comparative Group. NuStar Energy’s TUR was defined as the total return to unitholders, based upon the growth in the unit price, as well as cash distributions to unitholders, during the year. Each award was subject to vesting in three annual increments, based upon our TUR during rolling three-year periods that end on December 31 of each year following the date of grant. At the end of each performance period, our TUR was compared to the Pre-2014 Compensation Comparative Group and ranked by quartile. Our NEOs then earned 0%, 50%, 100% or 150% of that portion of the initial grant amount that was eligible for vesting, depending upon whether our TUR was in the last, third, second or first quartile, respectively, and they earned 200% if we ranked highest in the group. Amounts not earned in a given performance period could be carried forward for one additional performance period and up to 100% of the carried amount could still be earned, depending upon the quartile achieved for that subsequent period.
For 2014, the Compensation Committee delayed consideration of the annual performance unit awards until completion of BDO’s comprehensive review of our NEOs’ Total Direct Compensation. After consultation with BDO and management regarding the appropriate performance metric to use for the performance unit awards, the Compensation Committee adopted a different performance metric for the 2014 performance unit awards. As described above, in the MLP investment community, distribution coverage is widely regarded as a significant determinant of operating performance. BDO’s review reflected the fact that cash flow metrics are the most common measures that MLPs use to determine the vesting of performance unit awards. The Compensation Committee believes that distribution coverage appropriately aligns our NEOs’ interest with our unitholders’ interest in increasing distributions in a prudent manner over time.
In July 2014, the Compensation Committee determined that the target performance measure for the 2014 performance unit awards would be NuStar Energy achieving a distribution coverage ratio, after taking into account the aggregate expense of the performance units (DCR), of 1:1 for 2014 and that the target metric for performance unit vesting with respect to 2015 and each year thereafter would be the DCR determined by the Compensation Committee in the first quarter of the year, based on the approved budget for that year. The Compensation Committee also retained the ability to designate one or more DCRs above the targeted DCR as goals to be used to determine vesting greater than 100% (up to 200%) of performance units available for vesting in that year. Each 2014 performance unit award is subject to vesting in three annual increments, based upon our DCR during the one-year

Table of Contents
121
periods that end on December 31 of each year following the date of grant. Notwithstanding anything above, the Compensation Committee retained full discretion to increase the vesting determination for any individual (up to the 200% cap).
On January 29, 2015, the Compensation Committee met and discussed NuStar Energy’s performance for the performance period ended December 31, 2014, and determined that NuStar Energy’s TUR was in the third quartile of its peer group for that three-year performance period. As a result, the performance units granted in 2011, 2012 and 2013 that were available to vest for the performance period ending on December 31, 2014 vested at 50%, in accordance with the award terms. On January 29, 2015, the Compensation Committee also determined that NuStar Energy achieved a DCR of 1:1 for 2014 and, in accordance with the award terms, the performance units available to vest for the 2014 awards vested at 100%.
For 2015, performance units were awarded by the Compensation Committee on January 29, 2015 pursuant to the 2000 LTIP, with each 2015 performance unit award subject to vesting in three annual increments, based upon our DCR during the one-year performance periods that end on December 31 of each year following the date of grant. The target metric for performance unit vesting with respect to 2015 was NuStar Energy achieving a DCR of 1.01:1, with all units eligible for vesting as follows based on the DCR for 2015:
Level DCR % Performance Units EarnedBelow Threshold Below 1.00 : 1 0%Threshold 1.00 : 1 90%Target 1.01 : 1 100%Exceeds Target 1.05 : 1 150%Maximum 1.10 : 1 200%
Eligible units would not vest and would be forfeited if the DCR for 2015 was less than 1.00:1. If the DCR were to fall between the benchmarks described above, the percentage vesting would be determined through straight-line interpolation. The Compensation Committee retained the full discretion to vest up to 200% of performance units available for vesting, regardless of the DCR that NuStar Energy attained for the year.
The number of performance units granted in 2015 was determined by multiplying the annual base salary rate by the long-term incentive target percentage, and then multiplying that product by 35%. That product was then divided by the assumed value of an individual unit, which was the product of (x) the average unit price for the period of December 15 through December 31 (using the daily closing prices) and (y) a factor reflecting the risk that the award might be forfeited. The following table sets forth the performance units granted to our NEOs in 2015.
Name Performance Unit Grants in 2015Barron 8,000Shoaf 3,939Brown 4,242Perry 2,070Thompson 2,070
On January 28, 2016, the Compensation Committee met and discussed NuStar Energy’s performance for the performance period ended December 31, 2015, and determined that NuStar Energy’s TUR was in the second quartile of its peer group for that three-year performance period. As a result, the performance units granted in 2012 and 2013 that were available to vest for the performance period ending on December 31, 2015 vested at 100%, in accordance with the award terms. On January 28, 2016, the Compensation Committee also determined that NuStar Energy achieved a DCR of 1.11:1 for 2015 and, in accordance with the award terms, the performance units available to vest for the 2014 awards and 2015 awards vested at 200%.
Perquisites and Other Benefits
PerquisitesWe provide only minimal perquisites to our NEOs. Mr. Barron, Mr. Shoaf, Ms. Brown and Ms. Perry each received federal income tax preparation services and each of our NEOs received personal liability insurance in 2015. For more information on perquisites, see the Summary Compensation Table and its footnotes.

Table of Contents
122
Other BenefitsWe provide other benefits, including medical, life, dental and disability insurance in line with competitive market conditions. Our NEOs are eligible for the same benefit plans provided to our other employees, including our pension plans, 401(k) thrift plan (the Thrift Plan), and insurance and supplemental plans chosen and paid for by employees who desire additional coverage. Our NEOs and other employees whose compensation exceeds certain limits are eligible to participate in non-qualified excess benefit programs whereby those individuals can choose to make larger contributions than allowed under the qualified plan rules and receive correspondingly higher benefits. These plans are described below under “Post-Employment Benefits.”
Post-Employment Benefits
Pension PlansFor a discussion of our pension plans, as well as the Excess Pension Plan, please see the narrative description accompanying the Pension Benefits table below in this Item 11.
Nonqualified Deferred Compensation Plan (Excess Thrift Plan)The Excess Thrift Plan provides unfunded benefits to those employees whose annual additions under the Thrift Plan are subject to the limitations on such annual additions as provided under §415 of the Internal Revenue Code of 1986, as amended (the Code), and/or who are constrained from making maximum contributions under the Thrift Plan by §401(a)(17) of the Code, which limits the amount of an employee’s annual compensation which may be taken into account under that plan. The Excess Thrift Plan is comprised of two separate components, consisting of (1) an “excess benefit plan” as defined under §3(36) of The Employee Retirement Income Security Act of 1974, as amended (ERISA), and (2) a plan that is maintained primarily for the purpose of providing deferred compensation for a select group of management or highly compensated employees. Each component of the Excess Thrift Plan consists of a separate plan for purposes of Title I of ERISA. To the extent a participant’s annual total compensation exceeds the compensation limits for the calendar year under §401(a)(17) of the Code ($265,000 for 2015), the participant’s Excess Thrift Plan account is credited with that number of hypothetical NuStar Energy units that could have been purchased with the difference between:
• The total company matching contributions that would have been credited to the participant’s account under the Thrift Plan had the participant’s contributions not been reduced pursuant to §401; and
• The actual company matching contributions credited to such participant’s account.
Mr. Barron, Mr. Shoaf and Ms. Brown participated in the Excess Thrift Plan in 2015.
Change of Control Severance ArrangementsWe entered into change of control severance agreements with each of our NEOs in, or prior to, 2007. These agreements are intended to assure the continued availability of these executives in the event of certain transactions culminating in a “change of control” as defined in the agreements. The change of control severance agreements have three-year terms and are automatically extended for one year upon each anniversary unless we give notice not to extend. If a “change of control” (as defined in the agreements) occurs during the term of an agreement, then the agreement becomes operative for a fixed three-year period. The agreements provide generally that the NEO’s terms and conditions of employment (including position, location, compensation and benefits) will not be adversely changed during the three-year period after a change of control.
Particular payments under the agreements are triggered commensurate with the occurrence of any of the following: (1) termination of employment by the company other than for “cause” (as defined in the agreements), death or disability; (2) termination by the NEO for “good reason” (as defined in the agreements); (3) termination by the NEO other than for “good reason;” and (4) termination of employment because of death or disability. These triggers were designed to ensure the continued availability of these executives following a change of control, and to compensate them at appropriate levels if their employment is unfairly or prematurely terminated during the applicable term following a change of control. For more information regarding payments that may be made under our change of control severance arrangements, see our disclosures below under the caption “Potential Payments upon Termination or Change of Control.”

Table of Contents
123
Employment AgreementsNone of the NEOs have employment agreements, other than the change of control severance agreements described above. As a result, in the event of a termination, retirement, death or disability that is not related to a change of control, an NEO will only receive the compensation or benefits to which he or she would be entitled under the terms of, as applicable, the defined contribution, defined benefit, medical or long-term incentive plans.
Impact of Accounting and Tax Treatments
Accounting TreatmentNuStar Energy’s financial statements include the expense for awards of NuStar Energy unit options, restricted units and performance units to NuStar GP, LLC employees and directors and the expense for awards of NuStar GP Holdings unit options and restricted units to NuStar GP, LLC employees.
Historically, NuStar GP, LLC has accounted for awards of NuStar Energy common unit options, restricted units and performance units to NuStar GP, LLC’s employees and directors at fair value as a derivative, whereby a liability for the award is recorded at inception and subsequent changes in the fair value of the award are included in the determination of net income. NuStar GP, LLC determines the fair value of unit options using the Black-Scholes model at each reporting date. The fair value of restricted units and performance units equals the market price of NuStar Energy common units at each reporting date. However, performance units are earned only upon NuStar Energy’s achievement of an objective performance measure. NuStar GP, LLC records compensation expense each reporting period such that the cumulative compensation expense recorded equals the current fair value of the percentage of the award that has vested. NuStar GP, LLC records compensation expense related to unit options until such options are exercised, and records compensation expense for restricted units until the date of vesting.
NuStar GP Holdings accounts for awards of NuStar GP Holdings restricted units and unit options awarded under its long-term incentive plan to its directors, as well as the employees of NuStar GP, LLC, at fair value. NuStar GP Holdings uses the market price at the grant date as the fair value of restricted units. NuStar GP Holdings estimates the fair value of unit options at the grant date using the Black-Scholes model. For both restricted units and unit options, NuStar GP Holdings recognizes the resulting compensation expense ratably over the vesting period. However, as described in Item 13, under the Services Agreement, NuStar Energy historically has been obligated to pay for all costs of NuStar GP, LLC’s employees working on NuStar Energy’s behalf (including unit-based compensation) and NuStar GP Holdings was charged 1.0% of NuStar GP, LLC’s domestic unit compensation expense under the Services Agreement.
As described in Item 13 below, on March 1, 2016, NuStar GP, LLC intends to transfer and assign to NuStar Services Company LLC (NuStar Services), a wholly owned subsidiary of NuStar Energy, employment of all of NuStar GP, LLC’s employees. Our executive officers will continue to serve as officers of NuStar GP Holdings, NuStar GP, LLC, and also will serve as officers of NuStar Services and other NuStar Energy subsidiaries. In connection with the transfer and assignment, we intend to amend and restate the Services Agreement such that, beginning March 1, 2016, NuStar GP Holdings and NuStar Energy will receive all management and administrative services from NuStar Services. NuStar Energy will reimburse NuStar Services for all services provided to NuStar Energy, including payroll and benefit costs, as well as NuStar Energy unit-based compensation costs. NuStar GP Holdings will pay NuStar Services an administrative services fee, subject to certain adjustments, but it will no longer pay 1.0% of NuStar GP, LLC’s domestic bonus and unit compensation expenses. Instead, NuStar GP Holdings will retain the expense associated with any NuStar GP Holdings common unit awards or other compensation that it provides to its officers. By approving the Amended Plan on January 28, 2016 to permit new issuances of NuStar Energy common units and then transferring the employees of NuStar GP, LLC into the NuStar Energy consolidated affiliate group, substantially all of our currently outstanding and subsequently issued awards will be classified as equity awards, which would reduce the volatility in the expense related to our awards. In addition, we believe that these changes will put our structure, approach to long-term incentives and accounting more in-line with those of our peer MLPs.
Under the long-term incentive plans, certain awards provided that the grantee’s award vests immediately upon retirement. Compensation expense was recognized immediately if these awards were granted to retirement-eligible employees, as defined in each award. In addition, if during a vesting period of a grant the grantee would become retirement-eligible, then compensation expense associated with the grant was recognized from the grant date through the grantee’s retirement eligibility date.

Table of Contents
124
Tax TreatmentUnder Section 162(m) of the Code, publicly held corporations may not take a tax deduction for compensation in excess of $1 million paid to the CEO or the other four most highly compensated executive officers unless that compensation meets the Code’s definition of “performance-based” compensation. Section 162(m) allows a deduction for compensation to a specified executive that exceeds $1 million only if it is paid (1) solely upon attainment of one or more performance goals, (2) pursuant to a qualifying performance-based compensation plan adopted by the Compensation Committee and (3) the material terms, including the performance goals, of such plan are approved by the unitholders before payment of the compensation. The Compensation Committee considers deductibility under Section 162(m) with respect to compensation arrangements for executive officers.
Although Section 162(m) does not now apply to MLPs, if a similar limitation were to be applied to NuStar Energy, the Compensation Committee believes that it would be in the company’s best interest for the Compensation Committee to retain its flexibility and discretion to make compensation awards to foster achievement of performance goals established by the Compensation Committee (which may include performance goals defined in the Code) and other corporate goals the Compensation Committee deems important to NuStar Energy’s success, such as encouraging employee retention, rewarding achievement of non-quantifiable goals and achieving progress with specific projects. The Compensation Committee believes that unit options and performance unit grants qualify as performance-based compensation and, therefore, would not be subject to any deductibility limitations under an applicable section similar to Section 162(m). Grants of restricted units and other equity-based awards that are not subject to specific quantitative performance measures likely would not qualify as “performance-based” compensation and, in such event, would be subject to such deduction restrictions.
Compensation-Related Policies
Unit Ownership Guidelines
We believe that ownership of NuStar Energy units aligns the interests of NuStar GP, LLC directors and executives with those of NuStar Energy’s unitholders. We have long emphasized and reinforced the importance of unit ownership among our executives and directors.
During 2006, the Compensation Committee worked with its independent compensation consultant to formalize unit ownership and retention guidelines for NuStar GP, LLC directors and officers to ensure continuation of our successful track record in aligning the interests of NuStar GP, LLC directors and officers with those of NuStar Energy’s unitholders through ownership of NuStar Energy units. The guidelines initially were approved by the Compensation Committee in January 2006. In view of the public offerings of units of NuStar GP Holdings in 2006, the guidelines subsequently were amended to include ownership of either NuStar GP Holdings units or NuStar Energy units.
During 2015, at the request of the Board and its committees, management undertook a review of the unit ownership and retention guidelines. Management discussed the results of its review with BDO, which agreed with management’s conclusions. The Compensation Committee and the Nominating/Governance and Conflicts Committee of NuStar GP, LLC’s Board, as well as the board of directors of NuStar GP Holdings, have approved the updated unit ownership and retention guidelines described below.
Non-Employee Director Unit Ownership Guidelines
Non-employee directors are expected to acquire and hold during their service as a Board member NuStar Energy units and/or NuStar GP Holdings units with an aggregate value of at least two times their annual cash retainer. Directors have five years from their initial election to the Board to meet the target unit ownership guidelines, and they are expected to continuously own sufficient units to meet the guidelines, once attained.

Table of Contents
125
Officer Unit Ownership Guidelines
Unit ownership guidelines for the officers set forth below are as follows:
OfficerValue of NuStar Energy Units and/or
NuStar GP Holdings Units OwnedCEO/President 4.0x base salaryEVP serving on CEO’s officer committee 3.0x base salarySVP serving on CEO’s officer committee 2.0x base salaryVP serving on CEO’s officer committee 1.0x base salary
The officers subject to the unit ownership and retention guidelines are expected to meet the applicable guidelines within five years of becoming subject to the guidelines and continuously own sufficient units to meet the guidelines, once attained.
Prohibition on Insider Trading and Speculation on NuStar Energy or NuStar GP Holdings UnitsWe have established policies prohibiting our officers, directors and employees from purchasing or selling either NuStar Energy or NuStar GP Holdings securities while in possession of material, nonpublic information or otherwise using such information for their personal benefit or in any manner that would violate applicable laws and regulations. Our directors, officers and certain other employees are prohibited from trading in either NuStar Energy or NuStar GP Holdings securities for the period beginning on the last business day of each calendar quarter through the first business day following our disclosure of our quarterly or annual financial results. In addition, our policies prohibit our officers, directors and employees from speculating in either NuStar Energy or NuStar GP Holdings units, such as by short selling (profiting if the market price of our units decreases), buying or selling publicly traded options (including writing covered calls), hedging or any other type of derivative arrangement that has a similar economic effect. Our directors, officers and certain other employees also are required to obtain consent from the CEO (or, in the case of the CEO, from the Chair of the applicable company’s Audit Committee) before they enter into margin loans or other financing arrangements that may lead to the ownership or other rights to their NuStar Energy or NuStar GP Holdings securities being transferred to a third party.
EVALUATION OF COMPENSATION RISK
The Compensation Committee has focused on aligning our compensation policies with the long-term interests of NuStar Energy and avoiding short-term rewards for management decisions that could pose long-term risks to NuStar Energy. As described above in “Compensation Discussion and Analysis,” NuStar Energy’s compensation programs are structured so that a considerable amount of our management’s compensation is tied to NuStar Energy’s long-term fiscal health. The only short-term incentive available to NuStar Energy employees and executives is the all-employee performance bonus. All bonuses, including executive bonuses, are determined with reference to well-defined performance metrics selected by the Compensation Committee and applicable to all employees. Historically, our long-term incentives have taken the form of performance units, restricted units and unit options that typically vest over three- and five-year periods, which we believe serves to align our employees’ interests with the long-term goals of NuStar Energy. No business group or unit is compensated differently than any other, regardless of profitability. There also is a maximum number of performance units that may be earned, based on the performance of NuStar Energy relative to a performance metric selected by the Compensation Committee. As such, we believe that our compensation policies encourage employees to operate our business in a fundamentally sound manner and do not create incentives to take risks that are reasonably likely to have a material adverse effect on NuStar Energy.

Table of Contents
126
COMPENSATION OF EXECUTIVE OFFICERS AND DIRECTORS
The following pages of this Item 11 provide information required by the SEC regarding compensation paid to or earned by our NEOs and the members of our Board for the periods indicated. We have used captions and headings in the tables provided below in accordance with the SEC regulations requiring these disclosures. The footnotes to these tables provide important information to explain the values presented in the tables, and are an important part of our disclosures.
SUMMARY COMPENSATION TABLE
The following table provides a summary of compensation paid for the years ended December 31, 2015, December 31, 2014 and December 31, 2013 to NuStar GP, LLC’s CEO, CFO and to its three other most highly compensated executive officers serving during 2015. Mr. Shoaf, Ms. Perry and Ms. Thompson were not executive officers prior to 2014 and, accordingly, their compensation is reported only with respect to 2015 and 2014. For each NEO, the table shows amounts earned for services rendered to NuStar GP, LLC in all capacities in which the NEO served during the periods presented for that NEO.
Name and PrincipalPosition Year
Salary ($)
Bonus($)(1)
UnitAwards
($)(2)
OptionAwards
($)
Non-EquityIncentive
PlanCompensation
($)
Change in Pension Value
and NonqualifiedDeferred
CompensationEarnings
($)(3)
All OtherCompensation
($)(4)Total
($)Bradley C. BarronPresident and CEO
2015 515,000 800,000 1,077,860 — — 47,061 35,677 2,475,598
2014 460,000 683,100 1,086,708 — — 147,448 29,815 2,407,071
2013 327,160 125,000 530,915 — — 2,328 21,818 1,007,221Thomas R. ShoafExecutive VicePresident and CFO
2015 334,550 311,000 515,023 — — 47,692 21,729 1,229,994
2014 324,800 321,552 564,231 — — 142,990 21,703 1,375,276
Mary Rose BrownExecutive Vice President and Chief Administrative Officer
2015 360,350 335,000 554,552 — — 173,968 23,836 1,447,7062014 349,785 346,287 607,456 — — 136,213 23,202 1,462,9432013 345,983 110,000 546,876 — — 48,510 24,302 1,075,671
Amy L. PerrySenior Vice President, General Counsel-Corporate and Commercial Law & Corporate Secretary
2015 263,900 225,000 270,770 — — 18,483 17,074 795,2272014 250,000 226,875 294,772 — — 51,525 8,865 832,037
Karen M. ThompsonSenior Vice President and General Counsel-Litigation, Regulatory & Environmental
2015 263,900 225,000 270,770 — — 16,350 19,525 795,545
2014 250,000 226,875 302,421 — — 68,726 16,466 864,488
(1) Bonus amounts for 2015 were paid in February 2016 with respect to 2015 performance. Bonus amounts for 2014 were paid in February 2015 with respect to 2014 performance. Bonus amounts for 2013 were paid in February 2014 with respect to 2013 performance. Bonuses were determined taking into consideration NuStar Energy’s performance in the applicable year, the individual NEO’s targets and the NEO’s performance, as described above under “Compensation Discussion and Analysis-Annual Incentive Bonus.” For an explanation of the amount of salary and bonus in proportion to total compensation, see “Compensation Discussion and Analysis-Relative Size of Primary Elements of Compensation.”
(2) The amounts reported represent the grant date fair value of grants of NuStar Energy restricted units, NuStar Energy performance units and NuStar GP Holdings restricted units. Please see the “Long-Term Incentive Awards” section and the “Impact of Accounting and Tax Treatments-Accounting Treatment” section of “Compensation Discussion and Analysis” above in this Item 11 and the footnotes to the Grants of Plan-Based Awards During the Year Ended December 31, 2015 table below in this Item 11 for information regarding the vesting schedules and the assumptions made in the valuation.

Table of Contents
127
(3) The following table identifies the separate amounts attributable to (A) the aggregate change in the actuarial present value of each NEO’s accumulated benefit under NuStar GP, LLC’s defined benefit and actuarial pension plans, including supplemental plans (but excluding tax-qualified defined contribution plans and nonqualified defined contribution plans), and (B) above-market or preferential earnings on compensation that is deferred on a basis that is not tax-qualified.
Name Year (A) ($) (B) ($) TOTAL ($)Barron 2015 47,061 — 47,061
2014 147,448 — 147,4482013 2,328 — 2,328
Shoaf 2015 47,692 — 47,6922014 142,990 — 142,990
Brown 2015 173,968 — 173,9682014 136,213 — 136,2132013 48,510 — 48,510
Perry 2015 18,483 — 18,4832014 51,525 — 51,525
Thompson 2015 16,350 — 16,3502014 68,726 — 68,726
(4) The amounts reported in this column for 2015 consist of the following for each NEO:
Name
CompanyContribution
to ThriftPlan ($)
CompanyContribution
to ExcessThrift Plan ($)
TaxPreparation
($)
PersonalLiability
Insurance($)
Executive Health
Exams ($)(a) TOTAL ($)Barron 15,900 15,000 850 1,365 2,562 35,677Shoaf 15,900 3,614 850 1,365 — 21,729Brown 14,307 7,314 850 1,365 — 23,836Perry 14,859 — 850 1,365 — 17,074Thompson 15,834 — — 1,365 2,326 19,525
(a) The amount reported is the difference between the value of the respective NEO’s health exams and the value of NuStar Energy’s all-employee wellness assessments.

Table of Contents
128
GRANTS OF PLAN-BASED AWARDSDURING THE YEAR ENDED DECEMBER 31, 2015
The following table provides information regarding grants of plan-based awards to the NEOs during 2015.
Name Grant Date
Date ofApproval of
Compensation Committee
Estimated Future Payouts Under Equity
Incentive Plan AwardsAll Other
UnitAwards:Number
ofUnits (#)
All OtherOption
Awards:Number ofSecurities
UnderlyingOptions (#)
Exercise orBase Priceof Option Awards($/Unit)
Grant DateFair Value of
Unit and Unit OptionAwards ($)
Threshold (#)
Target (#)
Maximum(#)
Barron 1/29/2015 (1) 1/29/2015 — 8,000 16,000 — — — 473,920 (4)
11/16/2015 (2) 10/29/2015 — — — 10,000 — — 430,200 (5)
11/16/2015 (3) 10/29/2015 — — — 7,300 — — 173,740 (6)
Shoaf 1/29/2015 (1) 1/29/2015 — 3,939 7,878 — — — 233,346 (4)
11/16/2015 (2) 10/29/2015 — — — 4,650 — — 200,043 (5)
11/16/2015 (3) 10/29/2015 — — — 3,430 — — 81,634 (6)
Brown 1/29/2015 (1) 1/29/2015 — 4,242 8,484 — — — 251,296 (4)
11/16/2015 (2) 10/29/2015 — — — 5,005 — — 215,315 (5)
11/16/2015 (3) 10/29/2015 — — — 3,695 — — 87,941 (6)
Perry 1/29/2015 (1) 1/29/2015 — 2,070 4,140 — — — 122,627 (4)
11/16/2015 (2) 10/29/2015 — — — 2,445 — — 105,184 (5)
11/16/2015 (3) 10/29/2015 — — — 1,805 — — 42,959 (6)
Thompson 1/29/2015 (1) 1/29/2015 — 2,070 4,140 — — — 122,627 (4)
11/16/2015 (2) 10/29/2015 — — — 2,445 — — 105,184 (5)
11/16/2015 (3) 10/29/2015 — — — 1,805 — — 42,959 (6)
(1) Performance units were awarded by the Compensation Committee on January 29, 2015 pursuant to the 2000 LTIP, with each award subject to vesting in three annual increments, based upon our DCR during the one-year performance periods that end on December 31 of each year following the date of grant. The target metric for performance unit vesting with respect to 2015 is NuStar Energy achieving a DCR of 1.01:1, with all units eligible for vesting as follows based on the DCR for 2015:
Level DCR % Performance Units EarnedBelow Threshold Below 1.00 : 1 0%Threshold 1.00 : 1 90%Target 1.01 : 1 100%Exceeds Target 1.05 : 1 150%Maximum 1.10 : 1 200%
Eligible units would not vest and would be forfeited if the DCR for 2015 was less than 1.00:1. If the DCR were to fall between the benchmarks described above, the percentage vesting would be determined through straight-line interpolation. The Compensation Committee retained the full discretion to vest up to 200% of performance units available for vesting, regardless of the DCR that NuStar Energy attained for the year. For the performance period ended December 31, 2015, we achieved a DCR of 1.11:1 and the performance units available to vest for the 2015 awards vested at 200%.

Table of Contents
129
(2) Restricted units of NuStar Energy were approved by the Compensation Committee at a joint meeting with the compensation committee of NuStar GP Holdings on October 29, 2015, and the grant date for these NuStar Energy restricted units was set at that time for the date that was as soon as administratively practicable after the meeting and no earlier than the third business day following our third quarter earnings release. The NuStar Energy restricted units were awarded pursuant to the 2000 LTIP and vest 1/5 annually over five years beginning on the first anniversary of the grant date. All grantees receiving NuStar Energy restricted units are entitled to receive an amount equal to the product of (a) the number of restricted units granted to the grantee that remain outstanding and unvested as of the record date for such quarter and (b) the quarterly distribution declared by the Board for such quarter.
(3) Restricted units of NuStar GP Holdings were approved by the compensation committee of NuStar GP Holdings at a joint meeting with the Compensation Committee of NuStar GP, LLC on October 29, 2015, and the grant date for these NuStar GP Holdings restricted units was set at that time for the date that was as soon as administratively practicable after the meeting and no earlier than the third business day following NuStar GP Holdings’ third quarter earnings release. The NuStar GP Holdings restricted units were awarded pursuant to the NuStar GP Holdings Long-Term Incentive Plan, as amended and restated as of April 1, 2007, and vest 1/5 annually over five years beginning on the first anniversary of the grant date. All grantees receiving NuStar GP Holdings restricted units are entitled to receive an amount equal to the product of (a) the number of restricted units granted to the grantee that remain outstanding and unvested as of the record date for such quarter and (b) the quarterly distribution declared by the NuStar GP Holdings Board for such quarter.
(4) The grant date fair value for performance units was determined by multiplying the number of performance units that were granted by the NYSE closing unit price of our units on the date of grant, $59.24. See “Compensation Discussion and Analysis-Impact of Accounting and Tax Treatments-Accounting Treatment” above in this Item 11 for information regarding the assumptions made in valuation. See footnote (1) above for the vesting schedule and the actual performance level attained for 2015 for the performance unit awards.
(5) The grant date fair value for restricted units was determined by multiplying the number of NuStar Energy restricted units that were granted by the NYSE closing unit price of our units on the date of grant, $43.02. See “Compensation Discussion and Analysis-Impact of Accounting and Tax Treatments-Accounting Treatment” above in this Item 11 for information regarding the assumptions made in valuation and see footnote (2) above for the vesting schedule.
(6) The grant date fair value for restricted units was determined by multiplying the number of NuStar GP Holdings restricted units that were granted by the NYSE closing unit price of NuStar GP Holdings units on the date of grant, $23.80. See “Compensation Discussion and Analysis-Impact of Accounting and Tax Treatments-Accounting Treatment” above in this Item 11 for information regarding the assumptions made in valuation and see footnote (3) above for the vesting schedule.

Table of Contents
130
OUTSTANDING EQUITY AWARDSAT DECEMBER 31, 2015
The following table provides information regarding our NEOs’ unvested restricted units and the target amount of our NEOs’ unvested performance units as of December 31, 2015. The value of NuStar Energy restricted units or performance units reported below is equal to the number of restricted units or performance units reflected in the table, as applicable, multiplied by $40.10, the NuStar Energy closing price on the NYSE on December 31, 2015. The value of the NuStar GP Holdings restricted units reported below is equal to the number of restricted units reflected in the table multiplied by $21.15, the NuStar GP Holdings closing price on the NYSE on December 31, 2015. The footnotes to the table describe the vesting schedules for the unvested restricted units and the unvested performance units reflected in the table. None of our NEOs had outstanding unit options as of December 31, 2015.
Option Awards Unit Awards
Name
Number ofSecurities
UnderlyingUnexercised
Options (#)
Exercisable
Number ofSecurities
UnderlyingUnexercised
Options (#)
Unexercisable
EquityIncentive
PlanAwards:
Number ofSecurities
UnderlyingUnexercised Unearned
Options (#)
OptionExercisePrice ($)
OptionExpiration
Date
Number of Units
That Have Not
Vested (#)
MarketValue of
Units ThatHave NotVested ($)
EquityIncentive
Plan Awards:
Number ofUnearned
Unitsor Other Rights
That Have Not
Vested (#)
EquityIncentive
PlanAwards:
Market orPayout Value of
Unearned Units or
Other Rights That
Have Not Vested ($)
Barron— — — — — — — 15,791(11) 633,219
— — — — — 20,582(1) 825,338 — —
— — — — — 14,642(2) 309,678 — —Shoaf — — — — — — — 8,537(12) 342,334
— — — — — 10,694(3) 428,829 — —
— — — — — 7,637(4) 161,523 — —Brown — — — — — — — 9,974(13) 399,957
— — — — — 13,133(5) 526,633 — —
— — — — — 9,395(6) 198,704 — —Perry — — — — — — — 3,498(14) 140,270
— — — — — 6,284(7) 251,988 — —
— — — — — 2,825(8) 59,749 — —Thompson — — — — — — — 3,498(15) 140,270
— — — — — 6,204(9) 248,780 — —
— — — — — 2,825(10) 59,749 — —
(1) Mr. Barron’s restricted NuStar Energy units consist of: 628 restricted units granted December 16, 2011; 1,380 restricted units granted December 19, 2012; 2,850 restricted units granted December 16, 2013; 5,724 restricted units granted December 19, 2014; and 10,000 restricted units granted November 16, 2015. All of Mr. Barron’s NuStar Energy restricted units vest in 1/5 increments over five years, beginning on the first anniversary of the date of grant.
(2) Mr. Barron’s restricted NuStar GP Holdings units consist of: 478 restricted units granted December 16, 2011; 956 restricted units granted December 19, 2012; 2,064 restricted units granted December 16, 2013; 3,844 restricted units granted December 19, 2014; and 7,300 restricted units granted November 16, 2015. All of Mr. Barron’s NuStar GP Holdings restricted units vest in 1/5 increments over five years, beginning on the first anniversary of the date of grant.

Table of Contents
131
(3) Mr. Shoaf’s restricted NuStar Energy units consist of: 309 restricted units granted December 16, 2011; 936 restricted units granted December 19, 2012; 1,911 restricted units granted December 16, 2013; 2,888 restricted units granted December 19, 2014; and 4,650 restricted units granted November 16, 2015. All of Mr. Shoaf’s NuStar Energy restricted units vest in 1/5 increments over five years, beginning on the first anniversary of the date of grant.
(4) Mr. Shoaf’s restricted NuStar GP Holdings units consist of: 236 restricted units granted December 16, 2011; 648 restricted units granted December 19, 2012; 1,383 restricted units granted December 16, 2013; 1,940 restricted units granted December 19, 2014; and 3,430 restricted units granted November 16, 2015. All of Mr. Shoaf’s NuStar GP Holdings restricted units vest in 1/5 increments over five years, beginning on the first anniversary of the date of grant.
(5) Ms. Brown’s restricted NuStar Energy units consist of: 678 restricted units granted December 16, 2011; 1,492 restricted units granted December 19, 2012; 2,850 restricted units granted December 16, 2013; 3,108 restricted units granted December 19, 2014; and 5,005 restricted units granted November 16, 2015. All of Ms. Brown’s NuStar Energy restricted units vest in 1/5 increments over five years, beginning on the first anniversary of the date of grant.
(6) Ms. Brown’s restricted NuStar GP Holdings units consist of: 516 restricted units granted December 16, 2011; 1,032 restricted units granted December 19, 2012; 2,064 restricted units granted December 16, 2013; 2,088 restricted units granted December 19, 2014; and 3,695 restricted units granted November 16, 2015. All of Ms. Brown’s NuStar GP Holdings restricted units vest in 1/5 increments over five years, beginning on the first anniversary of the date of grant.
(7) Ms. Perry’s restricted NuStar Energy units consist of: 285 restricted units granted December 16, 2011; 744 restricted units granted December 19, 2012; 1,290 restricted units granted December 16, 2013; 1,520 restricted units granted December 19, 2014; and 2,445 restricted units granted November 16, 2015. All of Ms. Perry’s NuStar Energy restricted units vest in 1/5 increments over five years, beginning on the first anniversary of the date of grant.
(8) Ms. Perry’s restricted NuStar GP Holdings units consist of: 1,020 restricted units granted December 19, 2014; and 1,805 restricted units granted November 16, 2015. Ms. Perry’s NuStar GP Holdings restricted units vest in 1/5 increments over five years, beginning on the first anniversary of the date of grant.
(9) Ms. Thompson’s restricted NuStar Energy units consist of: 285 restricted units granted December 16, 2011; 664 restricted units granted December 19, 2012; 1,290 restricted units granted December 16, 2013; 1,520 restricted units granted December 19, 2014; and 2,445 restricted units granted November 16, 2015. All of Ms. Thompson’s NuStar Energy restricted units vest in 1/5 increments over five years, beginning on the first anniversary of the date of grant.
(10) Ms. Thompson’s restricted NuStar GP Holdings units consist of: 1,020 restricted units granted December 19, 2014; and 1,805 restricted units granted November 16, 2015. Ms. Thompson’s NuStar GP Holdings restricted units vest in 1/5 increments over five years, beginning on the first anniversary of the date of grant.
(11) Mr. Barron’s unvested NuStar Energy performance units consist of: 492 units granted April 24, 2012; 1,966 units granted January 30, 2013; 5,333 units granted July 23, 2014; and 8,000 units granted January 29, 2015.
The performance units awarded in 2012 and 2013 are eligible to vest in three annual increments and are payable in NuStar Energy’s units. Upon vesting, the performance units are converted into a number of NuStar Energy units based on NuStar Energy’s TUR during rolling three-year periods that end on December 31 of each year following the date of grant. At the end of each performance period, NuStar Energy’s TUR is compared to the peer group and ranked by quartile. Holders of the performance units then earn 0%, 50%, 100% or 150% of that portion of the initial grant that is eligible for vesting, depending upon whether NuStar Energy’s TUR is in the last, third, second or first quartile, respectively. Holders earn 200% if NuStar Energy is the highest ranking entity in the peer group. On January 28, 2016, the Compensation Committee determined that, for the performance period ended December 31, 2015, NuStar Energy’s TUR was in the second quartile of its peer group, which resulted in 100% vesting on January 28, 2016 of the units eligible to vest under the 2012 and 2013 performance unit awards.

Table of Contents
132
The performance units awarded in 2014 and 2015 are eligible to vest in three annual increments and are payable in NuStar Energy’s units. Upon vesting, the performance units are converted into a number of NuStar Energy units based upon NuStar Energy’s DCR during the one-year performance periods that end on December 31 of each year following the date of grant. The target metric for performance unit vesting with respect to 2015 is NuStar Energy achieving a DCR of 1.01:1. All units awarded in 2014 and 2015 and eligible for vesting vest as follows based on the DCR for 2015:
Level DCR % Performance Units EarnedBelow Threshold Below 1.00 : 1 0%Threshold 1.00 : 1 90%Target 1.01 : 1 100%Exceeds Target 1.05 : 1 150%Maximum 1.10 : 1 200%
On January 28, 2016, the Compensation Committee determined that, for the performance period ended December 31, 2015, NuStar Energy achieved a DCR of 1.11:1 and the performance units available to vest for the 2014 and 2015 awards vested at 200% on January 28, 2016.
(12) Mr. Shoaf’s unvested NuStar Energy performance units consist of: 242 units granted April 24, 2012; 1,500 units granted January 30, 2013; 2,856 units granted July 23, 2014; and 3,939 units granted January 29, 2015. The performance units vest in accordance with the description in Footnote (11) above.
(13) Ms. Brown’s unvested NuStar Energy performance units consist of: 532 units granted April 24, 2012; 2,124 units granted January 30, 2013; 3,076 units granted July 23, 2014; and 4,242 units granted January 29, 2015. The performance units vest in accordance with the description in Footnote (11) above.
(14) Ms. Perry’s unvested NuStar Energy performance units consist of: 1,428 units granted July 23, 2014; and 2,070 units granted January 29, 2015. The performance units vest in accordance with the description in Footnote (11) above.
(15) Ms. Thompson’s unvested NuStar Energy performance units consist of: 1,428 units granted July 23, 2014; and 2,070 units granted January 29, 2015. The performance units vest in accordance with the description in Footnote (11) above.
OPTION EXERCISES AND UNITS VESTEDDURING THE YEAR ENDED DECEMBER 31, 2015
The following table provides information regarding the vesting of restricted units and performance units held by our NEOs during 2015. None of our NEOs exercised option awards during 2015 and none of our NEOs currently have outstanding option awards.
Option Awards(1) Unit Awards
NameNumber of Units
Acquired on Exercise (#)Value Realized on
Exercise ($)Number of Units
Acquired on Vesting (#)Value Realized on
Vesting ($)(6)
Barron — — 13,039(1) 544,416
Shoaf — — 7,413(2) 309,928
Brown — — 11,391(3) 473,288
Perry — — 2,706(4) 107,239
Thompson — — 2,666(5) 105,874
(1) Mr. Barron's restricted NuStar Energy units vested in 2015 as follows: 606 units on January 26, 2015; 1,578 units on December 16, 2015; 2,121 units on December 19, 2015; and 491 units on December 30, 2015. Mr. Barron's restricted NuStar GP Holdings units vested in 2015 as follows: 1,166 units on December 16, 2015; 1,439 units on December 19, 2015; and 410 units on December 30, 2015. On January 29, 2015, 5,228 of Mr. Barron’s NuStar Energy performance units vested.

Table of Contents
133
(2) Mr. Shoaf’s restricted NuStar Energy units vested in 2015 as follows: 296 units on January 26, 2015; 946 units on December 16, 2015; 1,190 units on December 19, 2015; and 235 units on December 30, 2015. Mr. Shoaf’s restricted NuStar GP Holdings units vested in 2015 as follows: 697 units on December 16, 2015; 809 units on December 19, 2015; and 200 units on December 30, 2015. On January 29, 2015, 3,040 of Mr. Shoaf’s NuStar Energy performance units vested.
(3) Ms. Brown’s restricted NuStar Energy units vested in 2015 as follows: 675 units on January 26, 2015; 1,628 units on December 16, 2015; 1,523 units on December 19, 2015; and 550 units on December 30, 2015. Ms. Brown’s restricted NuStar GP Holdings units vested in 2015 as follows: 1,204 units on December 16, 2015; 1,038 units on December 19, 2015; and 458 units on December 30, 2015. On January 29, 2015, 4,315 of Ms. Brown’s NuStar Energy performance units vested.
(4) Ms. Perry’s restricted NuStar Energy units vested in 2015 as follows: 715 units on December 16, 2015; 752 units on December 19, 2015; and 270 units on December 30, 2015. Ms. Perry’s restricted NuStar GP Holdings units vested in 2015 as follows: 255 units on December 19, 2015. On January 29, 2015, 714 of Ms. Perry’s NuStar Energy performance units vested.
(5) Ms. Thompson’s restricted NuStar Energy units vested in 2015 as follows: 715 units on December 16, 2015; 712 units on December 19, 2015; and 270 units on December 30, 2015. Ms. Thompson’s restricted NuStar GP Holdings units vested in 2015 as follows: 255 units on December 19, 2015. On January 29, 2015, 714 of Ms. Thompson’s NuStar Energy performance units vested.
(6) The value realized on vesting of NuStar Energy restricted units and performance units was calculated by multiplying the closing price of NuStar Energy units on the NYSE on the date of vesting by the number of NuStar Energy units vested. The value realized on vesting of NuStar GP Holdings restricted units was calculated by multiplying the closing price of NuStar GP Holdings units on the NYSE on the date of vesting by the number of NuStar GP Holdings units vested. The closing prices on the applicable dates are as follows:
Closing Prices for 2015 VestingsDate NuStar Energy Closing Price ($)
January 26, 2015 60.71January 29, 2015 59.24December 16, 2015 35.07December 19, 2015 34.12December 30, 2015 37.55
Date NuStar GP Holdings Closing Price ($)December 16, 2015 17.95December 19, 2015 15.96December 30, 2015 19.21

Table of Contents
134
POST-EMPLOYMENT COMPENSATION
PENSION BENEFITSFOR THE YEAR ENDED DECEMBER 31, 2015
The following table provides information regarding the accumulated benefits of our NEOs under NuStar GP, LLC’s pension plans during the year ended December 31, 2015.
Name Plan NameNumber of YearsCredited Service
Present Value ofAccumulatedBenefit ($)(1)
Payments During LastFiscal Year ($)
Barron NuStar GP, LLC Pension Plan (2) 248,381 —
NuStar GP, LLC ExcessPension Plan
(2) 324,617 —
Shoaf NuStar GP, LLC Pension Plan (2) 350,182 —
NuStar GP, LLC ExcessPension Plan
(2) 319,758 —
Brown NuStar GP, LLC Pension Plan (2) 345,670 —
NuStar GP, LLC ExcessPension Plan
(2) 419,356 —
Perry NuStar GP, LLC Pension Plan (2) 139,906 —
NuStar GP, LLC Excess Pension Plan
(2) 33,256 —
Thompson NuStar GP, LLC Pension Plan (2) 210,544 —
NuStar GP, LLC Excess Pension Plan
(2) 36,376 —
(1) The present values stated in the table above were calculated using the same interest rate and mortality table we use for our financial reporting. The present values as of December 31, 2015 were determined using a 4.61% discount rate and the plans’ earliest unreduced retirement age (i.e., age 62). The present values reflect post-retirement mortality rates based on the RP2006 generational mortality table projected using scale MP2015. No decrements were included for pre-retirement termination, mortality or disability. Where applicable, lump sums were determined based on a 4.11% interest rate and the mortality table prescribed by the IRS in Rev. Ruling 2007-67 and updated by IRS Notices 2008-85 and 2013-49 for distributions in the years 2009-2015.
(2) As of December 31, 2013, the final average pay formula used in the Pension Plan and the Excess Pension Plan, which was based on years of service and compensation during service, was frozen. Benefits for service after December 31, 2013 accrue under a cash balance formula described below. The number of years of credited service under the final average pay formula and the cash balance formula for each of our NEOs under the Pension Plan and the Excess Pension Plan are set forth below.
Name Plan Name
Number of YearsCredited Service - Final Average
Pay Formula (Frozen as of December 31, 2013)
Number of YearsCredited Service - Cash
Balance FormulaBarron NuStar GP, LLC Pension Plan 7.5 15.0
NuStar GP, LLC Excess Pension Plan 13.0 15.0Shoaf NuStar GP, LLC Pension Plan 7.5 30.5
NuStar GP, LLC Excess Pension Plan 28.5 30.5Brown NuStar GP, LLC Pension Plan 6.7 18.3
NuStar GP, LLC Excess Pension Plan 6.7 18.3Perry NuStar GP, LLC Pension Plan 7.5 13.0
NuStar GP, LLC Excess Pension Plan 7.5 13.0Thompson NuStar GP, LLC Pension Plan 6.7 13.7
NuStar GP, LLC Excess Pension Plan 11.7 13.7

Table of Contents
135
We maintain a noncontributory defined benefit pension plan in which most of our employees are eligible to participate and under which contributions by individual participants are neither required nor permitted. We also maintain a noncontributory, non-qualified excess pension plan, which provides supplemental pension benefits to certain highly compensated employees. The excess pension plan provides eligible employees with additional retirement savings opportunities that cannot be achieved with tax-qualified plans due to the Code’s limits on (1) annual compensation that can be taken into account under qualified plans or (2) annual benefits that can be provided under qualified plans.
NuStar GP, LLC Pension Plan
The Pension Plan is a qualified, non-contributory defined benefit pension plan that became effective as of July 1, 2006. The Pension Plan covers substantially all of NuStar GP, LLC’s employees and generally provides retirement income calculated under a cash balance formula (CBF), which is based on age, years of service and interest credits. Employees become fully vested in their CBF benefits upon attaining three years of service. Prior to January 1, 2014, eligible employees were covered under either the CBF or a defined benefit final average pay formula (FAP) based on years of service and compensation during their period of service, and employees became fully vested in their benefits upon attaining five years of service. The Pension Plan was amended to freeze the FAP benefit at December 31, 2013 and, on or after January 1, 2014, all employees are covered under the CBF.
NuStar GP, LLC Excess Pension Plan
The Excess Pension Plan, which became effective July 1, 2006, provides benefits to eligible employees of NuStar GP, LLC whose pension benefits under the Pension Plan and the Valero Energy Pension Plan, where applicable, are subject to limitations under the Code. The Excess Pension Plan is an excess benefit plan as contemplated under ERISA for those benefits provided in excess of the maximum amount allowable under Section 415 of the Code. Benefits provided as a result of other statutory limitations are limited to a select group of management or highly compensated employees. The Excess Pension Plan is not intended to constitute either a qualified plan under the Code or a funded plan subject to ERISA. For employees of NuStar GP, LLC who were eligible to receive a benefit under the Valero Energy Excess Pension Plan (the Predecessor Excess Pension Plan) as of July 1, 2006, the Excess Pension Plan assumed the liabilities of the Predecessor Excess Pension Plan and will provide a single, nonqualified defined benefit to eligible employees for their pre-July 1, 2006 benefit accruals under the Predecessor Excess Pension Plan and their post-July 1, 2006 benefit accruals under the Excess Pension Plan.
An eligible employee’s monthly pension under the Excess Pension Plan will be equal to:
• 1.6% of the employee’s average monthly compensation multiplied by the employee’s years of service for service through December 31, 2013 plus the employee’s CBF benefits for service after December 31, 2013, less
• the employee’s Pension Plan benefit.
All of our NEOs participated in the Excess Pension Plan during 2015.

Table of Contents
136
NONQUALIFIED DEFERRED COMPENSATIONFOR THE YEAR ENDED DECEMBER 31, 2015
The following table provides information regarding contributions by NuStar GP, LLC and each of our NEOs under our non-qualified defined contribution plan, the Excess Thrift Plan, during the year ended December 31, 2015. The table also presents each NEO’s withdrawals, earnings and year-end balances in such plan. Please see the description of our Excess Thrift Plan above in “Compensation Discussion and Analysis-Post-Employment Benefits.”
Name
ExecutiveContributionsin 2015 ($)(1)
RegistrantContributions in
2015 ($)(2)
AggregateEarnings (Loss) in
2015 ($)(3)
AggregateWithdrawals/
Distributions ($)
AggregateBalance at
December 31,2015 ($)(4)
Barron — 15,000 (19,023) — 47,765
Shoaf — 3,614 (1,352) — 6,553
Brown — 7,314 (19,501) — 44,966
Perry — — — — —
Thompson — — — — —
(1) The NEOs made no contributions during 2015.
(2) Amounts reported represent our contributions to our Excess Thrift Plan. All of the amounts included in this column are included within the amounts reported as “All Other Compensation” for 2015 in the Summary Compensation Table.
(3) Amounts include the earnings (excluding dividends, if any) and losses, if any, of each NEO’s respective account in our Excess Thrift Plan.
(4) Amounts include the aggregate balance at year end, if any, of each NEO’s respective account in our Excess Thrift Plan and include registrant contributions that were previously reported as compensation to each of the NEOs in the “All Other Compensation” column in the Summary Compensation Table for 2015 and previous years.

Table of Contents
137
POTENTIAL PAYMENTS UPON TERMINATION OR CHANGE OF CONTROL
SEC regulations require us to disclose potential payments to an NEO in connection with his or her termination or a change of control of NuStar Energy, other than those amounts disclosed under the headings “Pension Benefits For The Year Ended December 31, 2015” and “Nonqualified Deferred Compensation For The Year Ended December 31, 2015” above in this Item 11 or amounts pursuant to arrangements that do not discriminate in favor of executive officers and are generally available to salaried employees. The following narrative and table provide the required disclosures.
None of our NEOs have employment agreements, other than the change of control severance agreements described below. As a result, in the event of a termination, retirement, death or disability that does not occur in connection with a change of control, an NEO will only receive the compensation or benefits to which he or she would already be entitled under the terms of, as applicable, the defined contribution, defined benefit, medical or long-term incentive plans. Therefore, these scenarios are not presented in the table below.
Each of our NEOs has entered into a change of control severance agreement with NuStar Energy and NuStar GP, LLC. These agreements seek to assure the continued availability of these executives in the event of a “change of control” (described below) of NuStar Energy. When determining the amounts and benefits payable under the agreements, the Compensation Committee sought to secure compensation that is competitive in our market in order to recruit and retain executive officer talent. Consideration was given to the principal economic terms found in written employment and change of control agreements of other publicly traded companies.
When a change of control occurs, the agreement becomes operative for a fixed three-year period. The agreements provide generally that the NEO’s terms of employment will not be adversely changed during the three-year period after a change of control. In addition, outstanding unit options held by the NEO will automatically vest, restrictions applicable to outstanding restricted units held by the NEO will lapse and all unvested performance units held by the NEO will fully vest and become payable at 200% of target. Certain of the NEOs also are entitled to receive a payment in an amount sufficient to make the NEO whole for any excise tax on excess parachute payments imposed under Section 4999 of the Code, as set forth in the table below. Each agreement subjects the NEO to obligations of confidentiality, both during the term and after termination, for secret and confidential information relating to NuStar Energy, NuStar GP, LLC and their affiliates (as defined in the agreement) that the NEO acquired during his or her employment.
For purposes of these agreements, a “change of control” means any of the following (subject to additional particulars as stated in the agreements):
• the acquisition by an individual, entity or group of beneficial ownership of 40% of NuStar GP Holdings’ voting interests;
• the failure of NuStar GP Holdings to control NuStar GP, LLC, NuStar Energy’s general partner, Riverwalk Logistics, L.P., or all of the general partner interests of NuStar Energy;
• Riverwalk Logistics, L.P. ceases to be NuStar Energy’s general partner or Riverwalk Logistics, L.P. is no longer controlled by either NuStar GP, LLC or one of its affiliates;
• the acquisition of more than 50% of all voting interests of NuStar Energy then outstanding;• certain consolidations or mergers of NuStar GP Holdings;• certain consolidations or mergers of NuStar Energy;• sale of all or substantially all of the assets of NuStar GP Holdings to anyone other than its affiliates;• sale of all or substantially all of the assets of NuStar Energy to anyone other than its affiliates; or• a change in the composition of the NuStar GP Holdings board of directors so that fewer than a majority
of those directors are “incumbent directors” as defined in the agreements.
In the agreements, “cause” is defined to mean, generally, the willful and continued failure of the NEO to perform substantially his or her duties, or the willful engaging by the NEO in illegal or gross misconduct that is materially and demonstrably injurious to NuStar Energy, NuStar GP, LLC or an affiliate. “Good reason” is defined to mean, generally:
• a diminution in the NEO’s position, authority, duties and responsibilities;• failure of the successor of NuStar Energy to assume and perform under the agreement; and• relocation of the NEO or increased travel requirements.

Table of Contents
138
Except as otherwise noted, the values in the table below assume that a change of control occurred on December 31, 2015 and that the NEO’s employment terminated on that date.
Under the change of control severance agreements, if an NEO’s employment is terminated for “cause” following a change of control, the NEO will not receive any additional benefits or compensation as a result of the termination and will only receive accrued salary or vacation pay that remained unpaid through the date of termination and any other benefits which the NEO would already be entitled to receive, if any. Therefore, there is no presentation of termination for “cause” in the table below.
Executive Benefits andPayments
Termination ofEmployment by the
Company Other Than for“Cause,” Death
or Disability, or bythe Executive for “Good
Reason” ($)(2)
Termination ofEmployment because ofDeath or Disability ($)(3)
Termination by theExecutive Other Than
for “Good Reason” ($)(4)
ContinuedEmployment
Following Change of Control ($)(5)
Salary (1)
Barron 1,080,000 — — —Shoaf 679,000 — — —Brown 731,400 — — —Perry 401,700 — — —Thompson 401,700 — — —
Bonus (1)
Barron 1,600,000 800,000 800,000 —Shoaf 643,104 321,552 321,552 —Brown 692,574 346,287 346,287 —Perry 340,313 226,875 226,875 —Thompson 340,313 226,875 226,875 —Pension and Excess PensionBenefitsBarron 221,429 — — —Shoaf 177,017 — — —Brown 200,966 — — —Perry 51,365 — — —Thompson 60,076 — — —Contributions under DefinedContribution PlansBarron 61,800 — — —Shoaf 39,028 — — —Brown 43,242 — — —Perry 22,289 — — —Thompson 23,751 — — —
Health and Welfare Plan Benefits (6)
Barron 27,479 — — —Shoaf 37,510 — — —Brown 19,758 — — —Perry 15,965 — — —Thompson 28,132 — — —

Table of Contents
139
Executive Benefits andPayments
Termination ofEmployment by the
Company Other Than for“Cause,” Death
or Disability, or bythe Executive for “Good
Reason” ($)(2)
Termination ofEmployment because ofDeath or Disability ($)(3)
Termination by theExecutive Other Than
for “Good Reason” ($)(4)
ContinuedEmployment
Following Change of Control ($)(5)
Accelerated Vesting of UnitOptionsBarron — — — —Shoaf — — — —Brown — — — —Perry — — — —Thompson — — — —
Accelerated Vesting of Restricted Units (7)
Barron 1,135,016 1,135,016 1,135,016 1,135,016Shoaf 590,352 590,352 590,352 590,352Brown 725,337 725,337 725,337 725,337Perry 311,737 311,737 311,737 311,737Thompson 308,529 308,529 308,529 308,529
Accelerated Vesting of Performance Units (8)
Barron 1,266,438 1,266,438 1,266,438 1,266,438Shoaf 684,668 684,668 684,668 684,668Brown 799,914 799,914 799,914 799,914Perry 280,540 280,540 280,540 280,540Thompson 280,540 280,540 280,540 280,540
280G Tax Gross-Up (9)
Barron 2,058,757 — — —Shoaf 1,059,042 — — —Brown — — — —Perry — — — —Thompson — — — —TotalsBarron 7,450,919 3,201,454 3,201,454 2,401,454Shoaf 3,909,721 1,596,572 1,596,572 1,275,020Brown 3,213,191 1,871,538 1,871,538 1,525,251Perry 1,423,909 819,152 819,152 592,277Thompson 1,443,041 815,944 815,944 589,069
(1) Per SEC regulations, for purposes of this analysis we assumed each NEO’s compensation at the time of each triggering event to be as stated below. The listed salary is the NEO’s actual annualized rate of pay as of December 31, 2015. The listed bonus amount represents the highest bonus earned by the executive in any of the fiscal years 2013, 2014 and 2015 (the three years prior to the assumed change of control):
Name Annual Salary ($) Bonus ($)Barron 540,000 800,000Shoaf 339,500 321,552Brown 365,700 346,287Perry 267,800 226,875Thompson 267,800 226,875
(2) The change of control severance agreements provide that if the company terminates the NEO’s employment (other than for “cause,” death or “disability,” as defined in the agreements) or if the NEO terminates his or her employment for “good reason,” as defined in the agreements, the NEO is generally entitled to receive the following:

Table of Contents
140
(A) a lump sum cash payment equal to the sum of:(i) accrued and unpaid compensation through the date of termination, including a pro-rata annual bonus
(for this table, we assumed that the NEOs’ bonuses for the year of termination were paid at year end);
(ii) two times the sum of the NEO’s (1.5 times for Ms. Perry and Ms. Thompson) annual base salary plus the NEO’s highest annual bonus from the past three years;
(iii) the amount of the excess of the actuarial present value of the pension benefits (qualified and nonqualified) the NEO would have received for an additional two years (1.5 years for Ms. Perry and Ms. Thompson) of service over the actuarial present value of the NEO’s actual pension benefits; and
(iv) the equivalent of two years (1.5 years for Ms. Perry and Ms. Thompson) of employer contributions under NuStar GP, LLC’s tax-qualified and supplemental defined contribution plans;
(B) continued welfare benefits for two years (1.5 years for Ms. Perry and Ms. Thompson); and(C) vesting of all outstanding equity incentive awards on the date of the change of control, as described
above.
(3) If the NEO’s employment is terminated by reason of his or her death or disability, then his or her estate or beneficiaries will be entitled to receive a lump sum cash payment equal to any accrued and unpaid salary and vacation pay plus a bonus equal to the highest bonus earned by the NEO in the prior three years (prorated to the date of termination). In this example, the termination of employment was deemed to occur on the last day of the year. Therefore, a full year’s bonus is shown in the table. In addition, in the case of disability, the NEO would be entitled to any disability and related benefits at least as favorable as those provided by NuStar GP, LLC under its plans and programs during the 120-days prior to the NEO’s termination of employment. In addition, all outstanding equity incentive awards will automatically vest on the date of the change of control, as described above.
(4) If the NEO voluntarily terminates his or her employment other than for “good reason,” then he or she will be entitled to a lump sum cash payment equal to any accrued and unpaid salary and vacation pay plus a bonus equal to the highest bonus earned by the NEO in the prior three years (prorated to the date of termination). In this example, the termination of employment was deemed to occur on the last day of the year. Therefore, a full year’s bonus is shown in the table. In addition, all outstanding equity incentive awards will automatically vest on the date of the change of control, as described above.
(5) The change of control agreements provide for a three-year term of employment following a change of control. The agreements generally provide that the NEO will continue to enjoy compensation and benefits on terms at least as favorable as in effect prior to the change of control. In addition, all outstanding equity incentive awards will automatically vest on the date of the change of control, as described above.
(6) The NEO is entitled to coverage under the welfare benefit plans (e.g., health, dental, etc.) for two years (1.5 years for Ms. Perry and Ms. Thompson) following the date of termination.
(7) The amounts stated in the table represent the gross value of previously unvested restricted units, derived by multiplying (x) the number of units whose restrictions lapsed because of the change of control, times (y) (as applicable) $40.10 (the closing price of NuStar Energy’s units on the NYSE on December 31, 2015) or $21.15 (the closing price of NuStar GP Holdings’ units on the NYSE on December 31, 2015).
(8) The amounts stated in the table represent the product of (x) the number of performance units whose vesting was accelerated because of the change of control, times (y) 200%, times (z) $40.10 (the closing price of NuStar Energy’s units on the NYSE on December 31, 2015).
(9) If any payment or benefit to Mr. Barron, Mr. Shoaf or Ms. Brown is determined to be subject to an excise tax under Section 4999 of the Code, the impacted NEO is entitled to receive an additional payment to adjust for the incremental tax cost of the payment or benefit. However, if it is determined that the NEO is entitled to receive an additional payment to adjust for the incremental tax cost but the value of all payments to the NEO does not exceed 100% of 2.99 times the NEO’s “base amount” (as defined by Section 280G(b)(3) of the Code) (the Safe Harbor Amount), the additional payment will not be made and the amount payable to the NEO will be reduced so that the aggregate value of all payments equals the Safe Harbor Amount.

Table of Contents
141
DIRECTOR COMPENSATIONFOR THE YEAR ENDED DECEMBER 31, 2015
The following table provides a summary of compensation paid for the year ended December 31, 2015 to the directors who served on the Board during 2015. The table shows amounts earned by such persons for services rendered to NuStar GP, LLC in all capacities in which they served during 2015. Rodman D. Patton retired as a member of the Board on April 22, 2015 and the table below reflects the compensation for his service on the Board prior to his retirement. Robert J. Munch was appointed as a member of the Board on January 26, 2016. Accordingly, because Mr. Munch did not serve as a director during 2015, there is no compensation reflected for him in the table below.
Name
Fees Earned orPaid in Cash
($)(1)Unit Awards
($)(3)
OptionAwards
($)(3)
Non-EquityIncentive PlanCompensation
($)
Change in PensionValue and
NonqualifiedDeferred
CompensationEarnings
($)
All OtherCompensation
($)TOTAL
($)
William E. Greehey 135,000 99,978 — — n/a — 234,978
Bradley C. Barron (2) (2) (2) (2) (2) (2) (2)
J. Dan Bates 100,500 74,984 — — n/a — 175,484Dan J. Hill 115,500 74,984 — — n/a — 190,484Rodman D. Patton 33,500 136,915 — — n/a — 170,415W. Grady Rosier 95,500 74,984 — — n/a — 170,484
(1) The amounts disclosed in this column exclude reimbursement for expenses for transportation to and from Board meetings and lodging while attending meetings.
(2) Mr. Barron was not compensated for his service as a director of NuStar GP, LLC. His compensation for his services as President and CEO are included above in the Summary Compensation Table.
(3) The amounts reported for Messrs. Greehey, Bates, Hill and Rosier represent the grant date fair value for the November 16, 2015 grant of restricted NuStar Energy units to them as non-employee directors for the fiscal year ended December 31, 2015 (2,324 restricted units for Mr. Greehey, as Chairman, and 1,743 restricted units for each of Messrs. Bates, Hill and Rosier) based on the closing price of NuStar Energy’s units on the NYSE on November 16, 2015 ($43.02). Mr. Patton retired from the Board during 2015. Accordingly, Mr. Patton did not receive a restricted unit grant in 2015. The amount reported for Mr. Patton represents the incremental value associated with the acceleration of 2,053 of Mr. Patton’s outstanding restricted units in connection with his retirement, based on the closing price of NuStar Energy’s units on the NYSE on May 1, 2015 ($66.69). Please see “Compensation Discussion and Analysis-Impact of Accounting and Tax Treatments-Accounting Treatment” above in this Item 11 for information regarding the assumptions made in the valuation.
As of December 31, 2015, each director listed in the table above held the following aggregate number of NuStar Energy restricted unit and option awards:
Name Aggregate # of Restricted Units Aggregate # of Unit OptionsGreehey 4,127 —Barron * *Bates 3,086 —Hill 3,086 —Patton ** —Rosier 3,552 —
* Mr. Barron’s aggregate holdings are disclosed above in the Outstanding Equity Awards at December 31, 2015 table in thisItem 11.** Mr. Patton’s outstanding restricted units vested upon his retirement from the Board during 2015 as described in Footnote(3) above.

Table of Contents
142
Directors who are employees of NuStar GP, LLC receive no compensation (other than reimbursement of expenses) for serving as directors. The compensation structure for our non-employee directors consists of the following components: (1) an annual cash retainer; (2) an annual restricted unit grant; (3) an additional cash payment for each meeting attended in-person and telephonically; (4) an additional annual cash retainer for each committee chair; (5) an additional annual retainer for the Chairman of the Board, which includes both cash and restricted units; and (6) an additional annual cash retainer for the lead director, each as set forth in the table below.
Non-Employee Director Compensation Component AmountAnnual Cash Retainer ($) 60,000Annual Restricted Unit Grant ($ value of restricted units) 75,000Per Meeting Fees (in-person attendance) ($) 1,500Per Meeting Fees (telephonic attendance) ($) 500Annual Audit and Compensation Committee Chair Retainers ($) 15,000Annual Nominating, Governance and Conflicts Committee Chair Retainer ($) 10,000Annual Chairman of the Board Retainer ($25,000 value in restricted units/$50,000 cash) 75,000Annual Lead Director Retainer ($) 15,000
As described above, NuStar GP, LLC supplements the cash compensation paid to non-employee directors with an annual grant of restricted NuStar Energy units that vests in equal annual installments over a three-year period. We believe this annual grant of restricted units increases the non-employee directors’ identification with the interests of NuStar Energy’s unitholders through ownership of NuStar Energy units. Upon a non-employee director’s initial election to the Board, the director will receive a grant of restricted units.
In the event of a “change of control” as defined in the 2000 LTIP, all unvested restricted units and unit options previously granted immediately become vested or exercisable. Each plan also contains anti-dilution provisions providing for an adjustment in the number of restricted units or unit options, respectively, that have been granted to prevent dilution of benefits in the event any change in the capital structure of NuStar Energy affects the NuStar Energy units.
COMPENSATION COMMITTEE INTERLOCKS AND INSIDER PARTICIPATION
There are no compensation committee interlocks. The current members of our Compensation Committee are Mr. Hill (Chairman), Mr. Bates, Mr. Munch and Mr. Rosier. Prior to his retirement from our Board in April 2015, Mr. Patton served as a member of our Compensation Committee. None of the members of our Compensation Committee have served as an officer or employee of NuStar GP, LLC. Furthermore, except for compensation arrangements disclosed in this Annual Report on Form 10-K, NuStar Energy has not participated in any contracts, loans, fees or awards, nor does it have financial interests, direct or indirect, with any Compensation Committee member. In addition, none of NuStar Energy’s management or Board members are aware of any means, directly or indirectly, by which a Compensation Committee member could receive a material benefit from NuStar Energy.

Table of Contents
143
ITEM 12. SECURITY OWNERSHIP OF CERTAIN BENEFICIAL OWNERS AND MANAGEMENT AND RELATED UNITHOLDER MATTERS
SECURITY OWNERSHIP OF MANAGEMENT AND DIRECTORS
The following table sets forth information as of February 19, 2016 regarding NuStar Energy units and NuStar GP Holdings units beneficially owned (or deemed beneficially owned) by the directors, executive officers and all directors and executive officers of NuStar GP, LLC as a group. Unless otherwise indicated in the notes to the table, each of the named persons and members of the group has sole voting and investment power with respect to the units shown.
Name ofBeneficial Owner (1)
NuStar Energy Units Beneficially Owned (2)
Percentage of Outstanding
NuStar Energy Units (3)
NuStar GP Holdings Units Beneficially
Owned (4)
Percentage of Outstanding NuStar GP Holdings Units(5)
William E. Greehey (6) 2,951,190 3.79% 8,728,715 20.33%Bradley C. Barron 56,519 * 39,332 *J. Dan Bates (7) 31,143 * 2,000 *
Dan J. Hill (8) 23,185 * 27,000 *Robert J. Munch 2,469 * — *W. Grady Rosier (9) 24,856 * 20,000 *Mary Rose Brown 62,024 * 52,418 *Thomas R. Shoaf 27,125 * 16,562 *
Jorge A. del Alamo 14,703 * 2,880 *
Amy L. Perry (10) 9,335 * 2,973 *Karen M. Thompson 16,348 * 2,984 *All directors and executive officers as a group(11 people)
3,218,897 4.13% 8,894,864 20.72%
* Indicates that the percentage of beneficial ownership does not exceed 1% of the class.
(1) The business address for all beneficial owners listed above is 19003 IH-10 West, San Antonio, Texas 78257.
(2) This column includes restricted units issued under the long-term incentive plans of NuStar GP, LLC. Restricted units granted under NuStar GP, LLC’s long-term incentive plans are rights to receive NuStar Energy units upon vesting and, as such, may not be disposed of or voted until vested.
(3) As of February 19, 2016, 77,886,078 NuStar Energy units were issued and outstanding. There are no classes of equity securities of NuStar Energy outstanding other than the units.
(4) This column includes restricted units issued under the long-term incentive plan of NuStar GP Holdings. Restricted units granted under NuStar GP Holdings’ long-term incentive plan are rights to receive NuStar GP Holdings units upon vesting and, as such, may not be disposed of or voted until vested.
(5) As of February 19, 2016, 42,930,549 NuStar GP Holdings units were issued and outstanding. There are no classes of equity securities of NuStar GP Holdings outstanding other than the units.
(6) The number of NuStar GP Holdings units shown for Mr. Greehey includes 159,500 units owned indirectly by Mr. Greehey through a limited liability company.
(7) The number of NuStar Energy units shown for Mr. Bates includes 7,667 units owned indirectly by Mr. Bates through a trust.
(8) The number of NuStar Energy units shown for Mr. Hill includes 600 units owned indirectly by Mr. Hill through his spouse. Pursuant to Rule 13d-4 of the Securities Exchange Act of 1934, Mr. Hill disclaims beneficial ownership of 2,000 of the NuStar GP Holdings units reflected in the table above, which were purchased by a trust.
(9) The number of NuStar Energy units shown for Mr. Rosier includes 19,000 units owned indirectly by Mr. Rosier through a trust.

Table of Contents
144
(10) When Ms. Perry was divorced in September 2012, Ms. Perry agreed to give her ex-spouse a portion of any NuStar Energy units she would receive in the future upon vesting of restricted units that were granted to her prior to September 2012 and remained outstanding at the time of the divorce.
SECURITY OWNERSHIP OF CERTAIN BENEFICIAL OWNERS
The following table sets forth information as of December 31, 2015 regarding each entity known to us to be the beneficial owner of more than 5% of NuStar Energy’s outstanding units, and is based solely upon reports filed by such entities with the SEC.
Name and Address of Beneficial Owner Units Percentage of Units (4)
NuStar GP Holdings (1) 10,252,660 13.16%Oppenheimer Funds, Inc. (2) 6,180,686 7.94%ALPS Advisors, Inc. (3) 5,022,317 6.45%
(1) As of December 31, 2015, NuStar GP Holdings owns these NuStar Energy units through its wholly owned subsidiaries, NuStar GP, LLC and Riverwalk Holdings, LLC. NuStar GP Holdings controls voting and investment power over the units through these wholly owned subsidiaries. NuStar GP Holdings’ business address is 19003 IH-10 West, San Antonio, Texas 78257.
(2) As reported on a Schedule 13G/A filed on February 4, 2016, OppenheimerFunds, Inc. (OFI) is an investment adviser that may be deemed to beneficially own, and has shared voting and dispositive power with respect to, 6,180,686 units. The 6,180,686 units that OFI may be deemed to beneficially own include 4,940,776 units that Oppenheimer SteelPath MLP Income Fund (OSP), an investment company, may be deemed to beneficially own. OSP has shared voting and dispositive power with respect to the 4,940,776 units. OFI disclaims beneficial ownership of the units pursuant to Rule 13d-4 of the Securities Exchange Act of 1934. OFI’s business address is 2 World Financial Center, 225 Liberty Street, New York, New York 10281. OSP’s business address is 6803 S. Tucson Way, Centennial, Colorado 80112.
(3) As reported on a Schedule 13G/A filed on February 3, 2016, ALPS Advisors, Inc. (AAI) is an investment adviser that may be deemed to beneficially own, and has shared voting and dispositive power with respect to, 5,022,317 units. The 5,022,317 units that AAI may be deemed to beneficially own include 5,000,185 units that Alerian MLP ETF (Alerian), an investment company, may be deemed to beneficially own. Alerian has shared voting and dispositive power with respect to the 5,000,185 units. AAI disclaims beneficial ownership of the units pursuant to Rule 13d-4 of the Securities Exchange Act of 1934. The business address of AAI and Alerian is 1290 Broadway, Suite 1100, Denver, Colorado 80203.
(4) As of December 31, 2015, there were 77,886,078 NuStar Energy units issued and outstanding.

Table of Contents
145
EQUITY COMPENSATION PLAN INFORMATION
The following table sets forth information about NuStar GP, LLC’s equity compensation plans as of December 31, 2015, which are described in further detail in Note 19 of the Notes to Consolidated Financial Statements in Item 8. “Financial Statements and Supplementary Data.”
Plan categories
Number of securities to be issued upon exercise of outstanding unit options,
warrants and rights (3)
Weighted-averageexercise price of outstanding unit options, warrantsand rights ($) (4)
Number of securitiesremaining for
future issuanceunder equity
compensation plansEquity Compensation Plans approved by security holders (1)
706,491 — 1,260,634
Equity Compensation Plans not approved by security holders (2)
5,475 — —
(1) The information in this row relates to NuStar GP, LLC’s 2000 LTIP. See the “Compensation Discussion and Analysis” section of Item 11. “Executive Compensation” above for further details regarding the 2000 LTIP.
(2) The information in this row relates to NuStar GP, LLC’s 2003 Employee Unit Incentive Plan, which terminated on June 16, 2013.
(3) Historically, grants under NuStar GP, LLC’s long-term incentive plans have not diluted the interests of NuStar Energy unitholders because, upon the vesting of a restricted unit or performance unit or the exercise of a unit option granted under NuStar GP, LLC’s plan, NuStar GP, LLC has purchased NuStar Energy units on the open market to satisfy that vesting or exercise and no new NuStar Energy units were issued to satisfy these vestings. On January 28, 2016, NuStar Energy’s unitholders approved the amendment and restatement of the 2000 LTIP, which provides the ability to issue new NuStar Energy units to satisfy the vesting or exercise of awards under the plan. See the “Compensation Discussion and Analysis” section of Item 11. “Executive Compensation.”
(4) No value is included in this column because there were no unit options outstanding as of December 31, 2015 and because restricted units and performance units do not have an exercise price.
Table of Contents
146
ITEM 13. CERTAIN RELATIONSHIPS AND RELATED TRANSACTIONS AND DIRECTOR INDEPENDENCE
TRANSACTIONS WITH MANAGEMENT AND OTHERS
In January 2007, our Board adopted a written related person transaction policy that codifies our prior practice. For purposes of the policy, a related person transaction is one that is not available to all employees generally or involves $10,000 or more when aggregated with similar transactions. The policy requires that any related person transaction between NuStar Energy or NuStar GP, LLC and: (1) any vice president, Section 16 officer or director; (2) any unitholder owning greater than 5% of NuStar Energy, its controlled affiliates or NuStar GP Holdings; (3) any immediate family member of any officer or director; or (4) any entity controlled by any of (1), (2) or (3) (or in which any of (1), (2) or (3) owns a 5% or greater ownership interest) must be approved by the disinterested members of the Board. In addition, the policy requires that the officers and directors have an affirmative obligation to inform and provide updates to our Corporate Secretary regarding his or her immediate family members, as well as any entities in which he or she controls or owns 5% or more.
Please see “Potential Payments upon Termination or Change of Control” in Item 11 for a discussion of NuStar Energy’s change of control severance agreements with the NEOs.
On December 10, 2007, NuStar Logistics, L.P., our wholly owned subsidiary, entered into a non-exclusive Aircraft Time Sharing Agreement (the Time Share Agreement) with William E. Greehey, Chairman of our Board. The Time Share Agreement provides that NuStar Logistics, L.P. will sublease the aircraft to Mr. Greehey on an “as needed and as available” basis, and will provide a fully qualified flight crew for all of Mr. Greehey’s flights. Mr. Greehey will pay NuStar Logistics, L.P. an amount equal to the maximum amount of expense reimbursement permitted in accordance with Section 91.501(d) of the Aeronautics Regulations of the Federal Aviation Administration and the Department of Transportation, which expenses include and are limited to: fuel oil, lubricants and other additives; travel expenses of the crew, including food, lodging and ground transportation; hangar and tie down costs away from the aircraft’s base of operation; insurance obtained for the specific flight; landing fees, airport taxes and similar assessments; customs, foreign permit and similar fees directly related to the flight; in-flight food and beverages; passenger ground transportation; flight planning and weather contract services; and an additional charge equal to 100% of the costs of the fuel oil, lubricants and other additives. The Time Share Agreement had an initial term of two years, and automatically renews for one-year terms until terminated by either party. The Time Share Agreement was approved by the disinterested members of the Board on December 5, 2007. The Time Share Agreement was amended, as of September 4, 2009, to reflect the addition of another aircraft.
On April 24, 2008, the independent directors of NuStar GP, LLC approved the adoption of a Services Agreement, effective January 1, 2008, between NuStar GP, LLC and NuStar Energy (the Services Agreement). Pursuant to the Services Agreement, NuStar GP, LLC historically has furnished all services necessary for the conduct of the business of NuStar Energy, and NuStar Energy has reimbursed NuStar GP, LLC for all payroll and related benefit costs, including pension and unit-based compensation costs, other than the expenses allocated to NuStar GP Holdings. The expenses allocated to NuStar GP Holdings under the Services Agreement equaled to $1.1 million (as adjusted), plus 1.0% of NuStar GP, LLC’s domestic employee bonus and unit compensation expense for the applicable fiscal year, subject to adjustment (1) by an annual amount equal to NuStar GP, LLC’s annual merit increase percentage for the most recently completed contract year and (2) for changed levels of services due to expansion of operations through, among other things, expansion of operations, acquisitions or the construction of new businesses or assets. For fiscal year 2015, the expenses allocated to NuStar GP Holdings were $1.5 million. On March 1, 2016, NuStar GP, LLC intends to transfer and assign to NuStar Services, a wholly owned subsidiary of NuStar Energy, employment of all of NuStar GP, LLC’s employees. Our executive officers will continue to serve as officers of NuStar GP Holdings and NuStar GP, LLC, and also will serve as officers of NuStar Services and other NuStar Energy subsidiaries. In connection with the transfer and assignment, we intend to amend and restate the Services Agreement (the Amended and Restated Services Agreement) such that, beginning March 1, 2016, NuStar GP Holdings and NuStar Energy will receive all management and administrative services from NuStar Services. NuStar Energy will reimburse NuStar Services for all services provided to NuStar Energy, including payroll and benefit costs, as well as NuStar Energy unit-based compensation costs. NuStar GP Holdings will pay NuStar Services an administrative services fee of $1.0 million per year, subject to adjustment (1) by an annual amount equal to NuStar Services’ annual merit increase percentage for the most recently completed fiscal year and (2) for changed levels of services due to expansion of operations through acquisitions, construction of new businesses or assets or otherwise. Beginning March 1, 2016, NuStar GP Holdings will no longer pay 1.0% of NuStar GP, LLC’s domestic bonus and unit compensation expenses. Instead, NuStar GP Holdings will retain the expense associated with any NuStar GP Holdings common unit awards or other compensation that it provides to its officers.

Table of Contents
147
John D. Greehey, a NuStar GP, LLC employee, is the son of Mr. Greehey. As such, he is deemed to be a “related person” under Item 404(a) of the SEC’s Regulation S-K. Mr. J. Greehey is a Vice President of certain subsidiaries of NuStar Energy. In 2015, Mr. J. Greehey did not attend any Board or Committee meetings. The aggregate value of compensation paid by NuStar GP, LLC to Mr. J. Greehey in 2015 was less than $500,000. There were no material differences between the compensation paid to Mr. J. Greehey and the compensation paid to any other employees who hold analogous positions.
Garrett Brown, a NuStar GP, LLC employee, is the son of Mary Rose Brown, Executive Vice President and Chief Administrative Officer. As such, he is deemed to be a “related person” under Item 404(a) of the SEC’s Regulation S-K. Mr. Brown works in the Corporate Communications department, as a Public Affairs Specialist. In 2015, Mr. Brown did not attend any Board or Committee meetings. The aggregate value of compensation paid by NuStar GP, LLC to Mr. Brown in 2015 was less than $500,000. There were no material differences between the compensation paid to Mr. Brown and the compensation paid to any other employees who hold analogous positions.
RIGHTS OF NUSTAR GP HOLDINGS
Due to its ownership of NuStar GP, LLC and Riverwalk Holdings, LLC, as of December 31, 2015, NuStar GP Holdings indirectly owned:
• the 2% general partner interest in NuStar Energy, through its indirect 100% ownership interest in Riverwalk Logistics, L.P.;
• 100% of the incentive distribution rights issued by us, which entitle NuStar GP Holdings to receive increasing percentages of the cash we distribute, currently at the maximum percentage of 23%; and
• 10,252,660 NuStar Energy units representing 13.2% of the issued and outstanding NuStar Energy common units.
Certain of our officers also are officers of NuStar GP Holdings. Our Chairman, Mr. Greehey, also is the Chairman of Board and, as of December 31, 2015, beneficially owned 20.1% of, NuStar GP Holdings. NuStar GP Holdings appoints NuStar GP, LLC’s directors. NuStar GP, LLC’s board is responsible for overseeing NuStar GP, LLC’s role as the owner of the general partner of NuStar Energy. NuStar GP Holdings must also approve matters that have or would have reasonably expected to have a material effect on NuStar GP Holdings’ interests as one of our major unitholders.
NuStar Energy’s partnership agreement requires that NuStar GP, LLC maintain a Conflicts Committee, composed entirely of independent directors, to review and resolve certain potential conflicts of interest between Riverwalk Logistics, L.P. and its affiliates, on the one hand, and NuStar Energy, on the other.
DIRECTOR INDEPENDENCE
Our business is managed under the direction of the Board of NuStar GP, LLC, the general partner of Riverwalk Logistics, L.P., the general partner of NuStar Energy. The Board conducts its business through meetings of the Board and its committees. The Board has standing Audit, Compensation and Nominating/Governance & Conflicts Committees. Each committee has a written charter. During 2015, the Board held five meetings, the Audit Committee held eight meetings, the Compensation Committee held four meetings and the Nominating/Governance & Conflicts Committee held three meetings. No member of the Board attended less than 75% of the meetings of the Board and committees during the period in which he was a member during 2015.
Independent Directors
The Board has one member of management, Mr. Barron, President and CEO, and five non-management directors. As a limited partnership, NuStar Energy is not required to have a majority of independent directors. However, the Board has determined that four of five of its current non-management directors meet the independence requirements of the NYSE listing standards as set forth in the NYSE Listed Company Manual. The current independent directors are: Mr. Bates, Mr. Hill, Mr. Munch and Mr. Rosier. As disclosed in Item 11 above, Mr. Patton served as a director until his retirement from the Board in April 2015, and the Board previously determined that Mr. Patton also met such independence requirements during his term as a director.
Mr. Greehey, Chairman of the Board, also serves as the Chairman of the NuStar GP Holdings board of directors and, as of December 31, 2015, beneficially owned 20.1% of the common units of NuStar GP Holdings. Mr. Greehey is not an independent director under the NYSE’s listing standards.
Mr. Barron has been President and CEO of NuStar GP, LLC since January 2014. Mr. Barron also serves as President and CEO of NuStar GP Holdings. As a member of management, Mr. Barron is not an independent director under the NYSE’s listing standards.

Table of Contents
148
The Audit, Compensation and Nominating/Governance & Conflicts Committees of the Board are each composed entirely of directors who meet the independence requirements of the NYSE listing standards. Each member of the Audit Committee also meets the additional independence standards for Audit Committee members set forth in the regulations of the SEC. For further information about the committees, see also Item 10 and Item 11 above.
Independence Determinations
Under the NYSE’s listing standards, no director qualifies as independent unless the Board affirmatively determines that the director has no material relationship with NuStar Energy. Based upon information requested annually from and provided by each director concerning their background, employment and affiliations, including commercial, industrial, banking, consulting, legal, accounting, charitable and familial relationships, the Board has determined that, other than being a director of NuStar GP, LLC, a unitholder of NuStar Energy and/or a unitholder of NuStar GP Holdings, each of the independent directors named above has either no relationship with NuStar Energy, either directly or as a partner, equityholder or officer of an organization that has a relationship with NuStar Energy, or has only immaterial relationships with NuStar Energy, and is therefore independent under the NYSE’s listing standards.
As provided for under the NYSE listing standards, the Board has adopted categorical standards or guidelines to assist the Board in making its independence determinations with respect to each director. Under the NYSE listing standards, immaterial relationships that fall within the guidelines are not required to be disclosed in this Annual Report on Form 10-K.
A relationship falls within the guidelines adopted by the Board if it:
• is not a relationship that would preclude a determination of independence under Section 303A.02(b) of the NYSE Listed Company Manual;
• consists of charitable contributions by NuStar Energy to an organization where a director is an executive officer and does not exceed the greater of $1 million or 2% of the organization’s gross revenue in any of the last three years;
• consists of charitable contributions by NuStar Energy to any organization with which a director, or any member of a director’s immediate family, is affiliated as an officer, director or trustee pursuant to a matching gift program of NuStar Energy and made on terms applicable to employees and directors generally, or is in amounts that do not exceed $250,000 per year; and
• is not required to be disclosed in this Annual Report on Form 10-K.
Our Corporate Governance Guidelines contain the director qualification standards, including the guidelines listed above, and are available on NuStar Energy’s website at www.nustarenergy.com (in the “Investors” section) or are available in print upon request to NuStar GP, LLC’s Corporate Secretary at the address indicated on the cover page of this Annual Report on Form 10-K or [email protected].
Presiding Director/Meetings of Non-Management Directors
The Board has designated Mr. Hill to serve as the Presiding Director for meetings of the non-management Board members outside the presence of management.
Communications with the Board, Non-Management Directors or Presiding Director
Unitholders and other interested parties may communicate with the Board, the non-management directors or the Presiding Director by sending a written communication in an envelope addressed to “Board of Directors,” “Non-Management Directors,” or “Presiding Director” in care of NuStar GP, LLC’s Corporate Secretary at the address indicated on the cover page of this Annual Report on Form 10-K or [email protected].
Availability of Governance Documents
NuStar Energy has posted its Corporate Governance Guidelines, Code of Business Conduct and Ethics, Code of Ethics of Senior Financial Officers and the Charters of the Audit Committee, Compensation Committee and Nominating/Governance & Conflicts Committee on NuStar Energy’s website at www.nustarenergy.com (in the “Investors” section). NuStar Energy’s governance documents are available in print to any unitholder of record who makes a written request to NuStar Energy. Requests must be directed to NuStar GP, LLC’s Corporate Secretary at the address indicated on the cover page of this Annual Report on Form 10-K or [email protected].

Table of Contents
149
ITEM 14. PRINCIPAL ACCOUNTING FEES AND SERVICES
KPMG FEES
The aggregate fees for professional services rendered to us by KPMG for the years ended December 31, 2015 and 2014 were:
Category of Service 2015 2014Audit fees (1) $ 2,770,868 $ 2,433,000Audit-related fees (2) 3,243 —
Tax fees (3) — 8,000All other fees — —
Total $ 2,774,111 $ 2,441,000
(1) Audit fees for 2015 and 2014 were for professional services rendered by KPMG in connection with the audits of our annual financial statements for the years ended December 31, 2015 and 2014, respectively, included in our Annual Reports on Form 10-K, reviews of our interim financial statements included in our Quarterly Reports on Form 10-Q, the audit of the effectiveness of our internal control over financial reporting as of December 31, 2015 and 2014, respectively, and related services that that are normally provided by the principal auditor (e.g., comfort letters and assistance with review of documents filed with the SEC).
(2) Audit-related fees for 2015 were for assurance and related services rendered by KPMG that are reasonably related to the performance of the audit or review of our financial statements and are not reported under “Audit fees.”
(3) Tax fees for 2014 were for professional services rendered by KPMG for tax compliance, tax advice and tax planning.
AUDIT COMMITTEE PRE-APPROVAL POLICY
The Audit Committee has adopted a pre-approval policy to address the approval of services rendered to us by our independent auditors, which is filed herewith as Exhibit 99.01.
None of the services (described above) for 2015 or 2014 provided by KPMG were approved by the Audit Committee pursuant to the pre-approval waiver contained in paragraph (c)(7)(i)(C) of Rule 2-01 of Regulation S-X.

Table of Contents
150
PART IV
ITEM 15. EXHIBITS AND FINANCIAL STATEMENT SCHEDULES
(a) (1) Financial Statements. The following consolidated financial statements of NuStar Energy L.P. and its subsidiaries are included in Part II, Item 8 of this Form 10-K:Management’s Report on Internal Control over Financial ReportingReports of independent registered public accounting firm (KPMG LLP)Consolidated Balance Sheets as of December 31, 2015 and 2014Consolidated Statements of Income for the Years Ended December 31, 2015, 2014 and 2013 Consolidated Statements of Comprehensive Income for the Years Ended December 31, 2015, 2014 and 2013Consolidated Statements of Cash Flows for the Years Ended December 31, 2015, 2014 and 2013Consolidated Statements of Partners’ Equity for the Years Ended December 31, 2015, 2014 and 2013Notes to Consolidated Financial Statements
(2) Financial Statement Schedules and Other Financial Information. No financial statement schedules are submitted because either they are inapplicable or because the required information is included in the consolidated financial statements or notes thereto.
(3) ExhibitsFiled as part of this Form 10-K are the following:
ExhibitNumber
Description Incorporated by Referenceto the Following Document
3.01 Amended and Restated Certificate of LimitedPartnership of Shamrock Logistics, L.P., effectiveJanuary 1, 2002
NuStar Energy L.P.’s Annual Report on Form 10-Kfor year ended December 31, 2001 (File No.001-16417), Exhibit 3.3
3.02 Amendment to Certificate of Limited Partnershipof Valero L.P., dated March 21, 2007 and effectiveApril 1, 2007
NuStar Energy L.P.’s Current Report on Form 8-K,filed March 27, 2007 (File No. 001-16417), Exhibit3.01
3.03 Third Amended and Restated Agreement ofLimited Partnership of Valero L.P., dated as ofMarch 18, 2003
NuStar Energy L.P.’s Quarterly Report on Form 10-Q for the quarter ended March 31, 2003 (File No.001-16417), Exhibit 3.1
3.04 Amendment No. 1 to Third Amended and RestatedAgreement of Limited Partnership of Valero L.P.,dated as of March 11, 2004
NuStar Energy L.P.’s Annual Report on Form 10-Kfor year ended December 31, 2003 (File No.001-16417), Exhibit 4.3
3.05 Amendment No. 2 to Third Amended and RestatedAgreement of Limited Partnership of Valero L.P.,dated as of July 1, 2005
NuStar Energy L.P.’s Quarterly Report on Form 10-Q for the quarter ended June 30, 2005 (File No.001-16417), Exhibit 4.01
3.06 Amendment No. 3 to Third Amended and RestatedAgreement of Limited Partnership of NuStarEnergy L.P., dated as of April 10, 2008
NuStar Energy L.P.’s Current Report on Form 8-Kfiled April 15, 2008 (File No. 001-16417), Exhibit3.1
3.07 Amended and Restated Certificate of LimitedPartnership of Shamrock Logistics Operations,L.P., dated as of January 7, 2002 and effectiveJanuary 8, 2002
NuStar Energy L.P.’s Annual Report on Form 10-Kfor year ended December 31, 2001 (File No.001-16417), Exhibit 3.8
3.08 Certificate of Amendment to Certificate of LimitedPartnership of Valero Logistics Operations, L.P.,dated March 21, 2007 and effective April 1, 2007
NuStar Energy L.P.’s Quarterly Report on Form 10-Q for the quarter ended March 31, 2007 (File No.001-16417), Exhibit 3.03
3.09 Certificate of Amendment to Certificate of LimitedPartnership of NuStar Logistics, L.P., dated andeffective as of March 18, 2014
NuStar Energy L.P.’s Annual Report on Form 10-Kfor year ended December 31, 2014 (File No.001-16417), Exhibit 3.09
3.10 Second Amended and Restated Agreement ofLimited Partnership of Shamrock LogisticsOperations, L.P., dated as of April 16, 2001
NuStar Energy L.P.’s Annual Report on Form 10-Kfor year ended December 31, 2001 (File No.001-16417), Exhibit 3.9
3.11 First Amendment to Second Amended and RestatedAgreement of Limited Partnership of ShamrockLogistics Operations, L.P., effective as of April 16,2001
NuStar Energy L.P.’s Quarterly Report on Form 10-Q for the quarter ended June 30, 2001 (File No.001-16417), Exhibit 4.1

Table of Contents
151
3.12 Second Amendment to Second Amended andRestated Agreement of Limited Partnership ofShamrock Logistics Operations, L.P., dated as ofJanuary 7, 2002
NuStar Energy L.P.’s Annual Report on Form 10-Kfor year ended December 31, 2001 (File No.001-16417), Exhibit 3.10
3.13 Certificate of Limited Partnership of RiverwalkLogistics, L.P., dated as of June 5, 2000
NuStar Energy L.P.’s Registration Statement onForm S-1 filed August 14, 2000 (File No.333-43668), Exhibit 3.7
3.14 First Amended and Restated Limited PartnershipAgreement of Riverwalk Logistics, L.P., dated as ofApril 16, 2001
NuStar Energy L.P.’s Annual Report on Form 10-Kfor year ended December 31, 2001 (File No.001-16417), Exhibit 3.16
3.15 Certificate of Formation of Shamrock Logistics GP,LLC, dated as of December 7, 1999
NuStar Energy L.P.’s Registration Statement onForm S-1 filed August 14, 2000 (File No.333-43668), Exhibit 3.9
3.16 Certificate of Amendment to Certificate ofFormation of Shamrock Logistics GP, LLC, datedas of December 31, 2001
NuStar Energy L.P.’s Annual Report on Form 10-Kfor year ended December 31, 2001 (File No.001-16417), Exhibit 3.14
3.17 Certificate of Amendment to Certificate ofFormation of Valero GP, LLC, dated March 21,2007 and effective April 1, 2007
NuStar Energy L.P.’s Quarterly Report on Form 10-Q for the quarter ended March 31, 2007 (File No.001-16417), Exhibit 3.02
3.18 First Amended and Restated Limited LiabilityCompany Agreement of Shamrock Logistics GP,LLC, dated as of June 5, 2000
NuStar Energy L.P.’s Amendment No. 5 toRegistration Statement on Form S-1 filed March29, 2001 (File No. 333-43668), Exhibit 3.10
3.19 First Amendment to First Amended and RestatedLimited Liability Company Agreement ofShamrock Logistics GP, LLC, effective as ofDecember 31, 2001
NuStar Energy L.P.’s Annual Report on Form 10-Kfor year ended December 31, 2001 (File No.001-16417), Exhibit 3.15
3.20 Second Amendment to First Amended and RestatedLimited Liability Company Agreement of ValeroGP, LLC, effective as of June 1, 2006
NuStar Energy L.P.’s Annual Report on Form 10-Kfor year ended December 31, 2014 (File No.001-16417), Exhibit 3.20
4.01 Indenture, dated as of July 15, 2002, among ValeroLogistics Operations, L.P., as Issuer, Valero L.P., asGuarantor, and The Bank of New York, as Trustee,relating to Senior Debt Securities
NuStar Energy L.P.’s Current Report on Form 8-Kfiled July 15, 2002 (File No. 001-16417),Exhibit 4.1
4.02 First Supplemental Indenture, dated as of July 15,2002, to Indenture dated as of July 15, 2002, ineach case among Valero Logistics Operations, L.P.,as Issuer, Valero L.P., as Guarantor, and The Bankof New York, as Trustee, relating to 6 7/8% SeniorNotes due 2012
NuStar Energy L.P.’s Current Report on Form 8-Kfiled July 15, 2002 (File No. 001-16417), Exhibit4.2
4.03 Second Supplemental Indenture, dated as ofMarch 18, 2003, to Indenture dated as ofJuly 15, 2002, as amended and supplemented by aFirst Supplemental Indenture thereto dated as ofJuly 15, 2002, in each case among Valero LogisticsOperations, L.P., as Issuer, Valero L.P., asGuarantor, and The Bank of New York, as Trustee(including, form of global note representing$250,000,000 6.05% Senior Notes due 2013)
NuStar Energy L.P.’s Quarterly Report on Form 10-Q for the quarter ended March 31, 2003 (File No.001-16417), Exhibit 4.1
4.04 Third Supplemental Indenture, dated as of July 1,2005, to Indenture dated as of July 15, 2002, asamended and supplemented, among ValeroLogistics Operations, L.P., Valero L.P., Kaneb PipeLine Operating Partnership, L.P., and The Bank ofNew York Trust Company, N.A.
NuStar Energy L.P.’s Quarterly Report on Form 10-Q for the quarter ended June 30, 2005 (File No.001-16417), Exhibit 4.02

Table of Contents
152
4.05 Instrument of Resignation, Appointment andAcceptance, dated March 31, 2008, among NuStarLogistics, L.P., NuStar Energy L.P., Kaneb PipelineOperating Partnership, L.P., The Bank of New YorkTrust Company N.A., and Wells Fargo Bank,National Association
NuStar Energy L.P.’s Annual Report on Form 10-Kfor year ended December 31, 2008 (File No.001-16417), Exhibit 4.05
4.06 Fourth Supplemental Indenture, dated as of April 4,2008, to Indenture dated as of July 15, 2002,among NuStar Logistics L.P., as Issuer, NuStarEnergy L.P., as Guarantor, NuStar PipelineOperating Partnership L.P., as Affiliate Guarantor,and Wells Fargo Bank, National Association, asSuccessor Trustee
NuStar Energy L.P.’s Current Report on Form 8-Kfiled April 4, 2008 (File No. 001-16417),Exhibit 4.2
4.07 Fifth Supplemental Indenture, dated as of August12, 2010, to Indenture dated as of July 15, 2002,among NuStar Logistics, L.P., as Issuer, NuStarEnergy L.P., as Guarantor, NuStar PipelineOperating Partnership L.P., as Affiliate Guarantorand Wells Fargo Bank, National Association, asSuccessor Trustee
NuStar Energy L.P.’s Current Report on Form 8-Kfiled August 16, 2010 (File No. 001-16417),Exhibit 4.3
4.08 Sixth Supplemental Indenture, dated as of February2, 2012, to Indenture dated as of July 15, 2002,among NuStar Logistics, L.P., as Issuer, NuStarEnergy L.P., as Guarantor, NuStar PipelineOperating Partnership L.P., as Affiliate Guarantorand Wells Fargo Bank, National Association, asSuccessor Trustee
NuStar Energy L.P.’s Current Report on Form 8-Kfiled February 7, 2012 (File No. 001-16417),Exhibit 4.3
4.09 Seventh Supplemental Indenture, dated as ofAugust 19, 2013, among NuStar Logistics, L.P., asIssuer, NuStar Energy L.P., as Guarantor, NuStarPipeline Operating Partnership L.P., as AffiliateGuarantor, and Wells Fargo Bank, NationalAssociation, as Successor Trustee
NuStar Energy L.P.’s Current Report on Form 8-Kfiled August 23, 2013 (File No. 001-16417),Exhibit 4.3
4.10 Indenture, dated as of January 22, 2013, amongNuStar Logistics, L.P., as Issuer, NuStar EnergyL.P., as Guarantor, and Wells Fargo Bank, NationalAssociation, as Trustee, relating to SubordinatedDebt Securities
NuStar Energy L.P.’s Current Report on Form 8-Kfiled January 22, 2013 (File No. 001-16417),Exhibit 4.1
4.11 First Supplemental Indenture, dated as of January22, 2013, among NuStar Logistics, L.P., as Issuer,NuStar Energy L.P., as Parent Guarantor, NuStarPipeline Operating Partnership L.P., as AffiliateGuarantor, and Wells Fargo Bank, NationalAssociation, as Trustee
NuStar Energy L.P.’s Current Report on Form 8-Kfiled January 22, 2013 (File No. 001-16417),Exhibit 4.2
10.01 5-Year Revolving Credit Agreement, dated as ofMay 2, 2012, among NuStar Logistics, L.P., NuStarEnergy L.P., the Lenders party thereto andJPMorgan Chase Bank, N.A., as AdministrativeAgent, Suntrust Bank, Mizuho Corporate Bank,Ltd., as Co-Syndication Agents, and Wells FargoBank, National Association, Barclays Bank PLC, asCo-Documentation Agents, and J.P. MorganSecurities Inc., Suntrust Robinson Humphrey, Inc.,Mizuho Corporate Bank, Ltd., Wells FargoSecurities, LLC and Barclays Bank PLC as JointBookrunners and Joint Lead Arrangers
NuStar Energy L.P.’s Current Report on Form 8-Kfiled May 8, 2012 (File No. 001-16417), Exhibit10.01
10.02 First Amendment to 5-Year Revolving CreditAgreement, dated as of June 29, 2012, amongNuStar Logistics, L.P., NuStar Energy L.P.,JPMorgan Chase Bank, N.A., as AdministrativeAgent, and the Lenders party thereto
NuStar Energy L.P.’s Current Report on Form 8-Kfiled July 6, 2012 (File No. 001-16417), Exhibit10.01

Table of Contents
153
10.03 Second Amendment to 5-Year Revolving CreditAgreement, dated as of November 30, 2012, amongNuStar Logistics, L.P., NuStar Energy L.P.,JPMorgan Chase Bank, N.A., as AdministrativeAgent, and the Lenders party thereto
NuStar Energy L.P.’s Annual Report on Form 10-Kfor year ended December 31, 2012 (File No.001-16417), Exhibit 10.03
10.04 Third Amendment to 5-Year Revolving CreditAgreement, dated as of January 11, 2013, amongNuStar Logistics, L.P., NuStar Energy L.P.,JPMorgan Chase Bank, N.A., as AdministrativeAgent, and the Lenders party thereto
NuStar Energy L.P.’s Annual Report on Form 10-Kfor year ended December 31, 2012 (File No.001-16417), Exhibit 10.04
10.05 Fourth Amendment to 5-Year Revolving CreditAgreement, dated as of December 4, 2013, amongNuStar Logistics, L.P., NuStar Energy L.P.,JPMorgan Chase Bank, N.A., as AdministrativeAgent, and the Lenders Party thereto
NuStar Energy L.P.’s Annual Report on Form 10-Kfor year ended December 31, 2013 (File No.001-16417), Exhibit 10.05
10.06 Amended and Restated 5-Year Revolving CreditAgreement, dated as of October 29, 2014, amongNuStar Logistics, L.P., NuStar Energy L.P., theLenders party thereto and JPMorgan Chase Bank,N.A., as Administrative Agent, SunTrust Bank andMizuho Bank, Ltd., as Co-Syndication Agents,Wells Fargo Bank, National Association and PNCBank, National Association, as Co-DocumentationAgents, and J.P. Morgan Securities LLC, SunTrustRobinson Humphrey, Inc., Mizuho Bank, Ltd.,Wells Fargo Securities, LLC and PNC CapitalMarkets LLC, as Joint Bookrunners and Joint LeadArrangers
NuStar Energy L.P.’s Current Report on Form 8-Kfiled October 31, 2014 (File No. 001-16417),Exhibit 10.1
10.07 First Amendment to Amended and Restated 5-YearRevolving Credit Agreement, dated as of March 19,2015, among NuStar Logistics, L.P., NuStar EnergyL.P., JPMorgan Chase Bank, N.A., asAdministrative Agent, and the Lenders partythereto
NuStar Energy L.P.’s Quarterly Report on Form 10-Q for the quarter ended June 30, 2015 (File No. 001-16417), Exhibit 10.01
10.08 Lease Agreement Between Parish of St. James,State of Louisiana and NuStar Logistics, L.P. datedas of July 1, 2010
NuStar Energy L.P.’s Current Report on Form 8-Kfiled July 21, 2010 (File No. 001-16417), Exhibit10.01
10.09 Letter of Credit Agreement dated June 5, 2012among NuStar Logistics, L.P., NuStar Energy L.P.,the Lenders party thereto and Mizuho CorporateBank, Ltd., as Issuing Bank and AdministrativeAgent
NuStar Energy L.P.’s Current Report on Form 8-Kfiled June 12, 2012 (File No. 001-16417), Exhibit10.01
10.10 First Amendment to Letter of Credit Agreement,dated as of June 29, 2012, among NuStar Logistics,L.P., NuStar Energy L.P., the Lenders party theretoand Mizuho Corporate Bank, Ltd., as Issuing Bankand Administrative Agent
NuStar Energy L.P.’s Current Report on Form 8-Kfiled July 6, 2012 (File No. 001-16417), Exhibit10.02
10.11 Second Amendment to Letter of Credit Agreement,dated as of January 17, 2013, among NuStarLogistics, L.P., NuStar Energy L.P., the Lendersparty thereto and Mizuho Corporate Bank, Ltd., asIssuing Bank and Administrative Agent
NuStar Energy L.P.’s Annual Report on Form 10-K for year ended December 31, 2014 (File No. 001-16417), Exhibit 10.10
10.12 Third Amendment to Letter of Credit Agreement,dated as of March 8, 2013, among NuStarLogistics, L.P., NuStar Energy L.P., the Lendersparty thereto and Mizuho Corporate Bank, Ltd., asIssuing Bank and Administrative Agent
NuStar Energy L.P.’s Annual Report on Form 10-K for year ended December 31, 2014 (File No. 001-16417), Exhibit 10.11

Table of Contents
154
10.13 Fourth Amendment to Letter of Credit Agreement,dated as of April 19, 2013, among NuStarLogistics, L.P., NuStar Energy L.P., the Lendersparty thereto and Mizuho Corporate Bank, Ltd., asIssuing Bank and Administrative Agent
NuStar Energy L.P.’s Annual Report on Form 10-K for year ended December 31, 2014 (File No. 001-16417), Exhibit 10.12
10.14 Fifth Amendment to Letter of Credit Agreement,dated as of April 23, 2014, among NuStarLogistics, L.P., NuStar Energy L.P., the Lendersparty thereto and Mizuho Bank, Ltd., as IssuingBank and Administrative Agent
NuStar Energy L.P.’s Annual Report on Form 10-K for year ended December 31, 2014 (File No. 001-16417), Exhibit 10.13
10.15 Sixth Amendment to Letter of Credit Agreement,dated as of November 3, 2014, among NuStarLogistics, L.P., NuStar Energy L.P., the Lendersparty thereto and Mizuho Bank, Ltd., as IssuingBank and Administrative Agent
NuStar Energy L.P.’s Current Report on Form 8-Kfiled November 6, 2014 (File No. 001-16417),Exhibit 10.1
10.16 Seventh Amendment to Letter of Credit Agreement,dated as of April 30, 2015, among NuStarLogistics, L.P., NuStar Energy L.P., the Lendersparty thereto and Mizuho Bank, Ltd., as IssuingBank and Administrative Agent
NuStar Energy L.P.’s Quarterly Report on Form 10-Q for the quarter ended June 30, 2015 (File No. 001-16417), Exhibit 10.02
10.17 Lease Agreement between Parish of St. James,State of Louisiana and NuStar Logistics, L.P. datedas of December 1, 2010
NuStar Energy L.P.’s Current Report on Form 8-Kfiled December 30, 2010 (File No. 001-16417),Exhibit 10.01
10.18 Letter of Credit Agreement dated as of September3, 2014 among NuStar Logistics, L.P., NuStarEnergy L.P., the Lenders party thereto and TheBank of Tokyo-Mitsubishi UFJ, Ltd., as IssuingBank and Administrative Agent
NuStar Energy L.P.’s Current Report on Form 8-Kfiled September 9, 2014 (File No. 001-16417),Exhibit 10.01
10.19 Amendment No. 1 to Letter of Credit Agreementand Subsidiary Guaranty Agreement dated as ofNovember 3, 2014 among NuStar Logistics, L.P.,NuStar Energy L.P., the Lenders party thereto andThe Bank of Tokyo-Mitsubishi UFJ, Ltd., asIssuing Bank and Administrative Agent
NuStar Energy L.P.’s Current Report on Form 8-Kfiled November 6, 2014 (File No. 001-16417),Exhibit 10.3
10.20 Amendment No. 2 to Letter of Credit Agreementand Subsidiary Guaranty Agreement dated as ofAugust 19, 2015 among NuStar Logistics, L.P.,NuStar Energy L.P., the Lenders party thereto andThe Bank of Tokyo-Mitsubishi UFJ, Ltd., asIssuing Bank and Administrative Agent
NuStar Energy L.P.’s Quarterly Report on Form 10-Q for the quarter ended September 30, 2015 (File No. 001-16417), Exhibit 10.01
10.21 Lease Agreement between Parish of St. James,State of Louisiana and NuStar Logistics, L.P. datedas of August 1, 2011
NuStar Energy L.P.’s Current Report on Form 8-Kfiled August 10, 2011 (File No. 001-16417),Exhibit 10.01
10.22 Letter of Credit Agreement dated as of June 5, 2013among NuStar Logistics, L.P., NuStar Energy L.P.,the Lenders party thereto and The Bank of NovaScotia, as Issuing Bank and Administrative Agent
NuStar Energy L.P.’s Current Report on Form 8-Kfiled June 11, 2013 (File No. 001-16417), Exhibit10.01
10.23 Amendment No. 1 to Letter of Credit Agreementand Subsidiary Guaranty Agreement dated as ofNovember 3, 2014 among NuStar Logistics, L.P.,NuStar Energy L.P., the Lenders party thereto andThe Bank of Nova Scotia, as Issuing Bank andAdministrative Agent
NuStar Energy L.P.’s Current Report on Form 8-Kfiled November 6, 2014 (File No. 001-16417),Exhibit 10.2
10.24 Purchase and Sale Agreement, dated as of June 15,2015, among NuStar Energy Services, Inc., NuStarLogistics, L.P., NuStar Pipeline OperatingPartnership L.P. and NuStar Supply & TradingLLC, as Originators, NuStar Energy L.P., asServicer, and NuStar Finance LLC, as Buyer
NuStar Energy L.P.'s Current Report on Form 8-K filed June 19, 2015 (File No. 001-16417), Exhibit 10.1

Table of Contents
155
10.25 Receivables Financing Agreement, dated as of June15, 2015, by and among NuStar Finance LLC, asBorrower, the persons from time to time partythereto as Lenders and Group Agents, PNC Bank,National Association, as Administrative Agent, andNuStar Energy L.P., as initial Servicer
NuStar Energy L.P.'s Current Report on Form 8-Kfiled June 19, 2015 (File No. 001-16417), Exhibit10.2
10.26 Omnibus Amendment, dated as of January 15,2016, which is the First Amendment to thePurchase and Sale Agreement referenced above andthe First Amendment to the Receivables FinancingAgreement referenced above among the respectiveparties thereto
*
+10.27 NuStar GP, LLC Amended and Restated 2003Employee Unit Incentive Plan, amended andrestated as of April 1, 2007
NuStar Energy L.P.’s Quarterly Report on Form 10-Q for the quarter ended June 30, 2007 (File No.001-16417), Exhibit 10.03
+10.28 Form of Unit Option Agreement under the NuStarGP, LLC Amended and Restated 2003 EmployeeUnit Incentive Plan, as amended
NuStar Energy L.P.’s Annual Report on Form 10-Kfor year ended December 31, 2006 (File No.001-16417), Exhibit 10.11
+10.29 NuStar GP, LLC Amended and Restated 2002 UnitOption Plan, amended and restated as of April 1,2007
NuStar Energy L.P.’s Quarterly Report on Form 10-Q for the quarter ended June 30, 2007 (File No.001-16417), Exhibit 10.02
+10.30 NuStar GP, LLC Third Amended and Restated2000 Long-Term Incentive Plan, amended andrestated as of May 1, 2011
NuStar Energy L.P.’s Current Report on Form 8-Kfiled May 10, 2011 (File No. 001-16417), Exhibit10.01
+10.31 NuStar GP, LLC Fourth Amended and Restated2000 Long-Term Incentive Plan, amended andrestated as of January 1, 2014
NuStar Energy L.P.’s Annual Report on Form 10-Kfor year ended December 31, 2013 (File No.001-16417), Exhibit 10.10
+10.32 NuStar GP, LLC Fifth Amended and Restated 2000Long-Term Incentive Plan, amended and restated asof January 28, 2016
NuStar Energy L.P.’s Proxy Statement on Schedule14A filed December 17, 2015 (File No.001-16417), Appendix A
+10.33 Form of Restricted Unit Award Agreement underthe NuStar GP, LLC Second Amended and Restated2000 Long-Term Incentive Plan (substantially thesame for 2008 and 2009 awards)
NuStar Energy L.P.’s Current Report on Form 8-Kfiled November 10, 2008 (File No. 001-16417),Exhibit 10.03
+10.34 Form of Unit Option Award Agreement under theNuStar GP, LLC Second Amended and Restated2000 Long-Term Incentive Plan
NuStar Energy L.P.’s Current Report on Form 8-Kfiled November 3, 2006 (File No. 001-16417),Exhibit 10.02
+10.35 Form of 2010 Restricted Unit Award Agreementunder the NuStar GP, LLC Second Amended andRestated 2000 Long-Term Incentive Plan
NuStar Energy L.P.’s Current Report on Form 8-Kfiled January 5, 2011(File No. 001-16417), Exhibit10.03
+10.36 Form of 2011 and 2012 Restricted Unit AwardAgreement under the NuStar GP, LLC ThirdAmended and Restated 2000 Long-Term IncentivePlan
NuStar Energy L.P.’s Current Report on Form 8-Kfiled January 31, 2012 (File No. 001-16417),Exhibit 10.2
+10.37 Form of 2013 Restricted Unit Award Agreementunder the NuStar GP, LLC Third Amended andRestated 2000 Long-Term Incentive Plan
NuStar Energy L.P.’s Annual Report on Form 10-Kfor year ended December 31, 2013 (File No.001-16417), Exhibit 10.15
+10.38 Form of Performance Unit Agreement under theNuStar GP, LLC Second Amended and Restated2000 Long-Term Incentive Plan (substantially thesame for 2010, 2011, 2012 and 2013 awards withappropriate adjustments based on award dates)
NuStar Energy L.P.’s Annual Report on Form 10-Kfor year ended December 31, 2009 (File No.001-16417), Exhibit 10.11
+10.39 Form of Waiver Related to Certain PerformanceUnits (for 2010 and 2011 awards)
NuStar Energy L.P.’s Current Report on Form 8-Kfiled January 31, 2012 (File No. 001-16417),Exhibit 10.3

Table of Contents
156
+10.40 Form of Non-employee Director Restricted UnitAgreement under the NuStar GP, LLC SecondAmended and Restated 2000 Long-Term IncentivePlan (substantially the same for 2010, 2011 and2012 awards)
NuStar Energy L.P.’s Current Report on Form 8-Kfiled January 5, 2011 (File No. 001-16417), Exhibit10.02
+10.41 Form of 2013 Non-employee Director RestrictedUnit Agreement under the NuStar GP, LLC ThirdAmended and Restated 2000 Long-Term IncentivePlan
NuStar Energy L.P.’s Annual Report on Form 10-Kfor year ended December 31, 2013 (File No.001-16417), Exhibit 10.21
+10.42 NuStar Energy L.P. Annual Bonus Plan NuStar Energy L.P.’s Annual Report on Form 10-Kfor year ended December 31, 2006 (File No.001-16417), Exhibit 10.18
+10.43 Form of Change of Control Severance Agreementwith executive officers of NuStar GP, LLC(substantially the same for all executive officers,except for payment multiple)
NuStar Energy L.P.’s Quarterly Report on Form 10-Q for the quarter ended September 30, 2006 (FileNo. 001-16417), Exhibit 10.06
+10.44 NuStar Excess Pension Plan, amended and restatedeffective as of January 1, 2008
NuStar Energy L.P.’s Annual Report on Form 10-Kfor year ended December 31, 2008 (File No.001-16417), Exhibit 10.29
+10.45 NuStar Excess Pension Plan, amended and restatedeffective as of January 1, 2014
*
+10.46 NuStar Excess Thrift Plan, amended and restatedeffective as of January 1, 2008
NuStar Energy L.P.’s Annual Report on Form 10-Kfor year ended December 31, 2008 (File No.001-16417), Exhibit 10.30
10.47 Non-Compete Agreement, dated July 19, 2006,between Valero GP Holdings, LLC, Valero L.P.,Riverwalk Logistics, L.P. and Valero GP, LLC
NuStar Energy L.P.’s Quarterly Report on Form 10-Q for quarter ended September 30, 2006 (File No.001-16417), Exhibit 10.03
10.48 Services Agreement, effective as of January 1,2008, between NuStar GP, LLC and NuStar EnergyL.P.
NuStar Energy L.P.’s Quarterly Report on Form 10-Q for quarter ended March 31, 2008 (File No.001-16417), Exhibit 10.01
10.49 Amended and Restated Aircraft Time SharingAgreement, dated as of September 4, 2009,between NuStar Logistics, L.P. and William E.Greehey
NuStar Energy L.P.’s Annual Report on Form 10-Kfor year ended December 31, 2009 (File No.001-16417), Exhibit 10.24
10.50 Crude Oil Sales Agreement between NuStarMarketing LLC and PDVSA-Petróleo S.A., anaffiliate of Petróleos de Venezuela S.A., thenational oil company of the Bolivarian Republic ofVenezuela, dated effective as of March 1, 2008
NuStar Energy L.P.’s Current Report on Form 8-Kfiled March 25, 2008 (File No. 001-16417), Exhibit10.1
10.51 Amendment to Crude Oil Sales Agreement betweenPDVSA-Petróleo S.A., NuStar Logistics, L.P. andNuStar Marketing LLC, effective as of October 1,2012
NuStar Energy L.P.’s Quarterly Report on Form 10-Q for quarter ended June 30, 2013 (File No.001-16417), Exhibit 10.01
10.52 Purchase and Sale Agreement by and amongNuStar Energy L.P., NuStar Logistics, L.P., NuStarAsphalt Refining, LLC, NuStar Marketing LLC,NuStar GP, LLC, NuStar Asphalt LLC and AsphaltAcquisition LLC dated as of July 3, 2012
NuStar Energy L.P.’s Current Report on Form 8-Kfiled July 6, 2012 (File No. 001-16417), Exhibit10.01
10.53 Letter Agreement by and among AsphaltAcquisition LLC, NuStar Energy L.P., NuStarLogistics, L.P., NuStar Asphalt Refining, LLC,NuStar Marketing LLC, NuStar GP, LLC andNuStar Asphalt LLC dated August 2, 2012
NuStar Energy L.P.’s Quarterly Report on Form 10-Q for quarter ended September 30, 2012 (File No.001-16417), Exhibit 10.02

Table of Contents
157
10.54 Amendment No. 1 to Purchase and Sale Agreementdated as of September 28, 2012 by and amongNuStar Energy L.P., NuStar Logistics, L.P., NuStarAsphalt Refining, LLC, NuStar Marketing LLC,NuStar GP, LLC, NuStar Asphalt LLC and AsphaltAcquisition LLC
NuStar Energy L.P.’s Quarterly Report on Form 10-Q for quarter ended September 30, 2012 (File No.001-16417), Exhibit 10.03
10.55 Amended and Restated Transaction Agreement byand between LG Asphalt L.P. and NuStar Logistics,L.P. dated as of December 20, 2013
NuStar Energy L.P.’s Annual Report on Form 10-Kfor year ended December 31, 2013 (File No.001-16417), Exhibit 10.47
10.56 Amendment No. 1 to Amended and RestatedTransaction Agreement dated as of January 29,2014
NuStar Energy L.P.’s Annual Report on Form 10-Kfor year ended December 31, 2013 (File No.001-16417), Exhibit 10.48
10.57 Amendment No. 2 to Amended and RestatedTransaction Agreement dated as of February 26,2014
NuStar Energy L.P.’s Annual Report on Form 10-Kfor year ended December 31, 2013 (File No.001-16417), Exhibit 10.49
12.01 Statement of Computation of Ratio of Earnings toFixed Charges
*
14.01 Code of Ethics for Senior Financial Officers NuStar Energy L.P.’s Annual Report on Form 10-Kfor year ended December 31, 2003 (File No.001-16417), Exhibit 14.1
21.01 List of subsidiaries of NuStar Energy L.P. *
23.01 Consent of KPMG LLP dated February 25, 2016(NuStar Energy L.P.)
*
23.02 Consent of KPMG LLP dated February 25, 2016(NuStar Asphalt LLC)
*
24.01 Powers of Attorney (included in signature page ofthis Form 10-K)
*
31.01 Rule 13a-14(a) Certification (under Section 302 ofthe Sarbanes-Oxley Act of 2002) of principalexecutive officer
*
31.02 Rule 13a-14(a) Certification (under Section 302 ofthe Sarbanes-Oxley Act of 2002) of principalfinancial officer
*
32.01 Section 1350 Certification (under Section 906 ofthe Sarbanes-Oxley Act of 2002) of principalexecutive officer
**
32.02 Section 1350 Certification (under Section 906 ofthe Sarbanes-Oxley Act of 2002) of principalfinancial officer
**
99.01 Audit Committee Pre-Approval Policy *
99.02 Consolidated Financial Statements of NuStarAsphalt LLC for December 31, 2013 and 2012
*
99.03 Unaudited Consolidated Financial Statements ofNuStar Asphalt LLC as of February 25, 2014 andfor the period from January 1, 2014 to February 25,2014
*
101.INS XBRL Instance Document *
101.SCH XBRL Taxonomy Extension Schema Document *
101.CAL XBRL Taxonomy Extension Calculation LinkbaseDocument
*
101.DEF XBRL Taxonomy Extension Definition LinkbaseDocument
*

Table of Contents
158
101.LAB XBRL Taxonomy Extension Label LinkbaseDocument
*
101.PRE XBRL Taxonomy Extension Presentation LinkbaseDocument
*
* Filed herewith.
** Furnished herewith.
+ Identifies management contracts or compensatory plans or arrangements required to be filed as an exhibit heretopursuant to Item 15(c) of Form 10-K.
Copies of exhibits filed as a part of this Form 10-K may be obtained by unitholders of record at a charge of $0.15 per page, minimum $5.00 each request. Direct inquiries to Corporate Secretary, NuStar Energy L.P., 19003 IH-10 West, San Antonio, Texas 78257.

Table of Contents
159
SIGNATURES
Pursuant to the requirements of Section 13 or 15(d) of the Exchange Act, the registrant has duly caused this report to be signed on its behalf by the undersigned, thereunto duly authorized.
NUSTAR ENERGY L.P.(Registrant)
By: Riverwalk Logistics, L.P., its general partnerBy: NuStar GP, LLC, its general partner
By: /s/ Bradley C. BarronBradley C. BarronPresident and Chief Executive OfficerFebruary 25, 2016
By: /s/ Thomas R. ShoafThomas R. ShoafExecutive Vice President and Chief Financial OfficerFebruary 25, 2016
By: /s/ Jorge A. del AlamoJorge A. del AlamoSenior Vice President and ControllerFebruary 25, 2016

Table of Contents
160
POWER OF ATTORNEY
KNOW ALL MEN BY THESE PRESENTS, that each person whose signature appears below hereby constitutes and appoints Bradley C. Barron, Thomas R. Shoaf and Amy L. Perry, or any of them, each with power to act without the other, his true and lawful attorney-in-fact and agent, with full power of substitution and resubstitution, for him and in his name, place and stead, in any and all capacities, to sign any or all subsequent amendments and supplements to this Annual Report on Form 10-K, and to file the same, or cause to be filed the same, with all exhibits thereto, and other documents in connection therewith, with the Securities and Exchange Commission, granting unto each said attorney-in-fact and agent full power to do and perform each and every act and thing requisite and necessary to be done in and about the premises, as fully to all intents and purposes as he might or could do in person, hereby qualifying and confirming all that said attorney-in-fact and agent or his substitute or substitutes may lawfully do or cause to be done by virtue hereof.
Pursuant to the requirements of the Securities Exchange Act of 1934, this report has been signed below by the following persons on behalf of the registrant and in the capacities and on the dates indicated.
Signature Title Date
/s/ William E. Greehey Chairman of the Board February 25, 2016William E. Greehey
/s/ Bradley C. Barron President, Chief Executive February 25, 2016Bradley C. Barron Officer and Director
(Principal Executive Officer)
/s/ Thomas R. Shoaf Executive Vice President February 25, 2016Thomas R. Shoaf and Chief Financial Officer
(Principal Financial Officer)
/s/ Jorge A. del Alamo Senior Vice President and Controller February 25, 2016Jorge A. del Alamo (Principal Accounting Officer)
/s/ J. Dan Bates Director February 25, 2016J. Dan Bates
/s/ Dan J. Hill Director February 25, 2016Dan J. Hill
/s/ Robert J. Munch Director February 25, 2016Robert J. Munch
/s/ W. Grady Rosier Director February 25, 2016W. Grady Rosier