nsg group/media/nsg/site content/ir/ir... · this slide sets out, in ifrs format, the adjustments...
TRANSCRIPT

1

2
2
NSG Group
Implementation of International Financial Reporting Standards
from 1 April 2011
Nippon Sheet Glass Co., Ltd.
Thank you for joining this presentation, prepared by the NSG Group.
The aim of the presentation is to review the impact of the Group’s transition from Japanese GAAP to International Financial Reporting Standards, referred to as “IFRS”.
As announced on 4 November 2010, the NSG Group is adopting IFRS, voluntarily from the start of our next financial year.
We will be adopting IFRS with effect from 1 April 2011, in our financial year ending 31 March 2012, which we refer to as FY2012.
On a practical level, the acquisition of Pilkington plc in 2006 has meant that around two-thirds of the NSG Group already reports in IFRS.
Having the whole Group use IFRS in future will remove the need to convert some figures from IFRS to JGAAP for consolidated reporting purposes.
Enabling the whole Group to use the same accounting language will have clear benefits for the Group’s internal decision-making processes.

3
3
Agenda
• Introduction
• Presentation Objectives
• Implementation Timetable
• Opening balance sheet at 31 March 2010
• Income statement forecast FY2011
• Strategic Management Plan
This is the outline agenda.
We will begin by describing the Group’s IFRS implementation timetable.
Our IFRS accounts for FY2012 will include IFRS figures for that year and also IFRS figures for the year ending 31 March 2011, which we refer to as FY2011.
It is therefore necessary first to construct an opening balance sheet using IFRS rules as at 31 March 2010, as this is the opening balance sheet for FY2011.
We will review that balance sheet in this presentation.
We will then consider the impact of the transition to IFRS on the Group’s FY2011 income statement.
Finally, we will consider the impact of IFRS on the Group’s Strategic Management Plan, which was announced on 4 November 2010.

4
4
Presentation ObjectivesIn this presentation we will
• Set out the implementation timetable and what users of NSG Group accounts can expect to see in the Group’s reporting through FY2012 (the financial year ending 31 March 2012)
• Explain the major adjustments to the Group’s accounts arising from the transition to IFRS, covering both the balance sheet and income statement
• Re-confirm the Group’s Strategic Management Plan financial targets in an IFRS environment
This slide sets out in more detail the objectives of this presentation. They are:
•To review the Group’s implementation timetable, setting out what readers of the Group’s financial reports can expect to see during FY2012.
•To explain the impact of the move to IFRS on the Group’s opening balance sheet at 31 March 2010, which we refer to as the “transition balance sheet”.
•To consider the impact of the move to IFRS on the Group’s income statement for the year to 31 March 2011.
Finally, to re-confirm the Group’s Strategic Management Plan financial targets in an IFRS environment.
We do not intend to cover the Group’s cash flow statement in this presentation.
This is because, apart from reallocations due to presentational differences, there is no overall impact on the Group’s cash position as a result of our transition to IFRS.

5
5
Implementation timetable
• First quarter to 30 June 2011 – IFRS with IFRS prior year comparatives
To include reconciliation of net assets from J GAAP to IFRS at 31 March 2010, 30 June 2010, 31 March 2011
To include reconciliation of net income and key cash flow figures for the year to 31 March 2011
To include reconciliation of net income for the quarter to 30 June 2010
• Second and third quarters to September and December 2011 – IFRS with IFRS prior year comparatives
To include reconciliation of net assets from J GAAP to IFRS at 30 September and 31 December 2010 respectively
To include reconciliation of net income for the quarters to 30 September and 31 December 2010 respectively
We now consider the implementation timetable.
As shown in this slide, the Group’s first quarter results to 30 June 2011 will be the first published using IFRS.
The first quarter results to 30 June 2011, (expected to be released in August 2011) will include IFRS-compliant financial statements.
They will also include reconciliations of certain key figures from J GAAP, as reported previously, to IFRS.
These reconciliations will include net assets as at 31 March 2010, 30 June 2010, and 31 March 2011.
They will also include reconciliations of net income as at 30 June 2010 and 31 March 2011 together with key cash flow figures as at 31 March 2011.
The second and third quarter results during FY2012 will include IFRS-compliant financial statements.
They will also include reconciliations of certain previously reported key figures from J GAAP to IFRS.
We will provide these reconciliations for key balance sheet and income statement figures, as at each quarter-end date of the previous year.

6
6
Implementation timetable (cont.)
• Full year to 31 March 2012
To include reconciliation of net assets from J GAAP to IFRS at 31 March 2010 and 31 March 2011
To include reconciliation of net income and key cash flow figures for the year to 31 March 2011
To include un-audited summary of J GAAP major financial statements for the year to 31 March 2012
• Full year to 31 March 2013 and thereafter – IFRS only
For year-end reporting to 31 March 2012, we will again provide the reconciliations of net assets at 31 March 2010 and 31 March 2011.
We will also provide a reconciliation of net income and key cash flow figures for the financial year to 31 March 2011.
In addition, the year-end financial results will also include summarised un-audited J GAAP major financial statements for the full year to 31 March 2012.
Following the 31 March 2012 year-end reporting, the NSG Group will report using IFRS only.

7
7
Agenda
• Introduction
• Presentation Objectives
• Implementation Timetable
• Opening balance sheet at 31 March 2010
• Income statement forecast FY2011
• Strategic Management Plan

8
8
Opening Balance Sheet
Net assets at 31 March 2010:(JPY million) J GAAP Adjustments IFRS
Total assets 933,721 11,699 945,419
Total liabilities (693,790) (51,724) (745,514)
Total net assets 239,931 (40,026) 199,905Represented by:Common stock 96,147 - 96,147Capital surplus 135,290 (27,724) 107,566Retained earnings 71,696 (12,441) 59,255Retained earnings IFRS conversion - (68,049) (68,049)Treasury stocks (589) - (589)Valuation & translation adjustments (72,239) 68,049 (4,190)Stock options 684 - 684Minority interests 8,942 138 9,080Total net assets 239,931 (40,026) 199,905
The net impact of the move to IFRS on the Group’s net assets at 31 March 2010 is a reduction of approximately JPY40 billion.
The impact on reserves is set out on this slide. We will also explain this in more detail later in this presentation.

9
9
Opening Balance Sheet
Assets at 31 March 2010:(JPY million) J GAAP Adjustments IFRS
Non-Current assets:Goodwill 122,653 90 122,743Intangible assets 113,381 4,921 118,302Property, plant & equipment 283,140 2,658 285,798Equity method investments 41,918 2,733 44,651Available for sale investments 17,306 (6,789) 10,517Deferred taxation 47,836 7,333 55,169Trade and other receivables 8,791 - 8,791Derivative financial instruments 1,249 - 1,249
Total non-current assets 636,274 10,946 647,220
In this section, we will review the J GAAP to IFRS adjustments affecting our opening balance sheet as at 31 March 2010.
This slide sets out, in IFRS format, the adjustments to non-current assets.
Each adjustment will be explained later in the presentation.
For simplicity and ease of presentation, the J GAAP figures are presented in IFRS format. Consequently, in some cases they do not correspond exactly to the Group’s published balance sheet at 31 March 2010.
However, the total J GAAP values of non-current assets, current assets, current liabilities and non-current liabilities are consistent with the 31 March published balance sheet.

10
10
Opening Balance Sheet
Assets at 31 March 2010:(JPY million) J GAAP Adjustments IFRS
Current assets:Inventories 97,715 218 97,933Construction work-in-progress 1,076 - 1,076Trade and other receivables 116,486 779 117,265Deferred taxation 560 (560) -Derivative financial instruments 1,813 153 1,966Cash and cash equivalents 79,796 - 79,796Assets held for sale - 163 163
Total current assets 297,446 753 298,199
Total non-current assets 636,274 10,946 647,220
Total assets 933,721 11,699 945,419
This slide sets out the adjustments to current assets.
We then add in the adjustments to non-current assets from the previous slide to get the total adjustment to assets.

11
11
Opening Balance Sheet
Liabilities at 31 March 2010:(JPY million) J GAAP Adjustments IFRS
Current liabilities:Financial liabilities 79,400 1,048 80,448Derivative financial instruments 6,353 25 6,378Trade and other payables 114,568 1,376 115,945Deferred taxation 5,562 (5,562) -Taxation liabilities 6,023 - 6,023Provisions 20,156 2,988 23,144Deferred income 3,071 - 3,071
Total current liabilities 235,134 (125) 235,008
This slide sets out the adjustments to current liabilities.

12
12
Opening Balance Sheet
Liabilities at 31 March 2010:(JPY million) J GAAP Adjustments IFRS
Non-current liabilities:Financial liabilities 319,849 29,621 349,470Derivative financial instruments 4,276 - 4,276Trade and other payables 5 - 5Deferred taxation 45,919 7,752 53,671Retirement benefit obligations 59,319 21,867 81,185Provisions 23,120 (7,391) 15,730Deferred income 6,168 - 6,168
Total non-current liabilities 458,656 51,849 510,505
Total current liabilities 235,134 (125) 235,008
Total liabilities 693,790 51,724 745,514
This slide sets out the adjustments to non-current liabilities.
We then add in the adjustments to current liabilities from the previous slide to get the total adjustment to liabilities.

13
13
Opening Balance SheetNon-current assets
Goodwill(JPY million)
J GAAP balance 122,653
Write off negative goodwill balances 90
IFRS balance 122,743
• IFRS 3 (para. 34) requires the immediate recognition of negative goodwill in the income statement.
• J GAAP balance of positive goodwill used as deemed cost for IFRS in accordance with IFRS1 (para’s. D5 – D7)
Starting with Goodwill, we can see that the adjustment is relatively minor.
The Group has some negative goodwill on its J GAAP balance sheet.
In IFRS, negative goodwill is generally credited immediately to the income statement.
We have therefore replicated this treatment by writing off the negative goodwill in the opening IFRS balance sheet.
The J GAAP balance of positive goodwill has been used as the deemed cost for IFRS purposes in the opening balance sheet.
This includes the goodwill arising on the acquisition of Pilkington plc.
14
14
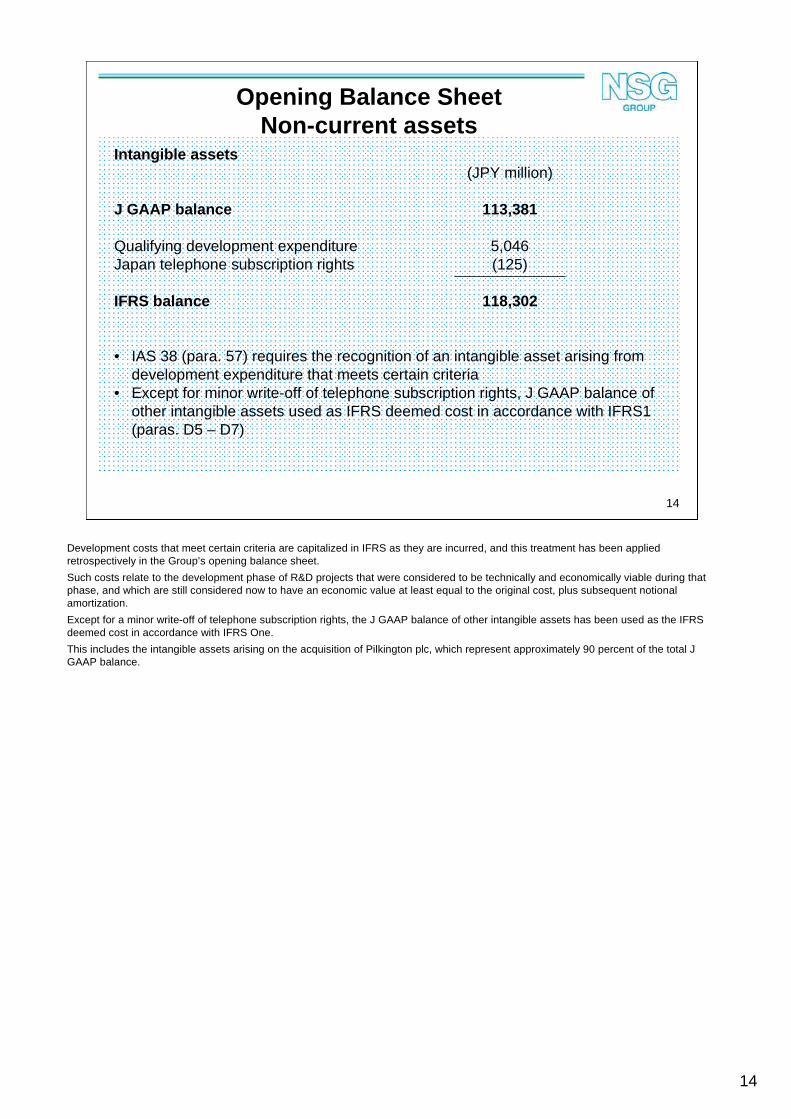
Intangible assets (JPY million)
J GAAP balance 113,381
Qualifying development expenditure 5,046Japan telephone subscription rights (125)
IFRS balance 118,302
• IAS 38 (para. 57) requires the recognition of an intangible asset arising from development expenditure that meets certain criteria
• Except for minor write-off of telephone subscription rights, J GAAP balance of other intangible assets used as IFRS deemed cost in accordance with IFRS1 (paras. D5 – D7)
Opening Balance SheetNon-current assets
Development costs that meet certain criteria are capitalized in IFRS as they are incurred, and this treatment has been applied retrospectively in the Group’s opening balance sheet.
Such costs relate to the development phase of R&D projects that were considered to be technically and economically viable during that phase, and which are still considered now to have an economic value at least equal to the original cost, plus subsequent notional amortization.
Except for a minor write-off of telephone subscription rights, the J GAAP balance of other intangible assets has been used as the IFRS deemed cost in accordance with IFRS One.
This includes the intangible assets arising on the acquisition of Pilkington plc, which represent approximately 90 percent of the total J GAAP balance.

15
15
Property, plant & equipment (JPY million)
J GAAP balance 283,140
Float tank assets 1,902Investment properties 756
IFRS balance 285,798
• Capital costs of float tank repairs in Japan, historically charged to float tank repair provisions rather than capitalized as property, plant & equipment, now retrospectively capitalized, allowing for subsequent depreciation (IAS16 para 15)
• Investment properties, formerly held at cost now held at fair value (IAS 40 para 32A)
Opening Balance SheetNon-current assets
The Group’s J GAAP approach to float tank assets in Japan has been quite different to the required approach in IFRS.
The J GAAP treatment for float tank assets in Japan has been to provide in advance for future cold repair costs, with the costs then being charged to that provision as incurred during the repair.
As a result, the majority of cold repair costs have not previously been capitalized on the balance sheet as they have instead been charged to the provision.
The IFRS treatment is to capitalize such costs when incurred and then to depreciate the resulting asset over the life of the repair.
This is typically between 12 and 15 years for NSG Group float lines.
This IFRS treatment has been applied retrospectively in the opening balance sheet.
The adjustment is relatively low, as it applies only to float assets in Japan, which as at 31 March 2010 were, on average, relatively close to their scheduled repair date.
Certain investment properties, yielding a rental income have been held at historic cost in J GAAP, but have now been re-valued to their fair value in IFRS.

16
16
Equity method investments (associates and joint ventures)
(JPY million)
J GAAP balance 41,918
Transfer from available-for-sale investments to associates 2,733
IFRS balance 44,651
• IFRS recognition criteria of significant influence (IAS28 paras 6 & 7), mandating the use of the equity method of accounting (IAS28 para 11) , has been applied to certain investments, previously held at cost in J GAAP
Opening Balance SheetNon-current assets
Certain investments, previously classified as investments in securities, are now reclassified as investments in associates, and valued at the Group’s underlying share of the associates’ net assets.
The equity method of accounting is used, as a result of being able to exercise significant influence over those associates.
The value transferred into investments in associates is less than the value transferred out of ‘investments in securities’, included in available for sale investments in IFRS.
This is due to differences between the historic cost of those investments and the Group’s underlying share of net assets of the companies invested in.
17
17
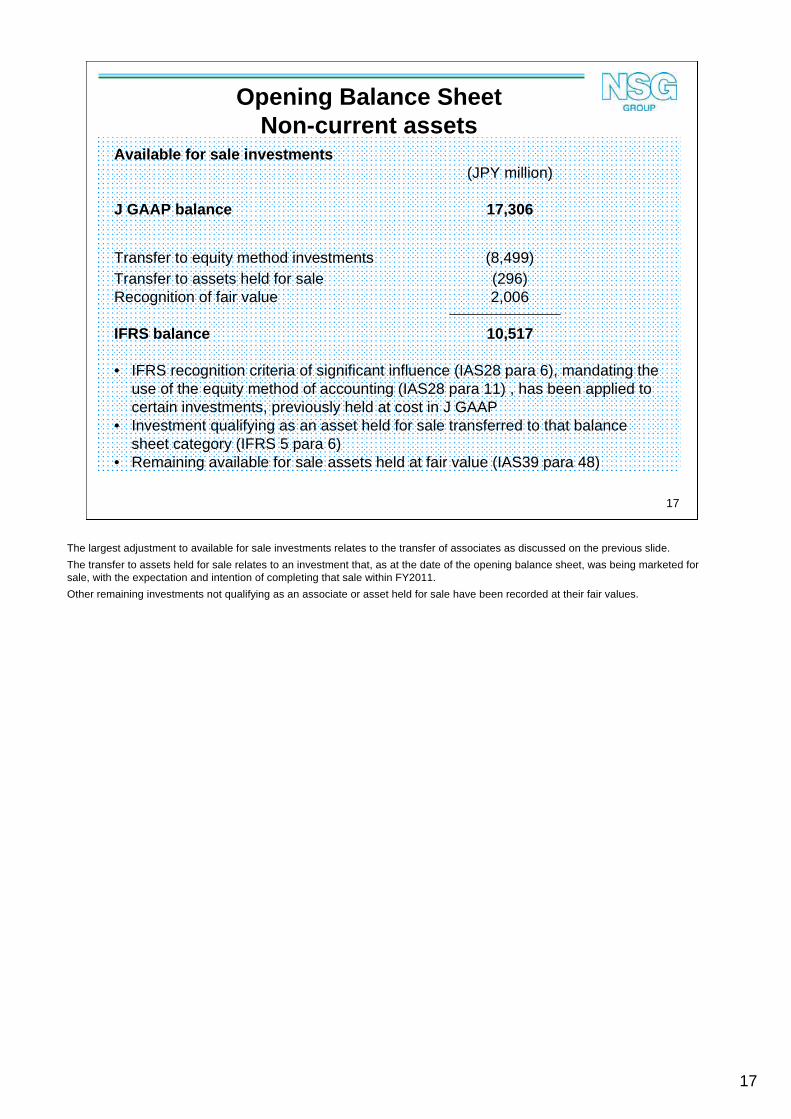
Available for sale investments (JPY million)
J GAAP balance 17,306
Transfer to equity method investments (8,499)Transfer to assets held for sale (296)Recognition of fair value 2,006
IFRS balance 10,517
• IFRS recognition criteria of significant influence (IAS28 para 6), mandating the use of the equity method of accounting (IAS28 para 11) , has been applied to certain investments, previously held at cost in J GAAP
• Investment qualifying as an asset held for sale transferred to that balance sheet category (IFRS 5 para 6)
• Remaining available for sale assets held at fair value (IAS39 para 48)
Opening Balance SheetNon-current assets
The largest adjustment to available for sale investments relates to the transfer of associates as discussed on the previous slide.
The transfer to assets held for sale relates to an investment that, as at the date of the opening balance sheet, was being marketed for sale, with the expectation and intention of completing that sale within FY2011.
Other remaining investments not qualifying as an associate or asset held for sale have been recorded at their fair values.

18
18
Deferred taxation (JPY million)
J GAAP balance 47,836
Retirement Benefits 6,843Development costs (269)Transfer from current assets 560Additional holiday pay provisions 198Other adjustments 1
IFRS balance 55,169
• All adjustments relate to deferred taxation applied to adjustments made to various other assets and liabilities, and explained on other slides, except for classification adjustment below
• All deferred taxation in IFRS classified as non-current (IAS 1 para 56)
Opening Balance SheetNon-current assets
The adjustments to deferred taxation assets arise as a result of amendments to other balance sheet items.
No deferred taxation assets have been recognized in respect of tax losses brought forward in the IFRS opening balance sheet that were not already recognized in the opening J GAAP balance sheet.
All deferred taxation assets in IFRS are recognized as non-current and therefore the balance includes an amount transferred from current assets.

19
19
Inventories (JPY million)
J GAAP balance 97,715
Various immaterial adjustments 218
IFRS balance 97,933
Opening Balance SheetCurrent assets
As shown on this slide, adjustments to inventories are relatively immaterial

20
20
Trade and other receivables (JPY million)
J GAAP balance 116,486
Factoring of promissory notes 1,048 Other adjustments (269)
IFRS balance 117,265
• Recognition of continued involvement in Japanese promissory notes, sold to financial institutions, recognized as a grossed-up asset and liability (IAS39 paras 30 & 31)
Opening Balance SheetCurrent assets
Certain receivables in Japan have been sold to financial institutions under arrangements where the Group still retains a residual interest in those receivables, in other words, where the Group still bears some default risk in the event of non-payment by the Group’s customers.
Therefore the residual interest has been added back into trade receivables in the IFRS opening balance sheet.

21
21
Deferred taxation (JPY million)
J GAAP balance 560
Transfer to non-current assets (560)
IFRS balance -
• All deferred taxation in IFRS classified as non-current (IAS 1 para 56)
Opening Balance SheetCurrent assets
As mentioned previously, all deferred taxation assets in IFRS are recognized as non-current.

22
22
Derivative financial instruments (JPY million)
J GAAP balance 1,813
Interest rate swaps 153
IFRS balance 1,966
• Recognition of fair value of certain interest rate swaps, previously accounted for using the simplified method of accounting in J GAAP (IAS39 para 95)
Opening Balance SheetCurrent assets
Certain relatively minor interest rate swaps were previously accounted for in J GAAP using a simplified methodology, which did not involve the recognition of their fair value on the balance sheet.
In IFRS those derivative contracts have been fair valued and included in current assets.

23
23
Assets held for sale (JPY million)
J GAAP balance -
Transfer from available-for-sale 163
IFRS balance 163
• Investment qualifying as an asset held for sale recognised in separate balance sheet caption (IFRS 5 para 6)
Opening Balance SheetCurrent assets
An investment has been transferred, at its fair value, to assets held for sale as at the opening balance sheet date, as the Group expected to sell this investment within 12 months of the opening balance sheet date.

24
24
Financial liabilities (JPY million)
J GAAP balance 79,400
Factoring of promissory notes 1,048
IFRS balance 80,448
• Recognition of continued involvement in Japan promissory notes, sold to financial institutions, recognized as a grossed-up asset and liability (IAS39 paras 30 & 31)
Opening Balance SheetCurrent liabilities
In Japan, the Group enters into a factoring arrangement with financial institutions whereby it receives cash early with respect to promissory notes received from certain customers.
The Group still retains a residual interest in a portion of those promissory notes in that, in the event of non-payment from the customer, the Group is obligated to fund 15 percent of the financial institutions loss.
This residual interest is grossed up in the opening balance sheet by recognizing an asset and a corresponding liability, to the extent of the Group’s continuing 15 percent residual interest.

25
25
Derivative financial instruments (JPY million)
J GAAP balance 6,353
Interest rate swaps 25
IFRS balance 6,378
• Recognition of fair value of certain interest rate swaps, previously accounted for using the simplified method of accounting in J GAAP (IAS39 para 95)
Opening Balance SheetCurrent liabilities
As previously seen in the amendments to current assets, certain relatively minor interest rate swaps were previously accounted for in J GAAP using a simplified methodology that did not involve the recognition of their fair value on the balance sheet.
In IFRS, those derivative contracts have been fair valued and included in the opening balance sheet.

26
26
Trade and other payables (JPY million)
J GAAP balance 114,568
Preferred share interest accrual 1,383Other sundry adjustments (6)
IFRS balance 115,945
• Preferred shares treated as a liability in IFRS (IAS32 para 11) and dividends treated as interest accrual (IAS32 para 35)
Opening Balance SheetCurrent liabilities
The Group’s outstanding preferred shares are accounted for as a financial liability in IFRS, in that they commit the Group to an obligation to pay cash to the holders of the preferred shares in the future.
As a result, those preferred shares are included within non-current liabilities in the balance sheet and the accrued interest, representing unpaid dividends accrued, is included in current liabilities.
The Group has redeemed all such preferred shares during the current financial year.
27
27
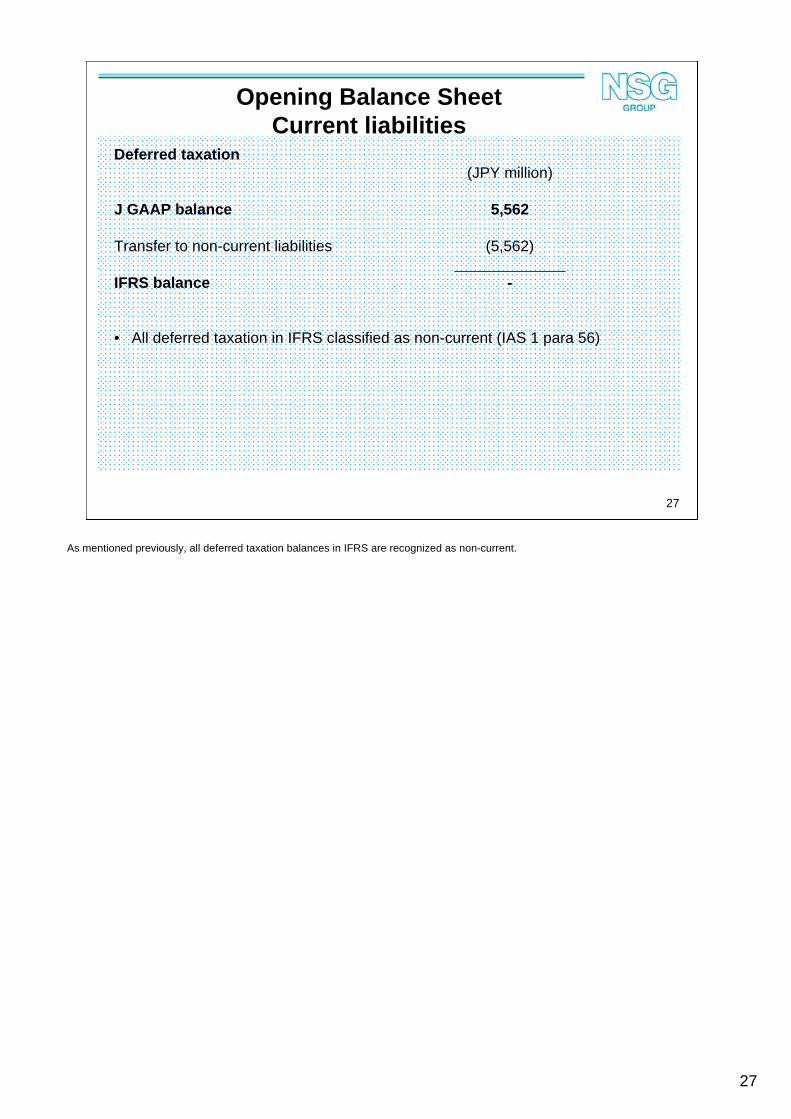
Deferred taxation (JPY million)
J GAAP balance 5,562
Transfer to non-current liabilities (5,562)
IFRS balance -
• All deferred taxation in IFRS classified as non-current (IAS 1 para 56)
Opening Balance SheetCurrent liabilities
As mentioned previously, all deferred taxation balances in IFRS are recognized as non-current.

28
28
Provisions (JPY million)
J GAAP balance 20,156
Holiday pay provisions 2,988
IFRS balance 23,144
• Provision established to record present obligation relating to accrued holiday entitlement in Japan (IAS37 para14)
Opening Balance SheetCurrent liabilities
Certain accrued holiday pay rights in Japan have previously not been recognized as a monetary liability, consistent with usual custom and accounting practice.
Provisions within current liabilities have increased with respect to the potential future cash outflows arising.

29
29
Financial liabilities(JPY million)
J GAAP balance 319,849
Preferred shares 30,000Reversal of discount on convertible bonds (379)
IFRS balance 349,470
• Preferred shares treated as a financial liability in IFRS (IAS32 para 11)• Notional discount on convertible bonds, representing equity component of
conversion feature, deducted retrospectively from value of bonds payable, and then subsequently reversed with a charge to interest costs to the bonds’maturity date (IAS32 para’s 28,29,35)
Opening Balance SheetNon-current liabilities
As previously mentioned, the Group’s outstanding preferred shares are accounted for as a financial liability in IFRS, in that they commit the Group to an obligation to pay cash to the holders of the preferred shares in the future.
As a result, those preferred shares are included within non-current liabilities in the balance sheet.
However, as announced on 16 September 2010 and 3 February 2011, the Group acquired for cancellation during FY2011 all of the preferred shares that had been outstanding on 31 March 2010.
As a result, this difference between the Group’s J GAAP and IFRS financial liabilities will not exist on 31 March 2011.
The Group had outstanding at the opening balance sheet date, JPY 23 billion of zero coupon convertible bonds due 13 May 2011.
The Group has retrospectively applied IFRS accounting to these bonds. This involves determining how much of a discount would have been applied to those bonds when issued in 2004 if they had carried no conversion feature.
That discount element is then considered to be the equity component of the bonds, and is therefore classed as such within shareholders equity.
The discount is then unwound with a charge to interest costs over the life of the bond and the adjustment to non-current liabilities represents the discount still to be unwound by the charging of notional interest on the bond.

30
30
Deferred taxation(JPY million)
J GAAP balance 45,919
Transfer from current liabilities 5,562Capitalized development costs 1,163Increased fair value of investments 792Unremitted profits of subsidiaries* (904)Swap agreements 62Investment properties 307Float tank assets 770
IFRS balance 53,671
• *DT removed on unremitted profits of subsidiaries where the Group does not intend to distribute profits in the foreseeable future (IAS12 para 40)
Opening Balance SheetNon-current liabilities
The adjustments to deferred taxation liabilities arise mostly as a result of amendments to other balance sheet items.
The Group previously provided a deferred taxation liability on the unremitted profits of certain subsidiaries in J GAAP.
As the Group controls the timing of this reversal, this provision has been reversed.
All deferred taxation liabilities in IFRS are recognized as non-current and therefore the balance includes an amount transferred from current liabilities.

31
31
Retirement benefit obligations (RBO)(JPY million)
J GAAP balance 59,319
Previously unrecognized liability 25,035Transfer of non-material RBO to provisions (3,169)
IFRS balance 81,185
• Retirement benefit obligations recognized in full as a liability (IAS19 para 54)• Liability relating to immaterial schemes included fully within provisions for
practical purposes.
Opening Balance SheetNon-current liabilities
The IFRS liability for retirement benefit obligations includes the full balance sheet deficit for all retirement benefit obligations.
Historically in J GAAP, the Group has deferred actuarial gains and losses, arising from changes in discount rates, mortality assumptions, and the changing value of scheme assets, to the balance sheet over a five year period commencing the year after the gain or loss arose.
This has therefore historically generated an unrecognized liability, previously disclosed in the notes to the Group’s annual report, but which is now included within balance sheet liabilities.
Within this adjustment there is also an immaterial difference to the value of pension scheme liabilities due to the method of calculation of those liabilities in J GAAP.
Those retirement benefit schemes considered to be immaterial are still accounted for with a full recognition of any surplus or deficit, but are included within provisions, rather than within retirement benefit obligations.
Any gain or loss arising from these schemes is charged wholly to operating costs, as opposed to the schemes accounted for fully in accordance with IAS19, which generate income statement entries within both operating income and finance costs, and also entries to reserves through the statement of comprehensive income.

32
32
Provisions(JPY million)
J GAAP balance 23,120
Remove tank repair provisions (10,559)Transfer of non-material RBO to provisions 3,169
IFRS balance 15,730
• Remove tank repair provisions due to lack of obligating event (IAS37 para 14)• Liability relating to immaterial schemes included fully within provisions for
practical purposes.
Opening Balance SheetNon-current liabilities
Future repairs of float tank assets are not provided for in advance in IFRS, as the Group has no legal or constructive obligation to make such a repair.
This also results in a more sensible income statement approach, where the timing of the costs of a repair of a float tank is matched in the income statement with the benefits of that repair.
In addition, provisions also increase, due to a transfer of immaterial retirement benefit obligations as described on the previous slide.

33
33
Opening Balance SheetReserves
JPY millionJ GAAP Preferred Convertible Exchange Other IFRS
Shares Bonds Adjustments
Common stock 96,147 96,147
Capital surplus 135,290 (30,000) 2,276 - - 107,566
Retained earnings 71,696 - (1,897) - (10,544) 59,255
Retained earnings IFRS conversion - - - (68,049) - (68,049)
Treasury stocks (589) - - - - (589)
Valuation & translation adjustments (72,239) - - 68,049 - (4,190)
Stock options 684 - - - - 684
Minority interests 8,942 - - - 138 9,080
Total net assets 239,931 (30,000) 379 - (10,406) 199,905
• Preferred shares treated as a financial liability in IFRS (IAS32 para 11)
• Notional discount on convertible bonds, representing equity component of conversion feature, deducted retrospectively from value of bonds payable, and then subsequently reversed with a charge to interest costs to the bonds’ maturity date (IAS32 paras 28,29,35)
• Cumulative exchange reserves set to nil (IFRS1 para D13)
This slide shows how the balance sheet movements impact the Group’s reserves.
Generally all the various balance sheet adjustments are posted to retained earnings, although there are some notable exceptions.
The preferred shares were previously included within capital surplus, so are now transferred out of that reserve account.
The discount representing the notional equity element of the convertible bonds is transferred into capital surplus, and the subsequent unwinding of that discount is charged to retained earnings.
All opening balance sheet adjustments have been calculated at 31 March 2010 rates of exchange.
The Group has taken advantage of an option in IFRS to do this, which also then involves resetting the cumulative valuation and translation reserve to zero.
This reserve had a large debit balance, due to the recent strength of the Japanese Yen. The Group intends to create a new reserve to accommodate this debit, which will be entitled, “IFRS conversion foreign exchange retained earnings reserve”.

34
34
Agenda
• Introduction
• Presentation Objectives
• Implementation Timetable
• Opening balance sheet at 31 March 2010
• Income statement forecast FY2011
• Strategic Management Plan
Now we shall explain the impact of the Group’s IFRS conversion on the FY2011 income statement.

35
35
FY2011 Forecast Income Statement
JPY millionJ GAAP Adjustments IFRS
External revenue 600,000 40 600,040
Operating income before amortization* 33,000 2,600 35,600
Amortization* (18,000) 8,420 (9,580)
Operating income 15,000 11,020 26,020
Non-operating items (5,000) (2,590) (7,590)
Ordinary income 10,000 8,430 18,430
Extraordinary items (3,000) 3,000 -
Taxation (2,000) (2,030) (4,030)
Minority interests (4,000) - (4,000)
Net income 1,000 9,400 10,400
In the left hand column of this slide is the NSG Group’s financial forecast for FY2011 using J GAAP.
The right hand column shows what this forecast would have been using IFRS accounting policies.
On the following slides, we will explain the adjustments relating to each line of the income statement.
The adjustments to the income statement are related to the balance sheet adjustments already discussed, and arise from the same IFRS to J GAAP differences.

36
36
(JPY million)
J GAAP Forecast 33,000
Retirement benefit obligations 5,860Float tank assets (370)Capitalized development costs 90Goodwill amortization (non-Pilkington plc acq’n) 220Reallocations (3,140)Other adjustments (60)
IFRS Forecast 35,600
• Actuarial and gains and losses amortized into the income statement in J GAAP but recognized in other comprehensive income in IFRS (IAS19 para 93A)
• Future float glass tank cold repair costs provided in J GAAP, with subsequent capital expenditure charged to provisions, but not provided in IFRS (IAS37 para 14), with IFRS capital expenditure recognized as an asset (IAS16 para 15)
• Qualifying development expenditure recognized as an asset and amortized over its useful life in IFRS (IAS38 para 57) but charged directly to the income statement in J GAAP
• Goodwill amortized over 20 years for J GAAP purposes but given indefinite life with no resulting systematic annual amortization for IFRS purposes (IAS38 para 88)
• Reallocations refer to adjustments made with respect to the different positioning of certain items in the income statement from J GAAP to IFRS, including the allocation of J GAAP extraordinary items to IFRS operating income, the allocation of J GAAP other non-operating items to IFRS operating income, and the treatment of RBO costs in IFRS
*Amortization arising on the acquisition of Pilkington plc only
Income Statement ForecastOperating Income Before Amortization*
This slide explains the impact of the transition to IFRS on the Group’s operating income, before the amortization of intangible assetsrelating to the acquisition of Pilkington.
In J GAAP, actuarial gains and losses arising on the Group’s various retirement benefit schemes, have been charged to operating income over a period of five years, starting the year after the gain or loss first arose.
The Group’s IFRS treatment for such gains and losses is to recognise them fully within the balance sheet asset or liability when they arise, with a charge or credit in the Statement of Comprehensive Income.
The IFRS income statement reflects the depreciation of float tank assets across the Group, whereas the J GAAP income statement reflected an accrual for future float tank asset repairs in Japan, and depreciation of historic cost asset repairs elsewhere in the Group.
The impact of moving to IFRS therefore represents the difference between accruing for future repairs and the depreciation arising on historic repair costs in Japan.
As previously discussed, qualifying development costs are capitalized and depreciated in IFRS but expensed when incurred in J GAAP.
The income statement amendment just mentioned therefore represents the difference between the historic depreciation arising and the development costs incurred in the period.
Goodwill, which is not amortized in IFRS, has been amortized over a period not exceeding 20 years for J GAAP purposes.
The figure on the slide represents this difference arising only on goodwill that is not related to the acquisition of Pilkington in June 2006.
Items classed as extraordinary in J GAAP are charged to operating income in IFRS, as the IFRS income statement has no separate row for such items.
This covers items such as restructuring of operations, impairment of assets, and gains or losses arising on disposal of assets. This amended treatment is included in the reallocations line on the slide.
Also included in the reallocations line is the effect of the presentation of retirement benefit obligations costs in IFRS. Operating income in IFRS includes the cost of the increased retirement benefit liability that arises during the year as a result of additional service being performed by employees.
This is referred to as current service cost.
In IFRS, certain income statement items arising from retirement benefit obligations are included in interest costs.
This includes increases in retirement benefit liabilities caused by unwinding of discounting applied to those liabilities, as those liabilities become nearer the date at which they will be realized. This is referred to as finance cost.
Interest costs also include a credit for the expected increases in assets of funded retirement benefit schemes. This is referred to as the expected return on assets.
The reallocations figure above includes also the transfer of these finance costs and income elements into interest costs in the income statement.
Finally, certain other items that have historically been included as non-operating costs in J GAAP are included within operating income for IFRS purposes. This includes items such as foreign exchange gains or losses, and the depreciation of idle assets.
The reallocations figure on the slide also includes this transfer.

37
37
(JPY million)
J GAAP Forecast (18,000)
Goodwill amortization 6,450Pilkington brand amortization 1,970
IFRS balance (9,580)
• Goodwill and Pilkington brand amortized over 20 years for J GAAP purposes but given indefinite life with no resulting systematic annual amortization for IFRS purposes (IAS38 para 88)
• All other intangible assets identified, in accordance with IFRS 3, on acquisition of Pilkington plc amortised over their expected useful lives not exceeding 20 years.
*Amortization arising on the acquisition of Pilkington plc only
Income Statement ForecastAmortization*
The Group has previously amortized the goodwill arising on the acquisition of Pilkington over a 20 year expected useful life.
In addition the Group has also amortized the intangible asset related to the Pilkington brand name over a 20 year expected useful life.
Both these assets and their related amortization arose following the acquisition of Pilkington in June 2006.
For IFRS purposes, these assets are considered to have an indefinite life.
As a result, they are not routinely amortized into the IFRS income statement but are instead tested annually for impairment.
The adjustment on the slide therefore represents a reversal of this amortization. It is assumed that no impairment will arise during FY2011 on these assets.

38
38
(JPY million)
J GAAP Forecast (5,000)
Preferred share dividends (2,310)Convertible bonds – notional discount (290)Reallocations 10
IFRS Forecast (7,590)
• Preferred shares treated as a financial liability in IFRS (IAS32 para 11), with dividend consequently recognized within financial costs (IAS32 para 35)
• Interest arising on notional discount on convertible bonds, representing equity component of conversion feature, deducted retrospectively from value of bonds payable, and then subsequently reversed with a charge to interest costs to the bonds’ maturity date (IAS32 paras 28,29,35)
Income Statement ForecastNon-operating items
As discussed previously, the Group’s outstanding preferred shares have been treated as equity for J GAAP purposes.
However, for IFRS purposes, they are treated as debt, and as a result, the dividend on these shares is charged to finance costs in the income statement.
As set out previously, the Group has retrospectively applied IFRS accounting to convertible bonds.
This involves determining how much of a discount would have been applied to those bonds when issued in 2004 if they had carried no conversion feature.
That discount element is then considered to be the equity component of the bonds, and is therefore classed as such within shareholders equity.
The discount is then unwound with a charge to interest costs over the life of the bond and the adjustment to non-current liabilities represents the discount still to be unwound by the charging of notional interest on the bond.

39
39
(JPY million)
J GAAP Forecast (3,000)
Impairment of capitalized development costs (123)Reallocate to operating income 3,123
IFRS Forecast -
• Capitalized development costs impaired in IFRS, not impaired in J GAAP due to having been previously expensed
• All extraordinary items treated as operating items in IFRS (IAS1 para 87)
Income Statement ForecastExtraordinary items
For IFRS purposes, the Group has impaired some development costs previously capitalized.
As these costs were not capitalized in J GAAP, no impairment was reflected in the J GAAP forecast income statement.
All extraordinary costs, covering matters such as impairments, gains or losses on asset disposals, and other restructuring costs are included within operating income in the IFRS income statement.

40
40
(JPY million)
J GAAP Forecast (2,000)
Deferred tax on intangibles amortization (382)Deferred tax on RBO (1,493)Other tax adjustments (155)
IFRS Forecast (4,030)
• Deferred tax credit resulting from J GAAP intangible amortization charge now removed
• Deferred tax credit resulting from J GAAP allocation of RBO actuarial gains / losses to operating income now removed
Income Statement ForecastTaxation
The adjustments to the forecast taxation charge relate principally to deferred taxation credits taken in the J GAAP forecast income statement on charges that are not recognized in the income statement for IFRS purposes.
The two significant adjustments in this respect relate to the J GAAP amortization of the Pilkington brand, and the allocation of actuarial gains and losses to J GAAP operating income.

41
41
Agenda
• Introduction
• Presentation Objectives
• Implementation Timetable
• Opening balance sheet at 31 March 2010
• Income statement forecast FY2011
• Strategic Management Plan
Now we will finally consider the impact of the Group’s transition to IFRS on the NSG Group Strategic Management Plan issued in November 2010.

42
42
Strategic Management Plan
All Strategic Management Plan financial targets still relevant and appropriate in IFRS
5% CAGR*
DOUBLE, AS A MINIMUM
5% >10%
50% INCREASE, AS A MINIMUM
4.5x <3x
Nil LOW DOUBLE DIGIT %
FY11 FY14
*CAGR = Compound Annual Growth Rate
• SALES
• OPERATING PROFIT(pre-amortization)
• EBITA MARGIN
• EBITDA
• NET DEBT/EBITDA
• RETURN ON EQUITY
No impact on Strategic Management Plan
The slide shows the FY2014 financial targets that the Group set out in its Strategic Management Plan.
The Group confirms that these targets are still appropriate and achievable when measured using IFRS.
This concludes our presentation. Thank you for your time and for your interest in the NSG Group.

43
43
Notice
The projections contained in this document are based on information currently available to us and certain assumptions that we consider to be reasonable. Hence the actual results may differ. The major factors that may affect the results are the economic environment in major markets (such as Europe, Japan, the U.S. and Asia), product supply/demand shifts, and currency exchange fluctuations.
Nippon Sheet Glass Co., Ltd.
The projections contained in this document are based on information currently available to us and certain assumptions that we consider to be reasonable. Hence the actual results may differ. The major factors that may affect the results are the economic environment in major markets (such as Europe, Japan, the U.S. and Asia), product supply/demand shifts, and currency exchange fluctuations.

44