nt plan ard 2013 - state of west virginia plans/2013 compl… · · 2017-01-05ard 2013 nt plan...
TRANSCRIPT

Pre
par
ed b
y t
he
Wes
t V
irgin
ia S
oli
d W
aste
Man
agem
ent
Boar
d
20
13
Wes
t V
irgin
ia S
oli
d W
ast
e
Ma
na
gem
ent
Pla
n
Harpers Ferry, Jefferson County
Board Members:
Tim Blankenship
Roger Bryant
Alice Jo Buzzard
Mallie Combs
Rocco Fucillo
Randy Huffman
Steve Pilato
Mark D. Holstine, P.E., Executive Director
Earl Ray Tomblin, Governor
The 2013 West Virginia Solid Waste
Management Plan emphasizes the
importance of integrated waste
management based on the hierarchy
of:
• Source Reduction
• Reuse
• Recycling
• Landfilling

Solid Waste Management Board
BOARD OF DIRECTORS
Member Title Address Phone Mallie Combs Chair 223 North Main Street, Suite 102, Moorefield, WV 26836 304-530-3047
Roger Bryant Vice Chair 26½ Main Avenue, Logan, WV 25601 304-752-0917
Tim Blankenship Member HC 88 Box 205, Baisden, WV 25608 304-945-7207
Alice Jo Buzzard Member 962 Reid Ridge Road, Cameron, WV 26033 304-686-3383
Steve Pilato Member 122 Keller Avenue, Fayetteville, WV 25840 304-573-1468
Ex. Officio Members
Department of Health & Human Services
Rocco Fucillo Bldg. 3, Rm. 206, 1900 Kanawha Blvd. E., Charleston, WV 25305
304-558-9130
Charles Robinette 350 Capitol Street, Suite 313, Charleston, WV 25301 304-356-4271 Department of Environmental Protection Randy C. Huffman 601 57th Street, SE, Charleston, WV 25304 304-926-0440
Sudhir Patel 601 57th Street, SE, Charleston, WV 25304 304-926-0499
ext. 1278
STAFF
Administration Mark D. Holstine, PE [email protected] ext. 1680
Marsha L. Payton [email protected] ext. 1679
Jayne Ann Arthur [email protected] ext. 1677 Scott Norman [email protected] ext. 1676 Paul F. Hayes [email protected] ext. 1673 Lynn Pugh [email protected] ext. 1660 Recycling, Market Development & Planning Carol Ann Throckmorton [email protected] ext. 1671
Phil Mann [email protected] ext. 1674
Nicole Hunter [email protected] ext. 1116 Business & Financial Assistance Janet J. Borowski [email protected] ext. 1672
Ray Keller [email protected] ext. 1424
West Virginia Solid Waste Management Board 601 57th Street, SE
Charleston, WV 25304 SWMB Main Line: 304-926-0448
Staff Direct Line: 304-926-0499 + ext. Fax: 304-926-0472
Toll Free: 866-568-6649
Cover Photo Courtesy of WV Department of Commerce (www.wvcommerce.org)

Table of Contents
Executive Summary ......................................................................................................................... ES-1 Chapter 1: The West Virginia Solid Waste Management Plan 1.1 West Virginia State Solid Waste Management Plan .................................................................. 1-1 1.2 Mission Statement ...................................................................................................................... 1-2 1.3 State Priority Goals .................................................................................................................... 1-2 1.4 Scope & Purpose ....................................................................................................................... 1-3 1.5 Summary of Agencies’ Responsibilities ..................................................................................... 1-3 Chapter 2: The History and Legal Environment of Solid Waste Management in West Virginia 2.1 Introduction ................................................................................................................................ 2-1 2.2 1993-2013: West Virginia Legislative Changes ......................................................................... 2-2 2.3 Federal Legislation and Interpretation ........................................................................................ 2-7
2.3.1 The Stamp Decision ....................................................................................................... 2-7 2.3.2 Flow Control ................................................................................................................... 2-8
Chapter 3: Efficiencies in Solid Waste Management: Demographics, Transportation and Population & Waste Projections 3.1. Demographics ............................................................................................................................ 3-1 3.2 Geographic and Transportation Factors Influencing Solid Waste Management in West Virginia .................................................................................................... 3-2
3.2.1 Navigable Waterways ..................................................................................................... 3-3 3.2.2 Highways ........................................................................................................................ 3-4 3.2.3 Railways ......................................................................................................................... 3-5
3.3 Wasteshed Analysis ................................................................................................................... 3-6 3.3.1 Wasteshed A .................................................................................................................. 3-8 3.3.2 Wasteshed B ................................................................................................................ 3-10 3.3.3 Wasteshed C ................................................................................................................ 3-12 3.3.4 Wasteshed E ................................................................................................................ 3-14 3.3.5 Wasteshed F ................................................................................................................ 3-16 3.3.6 Wasteshed G ................................................................................................................ 3-18 3.3.7 Wasteshed H ................................................................................................................ 3-20
3.4 MSW Waste Characterization .................................................................................................. 3-22 Chapter 4: Solid Waste Facility Status 4.1 Public vs. Privately Owned Landfills .......................................................................................... 4-1 4.2 Solid Waste Facility Operations ................................................................................................. 4-2
4.2.1 Introduction ..................................................................................................................... 4-2 4.2.2 Acceptance of Non-Municipal Waste ............................................................................. 4-2 4.2.3 Landfill Planning, Reporting and Record Keeping Requirements .................................. 4-4 4.2.4 Capacity Contracts ......................................................................................................... 4-4 4.2.5 Performance Reviews .................................................................................................... 4-4
4.3 Landfill Status – Estimated Lifespan and Potential Impact on Solid Waste Management ......... 4-5 4.4 Consolidation in the Solid Waste Industry ................................................................................ 4-10 4.5 Imports and Exports of Solid Waste ......................................................................................... 4-10 4.6 Summary of Statewide Landfill Closure Plan ........................................................................... 4-13
4.6.1 LCAP Facilities’ Status ................................................................................................. 4-15

4.6.2 LCAP Summary ............................................................................................................ 4-19 4.7 Transfer Stations ...................................................................................................................... 4-19 4.8 Material Recovery Facilities ..................................................................................................... 4-23 4.9 Composting Facilities ............................................................................................................... 4-23 4.10 Free Day .................................................................................................................................. 4-24 4.11 Waste Tire Monofills ................................................................................................................. 4-25 4.12 Discussion and Conclusions .................................................................................................... 4-26 Chapter 5: West Virginia’s County and Regional Solid Waste Authorities 5.1 County and Regional Solid Waste Authority Responsibilities .................................................... 5-1 5.2 Review of SWA Comprehensive and Siting Plans ..................................................................... 5-2 5.3 Summary of County and Regional Plans ................................................................................... 5-3
5.3.1 Wasteshed A .................................................................................................................. 5-3 5.3.2 Wasteshed B .................................................................................................................. 5-4 5.3.3 Wasteshed C .................................................................................................................. 5-6 5.3.4 Wasteshed E .................................................................................................................. 5-7 5.3.5 Wasteshed F .................................................................................................................. 5-8 5.3.6 Wasteshed G .................................................................................................................. 5-8 5.3.7 Wasteshed H ................................................................................................................ 5-10
5.4 Solid Waste Management Board/Solid Waste Authority Coordination ..................................... 5-12 5.5 Solid Waste Management Board Grants .................................................................................. 5-12 Chapter 6: West Virginia’s Recycling Plan 6.1 Introduction ................................................................................................................................ 6-1
6.1.1 State Recycling Goals .................................................................................................... 6-1 6.1.2 Recycling Planning ......................................................................................................... 6-1
6.2 Recycling Problems Specific to West Virginia ............................................................................ 6-2 6.2.1 Population Density ......................................................................................................... 6-2 6.2.2 Marketing and Management Problems for Small Recycling Centers ............................. 6-3 6.2.3 Lack of Immediate Markets for Materials ....................................................................... 6-3 6.2.4 Public vs. Private Recycling Centers .............................................................................. 6-4 6.2.5 Lack of Incentives in the System .................................................................................... 6-4
6.3 Market and Infrastructure Development ..................................................................................... 6-4 6.3.1 Recycling Potential Analysis .......................................................................................... 6-4 6.3.2 Material Markets ............................................................................................................. 6-5
6.4 Recycling and Marketing Restricted or Difficult to Manage Materials ........................................ 6-9 6.4.1 Electronic Waste ............................................................................................................ 6-9 6.4.2 Household Hazardous Waste ....................................................................................... 6-10
6.5 Innovative Incentives and Strategies for Recycling .................................................................. 6-10 6.5.1 Effective Program Strategies ........................................................................................ 6-10 6.5.2 Regionalization ............................................................................................................. 6-11
6.6 Outreach and Public Education ................................................................................................ 6-11 6.6.1 West Virginia Recycles ................................................................................................. 6-12 6.6.2 West Virginia Materials Exchange ................................................................................ 6-12
6.7 Roles and Responsibilities ....................................................................................................... 6-12 6.7.1 County Responsibilities ................................................................................................ 6-12 6.7.2 Municipal Responsibilities ............................................................................................ 6-12 6.7.3 Solid Waste Management Board .................................................................................. 6-12 6.7.4 Department of Environmental Protection ..................................................................... 6-13

6.7.5 Public Service Commission .......................................................................................... 6-13 6.7.6 West Virginia University Extension Service .................................................................. 6-13 6.7.7 West Virginia Division of Energy .................................................................................. 6-13
6.8 Funding .................................................................................................................................... 6-13 Chapter 7: Special Waste 7.1 Hazardous Waste ....................................................................................................................... 7-1
7.1.1 WV Hazardous Waste Rule, 33CSR20 .......................................................................... 7-1 7.2 Household Hazardous Waste (HHW) ........................................................................................ 7-1
7.2.1 Household Chemicals .................................................................................................... 7-1 7.2.2 Used Motor Oil ............................................................................................................... 7-3
7.3 Municipal Sewage Sludge Disposal ........................................................................................... 7-3 7.4 Agricultural Wastes .................................................................................................................... 7-4 7.5 Pollution Control Residuals ........................................................................................................ 7-5 7.6 Mining Wastes ............................................................................................................................ 7-6 7.7 Industrial Wastes ........................................................................................................................ 7-6 7.8 White Goods (Household Appliances) ....................................................................................... 7-7 7.9 Bulky Goods Collection .............................................................................................................. 7-8 7.10 Tires ....................................................................................................................................... 7-8 7.11 Lead Acid Batteries .................................................................................................................. 7-10 7.12 Yard Waste .............................................................................................................................. 7-10 7.13 Universal Wastes ..................................................................................................................... 7-10 Chapter 8: Solid Waste Disposal Fees 8.1 Assessment Fees ....................................................................................................................... 8-1 8.2 Allocation and Use of Assessment Fee Funds .......................................................................... 8-3
8.2.1 Fee Distribution by Program ........................................................................................... 8-5 8.3 Miscellaneous Assessment Fees ............................................................................................... 8-6
8.3.1 County Solid Waste Assessment Fee ............................................................................ 8-6 8.3.2 Groundwater Protection Act Fee – DEP ......................................................................... 8-6
8.4 Litter Control Programs .............................................................................................................. 8-6 8.4.1 Highway Litter Control Fund ........................................................................................... 8-6 8.4.2 Department of Environmental Protection ....................................................................... 8-7 8.4.3 A. James Manchin Fund ................................................................................................. 8-7
Chapter 9: Economic Impact of Municipal Solid Waste Management in West Virginia 9.1 Executive Summary ................................................................................................................... 9-1 9.2 Jobs ....................................................................................................................................... 9-1 9.3 Direct Impact .............................................................................................................................. 9-2 9.4 Indirect Impact ............................................................................................................................ 9-4 9.5 Induced Impact ........................................................................................................................... 9-4 9.6 Waste and Scrap Exports .......................................................................................................... 9-5

Appendices Appendix A: Solid Waste Management Board Grants 2013 SWMB Grants .............................................................................................................................. A-1 2012 SWMB Grants .............................................................................................................................. A-2 2011 SWMB Grants .............................................................................................................................. A-3 1991-2010 SWMB Grants ..................................................................................................................... A-5 Appendix B: DEP-REAP Recycling Assistance Grant Overview 2012 DEP-REAP Recycling Assistance Grants .................................................................................... B-1 2011 DEP-REAP Recycling Assistance Grants .................................................................................... B-3 2010 DEP-REAP Recycling Assistance Grants .................................................................................... B-5 Appendix C: DEP-REAP Covered Electronic Devices (CED) Grant Overview 2012 DEP-REAP CED Grants .............................................................................................................. C-1 2011 DEP-REAP CED Grants .............................................................................................................. C-3 2010 DEP-REAP CED Grants .............................................................................................................. C-5 Appendix D: Solid Waste Authority Recycling Survey/Analysis: CY 2011 Wasteshed A: Recycling Survey ........................................................................................................... D-2 Wasteshed A: Recycling Analysis ......................................................................................................... D-4 Wasteshed B: Recycling Survey ........................................................................................................... D-6 Wasteshed B: Recycling Analysis ....................................................................................................... D-10 Wasteshed C: Recycling Survey ......................................................................................................... D-12 Wasteshed C: Recycling Analysis ...................................................................................................... D-14 Wasteshed E: Recycling Survey ......................................................................................................... D-16 Wasteshed E: Recycling Analysis ....................................................................................................... D-18 Wasteshed F: Recycling Survey ......................................................................................................... D-20 Wasteshed F: Recycling Analysis ....................................................................................................... D-21 Wasteshed G: Recycling Survey ........................................................................................................ D-23 Wasteshed G: Recycling Analysis ...................................................................................................... D-25 Wasteshed H: Recycling Survey ......................................................................................................... D-27 Wasteshed H: Recycling Analysis ...................................................................................................... D-30 Mandated Municipality Recycling Survey ........................................................................................... D-32 Mandated Municipality Recycling Summary ....................................................................................... D-35 Solid Waste Authority: 2011 Recycling Survey Summary .................................................................. D-36 Appendix E: Recycle Infrastructure and Market Development in Other States West Virginia: Recycle Market Development ........................................................................................ E-1 Kentucky: Recycling Market Development ........................................................................................... E-2 Maryland: Recycle Market Development .............................................................................................. E-2 North Carolina: Recycle Market Development ...................................................................................... E-4 Ohio: Recycle Market Development ..................................................................................................... E-5 Pennsylvania: Recycle Market Development ........................................................................................ E-6 Virginia: Recycle Market Development ................................................................................................. E-7

List of Figures Figure 3-1 West Virginia Population Changes (1960-2010) ............................................................ 3-1 Figure 3-2 Geographic Location ...................................................................................................... 3-2 Figure 3-3 Navigable Waterways ..................................................................................................... 3-3 Figure 3-4 Interstates & US Highways ............................................................................................. 3-4 Figure 3-5 Principal Railroads ......................................................................................................... 3-5 Figure 3-6 Population Projections 2015 through 2035 for Wasteshed A ......................................... 3-8 Figure 3-7 Population Projections 2015 through 2035 for Wasteshed B ....................................... 3-10 Figure 3-8 Population Projections 2015 through 2035 for Wasteshed C ....................................... 3-12 Figure 3-9 Population Projections 2015 through 2035 for Wasteshed E ....................................... 3-14 Figure 3-10 Population Projections 2015 through 2035 for Wasteshed F ....................................... 3-16 Figure 3-11 Population Projections 2015 through 2035 for Wasteshed G ...................................... 3-18 Figure 3-12 Population Projections 2015 through 2035 for Wasteshed H ....................................... 3-20 Figure 3-13 Wasteshed H Composition – 1997 GAI Study ............................................................. 3-23 Figure 3-14 National Average Waste Stream Composition – 2010 US EPA Study ......................... 3-23 Figure 6-1 Glass Prices – Average Price Per Ton (January 2009 – January 2012) ........................ 6-6 Figure 6-2 Ferrous Metal Prices – Average Price Per Ton (January 2009 – January 2012) ........... 6-7 Figure 6-3 Fiber Prices – Average Price Per Ton (January 2009 – January 2012) ......................... 6-8 Figure 6-4 Aluminum/Plastic Prices – Average Price Per Ton (January 2009 – January 2012)...... 6-8 Figure 8-1 Solid Waste Assessment Fees Distributed by Agency ................................................... 8-4 Figure 8-2 Solid Waste Assessment Fees Distributed by Program ................................................. 8-4 Figure 8-3 Solid Waste Assessment Distribution ............................................................................. 8-6 Figure 9-1 2011 Average Annual Income for Selected Occupational Sectors ................................. 9-2 Figure 9-2 Solid Waste Authority Recycling Tonnage by Wasteshed ............................................ 9-4

List of Tables Table 3-1 Projected Monthly Municipal Solid Waste Tonnage for Wasteshed A............................ 3-8 Table 3-2 CY 2011 Waste Stream Composition for Wasteshed A ................................................. 3-9 Table 3-3 Projected Monthly Municipal Solid Waste Tonnage for Wasteshed B.......................... 3-10 Table 3-4 CY 2011 Waste Stream Composition for Wasteshed B ............................................... 3-11 Table 3-5 Projected Monthly Municipal Solid Waste Tonnage for Wasteshed C ......................... 3-12 Table 3-6 CY 2011 Waste Stream Composition for Wasteshed C ............................................... 3-13 Table 3-7 Projected Monthly Municipal Solid Waste Tonnage for Wasteshed E.......................... 3-14 Table 3-8 CY 2011 Waste Stream Composition for Wasteshed E ............................................... 3-15 Table 3-9 Projected Monthly Municipal Solid Waste Tonnage for Wasteshed F .......................... 3-16 Table 3-10 CY 2011 Waste Stream Composition for Wasteshed F ............................................... 3-17 Table 3-11 Projected Monthly Municipal Solid Waste Tonnage for Wasteshed G ......................... 3-18 Table 3-12 CY 2011 Waste Stream Composition for Wasteshed G ............................................... 3-19 Table 3-13 Projected Monthly Municipal Solid Waste Tonnage for Wasteshed H ......................... 3-20 Table 3-14 CY 2011 Waste Stream Composition for Wasteshed H ............................................... 3-21 Table 3-15 GAI and EPA Study Comparisons for Waste Stream Composition .............................. 3-22 Table 4-1 Public & Private Landfills in West Virginia ...................................................................... 4-1 Table 4-2 Non-Municipal Waste Accepted at West Virginia Landfills ............................................. 4-3 Table 4-3 Operational Landfills ....................................................................................................... 4-5 Table 4-4 Solid Waste Exported to Out-Of-State Landfills: 2011 ................................................. 4-11 Table 4-5 Solid Waste Imported to West Virginia: 2011 ............................................................... 4-11 Table 4-6 MSW Landfills within 75 Miles of West Virginia that Accept Out-Of-State Waste ........ 4-12 Table 4-7 Non-Operational Landfills ............................................................................................. 4-14 Table 4-8 Operational Transfer Stations ...................................................................................... 4-20 Table 4-9 Registered Commercial and Active Composting Facilities ........................................... 4-24 Table 4-10 Free Day Tonnage Received at West Virginia Landfills ............................................... 4-25 Table 4-11 Operational Tire Monofills in West Virginia .................................................................. 4-26 Table 6-1 Recycling Potential in West Virginia ............................................................................... 6-5 Table 6-2 Recycling Potential in West Virginia: Sensitivity Analysis .............................................. 6-5 Table 8-1 Dedication of Proceeds of the Solid Waste Assessment Fees (Revised July 1, 2005) .................................................. 8-2 Table 8-2 Solid Waste Assessment Fee Distribution by Program (FY 2010-2012) ........................ 8-5 Table 9-1 Employment Data: 2011 West Virginia Municipal Solid Waste Employment Analysis ................................................................. 9-2 Table 9-2 NAICS 910, West Virginia Waste and Scrap Exports .................................................... 9-6

List of Maps Map 3-1 West Virginia Wasteshed Map ....................................................................................... 3-7 Map 4-1 Operational Landfills ....................................................................................................... 4-6 Map 4-2 Non-Operational Landfills ............................................................................................. 4-15 Map 4-3 Operational Transfer Stations ...................................................................................... 4-21

Executive Summary

ES - 1 Executive Summary
Executive Summary
Prior to the mid-1970s, solid waste collection and disposal in West Virginia was largely uncontrolled. Waste management was accomplished by creating municipal dumps, with the idea of isolating pollution to a few large areas. In many instances, waste was being burned in open dumps to reduce the volume. This method of solid waste “management” often resulted in the degradation of surface and groundwaters that could have a detrimental effect on domestic and industrial water supplies. The purpose of developing this Plan is to: 1. Meet the requirements of W. Va.
Code § 22C-3-7. 2. Comply with U.S. Environmental
Protection Agency (USEPA) regulatory requirements for state plans found in 40 Code of Federal Regulations (CFR), Part 256, Subparts a-f.
3. Ensure that an adequate capacity of environmentally protective solid waste disposal facilities exists to meet the needs of the people of West Virginia.
4. Determine state actions required to meet the reduction and recycling goals, and other solid waste management policies.
5. Provide guidance to local solid waste authorities and municipalities in meeting the state and local planning goals and solid waste management policies, through the implementation of integrated solid waste management programs. The planning horizon covered by this document extends to the year 2033. In accordance with the code, the plan is to be updated every two years.
Chapter 1, The West Virginia Solid Waste Management Plan Chapter 1 discusses the history of solid waste management in West Virginia. West Virginia’s goals and objectives in relation to the management of solid waste are discussed. Responsibility for the creation, application, and enforcement of the State’s goals, objectives, rules, and law are divided among several agencies. The individual responsibilities of the Solid Waste Management Board, Department of Environmental Protection, Division of Natural Resources, and Public Service Commission are explained. Chapter 2, History and Legal Environment of Solid Waste Management in West Virginia Chapter 2 discusses solid waste legislation put into place since the Resource Conservation and Recovery Act of 1976. We examine the effects it had on West Virginia’s waste management systems. Also noted are changes resulting from judicial review and how that impacts the day to day operations of the solid waste industry in both the state and region. Chapter 3, Efficiencies in Waste Management: Demographics, Transportation & Population and Waste Projections Population and demographic changes, and transportation infrastructure are discussed in relation to waste management in West Virginia. Topics include waste management in relation to highways, railways, and waterways. West Virginia’s proximity to significant population centers on the east coast and the likelihood of various entities targeting the state for disposal of out-of-state waste are also discussed. Population and waste projections for West Virginia over the next twenty years are offered on a county, watershed, and statewide basis. These projections are intended to provide an effective planning tool for both local and state planners to ensure that adequate landfill

ES - 2 Executive Summary
airspace exists to accommodate state and other waste needs over the next twenty years. Waste stream composition tables are included to provide local planners with information on the need regarding disposal of industrial, construction and demolition, and other types of special waste that go into the state’s landfills. Chapter 4, Solid Waste Facilities Status As of September 1, 2011, West Virginia had 18 Municipal Solid Waste (MSW) landfills, and 18 transfer stations in operation serving all areas of the state. Over the last three years these facilities have taken in an average of 1,852,000 tons of wastes per year. Of that, 1,177,000 tons or about 64% is classified as municipal solid waste. Most of the balance is classified as “special waste” by the DEP and includes industrial waste, industrial sludges, petroleum contaminated soil, asbestos, and other materials appropriate to this classification. This type of waste is allowed in municipal solid waste landfills through a minor modification of their DEP permit.
In assessing disposal needs and projecting revenues that support solid waste management programs, it is imperative to identify the movement of solid waste into and out of the State. In 2011, the State exported 378,879 tons of waste, and imported 184,898 tons creating a positive export balance of 193,981 tons. That equates to a loss of $1,600,343 in assessment fees, adversely impacting most of the State’s environmental programs. The current status of facilities accepted into the state’s Landfill Assistance Closure Program (LCAP) is presented in detail. All facilities; including operational and nonoperational landfills, and transfer stations are described in narrative form and mapped for the readers’ convenience. The role of composting in solid waste management continues to be important. There are currently 4 permitted commercial
composting facilities and 20 registered composting activity facilities in WV. Chapter 5, West Virginia’s County and Regional Solid Waste Authorities The importance of the State’s fifty local Solid Waste Authorities (SWAs) to the present and continued operation of West Virginia’s municipal solid waste control system is discussed in detail. The authorities have complete responsibility for local solid waste planning. Each authority must have an approved Comprehensive Litter and Solid Waste Control Plan and a Commercial Solid Waste Facility Siting Plan on file with the Solid Waste Management Board. Both of these plans cover a 20 year planning horizon and must be updated every 5 years. The authority must approve the siting of all commercial solid waste facilities in their area of responsibility and provide an updated siting plan each time a siting change is made. Chapter 5 also provides a short abstract of each authority’s most current comprehensive and siting plans. The SWAs were given the authority by the legislature to own and operate solid waste facilities. Eight of the state’s eighteen landfills and five of the state’s eighteen transfer stations are owned by the Solid Waste Authorities. The authorities also own and manage many of the state’s recycling collection programs and material processing centers. The Solid Waste Authorities are the lead local agency in bringing State level resources to West Virginia’s counties. These resources include, but are not limited to, SWMB grants, DEP-REAP Recycling grants, DEP-PPOD and Make It Shine (highway, stream, countywide) cleanup efforts, and open dump removal. Chapter 6, West Virginia’s Recycling Plan The West Virginia Recycling Act established recycling goals that would reduce the per capita disposal of solid waste 50% by January 1, 2010. Lacking a reliable reporting system, it is impossible to determine an actual “recycling

ES - 3 Executive Summary
rate” for the state. However, based on societal factors, including increased product packaging, growth in population and the influx of electronic waste into the waste steam it is almost certain we have not met our 2010 goal. This document examines every facet of recycling in West Virginia, closely looking at the problems inherent to recycling in thinly populated rural areas as well as more urbanized environments. It also evaluates the degree to which current recycling efforts have been successful. The predominant conclusion is that recycling in West Virginia will continue to be challenging, and changes in the system need to be considered. West Virginia’s Recycling Plan, assesses the State legislative goals and discusses the problems in the current system. The following subjects are examined in depth:
The concept of recycling goals is discussed in detail. The need to restructure goals, and bring goals into more realistic parameters is noted.
Problems specific to recycling in West Virginia are detailed and options for change are discussed.
New and innovative ideas, and incentives to promote residential and commercial recycling are examined.
Incentives to facilitate the building of recycling infrastructure, and to encourage manufacturers to use recycled feedstock in their processes are covered. Various options are described and discussed.
Currently, there are no reporting requirements that effectively measure recycling in West Virginia. A system should be created which requires annual county level reporting to the State on recycling activities. Reports should include tonnages recycled, materials recycled, revenue earned, and jobs created. Information on recycling activities by residents, business,
industry, and by government entities should be collected annually.
Options to support the regionalization concept in recycling are discussed. Regionalization should be more thoroughly examined, and steps taken to design and implement a more effective and organized system should be explored.
A waste characterization study for urban and rural areas was completed in 1997. The data from that study is out-dated. The study should be repeated.
The chapter provides a discussion of problems in collecting and recycling difficult or restricted waste with a focus on household hazardous waste.
Funding problems are a significant issue in recycling and are a topic of this chapter.
Chapter 7, Special Waste Chapter 7 discusses Hazardous Waste. Hazardous waste has been regulated since 1976 by the Federal Resource Conservation and Recovery Act (RCRA). The regulations that define and govern management of hazardous waste are codified in 40 CFR, Protection of the Environment.
W. Va. Code § 22-18 is the Hazardous Waste Management Act. The Secretary of the DEP has the responsibility for the promulgation of rules. The DEP, Division of Water and Waste Management (DWWM), is the enforcement agency in the regulation of hazardous waste.
Subjects covered under special waste include, household hazardous waste, sewage sludge, agricultural waste, pollution control residuals, mining waste, industrial waste, bulky goods, and tires.
Chapter 8, Solid Waste Disposal Fees West Virginia imposes an $8.25 assessment fee on each ton of waste going into the state’s landfills. The funds collected by the assessment fee go to the Division of Natural Resources, the Solid Waste Management Board, and the
ES - 4 Executive Summary
Department of Environmental Protection. These funds are used for some of the state’s most important environmental programs. Chapter 8 discusses the distribution of these funds, the amount of funding going to each agency, the programs funded, and other miscellaneous fees associated with solid waste control. Chapter 9, Economic Impact of Municipal Solid Waste Management in West Virginia The proper management of municipal solid waste provides a significant and measurable boost to the state through job creation, and contributes millions of dollars to the state’s economy annually. For instance:
West Virginia’s landfills, transfer stations, waste haulers, and recycling centers paid out approximately $73.6 million dollars in wages in 2011.
These same organizations and businesses maintained at least 2,078 jobs during the same period.
Salaries and wages in waste management compare favorably to other relevant employment sectors ranging from a weekly salary of $642 to $750, compared to a weekly salary of $456 in the retail sector.
Conclusions Although West Virginia and the local SWAs have stepped up their solid waste management activities in recent years, there is still much to be done to meet the objectives of recent solid waste management legislation, and to effectively manage solid waste. The purpose of the WV Solid Waste Management Plan is to identify what actions still need to be taken and who should take them. An integrated solid waste management system, which includes source reduction, reuse and recycling is essential to reduce waste and preserve landfill capacity. Continued reliance on landfills as the sole disposal method will not solve the solid waste management problems.
West Virginia must comply with USEPA regulations (40 CFR, Part 256, Subparts A-G), which require that state’s look at alternative methods including source reduction, reuse, recycling, and materials recovery. If West Virginia and its local SWAs continue to make progress toward the goals contained in this Plan, the State will be successful in managing its solid waste in a manner that protects public health, the environment and reduces the waste stream destined for disposal.

Chapter 1
The West Virginia Solid Waste Management Plan

1-1
Chapter 1: The West Virginia Solid Waste Management Plan
Chapter 1: The West Virginia Solid Waste Management Plan 1.1 West Virginia State Solid Waste Management Plan The purpose of developing the Solid Waste Management Plan is to:
1. Meet the requirements of W. Va. Code § 22C-3-7.
2. Comply with USEPA regulatory requirements for state plans found in 40 CFR, Part 256, Subparts A-G.
3. Ensure that adequate capacity of environmentally protective solid waste disposal facilities exist to meet the needs of the people of West Virginia.
4. Determine state actions required to meet the state’s reduction and recycling goals, and other solid waste management policies.
5. Provide guidance to local solid waste authorities and municipalities in meeting the state goals and solid waste management policies through implementation of integrated solid waste management programs. The planning horizon covered by this document extends to the year 2033. The plan is to be updated every two years in accordance with W. Va. Code § 22C-3-7.
The first step in developing a solid waste management plan for West Virginia is to determine the amount of solid waste generated in the state, and to project the amounts that will be generated based on current, as well as, projected population levels. Some differences in the solid waste stream and management alternatives can be attributed to geographic region and population densities. As a result, for the purposes of analysis and since they already exist, all counties in the state are grouped and analyzed on the basis of wastesheds. First established in 1978, wastesheds are those areas which have common solid waste
management problems and are appropriate units for planning solid waste management. This plan will also inventory existing solid waste management facilities plus assess their capacities and the likelihood of their continued operation into the planning horizon. It will identify current wasteshed tonnage capacities and project the available wasteshed tonnage capacities. Also, it will compare these capacities with waste generation rates at the beginning and end of the planning horizon. The plan will also identify the size, location and ownership of the remaining landfills, then analyze these factors in determining whether they meet the solid waste management needs of the state. If the only method of solid waste management being considered for West Virginia’s future were landfilling, an estimate of the quantity of waste currently being disposed of and projected quantities for the future would be adequate for solid waste management planning. However, on the West Virginia hierarchy of solid waste management options, landfilling is the last alternative. Reduction, recycling, and reuse are preferred. The state is evaluating the current environment and investigating alternative methods to landfilling. It is necessary to have a detailed understanding of the characterization of waste quantities and composition during these planning and implementation phases. The purpose of characterizing the composition of the waste generated is to assist in the planning of programs and facilities in agreement with the hierarchy of solid waste management alternatives established for West Virginia. A general characterization is sufficient to identify strategies and opportunities for future waste management on a statewide level. However, it is valuable to assess the quantity and composition data that is currently available in

1-2 Chapter 1: The West Virginia Solid Waste Management Plan
West Virginia and devise a strategy to support more detailed planning efforts in the future.
The plan will examine existing practices of collection, reduction, recycling, reuse, composting, and disposing of solid waste and managing special wastes, to the extent the data is available. Based on the information about the tonnage of waste disposed and the tonnage recycled, this assessment will characterize the current waste stream and make projections about the future waste stream. The second step in the development of a state solid waste management plan involves the identification, discussion, and analysis of current state programs (legislation) for solid waste management. This includes an evaluation of resources, program elements, and responsibilities in order to assess the needs of the state. In addition to an identification of goals, this step will include a discussion of issues and actions required to meet those goals.
It should be understood that the planning recommendations presented in this document are oriented toward the achievement of strategic long term goals. Many of these goals can be found in state enabling legislation. These recommendations may appear to conflict with more short term or tactical recommendations advanced by other operating agencies responsible for day-to-day management of solid waste. However, it is important to be aware that one can arrive at a single destination via several routes and/or detours. Consideration and integration of several strategies will likely yield a better system for solid waste management. 1.2 Mission Statement To provide guidance and direction to the state, county and municipal governments in:
• Protecting the public health and welfare by establishing a comprehensive
program of solid waste collection, processing, recycling, and disposal to be implemented by State and local government in cooperation with the private sector.
• Assisting in the planning and implementation of effective recycling programs.
Reducing our solid waste management problems by establishing programs and plans based on an integrated waste management hierarchy.
1.3 State Priority Goals It is the responsibility of the state to provide adequate, concise, realistic, and environmentally appropriate rules for siting, design, construction, and operation of all solid waste management facilities. It is the responsibility of the solid waste authorities and municipalities, with the state’s assistance and guidance, to determine which method of solid waste management is economically feasible, health conscious, and environmentally sound for their particular community. The primary objective of developing and implementing a comprehensive state plan should be to protect the public safety, health and welfare of its citizens by:
• Providing for the safe and sanitary disposal of solid waste from all residential, commercial, and industrial sources.
• Reducing the degradation of both ground and surface waters by eliminating open dumps, the promiscuous discarding of solid waste, and other deleterious methods of solid waste disposal.
• Eliminating the harborage and breeding places of insects and rodents that carry disease, or are otherwise injurious to the public health, safety, and welfare.
• Reducing the volume of recyclable materials entering the waste disposal stream.

1-3
Chapter 1: The West Virginia Solid Waste Management Plan
• Increasing the property values and restoring the natural beauty of the state by removing unsightly litter and open dumps from roadsides, streams, and other public places.
In order to accomplish these objectives, goals must be identified which are based on policies created through legislation that are consistent with the hierarchy of decision making in an integrated solid waste management program. 1.4 Scope & Purpose
1. To reduce the amount, by weight, of solid waste disposed of at municipal solid waste disposal facilities through source reduction, recycling, reuse and composting on a statewide per capita basis.
2. To ensure that an adequate capacity of environmentally protective solid waste disposal facilities exists to meet the needs of the people of West Virginia.
3. To establish guidance, standards, rules and permitting requirements for reduction, recycling, reuse, and composting programs, and facilities that will promote these practices.
4. To develop and implement educational programs that increase the awareness and understanding of the need to effectively reduce and manage solid waste among state officials, solid waste professionals, local government decision makers, educators, business and industry personnel, the general public, and students.
5. To develop solid waste reduction plans and increase the amount of materials recycled from state, county, municipal agencies, organizations, and colleges.
6. To institute requirements, procedures, and guidance that result in the implementation of local integrated solid waste management programs including appropriate management methods to
deal with all components of the solid waste stream.
7. To establish technical assistance programs to increase recycling, reuse and composting by local governments, private industry, commercial businesses, and the general public.
8. To establish and locate adequate and sustainable markets for materials recovered from the solid waste stream and educate administrators of local programs about marketing the materials.
9. To ensure adequate and stable funding for the state solid waste management programs.
10. To reduce littering and illegal dumping of solid waste in West Virginia.
11. To establish mandatory solid waste collection systems in West Virginia.
1.5 Summary of Agencies’ Responsibilities Department of Environmental Protection (DEP) Within the DEP the following areas are involved in solid waste management: the Division of Water and Waste Management (DWWM), the Office of Environmental Remediation through the Landfill Closure Assistance Program (LCAP) and Rehabilitation Environmental Action Plan (REAP), and Environmental Enforcement (EE). EE enforces those regulations promulgated by the DWWM. A single permit is required by W. Va. Code § 22-15, The Solid Waste Management Act, for operation of a solid waste facility. This permit must be issued in compliance with W. Va. Code § 22-11, The Water Pollution Control Act, and consists of two parts: one requiring the review and approval of the DWWM and the other which incorporates the National Pollutant Discharge Elimination System (NPDES) requirements. The DWWM is primarily responsible for the comprehensive permitting of solid waste

1-4 Chapter 1: The West Virginia Solid Waste Management Plan
facilities. When applications for permits are
received, with the exception of Class F
(industrial solid waste disposal) facilities, the
DWWM reviews them for completeness,
accuracy, checks for unfinished pre-requisites,
and investigates the background information of
persons associated with the operations. Once a
facility is permitted, the DWWM oversees
construction and/or renovation in accordance
with regulations, permits and laws. If the need
arises, the DWWM makes recommendations for
legislative and regulatory changes, and the
DWWM prepares preliminary drafts of
regulations for public review. The DWWM is
responsible for the discharge portion of the
permit.
The Office of Environmental Remediation
operates the Landfill Closure Assistance
Program (LCAP), as well as, REAP programs
such as the Pollution Prevention and Open
Dump program (PPOD). LCAP provides landfill
closure assistance to the permittees of landfills
which were required to close pursuant to certain
closure deadlines. PPOD promotes cleanups
and prevention practices that help to eliminate
open dumps.
The DWWM also serves as a data resource
center. They accumulate various records and
reports such as monthly and yearly tonnage
reports. Across the state, the DWWM is
responsible for permitting (open and closed)
sanitary landfills (Class A, B & C), for
compliance with stormwater and leachate
control requirements. Initially, general permits
were issued to those facilities without discharge.
The Office of Waste Management (OWM), within
the DWWM, is responsible for completing site
specific permits which enforce solid waste rules
on lined ponds and sediment basin sizing. The
DWWM issues WV/NPDES Water Pollution
Control Permits for industrial and domestic
wastewater discharges, and develops permit
requirements for wastewater disposal systems
for solid waste facilities. The OWM currently
permits industrial solid waste facilities in
compliance with the requirements of W. Va.
Code § 22-11, 22-12 and 22-15. A single Solid
Waste/NPDES Water Pollution Control Permit is
issued by DWWM for these facilities.
Environmental Enforcement (EE) is responsible
for performing inspections and sampling to
determine the compliance status of facilities
permitted by the DWWM. They also provide
compliance assistance to the regulated
community through informal consultations with
staff members, training classes, “how-to”
manuals, referrals to federal, state, and private
industry resources, and by conducting pre-
closure inspections of industrial facilities.
EE utilizes criminal, civil and/or administrative
enforcement procedures to compel compliance
when necessary. They investigate citizen’s
complaints related to point and non-point water
pollution (non-coal), solid waste management,
open dumps, and industrial and construction
stormwater and groundwater concerns.
REAP is also involved in solid waste
management through participation in the Make It
Shine program, Adopt-A-Highway, Operation
Wildflower, Recycling Assistance Grants, Litter
Control Grants, Covered Electronic Device
Grants, Annual Educational Conference on Litter
Control and Solid Waste Management and West
Virginia litter laws.
Make It Shine is a comprehensive program
involving state, local governments, business,
industry, and local community organizations
working together to keep West Virginia clean
through cleanup, recycling, education, law
enforcement, and waste reduction. The program
aspires to encourage West Virginians to make a
personal commitment and take pride in our
natural resources.

1-5
Chapter 1: The West Virginia Solid Waste Management Plan
The Recycling Assistance Grants are funds generated by a recycling assessment fee levied and imposed upon the disposal of solid waste at all solid waste disposal facilities in this state. The majority of the funds are disbursed in grants to assist municipalities and counties in the planning and implementation of recycling programs, public education programs, and recycling market procurement efforts. Registration fees collected from electronic manufacturers are used to fund the Covered Electronic Grants Program. The structure of the fees is on a diminishing scale so the fund will remain static or begin shrinking in future grant cycles. Municipalities, county commissions, or county solid waste authorities are eligible to apply for these grants.
The Litter Control Grant is a matching fund that assists municipalities and county government agencies with community cleanup along with litter enforcement projects. Funding is provided for this grant through litter fines imposed on those who violate state litter laws.
The Association of West Virginia Solid Waste Authorities, REAP, and other sponsors host the annual Educational Conference on Litter Control and Solid Waste Management. Division of Natural Resources (DNR) DNR conservation officers are involved in solid waste management through enforcement of litter laws. A portion of the officer’s salary is paid through solid waste assessment fees. Public Service Commission (PSC) The PSC can grant or deny a Certificate of Need (CON) which is a permit required for construction, operation, and expansion of a commercial solid waste facility. In considering whether to grant a Certificate of Need, the commission considers the following:
• The total tonnage of solid waste, regardless of geographic origin, that is
likely to be delivered each month to the facility if the certificate is granted.
• The current capacity and lifespan of other solid waste facilities that are likely to compete with the applicant’s facility.
• The lifespan of the proposed or existing facility.
• The cost of transporting solid waste from points of generation to the disposal facility.
• The impact of the proposed or existing facility on needs and criteria contained in the statewide solid waste management plan.
• Any other criteria which the commission regularly utilizes in making such determinations.
The PSC may deny a Certificate of Need based upon one or more of the following:
1. The proposed capacity is unreasonable in light of the total tonnage of solid waste that is likely to be delivered each month to the facility if the certificate is granted.
2. The location of the facility is inconsistent with the statewide solid waste management plan.
3. The location of the facility is inconsistent with any applicable county or regional solid waste management plan.
4. The proposed facility is not reasonably cost effective in light of alternative disposal sites.
5. The proposal, taken as a whole, is inconsistent with the needs and criteria contained in the statewide solid waste management plan.
6. The proposal, taken as a whole, is inconsistent with the public convenience and necessity.
Additional responsibilities of the PSC include the establishment and enforcement of rates and fees charged by commercial solid waste facilities and private waste haulers.

1-6 Chapter 1: The West Virginia Solid Waste Management Plan
Solid Waste Management Board (SWMB) The SWMB is the coordinator between the Solid Waste Authorities (SWAs) and other state agencies in the area of solid waste management. The Board is composed of seven members. The Secretary of the Department of Health and Human Resources (DHHR), the Secretary of the DEP, or their designees, are members ex officio. The other five members are appointed by the Governor, by and with the advice and consent of the Senate; two appointees having three years of professional experience in solid waste management, civil engineering or regional planning and three appointees who are representatives of the general public. One of the major duties of the SWMB staff includes providing technical assistance to the county and regional SWAs in the preparation, review, implementation, and update of their Comprehensive Litter and Solid Waste Control Plans, and Commercial Solid Waste Facility Siting Plans. Rules have been established in the development of those plans that are consistent with the legislation. If an authority fails to submit a plan, the SWMB staff must develop a plan for that local or regional SWA. The SWMB operates a grant program solely for solid waste authorities. The program is funded by a portion of the solid waste assessment fee and can be used by SWAs to help them achieve their statutory responsibilities as sited in 54-3 Code of State Rules. A Business and Financial Assistance Section program was funded in the 1998 legislative session to provide assistance to those SWAs and other public entities that operate solid waste facilities. The SWMB was directed to monitor public facilities that have received loans, loan guarantees, or grants from the state in order to ensure proper use of funds, as well as, the implementation of sound business practices in the operation of their facilities.
The objective is to build viable entities and eliminate the need for an eleventh hour financial bailout to keep operations going. The Legislature established a pro-active program that detects small problems early and seeks solutions before they become larger. The program has been operational since January 1999. In 2005, the legislature, through House Bill 3356, gave the SWMB the responsibility of developing performance measures for and conducting performance reviews of solid waste authorities. Through initiatives in research and development, the SWMB has prepared a comprehensive program for proper handling of yard waste and lead acid batteries. Additionally, a tire program has been completed, as well as, a comprehensive program to provide for the proper handling of covered electronic devices. For the extensive state outlook, the SWMB has the responsibility of preparing an overall state plan for the proper management of solid waste which incorporates the county and regional plans. The Board completed a study in 1997 entitled, “Solid Waste Characterization Study for Wasteshed F and Wasteshed H in West Virginia.” All of these documents can be viewed at www.state.wv.us/swmb/.

Chapter 2
The History and Legal Environment of Solid Waste Management in
West Virginia
2-1 Chapter 2: The History and Legal Environment of Solid Waste Management in West Virginia
Chapter 2: The History and Legal Environment of Solid Waste Management in West Virginia 2.1 Introduction To understand the present state of solid waste management in West Virginia it is important to understand the past and what brought us to where we are today. Prior to the mid-1970’s, solid waste collection and disposal in West Virginia was largely uncontrolled. Municipal dumps were created to consolidate waste in one regional site rather than many small areas. In many instances, waste was burned at these open dumps to reduce the volume. This method of solid waste “management” frequently resulted in the degradation of surface and groundwater that served as sources of domestic and industrial water supplies. In addition, these open dumps provided breeding places for disease carrying insects, rodents, and other animals that are potentially injurious to the public health. The proliferation of these open dumps adversely impacted public and private property values and the natural beauty of the state.
In 1977 the state created the Resource Recovery-Solid Waste Disposal Authority, now the Solid Waste Management Board (SWMB), in response to the 1976 Resource Conservation and Recovery Act (RCRA) and accompanying regulations. The creation of this agency represented West Virginia’s first attempt to establish a statewide solid waste management planning entity. Because the state’s primary objective was to reduce the risks to public health by requiring adequate daily cover of the solid waste deposited in landfills, the Department of Health (DH) issued the permits to establish landfills. Liners were not required. In the early 1980’s, the U.S. Environmental Protection Agency (USEPA) revised the criteria for solid waste facilities that could receive household hazardous waste, or small quantity generator hazardous waste. This resulted in requiring the installation of liners and leachate collection systems. Since municipal solid waste facilities could not guarantee household hazardous wastes were not present in the waste stream, they were required to install liners and leachate collection
systems to prevent groundwater and/or surface water contamination. A USEPA report in 1988 predicted that by 1991 45% of all U.S. landfills would be filled to capacity. The report recommended that landfills have double liners and meet more stringent regulatory requirements. Increased planning, management, and recycling activities were also suggested leading to current regulations, which require the preparation of a state solid waste management plan. The WV State Legislature responded with several important pieces of legislation. Collectively, these laws did the following:
1. Authorized the creation of regional and/or
county solid waste authorities. 2. Required the preparation of
Comprehensive Litter and Solid Waste Control Plans and Commercial Solid Waste Facility Siting Plans by local authorities and an overall State Solid Waste Management Plan.
3. Established wastesheds and solid waste assessment fees.
4. Required commercial landfill operators to obtain certificates of site approval and need.
5. Established landfill closure deadlines and a closure assistance fund.
6. Authorized, encouraged and/or mandated the establishment of municipal and county recycling programs, goals, and procurement practices.
The Legislature drastically changed the management of solid waste with the passage of H.B. 3146 in 1988. In November 1988, the then Department of Natural Resources (DNR), now the Division of Natural Resources, promulgated emergency Solid Waste Management Rules (SWM Rules) for the management of solid waste disposal. These rules, as well as H.B. 3146, were enacted as a response to Subtitle D of the federal Resource

2-2 Chapter 2: The History and Legal Environment of Solid Waste Management in West Virginia
Conservation and Recovery Act (RCRA). The new SWM Rules, 33 CSR 1, formerly Title 47 CSR 38, changed the development and operation of MSW landfills, requiring these facilities to have composite liners, leachate collection and treatment systems, groundwater monitoring and analysis, and a post-closure care and monitoring period. In accordance with the SWM Rules, existing landfills with only a single liner or no liner at all were to close by November 1990. This was later extended to March 31, 1993 and again to December 31, 1994. 2.2 1993 – 2013: West Virginia Legislative Changes In 1993, the Legislature passed several more important pieces of legislation designed to:
1. Regulate the disposal of sewage sludge (Senate Bill 288).
2. Extend the closure dates for unlined and single lined landfills to allow owners of these facilities additional time to install composite liners while assuring adequate disposal capacity (Senate Bill 289).
3. Extend the deadline for prohibiting the disposal of yard waste and lead acid batteries in landfills until June 1, 1994, and tires until June 1, 1995.
4. Prohibit the use of incineration technology for solid waste disposal except in the development of pilot projects (House Bill 2445). This legislation also eliminated the distinction between in-shed and out-of-shed assessment fees.
During the 1994 legislative session, Senate Bill 1021 was enacted. This legislation:
1. Extended the closure dates of landfills to December 31, 1994 that had either started construction on a composite liner, had obtained financing for such construction, or had demonstrated good faith efforts to obtain such financing.
2. Extended the completion date for phasing in the implementation of mandated
municipality curbside recycling programs from January 1, 1994 to July 1, 1995.
3. Extended the date on which yard waste was banned from disposal in landfills from June 1, 1994 to January 1, 1996.
4. Authorized the SWMB to request that the Secretary of the Department of Environmental Protection (DEP) place into escrow accounts, up to two million dollars to fund two years of debt service for publicly owned landfills and transfer stations in order for permittees to obtain loans.
During the 1995 legislative session:
1. Senate Bill 313 extended the closure deadline for three landfills until January 1, 1996.
2. Senate Bill 349 extended the effective date of the landfill ban on yard waste until January 1, 1997. The effective date of the tire ban was extended until June 1, 1996.
During the 1996 legislative session:
1. House Bill 4224 bundled the Bureau of Environment rules. Included were DEP rules (Solid Waste Management, Waste Tire Management, Sewage Sludge Management) and SWMB rules (Development of Comprehensive Litter and Solid Waste Control Plans).
During the 1997 legislative session:
1. House Bill 110 provided one million dollars for landfill assistance loans. The monies would be transferred from the Department of Environmental Protection’s Solid Waste Reclamation and Environmental Response Fund to the Solid Waste Management Board.
2. House Bill 2333, the DEP rules bill, authorized additional language regarding reasonable and necessary exceptions in the yard waste rule.
During the 1998 legislative session:

2-3 Chapter 2: The History and Legal Environment of Solid Waste Management in West Virginia
1. Senate Bill 178 corrected language in previous solid waste laws that a federal judge declared unconstitutional because they unjustifiably discriminate against the importation and disposal of waste from other states.
2. Senate Bill 600 enabled landfills that were allowed to remain open until January 1, 1996, to be eligible for landfill closure assistance.
3. Senate Bill 601 provided that if persons responsible for collecting, hauling, or disposing of solid waste do not participate in the collection and payment of solid waste assessment fees, they would not be eligible to receive grants for recycling assistance under the provisions of W.Va. Code § 20-11-5a(h)(1).
4. Senate Bill 602 allowed the Secretary of the Department of Environmental Protection to transfer up to fifty cents per ton of solid waste disposed of in the state from the Landfill Closure Assistance Fund to the Solid Waste Enforcement Fund. The bill also reallocated twenty-five cents per ton that previously was used to assist counties and municipalities with wastewater treatment projects from the West Virginia Development Office to the Solid Waste Management Board Planning Fund to fund a Business and Financial Technical Assistance Program.
5. House Bill 2274 permitted the sale on the open market of products made from waste tires by prison inmates.
6. House Bill 2726 prohibited persons from dumping garbage or trash into dumpsters located on the property of another person if leased, owned, or otherwise maintained by another person.
During the 2000 legislative session:
1. Senate Bill 427 was passed to address the scrap tire issue. A newly created “Tire Refuse/Environmental Cleanup Fund”, funded by a temporary tax of $5.00 that has been added to the fee for obtaining a certificate of title to a motor vehicle. This
bill gave authority to the Division of Highways (DOH) to administer the fund and oversee the cleanup of tire piles, which were prioritized on a “waste tire remediation list.” Illegal tire dumpers or property owners where illegal tire piles are dumped are liable for cleanup costs. Only those tires collected as part of a DOH cleanup project, a DEP “Pollution Prevention and Open Dump” program, or other state authorized program, and for which no markets are available, may be deposited in landfills. The DOH was also given the authority to establish a program for residents and businesses to bring waste tires to county DOH headquarters for a fee. Tire retailers must accept used tires in exchange for those sold. Also, under this bill, salvage yards are prohibited from accumulating more than 100 waste tires without a proper permit.
2. Senate Bill 448 amended W. Va. Code § 22C-4-3 relating to the terms served by Solid Waste Authority board members by staggering the member appointments. The bill provided for more continuity in experience on the boards.
3. Senate Bill 306 and Senate Bill 308 authorized the Division of Natural Resources (DNR) to promulgate rules relating to the recycling grant program and the litter control grant program, respectively.
4. House Bill 4192 authorized the DEP to promulgate rules on prevention and control of air pollution from combustion and refuse.
5. House Bill 4230 authorized the Department of Environmental Protection to promulgate rules on the prevention and control of emissions from solid waste landfills.
6. House Bill 4380 amended W. Va. Code § 11-13K-2 (relating to tax credits for agricultural equipment) and W. Va. Code § 20-11-7 (relating to the recycling program). The bill is intended to promote the beneficial use of poultry litter by (1) allowing a tax credit for its use as an

2-4 Chapter 2: The History and Legal Environment of Solid Waste Management in West Virginia
agricultural fertilizer, and (2) requiring that the use of composted or deep stacked poultry litter products be given priority by all state agencies in their land maintenance and landscaping activities.
7. House Bill 4801 extended the deadline for submission of an application for landfill closure assistance from January 1, 1999 to December 31, 2000.
During the 2001 legislative session:
1. House Bill 2222, “The Litter Bill”, amended
the criminal provisions related to littering and the enforcement of penalties. It also created the misdemeanor offense of littering from a motor vehicle. Additional provisions of the bill include: 1) restructuring penalties based on amounts of trash thrown out rather than number of offenses, 2) picking up litter became a mandatory sentence for anyone convicted of littering, 3) assessing points against driver’s license for littering from a car, 4) assessing convicted litterer a fine of not less than $100 or more than $1,000 for cleanup, investigation and, prosecution of the case, 5) directing money from civil penalties to a litter control fund for SWAs to be spent on litter prevention, cleanup, and enforcement, 6) clarifying that SWAs may expend any available funds to operate solid waste facilities, litter control programs, and recycling programs, 7) removing funds transferred from solid waste facilities operated by SWAs from the jurisdiction of the Public Service Commission, and 8) allowing county commissions to hire county litter control officers.
2. House Bill 2218 elevated the Bureau of Environment to the Department of the Environmental Protection to a cabinet level department within the executive branch of government.
3. Senate Bill 12 amended the definition of “solid waste” to exclude yard waste.
4. Senate Bill 406 authorized litter control officers to issue citations.
5. Senate Bill 548 made failing to subscribe to solid waste disposal service or provide proper proof of disposition of waste a misdemeanor offense.
6. Senate Bill 635 created and imposed a tax on the sale of new and reconditioned tires in WV used in waste tire remediation.
7. Senate Bill 709 empowered county commissions to establish, operate and maintain residential garbage and refuse collection and disposal services by use of county-wide curbside collection points or green boxes.
8. Senate Bill 715 allowed the Division of Highways to use funds from the tire remediation/environmental cleanup fund to pay people who turn in waste tires under the tire disposal program. Also, allowing payment to waste tire processing facilities to accept waste tires and authorizing the fund to be used for the tire disposal program.
During the 2002 legislative session:
1. Senate Bill 609 amended the Solid Waste Management Act as it relates to dealing with violations and penalties, and created a criminal penalty for illegal waste tire piles. The bill states, any person convicted of accumulating, or disposing of one thousand or more tires is guilty of a felony, and upon conviction, shall be imprisoned for no less than one, and no more than five years and shall be required to clean up and properly dispose of the waste tires, or reimburse the state agencies for the costs incurred in cleaning up the waste tires. Further, any person convicted may be fined not more than fifty thousand dollars for each day of the violation.
2. House Bill 4163 was bundled and gave approval of revisions to the Solid Waste Management Board’s rule, 54CSR5 Disbursement Of Grants To Solid Waste Authorities, along with several other DEP bills.
During the 2003 legislative session:

2-5 Chapter 2: The History and Legal Environment of Solid Waste Management in West Virginia
1. Senate Bill 649 amended the Waste Tire Remediation and A. James Manchin Fund to finance infrastructure projects relating to waste tire processing facilities which have a capitol cost of not less than three hundred million dollars.
During the 2004 legislative session:
1. Senate Bill 444 required county litter
control officers to enforce litter laws established pursuant to W.Va. Code § 20-7-24 through 29 and Litter Control Programs.
2. House Bill 4027 created the environmental excellence program, creating incentives to exceed minimum environmental law requirements. It is a voluntary program, administered by the Department of Environmental Protection, allowing facilities which exceed minimum environmental standards to become eligible for benefits awarded to program participants.
3. House Bill 4455 allowed for the continuation of the A. James Manchin Fund, transferring the remaining balance of the funds to the state road fund and allowing the waste tire remediation program to continue until the first day of July, two thousand six, unless terminated sooner.
During the 2005 legislative session:
1. Senate Bill 428 related to the
Rehabilitation Environmental Action Plan
(REAP) by addressing the improper
management of commercial and
residential solid waste, which can
adversely affect West Virginia’s natural
resources and public health. To ensure
these issues are managed efficiently, this
legislation consolidated litter control, open
dump elimination and reclamation, waste
tire clean up and recycling programs into
one program to be maintained by the
Department of Environmental Protection. It
also set forth penalties for wrongful
disposal of litter and to promote pollution
prevention, it provides for litter control and
recycling programs and education.
2. House Bill 3356 related to the powers and
duties of the Solid Waste Management
Board; providing for performance reviews
of authorities and performance measures;
required proposal of legislative rules for
implementation of review process and
system; circumstances under which the
solid waste management board is
authorized to intervene in and supersede
the exercise of authority related to certain
county or regional solid waste authorities
that operate a solid waste facility; provided
for the establishment of a uniform chart of
accounts delineating common revenue and
expense account naming conventions to
be adopted by all county and regional solid
waste authorities; and requiring audits of
authorities. During the 2006 legislative session:
1. House Bill 4453 related to law-
enforcement powers and duties of conservation officers; provided for the statewide authority of conservation officers to enforce litter control laws; and related to the procurement and execution of related arrest and search warrants dealing with litter control.
During the 2007 legislative session:
1. Senate Bill 177 related to the creation of the Division of Energy and the position of executive director to coordinate governmental activities intended to develop an energy policy and development plan including innovative alternative and traditional sources of energy.
2. Senate Bill 490 related to the expiration of the Underground Storage Tank Insurance Fund and directed the Department of Environmental Protection to develop a plan

2-6 Chapter 2: The History and Legal Environment of Solid Waste Management in West Virginia
to assist those persons who have claims pending against the fund.
3. Senate Bill 524 clarified that proof of lawful disposal of solid waste is required to be current. It also provided a penalty for failing to lawfully dispose of solid waste and for failing to have proof of lawful disposal.
4. House Bill 202 required purchasers of nonferrous metal or steel railroad track and track material to require additional information from the sellers. The bill also increased the penalties for knowing failures to collect and provide information relating to the sale of certain metals.
During the 2008 legislative session:
1. Senate Bill 373 bundled rules including those authorizing the Solid Waste Management Board to promulgate legislative rules relating to performance measures and review standards for solid waste authorities operating commercial solid waste facilities.
2. Senate Bill 501 related to the transfer of the Stream Partners Fund from the Division of Natural Resources to the Department of Environmental Protection to ensure a sufficient level of funding.
3. Senate Bill 503 authorized the Secretary of the Department of Environmental Protection to require solid waste facility permit applicants and others connected with applicants and permittees to furnish fingerprints for the purpose of conducting state and federal criminal history checks.
4. Senate Bill 519 extended the sunset provision for the Hazardous Waste Management Fee Fund from June 30, 2008 to June 30, 2013.
5. Senate Bill 638 required purchasers of catalytic converters or any material derived from catalytic converters to require additional information from the sellers. The bill sets penalties for knowingly failing to collect and provide information relating to the sale of catalytic converters or any material derived from catalytic converters.
6. Senate Bill 746 established a convenient and environmentally sound recovery program for the collection, recycling, and reuse of covered electronic devices that have reached the end of their useful lives. It maximized recovery of resources contained in discarded covered electronic devices and prevented improper disposal of materials in electronic devices in state landfills.
7. House Bill 4423 ensured that stainless steel kegs are not considered scrap metal unless received directly from a beer manufacturer or authorized representative.
During the 2009 legislative session:
1. Senate Bill 440 granted additional authority to county litter control officers, specifically to issue citations for failure to prove lawful disposal of trash and creating, contributing to or allowing an open dump.
2. Senate Bill 641 required the operator-driver of every solid waste motor carrier who deposits solid waste in a commercial landfill or transfer station to declare in writing, under oath, the county and state of origin of the solid waste being deposited at the commercial landfill or transfer station; and provided criminal penalties.
3 House Bill 3197 allowed municipalities to permit non-police officers to issue citations for littering.
During the 2010 legislative session:
1. Senate Bill 350 categorized recycled energy as a renewable energy resource.
2. Senate Bill 398 prohibited disposal of certain electronic devices such as computers, monitors and television sets in landfills effective January 1, 2011.
3. Senate Bill 273 authorized the Department of Environmental Protection to promulgate a legislative rule relating to the Covered Electronic Devices Takeback Program.
4. Senate Bill 627 increased the civil and criminal penalties for the crime of littering and directed the Secretary of the

2-7 Chapter 2: The History and Legal Environment of Solid Waste Management in West Virginia
Department of Environmental Protection to coordinate a statewide litter reporting program.
During the 2012 legislative session:
1. Senate Bill 76 requires new building construction projects of public agencies and projects receiving state funds to be designed and constructed in compliance with the ICC International Energy Conservation Code and the ANSI/ASHRAE/IESNA Standard 90.1-2007.
2. Senate Bill 528 relates to scrap metal; requiring scrap metal dealers to obtain business licenses, to register scales with the Division of Labor, provide a notice of recycling activity to the Department of Environmental Protection, and register with the Secretary of State. It also requires the Secretary of State to maintain a list of scrap metal dealers and make the list publically available.
3. House Bill 4320 relates to the settlement of violations of the Hazardous Waste Management Act by consent agreements, as an alternative to instituting a civil action in the circuit courts of the state.
4. House Bill 4320 relates to the sale of company railroad scrap metal, requiring written authorization for sale, setting a minimum weight for railroad scrap metal sold and requiring purchaser to attempt to verify ownership.
2.3 Federal Legislation and Interpretation 2.3.1 The Stamp Decision On September 28, 1995, U.S. District Court Judge Frederick P. Stamp issued a Memorandum Opinion and Order in the case of Valero Terrestrial Corp., ET. al. v. Laidley Eli McCoy, et. al. The Order granted plaintiffs’ motion for a preliminary injunction enjoining the state from, among other things, enforcing the tonnage caps on the amount of solid waste that can be handled at a solid waste facility per month.
On September 17, 1997, a final motion for declaratory judgment and permanent injunction was granted. West Virginia solid waste statutes were declared unconstitutional under the Dormant Commerce Clause and the defendants were enjoined from enforcing them. During the 1998 legislative session, the Legislature passed, and the Governor signed into law S. B. 178, which corrected language in West Virginia solid waste laws that had been declared unconstitutional because they unjustifiably discriminated against the importation and disposal of waste from other states. Major provisions of the Solid Waste Management Act, as amended by S.B. 178, would keep the tonnage caps in place and allow the Secretary of DEP to determine the tonnage limit for each solid waste facility based on certain criteria. The Secretary had to develop emergency rules to determine the amount of sludge which may be safely treated, stored, processed, composted, dumped or placed in a solid waste facility. The Bill limits the landfilling of sewage sludge to 12,500 tons per month for Class A facilities and 5,000 tons per month for Class B facilities. The stockpiling of sewage sludge is limited to 125,000 cubic yards annually for Class A facilities and 50,000 cubic yards for Class B facilities. Commercial and non-commercial composting facilities may receive up to 2,000 tons of sewage sludge per month and shall not stockpile more than 20,000 cubic yards of sludge or processed product derived from sludge. The law governing the conversion of a Class B facility to a Class A facility was changed by S.B. 178 to require the county commission, rather than the local solid waste authority, to place a Class II Legal Advertisement in a qualified newspaper informing the public of their right to petition for a referendum.
2-8 Chapter 2: The History and Legal Environment of Solid Waste Management in West Virginia
2.3.2 Flow Control In April 2006, Judge Mary E. Stanley of the US District Court for the Southern District of West Virginia issued a ruling impacting exports of solid waste. Prior to Judge Stanley’s ruling, all West Virginia haulers were required to have a valid Certificate of Convenience and Necessity from the Public Service Commission (PSC) for operations in the state. According to Judge Stanley, “West Virginia Code §24A-2-5 is invalid insofar as it requires solid waste haulers engaged in the interstate transportation of solid waste to obtain a certificate of convenience and necessity from the PSC.” This ruling enables haulers from out-of-state to enter the West Virginia solid waste hauling market without a Certificate of Convenience and Necessity, provided that they dispose of the waste at out-of-state disposal facilities. This ruling has impacted the solid waste market in areas adjacent to West Virginia borders, resulting in greater exports of solid waste by out-of-state haulers, and a resulting loss of market-share by local certificated haulers and disposal facilities. This trend has had a negative impact on the collection of solid waste assessment fees and on the revenue of local disposal facilities, and has consequently generated interest in implementing “flow control” in some areas to require local waste be disposed of at local facilities. Before 2007, flow control was considered to be unconstitutional as interfering with interstate commerce. See, C&A Carbone, Inc. v. Clarkstown, 511 U.S. 383 (1994). However, in a 2007 ruling, the Supreme Court of the United States held that flow control could be used to advance state and local governmental solid waste management objectives, including the financing of publicly owned solid waste facilities. United Haulers Ass’n Inc. v. Oneida-Herkimer Solid Waste Management Authority, 550 U.S., 127 S. Ct. 1786, 167 L. Ed. 2d 665 (April 30, 2007) (hereafter “United Haulers”). The PSC has statutory authority to issue a flow control order at the request of a solid waste facility or a county or regional solid waste authority, directing that “solid waste generated in the surrounding geographical area of a solid waste facility be processed or disposed of at a
designated solid waste facility or facilities.” W. Va. Code §24-2-1h. Until the United Haulers decision, however, that authority could not effectively be exercised. United Haulers thus, provides publicly owned facilities in West Virginia, and local solid waste authorities, with a new potential means to preserve or enhance their ability to contribute to state and local solid waste management objectives through flow control. At the time of this document’s publication, Region VIII Solid Waste Authority had filed a petition with the PSC seeking a flow control order requiring all of Region VIII’s waste be directed to its two transfer stations. The Tucker County Solid Waste Authority has intervened in support of the Petition. The Petition is appended hereto and was filed on October 27, 2010. On June 28, 2011, Region VIII filed a motion to withdraw its petition. This decision was based primarily on PSC staff opposition in pre-trial testimony. The case was dismissed without prejudice. The Legislature has specified that the Public Service Commission consider various factors when deciding whether to issue a flow control order, including “the environmental impact of controlling the flow of solid waste, the efficient disposal of solid waste, financial feasibility of proposed or existing solid waste facilities, the county or regional solid waste control plan, the statewide solid waste control plan and the public convenience and necessity.” W. Va. Code §24-2-1h(b). A flow control order consistent with these criteria would advance the State’s solid waste management objectives. There are continuing questions concerning the availability of service to low population density areas, unfair advantages for out-of-state haulers and industry valuation. In assessing disposal needs and projected revenue to support solid waste management programs, it is imperative to identify the movement of solid waste into or out of the state. Agencies and landfills in adjacent states were contacted to determine the quantity of solid waste received from West Virginia (Table 4.4 and 4.6). Additionally,

2-9 Chapter 2: The History and Legal Environment of Solid Waste Management in West Virginia
West Virginia tonnage reports were reviewed to determine the quantity of out-of-shed waste that was out-of-state (Table 4.5). Industrial waste/other waste from West Virginia that was deposited in out-of-state solid waste landfills was included in the totals since it could have been deposited in West Virginia commercial solid waste landfills.

Chapter 3
Efficiencies in Solid Waste Management: Demographics, Transportation and
Population & Waste Projections

3-1
Chapter 3: Efficiencies in Solid Waste Management
Chapter 3: Efficiencies in Solid Waste Management: Demographics,
Transportation and Population & Waste Projections
3.1 Demographics1
Perhaps more than any other factor, the
demographics of an area, including geography,
population, economic base, income, land use,
and available transportation routes, determine
both the waste that is generated and the options
available to manage that waste. For example, a
county with a low density population and little
industry will not only have a smaller waste
stream, but it will be comprised primarily of
residential waste, differing in composition from
a more commercial and industrial waste stream
in a highly urbanized area. Management
options, such as markets for recyclables or the
construction of disposal facilities, number and
capacity of solid waste management facilities
and land availability will also vary.
This chapter will discuss the demographics of
West Virginia as a whole and its seven (7)
wastesheds individually. The demographic data
presented here and its impact on solid waste
management in West Virginia will be discussed
throughout this plan.
After an uninterrupted period of growth from
1870 through 1930, West Virginia’s population
level began to fluctuate. It increased by 104,000
during the 1940s, then declined by 145,000 in
the 1950s, the population continued to fluctuate
from the 1960s to the present. (See Figure 3-1
below.)
In the 1990s West Virginia’s economic
performance outpaced that of the previous
decade but there was little impact on the growth
in population. While the population of the nation
as a whole grew by 13.1%, West Virginia’s
population increased by only 0.8%, an overall
increase of 14,467 people. During that time the
population of 25 of the state’s 55 counties
declined, with four southern coalfield counties
losing 11% to 22% of their populations.
Figure 3-1
West Virginia Population Changes (1960-2010)
While population loss was also acute in the
northern panhandle and parts of central West
Virginia the eastern panhandle counties of
Jefferson, Berkeley, Morgan, Hardy and
Hampshire along with Putnam experienced
significant growth.
1,000,000
1,500,000
2,000,000
West Virginia Population Changes 1960-2010
1960 1970 1980 1990 2000 2010

3-2
Chapter 3: Efficiencies in Solid Waste Management
According to the US Census, between 2000 and
2010, West Virginia grew by 2.5%. The rest of
the US grew at a rate of 9.8%. The state is
currently projected to grow by 2.0% between
2015 and 2035.
While it appears the state’s population will be
stable over the next twenty years, various
regions within the state are expected to
experience various levels of growth or decline.
For example, the growth rate for Wasteshed E,
covering the eastern panhandle is projected to
be 27.5%. The coalfield counties of Wasteshed
H are projected to decline by 5.2%.
3.2 Geographic and Transportation Factors
Influencing Solid Waste Management in West
Virginia
West Virginia has a land and water area of
24,231.4 square miles, forty-first in the United
States.2 Its greatest distance from east to west
is 260 miles and 327 miles from north to south.
Most of the state consists of hills and valleys
with some narrow river plains. The geographic
center is located in the Elk River Public
Hunting Area in Braxton County.
From its geographic center, West Virginia is
within 500 miles of 3 New York City, most of
western New York, all of Pennsylvania, New
Jersey, Delaware, Washington D.C., Virginia,
North Carolina, South Carolina, Ohio, Indiana,
and parts of Georgia (including Atlanta),
Alabama, Tennessee, Kentucky, Wisconsin,
Mississippi, Illinois (Chicago), and Michigan
(Detroit).
The state’s rural character and the fact that it is
a central location to major population centers
could make West Virginia a potential location
for landfills in the eyes of developers,
potentially complicating solid waste
management in the state.
Figure 3-2
Geographic Location

3-3
Chapter 3: Efficiencies in Solid Waste Management
3.2.1 Navigable Waterways
West Virginia’s rivers form a large portion of the
state’s borders and are responsible for its
distinctive, irregular shape. The navigable
portions of these rivers flow out of the state in all
directions (Figure 3-3), thus providing little
transportation between regions in the state. To
be considered navigable, a river must maintain a
depth of greater than nine feet at normal pool.
On the western side of the Eastern Continental
Divide, all of West Virginia waters drain into the
Ohio River, which forms the state’s
northwestern border. The Ohio, with a system of
locks and dams, is navigable along its entire
length from Chester in Hancock County to the
Kentucky border. The Big Sandy forms the
southwestern border of the state and is
navigable for a distance of 8.4 miles upstream
to Cyrus. The Kanawha River is navigable from
its mouth to Deep Water, a small town just east
of Montgomery, a distance of 90.6 miles. Some
tributaries of the Kanawha are navigable for
short distances. The Little Kanawha is
navigable from its mouth at Parkersburg for
14.6 miles to Slate in Wood County. The
Monongahela River is navigable its entire length
from Pittsburgh where it helps form the Ohio,
upstream to the vicinity of Fairmont in Marion
County, a distance of 128.7 miles. The Tygart
Valley River and the West Fork River, which
form the Monongahela, are navigable for short
distances.
Figure 3-3
Navigable Waterways

3-4
Chapter 3: Efficiencies in Solid Waste Management
3.2.2 Highways
West Virginia is served by 6 interstate highways.
Interstate 81 cuts through Berkeley County in
the Eastern Panhandle. Interstate 70 bisects
Ohio County in the Northern Panhandle.
Interstate 77 enters West Virginia at Bluefield
and follows the West Virginia Turnpike north to
Charleston, and then continues on to
Parkersburg and into Ohio. Interstate 64 runs
from Huntington east to Charleston where it
follows the turnpike (and Interstate 77) south to
Beckley. Interstate 64 leaves the turnpike (and
Interstate 77) at Beckley and runs east to White
Sulphur Springs and into Virginia. Interstate 79
begins in Charleston and runs northeast to
Morgantown and into Pennsylvania. Interstate
68 begins in Morgantown and extends east into
Maryland.
All interstates have a Gross Weight Limit (GWL)
of 80,000 pounds. These interstates provide
convenient access to the state’s interior.
Portions of US routes 50, 52, 119, 35, 60, 19,
33, 219, and 522 have a GWL of 80,000
pounds. West Virginia routes with a similar GWL
are portions of 34, 2, 39, 57 and 9. Other routes
have a similar GWL for short distances. Portions
of the above routes, and other highways, have a
GWL of 73,500 pounds, others are limited to
65,000 pounds. These gross weight limits apply
to all state highways not identified as being part
of the state’s coal resource transportation
system. In the 2003 legislative session, Senate
Bill 583 amended W.Va. Code § 17C to allow
higher weight limits on certain identified
highways for the coal industry. Anyone wanting
to haul solid waste is encouraged to contact the
Department of Transportation to find out the
current legal GWLs on highways and if bridges
are adequate.
The mountainous terrain and narrow valleys
make for narrow and winding roads which are
difficult for large vehicles to travel. Some of
these roads are not suitable for a typical
garbage packer truck. Bridges are also
important to garbage hauling. All of West
Virginia’s bridges have a gross vehicle weight
limit. Inadequate bridges within the state’s
system require alternate routing; increasing
mileage traveled thus increasing hauling costs.
Figure 3-4
Interstates & US Highways
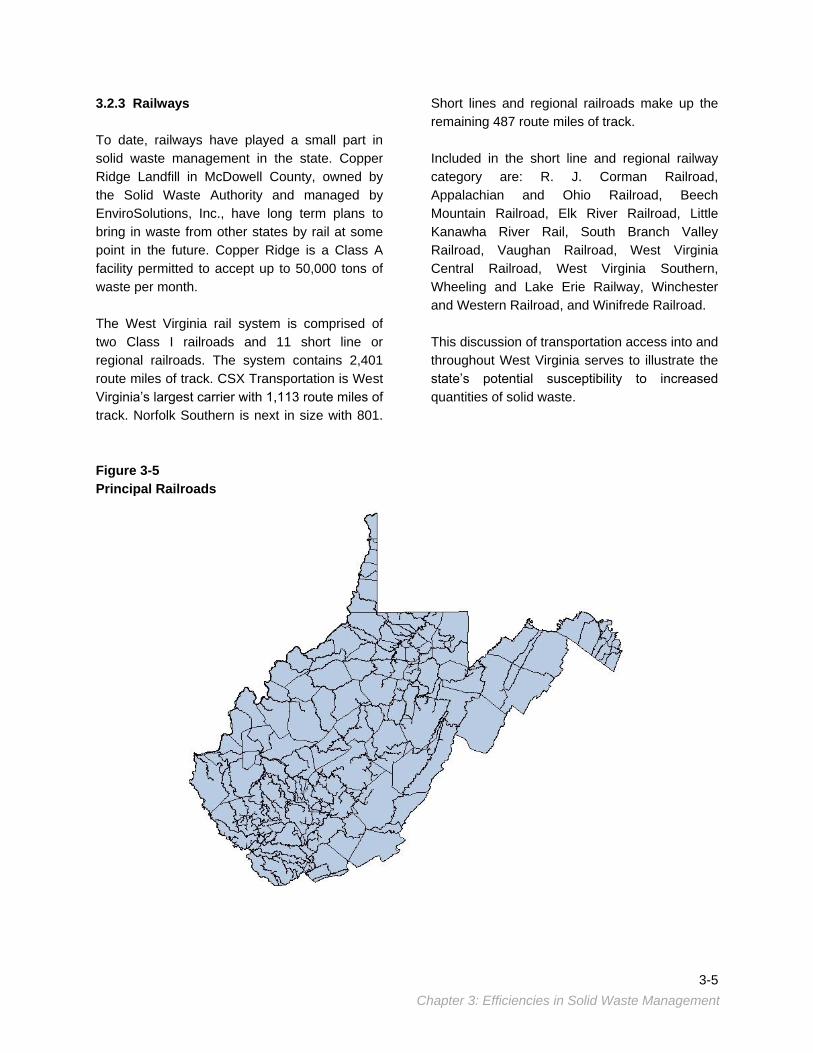
3-5
Chapter 3: Efficiencies in Solid Waste Management
3.2.3 Railways
To date, railways have played a small part in
solid waste management in the state. Copper
Ridge Landfill in McDowell County, owned by
the Solid Waste Authority and managed by
EnviroSolutions, Inc., have long term plans to
bring in waste from other states by rail at some
point in the future. Copper Ridge is a Class A
facility permitted to accept up to 50,000 tons of
waste per month.
The West Virginia rail system is comprised of
two Class I railroads and 11 short line or
regional railroads. The system contains 2,401
route miles of track. CSX Transportation is West
Virginia’s largest carrier with 1,113 route miles of
track. Norfolk Southern is next in size with 801.
Short lines and regional railroads make up the
remaining 487 route miles of track.
Included in the short line and regional railway
category are: R. J. Corman Railroad,
Appalachian and Ohio Railroad, Beech
Mountain Railroad, Elk River Railroad, Little
Kanawha River Rail, South Branch Valley
Railroad, Vaughan Railroad, West Virginia
Central Railroad, West Virginia Southern,
Wheeling and Lake Erie Railway, Winchester
and Western Railroad, and Winifrede Railroad.
This discussion of transportation access into and
throughout West Virginia serves to illustrate the
state’s potential susceptibility to increased
quantities of solid waste.
Figure 3-5
Principal Railroads

3-6
Chapter 3: Efficiencies in Solid Waste Management
3.3 Wasteshed Analysis
The “Resource Conservation and Recovery Act
of 1976” (RCRA) represented many years of
congressional hearings and reports on the
relative roles and needs of federal/state/local
government and industry in solid waste
management. RCRA mandated the
promulgation of guidelines used in identifying
areas, which had common solid waste
management problems, and were appropriate
units for planning solid waste management
services. Federal and state financial assistance
was conditioned on each state identifying
regional boundaries, responsible agencies, and
the approval of state plans within six months of
the establishment of the guidelines. To meet
these conditions the West Virginia Resource
Recovery - Solid Waste Disposal Authority, now
the Solid Waste Management Board, divided the
state into geographic regions, wastesheds, for
solid waste management purposes. Each
wasteshed has its own demographic
characteristics and its own set of waste
management needs. W. Va. Code § 22C-3-9
defines how wastesheds are to be designated.
Solid waste planning includes the prediction of
future needs. Sections 3.3.1 - 3.3.7 of this
chapter provide tonnage projections based on
population projections compiled by the West
Virginia University Regional Research Institute
(RRI) and a waste characterization study
conducted by the US EPA.
Tonnage projections in this section are
computed using the 4.43 pounds per person, per
day rate indicated by the US EPA’s 2010 study,
which is discussed in Section 3.4 of this chapter,
along with projected population rates from RRI.
It should be noted that all projections, both
population and tonnage, are based on historical
data. They do not factor in external concerns
such as economic fluctuations, variations in the
local business activity, changes in law or
government regulation, and many other things
that tend to affect the local waste stream.
Data presented in the projected monthly
municipal solid waste tables in Sections 3.3.1
through 3.3.7 constitute municipal solid waste
only as defined by 33CSR1, Solid Waste
Management Rule. The tables on waste stream
composition detail all tonnages received by
landfills for the last full year providing a
summary of both municipal and non-municipal
solid waste needs.
This section provides a wasteshed-by-
wasteshed analysis of projected population rates
and monthly municipal solid waste tonnage
projections along with a summary of non-
municipal solid waste needs through the year
2035.

3-7
Chapter 3: Efficiencies in Solid Waste Management
Map 3-1
West Virginia Wasteshed Map
Wasteshed A Wasteshed C Wasteshed G
Brooke Jackson Fayette
Hancock Pleasants McDowell
Marshall Ritchie Mercer
Ohio Wirt Mingo
Tyler Wood Monroe
Wetzel Raleigh
Wasteshed E Summers
Wasteshed B Berkeley Wyoming
Barbour Grant
Braxton Hampshire Wasteshed H
Clay Hardy Boone
Doddridge Jefferson Cabell
Gilmer Mineral Calhoun
Harrison Morgan Kanawha
Lewis Pendleton Lincoln
Marion Logan
Monongalia Wasteshed F Mason
Preston Greenbrier Putnam
Randolph Nicholas Roane
Taylor Pocahontas Wayne
Tucker Webster
Upshur
Wasteshed A Wasteshed B
Wasteshed E
Wasteshed C
Wasteshed F
Wasteshed H
Wasteshed G

3-8
Chapter 3: Efficiencies in Solid Waste Management
3.3.1 Wasteshed A
Figure 3-6
Population Projections 2015 through 2035 for Wasteshed A
Table 3-1
Projected Monthly Municipal Solid Waste Tonnage for Wasteshed A
2015 2020 2025 2030 2035
Brooke 1,582 1,538 1,479 1,412 1,344
Hancock 2,014 1,954 1,882 1,805 1,723
Marshall 2,163 2,082 1,997 1,893 1,786
Ohio 2,954 2,897 2,835 2,775 2,705
Tyler 600 575 545 511 475
Wetzel 1,086 1,045 1,002 952 901
Total 10,399 10,091 9,740 9,348 8,934
WASTESHED A

3-9
Chapter 3: Efficiencies in Solid Waste Management
Wasteshed A consists of Brooke, Hancock,
Marshall, Ohio, Tyler, and Wetzel counties, all
located in the extreme northern part of the state.
Wasteshed A currently has three approved solid
waste facilities; the Wetzel County Landfill, the
Short Creek Landfill, and the Brooke County
Landfill. For calendar year 2011, the three
facilities processed a total of 105,186 tons of
waste. This amounts to an average monthly
waste intake of 8,765 tons. For the same period,
22.4% of Wasteshed A waste was from the
states of Ohio and Pennsylvania.
Wasteshed A has access to several landfills in
Ohio and Pennsylvania. For a detailed
discussion of West Virginia landfills and waste
imports and exports, see Chapter 4.
According to West Virginia University, Regional
Research Institute, population projections
covering 2015 through 2035, all 6 counties in the
wasteshed will decline in population. Brooke by
15%, Hancock by 14.4%, Marshall by 17.4%,
Ohio by 8.4%, Tyler by 20.8% and Wetzel by
17.0%. The 2010 US Census shows
Wasteshed A’s population was 158,086.
Heavy industry is often found in areas near
major rivers where materials used in production
and/or output from the facilities is shipped out at
low cost. All Wasteshed A counties are bordered
on the western side by the Ohio River, an area
which produces a preponderance of industrial
and special waste.
Table 3-2
CY 2011 Waste Stream Composition for Wasteshed A4
Municipal Solid Waste* (MSW) Non-Municipal Waste (NMSW)*
Residential Waste 21.0% Industrial Waste 4.3%
Commercial Waste 6.6% Construction Demolition 10.9%
Sewage Sludge** 2.1% Petroleum Contaminated Soil 0.4%
Total MSW 29.7% Industrial Sludge 4.1%
Other Special Waste♦ 36.4%
Miscellaneous Waste 3.3%
Fee Exempt Waste♦ 10.9%
Total NMSW 70.3%
*Percentages may vary slightly due to rounding.
**According to 33CSR1, Solid Waste Management Rule, “Municipal Solid Waste means any household or commercial solid waste
as defined in this rule and any sludge from a waste treatment plant or a water treatment plant.” ♦Other special waste consists of various materials that must have special approval to be disposed of in a municipal solid waste
facility. For explanations of Special and Fee Exempt Waste, see Chapter 4 of this document.
WASTESHED A
WASTESHED A

3-10
Chapter 3: Efficiencies in Solid Waste Management
3.3.2 Wasteshed B
Figure 3-7
Population Projections 2015 through 2035 for Wasteshed B
Table 3-3
Projected Monthly Municipal Solid Waste Tonnage for Wasteshed B
2015 2020 2025 2030 2035
Barbour 1,164 1,198 1,227 1,248 1,261
Braxton 967 964 956 939 930
Clay 598 561 527 496 464
Doddridge 544 536 517 493 463
Gilmer 579 577 573 560 545
Harrison 4,705 4,747 4,761 4,752 4,714
Lewis 1,097 1,084 1,066 1,044 1,018
Marion 3,816 3,826 3,820 3,795 3,752
Monongalia 6,851 7,261 7,718 8,207 8,743
Preston 2,288 2,299 2,301 2,274 2,226
Randolph 1,988 1,981 1,959 1,911 1,845
Taylor 1,180 1,230 1,262 1,274 1,285
Tucker 480 477 467 453 436
Upshur 1,668 1,688 1,696 1,690 1,671
Totals 27,925 28,429 28,850 29,136 29,353
WASTESHED B

3-11
Chapter 3: Efficiencies in Solid Waste Management
Wasteshed B consists of 14 counties in north
and north central West Virginia. They are
Barbour, Braxton, Clay, Doddridge, Gilmer,
Harrison, Lewis, Marion, Monongalia, Preston,
Randolph, Taylor, Tucker, and Upshur counties.
Wasteshed B has three approved solid waste
landfills; the Tucker County Landfill, S & S
Grading and Meadowfill landfills, both in
Harrison County. For the year 2011, the three
landfills processed a total of 520,658 tons of
waste averaging 43,390 tons per month.
Wasteshed B has two waste tire monofills, Pace
Tire Monofill, located near Kingwood in Preston
County and Tire & Rubber, Inc., in Lewis
County. Tire and Rubber also accepts C/D
waste. Wasteshed B has 5 solid waste transfer
stations.
Overall the population of Wasteshed B is
expected to experience modest growth through
2035, with five of the fourteen counties expected
to gain population and nine declining. The
majority of growth in Wasteshed B will come
from Monongalia, Taylor and Barbour counties.
Wasteshed B’s population, according to the
2010 US Census was 406,686.
Table 3-4
CY 2011 Waste Stream Composition for Wasteshed B
Municipal Solid Waste* (MSW) Non-Municipal Waste (NMSW)*
Residential Waste 32.0% Industrial Waste 2.6%
Commercial Waste 18.5% Construction Demolition 12.4%
Sewage Sludge** 1.7% Petroleum Contaminated Soil 30.8%
Total MSW 52.2% Industrial Sludge 1.2%
Other Special Waste♦ 0.3%
Miscellaneous Waste 0.0%
Fee Exempt Waste♦ 0.4%
Total NMSW 47.7%
*Percentages may vary slightly due to rounding.
**According to 33CSR1, Solid Waste Management Rule, “Municipal Solid Waste means any household or commercial solid waste
as defined in this rule and any sludge from a waste treatment plant or a water treatment plant.” ♦Other special waste consists of various materials that must have special approval to be disposed of in a municipal solid waste
facility. For explanations of Special and Fee Exempt Waste, see Chapter 4 of this document.
WASTESHED B

3-12
Chapter 3: Efficiencies in Solid Waste Management
3.3.3 Wasteshed C
Figure 3-8
Population Projections 2015 through 2035 for Wasteshed C
Table 3-5
Projected Monthly Municipal Solid Waste Tonnage for Wasteshed C
2015 2020 2025 2030 2035
Jackson 2,028 2,075 2,106 2,124 2,134
Pleasants 517 506 491 469 446
Ritchie 705 718 716 704 686
Wirt 383 379 370 354 337
Wood 5,879 5,875 5,830 5,760 5,662
Total 9,512 9,553 9,513 9,411 9,265
WASTESHED C

3-13
Chapter 3: Efficiencies in Solid Waste Management
Wasteshed C is located on the northwestern
West Virginia/Ohio border and consists of five
counties including Jackson, Pleasants, Ritchie,
Wirt, and Wood. Wasteshed C has one
approved solid waste facility, the Northwestern
Landfill, located near Parkersburg in Wood
County.
Population for Wasteshed C is expected to
experience a decline through 2035. Only
Jackson County is expected to grow with a
projected growth rate through the period of
5.2%. Pleasants is expected to decline 13.7%
followed by Wirt County with a loss of 12%.
Wood will lose 3.7% and Ritchie will lose 2.7%.
Wasteshed C’s population, according to the
2010 US Census was 139,938.
Wasteshed C is similar to Wasteshed A in that
some counties border the Ohio River. This
accounts for the 13.5% industrial waste and
6.7% industrial sludge in their waste stream.
21.4% of all waste processed by Wasteshed C
commercial solid waste facilities was from other
states.
Table 3-6
CY 2011 Waste Stream Composition for Wasteshed C
Municipal Solid Waste* (MSW) Non-Municipal Waste (NMSW)*
Residential Waste 32.3% Industrial Waste 13.5%
Commercial Waste 21.9% Construction Demolition 9.8%
Sewage Sludge** 2.1% Petroleum Contaminated Soil 13.3%
Total MSW 56.3% Industrial Sludge 6.7%
Other Special Waste♦ 0.0%
Miscellaneous Waste 0.1%
Fee Exempt Waste♦ 0.3%
Total NMSW 43.7%
*Percentages may vary slightly due to rounding.
**According to 33CSR1, Solid Waste Management Rule, “Municipal Solid Waste means any household or commercial solid waste
as defined in this rule and any sludge from a waste treatment plant or a water treatment plant.” ♦Other special waste consists of various materials that must have special approval to be disposed of in a municipal solid waste
facility. For explanations of Special and Fee Exempt Waste, see Chapter 4 of this document.
WASTESHED C

3-14
Chapter 3: Efficiencies in Solid Waste Management
3.3.4 Wasteshed E
Figure 3-9
Population Projections 2015 through 2035 for Wasteshed E
Table 3-7
Projected Monthly Municipal Solid Waste Tonnage for Wasteshed E
2015
2020
2025
2030
2035
Berkeley
7,751
8,661
9,541
10,481
11,429
Grant
818
826
823
810
795
Hampshire
1,704
1,779
1,832
1,861
1,869
Hardy
995
1,042
1,079
1,103
1,116
Jefferson
3,900
4,224
4,519
4,797
5,055
Mineral
1,936
1,961
1,972
1,962
1,938
Morgan
1,259
1,330
1,381
1,417
1,435
Pendleton
504
489
471
448
421
Totals
18,867
20,312
21,618
22,879
24,058
WASTESHED E

3-15
Chapter 3: Efficiencies in Solid Waste Management
Wasteshed E in the eastern panhandle includes
Grant, Hampshire, Hardy, Mineral, Pendleton,
Berkeley, Jefferson, and Morgan counties. They
currently have one approved solid waste landfill,
LCS Landfill near Martinsburg in Berkeley
County, operated by Waste Management, and
three transfer stations. The Jefferson County
transfer station is also operated by Waste
Management. Region VIII Solid Waste Authority
operates the transfer stations in Romney and
Petersburg. The area has access to several out-
of-state landfills that will accept West Virginia
waste in Maryland, Pennsylvania and Virginia.
For CY 2011, the LCS Landfill processed
115,882 tons of waste or an average of 9,657
tons per month. The three transfer stations
processed and shipped 56,044 tons or an
average of 4,671 tons per month.
Wasteshed E currently has the most robust
economy in the state. Most counties are
expected to demonstrate significant growth rates
from 2015 through 2035, with the exceptions of
Grant and Pendleton counties who are expected
to decline by 2.8% and 16.5% respectively.
Berkeley is expected to grow by 47.5%,
Jefferson by 29.6%, Morgan by 14%, Hardy by
12.2%, Hampshire by 9.6%, and Mineral by
0.1%. Wasteshed E’s population, according to
the 2010 US Census was 261,041.
Most non-municipal solid waste in Wasteshed E
is, and has been for several years, construction
and demolition waste resulting from residential
and light commercial building to accommodate
spillover population growth from the
Washington, D.C. metropolitan area. In addition,
12.7% of waste deposited in LCS Landfill in
2011 came from out of state.
Table 3-8
CY 2011 Waste Stream Composition for Wasteshed E
Municipal Solid Waste* (MSW) Non-Municipal Waste (NMSW)*
Residential Waste 47.9% Industrial Waste 1.9%
Commercial Waste 35.1% Construction Demolition 9.9%
Sewage Sludge** 4.4% Petroleum Contaminated Soil 0.0%
Total MSW 87.4% Industrial Sludge 0.3%
Other Special Waste♦ 0.0%
Miscellaneous Waste 0.0%
Fee Exempt Waste♦ 0.5%
Total NMSW 12.6%
*Percentages may vary slightly due to rounding.
**According to 33CSR1, Solid Waste Management Rule, “Municipal Solid Waste means any household or commercial solid waste
as defined in this rule and any sludge from a waste treatment plant or a water treatment plant. ♦Other special waste consists of various materials that must have special approval to be disposed of in a municipal solid waste
facility. For explanations of Special and Fee Exempt Waste, see Chapter 4 of this document.
WASTESHED E

3-16
Chapter 3: Efficiencies in Solid Waste Management
3.3.5 Wasteshed F
Figure 3-10
Population Projections 2015 through 2035 for Wasteshed F
Table 3-9
Projected Monthly Municipal Solid Waste for Wasteshed F
2015
2020
2025
2030
2035
Greenbrier
2,454
2,492
2,505
2,497
2,470
Nicholas
1,770
1,762
1,746
1,715
1,670
Pocahontas
584
574
554
529
500
Webster
612
605
594
578
559
Totals
5,420
5,433
5,399
5,319
5,199
WASTESHED F

3-17
Chapter 3: Efficiencies in Solid Waste Management
Wasteshed F is located in the southeastern
section of West Virginia and is primarily rural
with no large population centers. Wasteshed F
has three approved solid waste facilities. They
include the Greenbrier County Landfill near
Lewisburg, the Pocahontas County Landfill near
Marlinton, and the Nicholas County Landfill near
Summersville. The Webster County Landfill near
Webster Springs is currently non-operational.
Wasteshed F also has a waste tire monofill, WV
Tire Disposal near Summersville.
For calendar year 2011, the Greenbrier SWA
landfill processed a total of 47,587 tons of waste
or an average monthly tonnage of 3,699 tons, all
from Greenbrier and the surrounding West
Virginia counties. The Nicholas SWA landfill
processed 25,569 tons for the year or an
average of 2,131 tons a month. Pocahontas
SWA landfill processed 7,713 tons for the year
or an average of 643 tons a month. None of the
landfills in Wasteshed F processed any out of
state waste.
Population between the years 2015 and 2035 is
expected to decline in Nicholas and Webster by
5.6% and 8.6%. Pocahontas will decline by
14.4% and Greenbrier will grow by 0.6%.
Overall, Wasteshed F is expected to decline by
4.1%. Wasteshed F’s population, according to
the 2010 US Census was 79,586.
Table 3-10
CY 2011 Waste Stream Composition for Wasteshed F
Municipal Solid Waste* (MSW) Non-Municipal Waste (NMSW)*
Residential Waste 8.8% Industrial Waste 0.0%
Commercial Waste 72.4% Construction Demolition 10.1%
Sewage Sludge** 3.0% Petroleum Contaminated Soil 5.0%
Total MSW 84.2% Industrial Sludge 0.0%
Other Special Waste♦ 0.0%
Miscellaneous Waste 0.0%
Fee Exempt Waste♦ 0.6%
Total NMSW 15.7%
*Percentages may vary slightly due to rounding.
**According to 33CSR1, Solid Waste Management Rule, “Municipal Solid Waste means any household or commercial solid waste
as defined in this rule and any sludge from a waste treatment plant or a water treatment plant.” ♦Other special waste consists of various materials that must have special approval to be disposed of in a municipal solid waste
facility. For explanations of Special and Fee Exempt Waste, see Chapter 4 of this document.
WASTESHED F

3-18
Chapter 3: Efficiencies in Solid Waste Management
3.3.6 Wasteshed G
Figure 3-11
Population Projections 2015 through 2035 for Wasteshed G
Table 3-11
Projected Monthly Municipal Solid Waste Tonnage for Wasteshed G
2015
2020
2025
2030
2035
Fayette
3,077
3,026
2,965
2,880
2,779
McDowell
1,427
1,358
1,284
1,216
1,149
Mercer
4,192
4,161
4,115
4,050
3,963
Mingo
1,766
1,713
1,642
1,571
1,494
Monroe
893
870
850
823
793
Raleigh
5,369
5,388
5,380
5,322
5,251
Summers
916
900
867
844
809
Wyoming
1,554
1,489
1,423
1,348
1,274
Totals
19,194
18,905
18,526
18,054
17,512
WASTESHED G

3-19
Chapter 3: Efficiencies in Solid Waste Management
Wasteshed G includes the counties of Fayette,
McDowell, Mercer, Mingo, Monroe, Raleigh,
Summers, and Wyoming. The area has four
approved solid waste landfills; the Raleigh
County Landfill near Beckley, the HAM Landfill
near Peterstown, Copper Ridge Landfill in
McDowell County, and the Mercer County
Landfill near Princeton. Wasteshed G also has
4 operational transfer stations, all in Wyoming
County, serving the general public.
The population of all Wasteshed G counties will
decline with McDowell loosing 19.5%, Mingo
15.4%, and Wyoming 18.0%. In addition,
Summers will lose 11.7%, Monroe 11.2%,
Fayette 9.7%, Mercer 5.5%, and Raleigh 2.2%.
Overall, Wasteshed G will experience a
population decline of 8.8%. Wasteshed G’s
population, according to the 2010 US Census
was 287,339.
Wasteshed G landfills processed 205,272 tons
of waste in 2011 including 11,065 tons of out of
state waste. The 4 transfer stations processed
and shipped 4,826 tons of waste for the same
period.
Table 3-12
CY 2011 Waste Stream Composition for Wasteshed G
Municipal Solid Waste* (MSW) Non-Municipal Waste (NMSW)*
Residential Waste 36.9% Industrial Waste 0.2%
Commercial Waste 47.2% Construction Demolition 4.1%
Sewage Sludge** 3.2% Petroleum Contaminated Soil 2.8%
Total MSW 87.3% Industrial Sludge 0.2%
Other Special Waste♦ 2.6%
Miscellaneous Waste 0.0%
Fee Exempt Waste♦ 2.8%
Total NMSW 12.7%
*Percentages may vary slightly due to rounding.
**According to 33CSR1, Solid Waste Management Rule, “Municipal Solid Waste means any household or commercial solid waste
as defined in this rule and any sludge from a waste treatment plant or a water treatment plant.” ♦Other special waste consists of various materials that must have special approval to be disposed of in a municipal solid waste
facility. For explanations of Special and Fee Exempt Waste, see Chapter 4 of this document.
WASTESHED G

3-20
Chapter 3: Efficiencies in Solid Waste Management
3.3.7 Wasteshed H
Figure 3-12
Population Projections 2015 through 2035 for Wasteshed H
Table 3-13
Projected Monthly Municipal Solid Waste Tonnage for Wasteshed H
2015
2020
2025
2030
2035
Boone
1,636
1,604
1,563
1,515
1,463
Cabell
6,478
6,473
6,452
6,449
6,407
Calhoun
519
519
512
501
485
Kanawha
12,966
12,860
12,704
12,513
12,272
Lincoln
1,450
1,421
1,383
1,335
1,280
Logan
2,449
2,376
2,300
2,203
2,094
Mason
1,859
1,866
1,851
1,836
1,811
Putnam
3,855
3,935
3,977
3,995
3,987
Roane
997
976
945
904
862
Wayne
2,842
2,798
2,733
2,649
2,559
Totals
35,051
34,828
34,420
33,900
33,220
WASTESHED H

3-21
Chapter 3: Efficiencies in Solid Waste Management
Wasteshed H includes Boone, Cabell, Calhoun,
Kanawha, Lincoln, Logan, Mason, Putnam,
Roane, and Wayne counties. Wasteshed H
currently has three approved solid waste
facilities, the Charleston Landfill in Kanawha
County, Disposal Services Landfill, and
Sycamore Landfill both in Putnam County.
Wasteshed H also has 6 operational solid waste
transfer stations; Chesapeake, Marmet and St.
Albans in Kanawha County, Boone #1 and #2 in
Boone County, and Waste Management in
Logan County. Wasteshed H’s population,
according to the 2010 US Census was 520,318.
Overall, Wasteshed H is expected to have a
population decline of 5.2% from 2015 through
2035. Only Putnam County is expected to grow
with a projected growth rate of 3.4%. All others
will decline. The biggest losers will be Logan
County with a loss of 14.5%, Roane County at
13.6%, Lincoln County at 11.7%, Boone at
minus 10.5%, and Wayne at negative 10%. All
others will lose between 6.5% and 1.1%.
The landfills in Wasteshed H processed a total
of 401,437 tons of waste in 2011. Wasteshed H
transfer stations processed and shipped a total
of 69,701 tons of waste in the same period. Out
of state waste was not a significant factor for this
area.
Table 3-14
CY 2011 Waste Stream Composition for Wasteshed H
Municipal Solid Waste* (MSW) Non-Municipal Waste (NMSW)*
Residential Waste 37.8% Industrial Waste 1.3%
Commercial Waste 48.2% Construction Demolition 6.6%
Sewage Sludge** 2.4% Petroleum Contaminated Soil 0.7%
Total MSW 88.4% Industrial Sludge 1.5%
Other Special Waste♦ 0.1%
Miscellaneous Waste 0.0%
Fee Exempt Waste♦ 1.4%
Total NMSW 11.6%
*Percentages may vary slightly due to rounding.
**According to 33CSR1, Solid Waste Management Rule, “Municipal Solid Waste means any household or commercial solid waste
as defined in this rule and any sludge from a waste treatment plant or a water treatment plant.” ♦Other special waste consists of various materials that must have special approval to be disposed of in a municipal solid waste
facility. For explanations of Special and Fee Exempt Waste, see Chapter 4 of this document.
WASTESHED H

3-22
Chapter 3: Efficiencies in Solid Waste Management
3.4 MSW Waste Characterization
The Solid Waste Management Board funded a
study to obtain waste characterization data for
the State of West Virginia’s waste stream. The
data is designed to be utilized by municipalities,
county governments and communities as a
planning tool for managing waste management,
recycling and composting programs. The study
was conducted by GAI Consultants of
Charleston, WV and completed in March 1997.
The study determined that the per capita
generation rate in Wasteshed F was
approximately 3.7 pounds per person per day.5
Wasteshed F has no major municipal
populations. The study also found that the per
capita generation rate in Wasteshed H was
approximately 4.0 pounds per person per day.
Based on this data it was determined that the
average per capita waste generation for West
Virginia was 4 pounds per person per day. The
study briefly discussed the portion of the waste
stream that was considered recyclable but made
no effort to determine a recycling rate for West
Virginia.
The U.S. Environmental Protection Agency
(EPA) usually conducts an annual waste
characterization study. The EPA’s 2010 EPA
Waste Characterization Study found that the
average per capita disposal rate nationwide was
4.43 lbs. per person per day.6 The EPA also
found that 1.51 lbs., or 34%, of the 4.43 lbs. was
removed from the waste stream for recycling.
The following table and graphs examine the
various components of the two studies.
Table 3-15
GAI and EPA Study Comparisons for Waste Stream Compositions
1997 GAI Study 2010 US EPA Study
Paper 45.4% 28.5%
Plastics 15.4% 12.4%
Glass 7.8% 4.6%
Metals 5.3% 9.0%
Food 8.2% 13.9%
Yard Waste 6.7% 13.4%
Textiles 2.8% 8.4%

3-23
Chapter 3: Efficiencies in Solid Waste Management
Figure 3-13
Wasteshed H Composition – 1997 GAI Study
Figure 3-14
National Average Waste Stream Composition – 2010 US EPA Study
Paper 45.4%
Plastics 15.4%
Glass 7.8%
Metals 5.3%
Food 8.2% Yard Waste
6.7% Textiles 2.8%
1997 GAI Study
Paper 28.5%
Plastics 12.4% Glass 4.6%
Metals 9.0%
Food 13.9%
Yard Waste 13.4%
Textiles 8.4%
2010 US EPA Study
3-24
Chapter 3: Efficiencies in Solid Waste Management
END NOTES FOR CHAPTER 3
1. West Virginia Population Projections by County, Age and Sex 2015 – 2035, Christiadi, PhD, Regional
Research Institute, West Virginia University, March 2010.
2. Holmes, Darrell E., ed., West Virginia Blue Book: 2005, Chapman Printing Company, Charleston, WV,
2005, p. 1050.
3. Population Estimates Program, U.S. Census Bureau, Washington, D.C.
4. Monthly landfill tonnage reports submitted to the WV Department of Environmental Protection, West
Virginia Solid Waste Management Board, West Virginia Public Service Commission and applicable
county or regional solid waste authorities by the state’s public and private landfill operators as required
by 33CSR1- 4.12.b. for CY 2011.
5. GAI Consultants, Solid Waste Characterization Study for Wasteshed F and Wasteshed H in West
Virginia March 1997.
6. US EPA: Municipal Solid Waste Generation, Recycling, and Disposal in the United States: Facts and Figures for 2010.

Chapter 4
Solid Waste Facility Status

4-1 Chapter 4: Solid Waste Facility Status
Chapter 4: Solid Waste Facility Status The following chapter details the status of municipal solid waste (MSW) facilities in West Virginia. Landfills, transfer stations, composting facilities, material recovery facilities (MRFs), and other solid waste facilities are discussed in detail. Currently, the state has 18 operational landfills, 18 operational transfer stations, 3 operating tire monofills and 4 commercial composting facilities.
4.1 Public vs. Privately Owned Landfills Publicly and privately owned landfills are inherently very different. This section describes some of the most important differences between the two. Public landfills are usually operated by local governmental entities. The primary purpose of a
public landfill is to provide the least expensive long-term waste disposal service to the community it serves. Because of the importance of the long-term needs, public landfills tend to accept waste mainly from their community. Limiting the amount of waste, however, limits the available revenue for the landfill and is one reason why the tipping fee at a public landfill is usually higher than at a private landfill. Private landfills, on the other hand, are in business to make a profit and tend to serve higher population density areas. The following table demonstrates that public sector landfills are using 36% of their permitted monthly capacity while private sector facilities are using 64% of available permitted capacity. Overall, the state is using 53% of its total permitted monthly landfill capacity.
Table 4-1 Public & Private Landfills in West Virginia
PUBLIC FACILITIES Monthly Tonnages
WS Class Facility Name *Type of Facility
**Tipping Fee
Permitted Tonnage
Out-Of-State Waste
Average Tonnage
% of Permitted
B B Tucker County MSW $47.50 9,999 18 6,352 64%
F B Greenbrier County MSW $46.75 5,500 0 3,966 72%
B Nicholas County MSW $69.25 9,999 0 2,131 21%
B Pocahontas County MSW, CD* $57.75 1,400 0 643 46%
G A Copper Ridge† MSW $42.50 50,000 0 1,556 3%
B Mercer County MSW $46.75 9,999 102 3,253 33%
A Raleigh County MSW, CD* $41.75 16,638 0 10,113 61%
H A Charleston† MSW $40.00 24,157 0 18,253 76%
Average/Totals $49.03 127,692 120 5,783 36%
*MSW (Municipal Solid Waste). *CD (Has a dedicated Construction & Demolition cell). **Tipping Fees represent charges for depositing one ton of municipal solid waste in each specified facility and include landfill fees and state and local assessment fees. †Both Copper Ridge and Charleston Landfills are publicly owned and privately managed.

4-2 Chapter 4: Solid Waste Facility Status
PRIVATE FACILITIES Monthly Tonnages
WS Class Facility Name *Type of Facility
**Tipping Fee
Permitted Tonnage
Out-Of-State Waste
Average Tonnage
% of Permitted
A A Brooke/Valero MSW $35.25 20,000 1,822 3,102 16%
A Short Creek MSW $28.05 30,000 6,422 29,125 97%
B Wetzel MSW $28.75 9,999 521 6,838 68%
B A Meadowfill MSW $45.35 30,000 539 29,131 97%
B S & S MSW $46.75 9,999 174 7,378 74%
C A Northwestern MSW $42.05 30,000 3,905 18,289 61%
E B LCS MSW $50.30 9,999 1,227 9,657 97%
G B HAM MSW $43.75 9,999 820 2,183 22%
H A Disposal Services MSW $48.25 20,000 0 8,362 42%
A Sycamore MSW $38.75 20,000 0 6,838 34%
Average/Totals $40.72 189,996 15,430 120,903 64%
*MSW (Municipal Solid Waste). **Tipping Fees represent charges for depositing one ton of municipal solid waste in each specified facility and include landfill fees and state and local assessment fees.
4.2 Solid Waste Facility Operations 4.2.1 Introduction West Virginia’s municipal solid waste landfill operating procedures are defined by Title 33, Series 1, Solid Waste Management Rule, which establishes requirements for the siting, financial assurance, instal lat ion, establ ishment, construction, design, groundwater monitoring, modification, operation, permitting, closure and post-closure care of any solid waste facility that processes, recycles, composts, transfers or disposes of solid waste. Title 33, Series 1 Rules requires training and certification of landfill managers. Landfills are required to maintain detailed records of daily operations as well as a complete and detailed operations plan.
4.2.2 Acceptance of Non-Municipal Waste Landfills that accept municipal solid waste, defined by WV Code Rule §33CSR1 as residential and commercial solid waste and sludge from a waste treatment or a water supply treatment plant, may also accept agricultural waste, commercial waste, compost, construction waste, debris, demolition waste, industrial waste, non-municipal incinerator ash, putrescible waste, scrap metal, sludge, bulky goods and properly treated infectious waste if they have a permit modification or written permission from the Secretary of the DEP. Waste that is not acceptable unless approved by the Secretary includes, free liquids, non-excluded hazardous waste as defined under 40 CFR §261.3, unstabilized sludges, unprepared pesticide containers, unprepared drums and untreated infectious waste. Table 4-2 covers a few of the more common types of non-municipal waste accepted at municipal landfills.

4-3 Chapter 4: Solid Waste Facility Status
Table 4-2 Non-Municipal Waste Accepted at West Virginia Landfills
Facility
Industrial Waste and/or Sludge
Electronic Waste*
Appliances Refrigerated Appliances
Marcellus Shale Waste
Asbestos C/D
Waste Yard Waste
- Brush
Brooke/Valero <> <> <> <> <> <> <> Charleston <> <> <> <> Copper Ridge <> <> <> <> Disposal Services <> <> <> <> Greenbrier <> <> <> <> <> Ham <> <> <> <> <> <> <> LCS <> <> <> Meadowfill <> <> <> <> <> <> <> Mercer County <> <> <> <> <> <> Nicholas County <> <> <> Northwestern <> <> <> <> <> Pocahontas County <> <> <> <> Raleigh County <> <> <> <> <> S & S Grading <> <> <> <> <> <> Short Creek <> <> <> <> Sycamore <> <> <> <> <> Tucker County <> <> <> <> <> <> Wetzel County <> <> <> <> <> <> <>
*Electronic waste can be collected at the state’s landfills for recycling purposes only. Electronic waste cannot be
deposited in the state’s landfills as per W.Va. Code §22-15A-22(d.) Effective January 1, 2011. Yard waste and brush can only be deposited in the state’s landfills by permit modification or by special permission from the Secretary of the Department of Environmental Protection.
In addition to waste classified as Special Waste, some waste is classified as Fee Exempt Waste, making it exempted from all or part of the assessment fees. Examples of Fee Exempt Waste are:
Waste disposed of on “Free Day”. All solid waste facilities in West Virginia must provide one day a month when up to one pickup truck of residential waste may be disposed of free of charge.
Special waste projects. Spring cleanups are included in this category; they require written exemption from the DEP.
West Virginia Code makes several other allowances for exemptions;
o §22-15-11(e)(1), an owner of a facility, if the facility is used exclusively to depose waste
originally produced by such person in a regular business owned by that person, can deposit waste generated by that business without paying an assessment fee.
o §22-15-11(e)(2), Reuse or recycling of any solid waste is exempt from the assessment fees.
o §22-15-11(e)(3), the Secretary o f t h e D e p a r t m e n t o f Environmental Protection may grant an exemption to anyone not in the business of hauling or disposing of solid waste on designated days and times.
o §22-15-11(e)(4), disposal by any commercial recycler who

4-4 Chapter 4: Solid Waste Facility Status
disposes thirty percent or less of total waste recycled can dispose of waste at any commercial facility without paying the assessment fee.
In CY 2011, of total waste collected at the state’s landfills, 61.5% was municipal solid waste, 3.5% industrial waste, 2.3% industrial sludge, 9.5% C & D waste, 10.1% petroleum contaminated soil, and 8.8% was classified as other waste. The balance was composed of various items such as bulky goods, waste tires, yard waste and other things. 4.2.3 Landfill Planning, Reporting And Record Keeping Requirements Landfill operators have multiple reporting, record keeping and planning requirements. They must maintain a detailed daily log describing the type, amount and source of all waste accepted, any waste handling problems, deviations from operations plans and corrective actions taken. Landfill operators are also required to keep records of inspections and gas and leachate monitoring. They also have to maintain a detailed operations plan. Plans must contain an alternative location approved by the Secretary, list of equipment and backup equipment, list of local emergency response contacts, a list of engineering consultants available to the facility, a listing of all municipal, commercial and industrial customers, the waste type accepted and excluded from the facility. It must detail handling techniques for managing unusual waste, procedures for excluding hazardous waste, plans for drainage and erosion controls, fire protection plans, methods for disease vector, dust and odor control and procedures to prevent salvaging and other things as specified in Title 33, Series One, Solid Waste Management Rule. Also required are the submissions of monthly tonnage reports detailing amounts, type and
source of waste accepted. These reports go to the Secretary of the DEP, the Solid Waste Management Board, the Public Service Commission, and the local solid waste authority. 4.2.4 Capacity Contracts When a solid waste facility agrees to take in a minimum, specific amount or percentage of tons of solid waste from any hauler of solid waste during a specific period of time they use capacity contracts. The PSC reviews and approves capacity contracts on a case-by-case basis. All parties to such contracts will have the burden of showing that a “put or pay” provision in a particular contract is justified. 4.2.5 Performance Reviews During the 2005 legislative session, House Bill 3356 was passed, giving the Solid Waste Management Board the authority to establish standards of performance for solid waste facilities owned by SWAs and to develop a uniform chart of accounts to be adopted by all county and regional solid waste authorities. Authority owned facilities are examined periodically using common standards designed to maintain optimal operational integrity. If a facility is identified as seriously impaired, the SWMB will intervene and provide the technical assistance necessary. If impairments cannot be corrected, supersedure of the facility by the SWMB may follow. Rules governing these procedures can be found in Title 54, Series 6, Performance Measures and Review Standards for Solid Waste Authorities Operating Commercial Solid Waste Facilities. http://apps.sos.wv.gov/adlaw/csr/rule.aspx?rule=54-06

4-5 Chapter 4: Solid Waste Facility Status
4.3 Landfill Status - Estimated Lifespan and Potential Impact on Solid Waste Management
On June 8, 1993, West Virginia had a total of 38 permitted MSW landfills in operation. As of October 2012, there are 18 operational facilities.
This section will examine each of the operational facilities in West Virginia, including the capacity of the state’s operational facilities to manage current and future levels of waste output and the likelihood of them continuing to operate through the end of the 20 year planning period.
Table 4-3 Operational Landfills
WS No. Class Facility Name County Status Permit Limit Tons/Month
A 1 A Brooke/Valero Brooke Permitted and Operational 20,000
2 A Short Creek Ohio Permitted and Operational 30,000
3 B Wetzel Wetzel Permitted and Operational 9,999
B 4 A Meadowfill Harrison Permitted and Operational 30,000
5 B S & S Harrison Permitted and Operational 9,999
6 B Tucker County Tucker Permitted and Operational 9,999
C 7 A Northwestern Wood Permitted and Operational 30,000
E 8 B LCS Berkeley Permitted and Operational 9,999
F 9 B Greenbrier County Greenbrier Permitted and Operational 5,500
10 B Nicholas County Nicholas Permitted and Operational 9,999
11 B Pocahontas County Pocahontas Permitted and Operational 1,400
G 12 A Copper Ridge McDowell Permitted and Operational 50,000
13 B HAM Monroe Permitted and Operational 9,999
14 B Mercer County Mercer Permitted and Operational 9,999
15 A Raleigh County Raleigh Permitted and Operational 16,638
H 16 A Charleston Kanawha Permitted and Operational 24,157
17 A Disposal Services Putnam Permitted and Operational 20,000
18 A Sycamore Putnam Permitted and Operational 20,000

4-6 Chapter 4:
Map 4-1 Operation
Brooke/VLandfill ishas a lifeClass A faper month2011 wasits permitBrooke, HOhio couHarrison, Alleghenycounties averaged October 2ton. Consummer osize and cubic yardthe cell is CharlestoCharlestoabout 12 yof Char
: Solid Waste
nal Landfills
Valero Landfis owned by J expectancy acility, permith. Brooke’s s 3,102 tons tted capacityHancock, Maunties in We
and Jeffersoy, Washingtoin Pennsylva1,822 tons p
2012 their tipstruction of thof 2012. Thewill give Broods of airspac4 years or gr
on, City oon Landfill hyears. The fa
rleston and
e Facility Statu
ill (1): The Br. P. Mascaroof about 30
tted to accepaverage wasper month, a
y. They curshall, Wetze
est Virginia; on counties
on, Fayette, ania. Out-ofper month in pping fee waheir next cell e cell will beoke an additice. The anticreater.
f (16): Tas a life exacility is owne
managed
us
rooke Countyo & Sons and
years. It is at 20,000 tonsste intake forabout 15% ofrrently serve
el, Tyler, andColumbiana,in Ohio andand Beaver
f-state waste2011. As ofs $35.25 perbegan in the 3.9 acres inonal 637,000cipated life of
The City ofxpectancy ofed by the City
by Waste
y d a s r f e d , d r e f r e n 0 f
f f y e
Manpermmonwas capafaciliLogafaciliConsapprlifesp CopMcDmanto acfifty McDby thwastfacilicounrail fof th
agement, Inmitted to accth. The ave
18,253 or acity. In addity serves paan, Putnam ities tippingstruction of roximately 5 pan by 6.5 ye
pper Ridge (1Dowell Count
aged by Enviccept 50,000 thousand to
Dowell countyhe WV DEP te intake fority currently snties but has from outside ohe landfill is
nc. It is acept 24,157 terage month
about 76% ition to Kanaarts of Boon
and Roan fee is $their next cyears exten
ears.
12): This facilty Solid WairoSolutions, tons of wast
onnage cap y voters in 19in 1998. The
r 2011 was serves McDowthe ability to
of the state. currently 10
a Class A ftons of wastly intake for of its permawha Countyne, Clay, Fane counties. $40.00 per cell will beg
nding the fac
ity is owned bste AuthorityInc. It is permte per month.was approve
992 then appe average mo1,556 tons. well and Wyo
o accept wastThe remainin
00 or more y
facility te per
2011 mitted y, the ayette,
The ton.
gin in cilities
by the y and mitted . The ed by proved onthly The
oming te, via ng life years.

4-7 Chapter 4: Solid Waste Facility Status
The tipping fee is $42.50 per ton. Copper Ridge expects to start construction of the next landfill cell in 2014. Size and cost had not been determined. Disposal Services Landfill (17): This facility is located in Putnam County and owned by Waste Management, Inc. It has an expected lifespan of 54 years. In 2011, Disposal Services’ average waste intake per month was 8,362 tons or about 42% of its permitted 20,000 monthly limit. Disposal Services primarily serves Putnam, Kanawha and Logan counties and occasionally Wayne, Lincoln and Mason. Their tipping fee is $48.25 per ton. Construction of the next cell began in 2012, is 5.6 acres in size and provides an estimated 1,512,000 cubic yards of landfill airspace. This is expected to extend the landfills lifespan 8 years. Greenbrier County Landfill (9): This facility is owned and operated by the Greenbrier County Solid Waste Authority. Permitted for 5,500 tons per month, they averaged 3,966 tons or about 72% of capacity in 2011. The facility primarily serves Greenbrier, Summers and Monroe counties with occasional service to Nicholas and Fayette. Greenbrier has a life expectancy of at least 75 years. Due to declining tonnage, the facility was compelled to seek partial financing for a cell construction in 2008 through the SWMB. Greenbrier’s tipping fee is $46.75 per ton. The construction of their next cell is currently in progress. It is 5.5 acres in size and is expected to last 2 years. Greenbrier sometimes uses Marcellus drill cuttings and yard waste for daily cover. HAM Sanitary Landfill (13): HAM is privately owned by Harry D. Humphrey, Jr. and is located in Monroe County. The facility is permitted to accept 9,999 tons of waste per month but throughout 2011, only averaged 2,183 tons or about 22% of total permitted capacity. The current life expectancy of the facility is about 50 years. Approximately 37% of waste deposited in Ham originates out-of-state. The facility serves
only Monroe County and a small portion of Virginia. HAM’s tipping fee is $43.75 per ton. The facilities last completed cell was 3.1 acres and cost $742,383. HAM expects to begin construction of their next cell sometime in 2015. Current planning calls for a large cell, 27.7 acres to be built in stages. The entire cell is expected to last approximately 20 years. LCS Landfill (8): Located in Berkeley County, near Hedgesville, the facility is owned by Waste Management of West Virginia, Inc. The landfill is a Class B facility permitted for 9,999 tons of waste per month and used approximately 97% of its permitted capacity in 2011. LCS has a life expectancy of 35 years. The facility serves primarily Jefferson, Berkeley and Morgan counties and occasionally Hampshire and Mineral in West Virginia, as well as various entities in VA, MD and PA. Approximately 12% of the facilities intake comes from out-of-state. LCS’s tipping fee is $50.30 per ton. In recent years, the owners have attempted to have the facility reclassified as a Class A facility. This would allow monthly tonnages to increase. This has been opposed by the local Solid Waste Authority. Meadowfill Landfill (4): Located in Harrison County, Meadowfill, owned by Waste Management, Inc., is permitted to accept 30,000 tons of waste per month. The facility used approximately 97% of its permitted capacity in 2011. Meadowfill has a life expectancy of about 70 years. It is a large facility who’s primary customers are from Harrison, Barbour, Braxton, Doddridge, Marion, Monongalia and Preston counties with smaller amounts flowing in from Tucker, Wetzel, Lewis, Gilmer, Hardy, Taylor, and other places in West Virginia, as well as from OH, PA, NY and VA. Their tipping fee is $45.35. Meadowfill is expected to begin construction of their next cell sometime in 2012. The cell will be 8.5 acres in size, create 1,215,000 cubic yards of airspace and last approximately 2 years.

4-8 Chapter 4: Solid Waste Facility Status
Mercer County Landfill (14): Owned and operated by the Mercer County Solid Waste Authority, this facility is permitted to accept 9,999 tons of waste per month. In 2011, Mercer averaged 3,253 tons a month, about 33% of its permitted capacity. They have a life expectancy of about 50 years. Mercer provides services primarily for their home county and occasionally for Summers and McDowell counties in West Virginia and Bland County Virginia. Like many border county landfills, the Mercer facility has had a shrinking tonnage problem because out-of-state facilities charge lower tipping fees. Mercer’s tipping fee is $46.75 per ton. The primary out-of-state facility serving Mercer County is the Bristol VA landfill whose tipping fee undercuts the Mercer facility by approximately one third. Mercer expects to begin construction of their next cell sometime in 2016. The cell will be approximately 3 acres in size, provide 250,000 cubic yards of airspace and last about 4 years. Nicholas County Landfill (10): Owned and operated by the Nicholas County Solid Waste Authority, the facility is permitted to accept 9,999 tons of waste per month. The 2011 monthly intake was 2,131 tons, approximately 21% of its permitted capacity. At the current tonnage level, the projected lifespan for the Nicholas facility is around 70 years. The facility primarily serves Nicholas and Webster counties but also receives waste from the counties of Braxton, Clay, Fayette, Gilmer, Greenbrier and others. Nicholas’s tipping fee of $69.25 was established in 1995. The current 9.2 acres disposal cell, Cell 5, will be three phases. Phase 2, completed in 2010, was 4.6 acres. The Authority is planning to permit and construct the landfill’s first C&D (construction and demolition) cell which will help lengthen the life of its current disposal cell. During a regularly scheduled performance evaluation in mid-2011, the Solid Waste Management Board, by authority of W. Va. Code §22C-4-9a, identified the facility as being impaired. Technical assistance was rendered by the SWMB and the facility was
brought back in line with guidelines established by WV Code, Title 54, Series 6 rules by early 2012. Northwestern Landfill (7): Located in Wood County, the facility is owned by Waste Management, Inc. Northwestern is permitted to accept 30,000 tons of waste per month. Their 2011 monthly average intake was 18,289, 61% of permitted capacity. The facility primarily serves Wood, Wirt, Ritchie, Pleasants and Jackson counties in West Virginia and Washington County Ohio with smaller amounts of waste coming in from Doddridge, Tyler and other counties in both West Virginia and Ohio. In 2011, approximately 21% of the facilities intake came from Ohio. This facility’s tipping fee is $42.05 per ton. Northwestern began construction of the next cell in early 2012. The cell is approximately 6 acres, which will create 600,000 cubic yards of airspace and is expected to last about 2 years. Pocahontas County Landfill (11): Owned by the Pocahontas County Solid Waste Authority, the facility is permitted to accept up to 1,400 tons per month with actual 2011 monthly tonnage averaging 643 tons or about 46% of permitted capacity. The facility has a projected lifespan of 9.2 years with its current permitted acreage. The Pocahontas County Landfill serves only its home county. Their tipping fee is $57.75. The SWA will begin construction of their next cell in the spring of 2013. The cell will be 1.1 acres, provide 95,700 cubic feet of airspace and have a life span of 7.2 years. Raleigh County Landfill (15): Owned by the Raleigh County Solid Waste Authority, the facility is permitted to accept 16,638 tons of waste per month. Tonnage reports for 2011 indicate an average monthly intake of 10,113 tons per month, approximately 61% of permitted capacity. The facility has a life expectancy of 100 years. Raleigh primarily serves Raleigh, Wyoming and Summers counties. The facility charges a tipping fee of $41.75 per ton.

4-9 Chapter 4: Solid Waste Facility Status
Construction of Raleigh’s next cell was in progress in the summer of 2012. The 5 acre cell will provide 500,000 cubic yards of airspace and last approximately 3.5 years. S & S Grading Landfill (5): S & S is located in Harrison County and owned by Waste Management, Inc. The facility is permitted to accept 9,999 tons of waste per month. Their 2011 average monthly intake was 7,378 tons or 74% of permitted capacity. The life expectancy of S & S Landfill is approximately 32 years. The facility primarily serves Harrison, Lewis, Gilmer and Barbour counties also processing smaller amounts of waste from Braxton, Doddridge, Upshur, Webster and other counties. S & S Grading charges a tipping fee of $46.75 per ton. S & S began construction of their current cell in early 2010. The cell was 2.8 acres in size, created 387,400 cubic yards of airspace and is expected to last 2 years. Short Creek Landfill (2): Short Creek is located in Ohio County and owned by Republic Services, Inc. The facility is permitted to accept 30,000 tons per month with an actual 2011 average monthly intake of 29,125 tons or about 97% of permitted capacity. Short Creek has a projected lifespan of about 51 years. The facilities primary customers come from Ohio, Brooke, Marshall and Hancock counties in West Virginia; Allegheny, Green and Washington counties in Pennsylvania and Carroll and Jefferson counties in Ohio. Approximately 21% of the facilities 2011 waste intake came from out-of-state. Short Creek’s tipping fee is $28.05. Construction was underway for the next cell during the summer of 2012. The cell will be 3.2 acres in size, provide 400,000 cubic yards of airspace and last approximately 2 year. Sycamore Landfill (18): Sycamore is located in Putnam County and owned by Republic Services, Inc. The facility is permitted to accept 20,000 tons per month with an average actual 2011 monthly waste intake of 6,838 tons or about 34% of permitted capacity. Lifespan for
the facility is projected at around 40 years. Sycamore’s primary customers are located in Putnam, Cabell, Wayne, Kanawha, and Lincoln counties. This Putnam County facility has a PSC approved tipping fee of $38.75. Cell construction for the next unit was underway during mid-2012. The cell will be built in two sections, the first 1.5 acres and about 175,000 cubic yards in airspace. The second part will begin in 2013 and be 2.9 acres and about 185,000 cubic yards in airspace. The combined cell will be 4.4 acres and last approximately 4.4 years. Tucker County Landfill (6): Owned by the Tucker County Solid Waste Authority, the facility is permitted to accept 9,999 tons of waste per month. Actual 2011 intake was 6,352 or about 64% of permitted capacity. The facility has an expected lifespan of at least 50 years. Tucker is considered a critical facility in the state’s solid waste system providing services for a large area in and around the eastern panhandle including Tucker, Grant, Hardy, Hampshire, Pendleton, Preston, Randolph and other counties in West Virginia and taking in smaller amounts of waste from the Cumberland and Oakland, Maryland areas. Tucker’s tipping fee is $47.50 per ton of municipal waste. Construction of the next cell was underway during the summer of 2012. The size of this cell will be about 20 acres with approximately 5,327,800 cubic yards of airspace. This cell will then be divided into smaller sub-cells. Wetzel County Landfill (3): The Wetzel facility is owned by J. P. Mascaro & Sons and permitted to accept up to 9,999 tons of waste per month. Their 2011 average monthly intake was 6,838 tons per month or about 68% of permitted capacity. The facility has an expected lifespan of 100 or more years. The facilities primary clientele are from Wetzel, Tyler and Pleasants counties in West Virginia and Monroe County, Ohio. Approximately 7% of the facilities waste comes from Ohio. Wetzel County’s tipping fee is $28.75 per ton. Construction of the facilities

4-10 Chapter 4: Solid Waste Facility Status
next cell will begin sometime in 2013. The cell will be 4.1 acres, will create 800,000 cubic feet of airspace and is expected to last 4 years. Summary: For CY 2011 the state’s 18 landfills processed a total of 2,012,390 tons of waste. This amounts to approximately 53% of the total permitted capacity for these facilities. Of this amount, 1,238,509 tons were classified as municipal waste, the other 773,881 tons as various types of special waste. The makeup of this special waste includes 3.5% industrial waste, 2.3% industrial sludge, 9.5% construction and demolition waste, 10.1% petroleum contaminated soil, 8.8% other special waste and 1.6% classified as miscellaneous waste. The average tipping fees of the 18 operational facilities listed for municipal solid waste was $44.42 per ton. Over the next 4 years state landfills either have under construction or intend to construct, an estimated 65 acres of landfill cell space, creating approximately 8,000,000 cubic yards of landfill airspace at an estimated cost of $24,200,000. In 2011, 3,775 tons of bulky goods were recycled by the state’s landfills. In addition, Northwestern, Short Creek, Meadowfill, the City of Charleston, Brooke County, S & S Grading, Tucker County and Wetzel County landfills use either shredded tires or petroleum contaminated soil for daily cover and/or as a drainage material at their facilities. This process used 63,830 tons of waste saving approximately 127,660 cubic feet of valuable landfill airspace as well as approximately $630,000 in cell construction cost. Progressive management practices such as these tend to create a more efficient operating environment for these facilities.
4.4 Consolidation in the Solid Waste Industry Beginning in the late 1990s and continuing through 2004, there was a lot of consolidation in the waste industry. In some cases management contracts were put into place that took advantage of corporate economies of scale while leaving ownership with the public. The primary waste management corporations doing business in West Virginia are Allied Waste Services of North America, LLC and various divisions of Waste Management, Inc.
For 2010 through the present, the trend toward corporate ownership of solid waste facilities and service providers slowed. However, during 2011, the PSC granted Republic Services permission to purchase the Monongalia County transfer station from Suburban Sanitation along with two CONs held by Suburban. The facility is located near Morgantown. 4.5 Imports and Exports of Solid Waste In 2011, the state exported 378,879 tons of waste while importing 184,898 tons creating a positive export balance of 193,981 tons. The consequence of not collecting the $8.25 tipping fee on these tons is a loss of approximately $1,600,343 in assessment fees. The Southern Ohio Disposal case, discussed in Chapter 2, created a situation where out-of-state waste haulers collect garbage in West Virginia without obtaining a Certificate of Need (CON) from the PSC and dispose of that waste in out-of-state facilities. This not only allows an additional drain on state and local funding but also creates an unfair competitive advantage for out-of-state garbage haulers. In the past, the ownership of one or more CON’s has greatly increased the value of garbage hauling businesses. The Southern Ohio Disposal case may also have the effect of devaluing this entire business sector.

4-11 Chapter 4: Solid Waste Facility Status
Table 4-4 Solid Waste Exported to Out-of-State Landfills: 2011
Total Solid Waste Exported (tons)
2003 2005 2007 2009 2011
Kentucky 154,684 97,134 113,127 125,917 80,085
Maryland 5,651 8,844 10,672 13,810 13,810
Ohio 87,592 116,459 126,624 129,998 171,925
Pennsylvania 89,323 158,539 156,856 55,832 85,871
Virginia 45,724 35,533 33,060 27,188 27,188
Totals 382,974 416,509 440,339 352,745 378,879
Table 4-5 Solid Waste Imported to West Virginia: 2011
Total Solid Waste Imported (tons)
2003 2005 2007 2009 2011
Brooke/Valero 23,737 29,783 30,754 37,395 21,865
LCS 10,692 36 8,603 16,072 14,727
Meadowfill 19,961 15,003 261 923 6,470
Short Creek 92,861 59,194 61,998 38,602 77,067
Northwestern 69,427 48,363 59,168 38,237 46,861
Wetzel County 18,956 6,659 8,935 6,628 6,253
All Others 1,630 7,554 5,327 4,835 11,655
Totals 237,264 166,592 175,046 142,692 184,898

4-12 Chapter 4: Solid Waste Facility Status
Table 4-6 MSW Landfills Within 75 Miles of West Virginia that Accept Out-of-State Waste
Facility Name Location Disposal Cost Per/Ton MSW
FY 2011 WV Tonnage
Ownership
Kentucky Landfills
Big Run Ashland, KY $33.50 15,015 EnviroSolutions
Green Valley* Greenup, KY $34.60 61,405 Republic Services
Pike County (Ford Branch) Pikeville, KY $33.50 3,665 Pike Co. Fiscal Court
Average/Total $33.87 80,085
Maryland Landfills
Mountianview* Frostburg, MD $46.35 13,810 Waste Management
Average/Total $46.35 13,810
Ohio Landfills
APEX Sanitary Landfill* Amsterdam, OH $0.00 929 Apex Environmental
Athens Hocking Landfill Logan, OH $22.00 82,060 Kilbarger Construction
AWA America Landfill* Waynesburg, OH $37.50 20,131 American Landfill
Mahoning Landfill New Springfield, OH $35.75 10,859 Waste Management
Meigs Co. Transfer Station Logan, OH $30.00 2,339 Kilbarger Construction
BFI Carbon Limestone* Lowellville, OH $0.00 1,382 Carbon Limestone, LLC
Gallia County Bidwell, OH $45.00 26,728 Waste Management
Pine Grove* Amanda, OH $28.00 2,245 Republic Services
Beach Hollow Wellston, OH $28.00 24,078 Rumpke Waste
WMI Suburban* (South) Glenford, OH $38.00 1,174 Waste Management
Average/Total $26.43 171,925
Pennsylvania Landfills
Arden Washington, PA $65.00 27,947 Waste Management
IESI Greenridge Scottdale, PA $72.00 3,062 Republic Services
IESI Blueridge Scotland, PA $72.00 3,701 ISEI Blueridge
Imperial* Imperial, PA $56.12 18,673 Republic Services
Modern Landfill York, PA $63.00 57 Republic Services
Mountain View* Greencastle, PA $0.00 32,301 Waste Management
Westmoreland* Belle Vernon, PA $28.00 130 Westmoreland
Average/Total 50.87 85,871
Virginia Landfills
City of Bristol* Bristol, VA $30.00 27,188 City of Bristol
Average/Total $30.00 27,188
Total Tonnage 378,879 *Indicates 2011 tipping fees and tonnage figures.

4-13
Chapter 4: Solid Waste Facility Status
4.6 Summary of Statewide Landfill Closure
Plan
Senate Bill 18, passed by the WV Legislature on
October 18, 1991, established the solid waste
Landfill Closure Assistance Program. Its
purpose was to assist permitees in the closure
of facilities that could not operate in an
environmentally sound manner.
Proper closure of these facilities would prevent
leachate from contaminating ground and surface
waters, minimize the migration of decomposition
gases, limit soil erosion and ensure the long
term integrity of closed landfills. The DEP Office
of Environmental Remediation (DEP-OER)
submitted a Statewide Closure Plan to the
Governor and Legislature in December, 1992.
The plan was updated in 2000 and 2006. The
primary points and conclusions from this plan
are excerpted and summarized in this section.
Rather than have so many landfills left in an
unreclaimed state for an indefinite period of
time, the Legislature decided it would be in the
best interest of the citizens of the state to
provide a mechanism for the timely and orderly
closure and reclamation of these facilities. The
rules governing proper closure of landfills
became effective on November 4, 1988, and the
legislation creating the Landfill Closure
Assistance Program (LCAP) was enacted as a
part of a larger solid waste reform bill in October
1991 as S.B. 18. The DEP - OER received
thirty-four (34) applications for closure
assistance funding and determined that twenty-
eight (28) were eligible. Two more were later
added.
The Closure Assistance Program includes:
Closure design, including analysis of the
effect of the facility on groundwater and
design measures necessary to protect and
monitor groundwater.
Construction of closure-related structures to
provide leachate management, sediment
and erosion control, gas management,
groundwater monitoring, and final cover and
capping to meet the Solid Waste
Management Act, §22-15.
Monitoring of surface and groundwater
required by the Water Pollution Control Act,
§22-11 and the Solid Waste Management
Act, §22-15.
Remedial actions to protect groundwater
and surface water, other natural resources,
and the health and safety of West Virginians
to the extent that funds are available.
Post-closure monitoring and maintenance,
which includes leachate management during
the 30-year post closure monitoring period.
One landfill, the Monongalia County Sanitary
Landfill, is owned and operated by the SWMB.
The Board applied and was accepted for closure
assistance, and the landfill is capped and in
post-closure at the time of this writing. The
landfill ceased operation on September 30,
1993.
Overall, 25 facilities are in the Post-Closure
monitoring and maintenance phase and the five
remaining facilities are all expected to be closed
by 2018. More information on the LCAP
Program is available at:
http://www.dep.wv.gov/dlr/oer/LCAP/Pages/defa
ult.aspx
The following facilities have been accepted into
the LCAP program.

4-14 Chapter 4: Solid Waste Facility Status
Table 4-7 Non-Operational Landfills
WS No. Facility Name County Status LCAP Status
A 19 Moundsville Marshall Closed - LCAP Post Closure
20 Wheeling- North Park Ohio Closed - LCAP Closure
B 21 Big Bear Preston Closed - LCAP Post Closure
22 Buckhannon Upshur Closed - LCAP Post Closure
23 Central WV Refuse Braxton Closed - LCAP Post Closure
24 Clarksburg Harrison Closed - LCAP Closure
24-b Elkins/Randolph Randolph Closed - Unknown Non-LCAP
25 Kingwood Preston Closed - LCAP Closure
26 Marion County Marion Closed - LCAP Closure
27 Monongalia County Monongalia Closed - LCAP Post Closure
28 Morgantown Monongalia Closed - LCAP Post Closure
29 Preston (Rehe) Preston Closed - LCAP Post Closure
C 30 Jackson County Jackson Closed - LCAP Post Closure
E 31 Berkeley County Berkeley Closed - LCAP Post Closure
32 Capon Springs Hampshire Closed - LCAP Post-Closure
33 Hampshire County Hampshire Closed - LCAP Post Closure
34 Jefferson County Jefferson Closed - LCAP Post Closure
35 Morgan County Morgan Closed - LCAP Post-Closure
36 Petersburg Grant Closed - LCAP Post Closure
F 37 Webster County Webster Closed – Non - LCAP Non - LCAP
G 38 Fayette County Fayette Closed - LCAP Post Closure
39 Midwest Disposal Summers Closed - LCAP Post Closure
40 McDowell (Old) McDowell Closed - LCAP Post Closure
41 Mingo County Mingo Closed - LCAP Post Closure
42 Montgomery Fayette Closed - LCAP Post Closure
43 Wyoming County Wyoming Closed - LCAP Post Closure
H 44 Don’s Disposal Kanawha Closed - LCAP Post Closure
45 E.R.O. Mason Closed - LCAP Post Closure
46 Fleming Kanawha Closed - LCAP Post Closure
47 Huntington Cabell Closed – Non LCAP Non - LCAP
48 Kanawha Western Kanawha Closed - LCAP Post Closure
49 Pine Creek - Omar Logan Closed - LCAP Post-Closure
50 Prichard Wayne Closed – Non LCAP Non - LCAP
51 South Charleston Kanawha Closed - LCAP Closure
Definition of Terms
Post-Closure: Indicates that closure activities are complete and the facility is in the 30 year post-closure monitoring period.
Closure: Indicates that investigation, design and/or construction of closure activities are ongoing.

4.6.1 LCA
Map 4-2 Non-Ope
Berkeley was comConsultanDecembepost-closumethane inspectionbeing comfacility is Opequon MartinsbuAuthority Big BearBig Bear and was is located
AP Facilities
rational Land
County Lanmpleted in thnts Inc. Theer of 2004, aure status.
gas inspens, & grounmpleted undelocated betwCreek, appro
urg. The Beris the permit
r Lake LandfLake. The faclosed in 199d 1 mile we
s Status
dfills
ndfill (31): he fall of 1e cap was cnd the site isLandfill site
ections, sundwater inspr the LCAP p
ween Grapevioximately 1.5 keley Countyholder for this
fill (21): Theacility is in Pr98. Big Bear st of Bruceto
Design work998 by GAcompleted ins currently in
inspections,rface waterpections are
program. Thene Road andmiles east of
y Solid Wastes facility.
e permittee iseston CountyLake Landfilon Mills and
k I n n , r e e d f
e
s y l
d
accecounMillsBearLand Bucwas is prbeingdrainWasinspewateare The hold Capcurrecurrebeing
Chapte
essible via annty road 28 frs along Laker was removdfill in Harriso
khannon Lacompleted o
resently in pog collected tn and pipedstewater Treections, mether inspectionsbeing complefacility is in
er is th
on Springsently in post-cently in placeg performe
er 4: Solid W
n unimprovedrom the southview Drive. Ived and hauon County.
andfill (22): n January 3,
ost-closure phthrough a ped to the Citeatment Planhane gas inss, and groundeted under thn Upshur C
he City o
s Landfill (closure statuse. Landfill sit
ed by LCA
Waste Facility S
d local road h, or from BruIn early 2012uled to Mead
The closure2002. The f
hase with leaerforated periy of Buckhant. Landfillspections, sudwater inspehe LCAP pro
County, the pof Buckha
(32): Capos. The final cte inspectionsAP. Landfill
4-15
Status
off of uceton 2, Big dowfill
e cap facility achate meter annon l site urface ctions gram. permit annon.
on in cap is s, are
site

4-16 Chapter 4: Solid Waste Facility Status
inspections, methane gas inspections, surface water inspections and groundwater inspections are being completed under the LCAP program. The permit holder is Capon Springs & Farm, Inc. The facility is in Hampshire County, 1 mile north of Capon Springs. Central WV Refuse Landfill (23): The design was completed by GAI Consultants, Inc. Construction began in the summer of 1999 and was completed in February of 2001. Leachate is being hauled out by truck. The facility is currently in post-closure phase with groundwater monitoring being performed under the LCAP program. The permit holder is Central WV Refuse, Inc. The facility is in Braxton County off WV Route 4 on Big Run; 4.5 miles west of Gassaway. Clarksburg Landfill (24): Clarksburg landfill is currently in closure status. It is expected to be capped sometime in 2012. Design and construction of interim cap is complete. Leachate is being controlled by city sewer. City of Clarksburg is also monitoring water quality. The permit holder is the City of Clarksburg; the facility is in Harrison County, 1 mile north of WV Avenue, exit off U.S. 50, North 12th Street. Don’s Disposal Landfill (44): Project design was completed by Triad Engineering. Construction on the cap began in the fall of 2005. Landfill site inspections, methane gas inspections, surface water inspections, and groundwater inspections are being completed under the LCAP program. Don’s Disposal is currently in post closure status. The facility is in Kanawha County and located near the headwaters of Craig's Branch, off State Route 24 (Rich Fork Rd.) approximately 1 mile north-northwest of the Eden Fork exit on I-77. The permit holder is Don’s Resources, Inc. E.R.O. Landfill (45): Consultant design (wetland leachate treatment) has been completed. Cap construction and wetland collection was completed as of December 1997.
E.R.O is in post-closure status. Inspections and leachate and groundwater monitoring are ongoing. The facility is in Mason County approximately 1.5 miles east of SR 62 at the town of Lakin. The permit holder is E.R.O. Landfill. Fayette County Landfill (38): Closure activities are complete and this site is currently in post-closure phase. Cap construction was completed in September 1999. Leachate is being trucked from the site as part of the LCAP program. The permit holder is the Fayette County Solid Waste Authority. The facility is located near Cunard, 2.5 miles off county road 9. Fleming Landfill (46): The LCAP project design was completed by Potesta & Associates. Construction started in 2000 and was completed in July 2002. This site is currently in post-closure phase. Groundwater quality tests are being completed by LCAP. Leachate is being managed by a sanitary sewer plant. The facility is in Kanawha County off County Rt. 21/9, the permittee is Fleming Landfill, Inc. Hampshire County Landfill (33): The design and the cap construction were completed in spring 2005. This site is currently in the post-closure phase. Leachate is being managed by sanitary sewer. Landfill site inspections, methane gas inspections, surface water inspections, and groundwater inspections are being completed under LCAP. The facility is located 2 miles north of WV Rt. 28. The permit holder is the Region VIII Solid Waste Authority. Jackson County Landfill (30): Intermediate work, including stormwater diversion, has been completed. This site is currently in post-closure phase. The design was completed by Potesta. Groundwater monitoring is being completed under LCAP. The permit holder is the Jackson County Solid Waste Authority. Jefferson County Landfill (34): The cap was completed in May 1997 and this site is currently

4-17 Chapter 4: Solid Waste Facility Status
in post-closure phase. Leachate is being trucked from the site and groundwater monitoring is being performed under LCAP. The permittee is the Jefferson County Solid Waste Authority and is located on Jefferson Orchard Road, Kearneysville, WV. Kanawha Western Landfill (48): The design and cap construction were completed in April 1999. Leachate is being routed into the sewer system. LCAP is monitoring the water quality. This site is currently in post-closure phase. The permit is held by the Kanawha County Solid Waste Authority and located north of Cross Lanes. Kingwood Landfill (25): Interim closure cap is in place and the site is currently in closure status. It is expected to be capped sometime in 2012. Landfill site inspections, surface water inspections, and groundwater inspections are being completed under LCAP. The facility is connected to sanitary sewer. The facility is in Preston County, 1.5 miles north of Kingwood. The permit holder is the City of Kingwood. Marion County Landfill (26): This site is currently in the closure status phase with the interim cap in place. It is expected to receive its final cap sometime in 2018. Landfill site inspections, methane gas inspections, surface water inspections, and groundwater inspections are being completed under LCAP. The permittee is the Marion County Solid Waste Authority. The facility is located approximately 1 mile east of County Rt. 15, south of Farmington in the Lincoln District of Marion County. McDowell County Landfill (40): The design and construction were completed in August 2003. This site is currently in post-closure phase. Landfill site inspections, methane gas inspections, surface water inspections, and groundwater inspections are being completed under LCAP. The permit holder is the McDowell County Solid Waste Authority. The facility is located on County Rt. 7 at Marytown, WV.
Midwest Disposal Landfill (39): The facility ceased operations in 2001 and a final cap was later put in place. In late 2005, the West Virginia Public Service Commission released funds from Midwest Disposal to the LCAP program to facilitate the closure and post-closure care of the facility. The facility entered the LCAP program in 2009 by an act of the WV Legislature - HB 3339 and is now in post-closure monitoring and maintenance phase. Midwest is located on Irish Mountain Road in Summers County. Mingo County Landfill (41): Intermediate work, including stormwater diversion, has been completed. The cap was completed in November 2002. This site is currently in post-closure monitoring and maintenance phase. Leachate is being trucked from the site. Landfill site inspections, methane gas inspections, surface water inspections, and groundwater inspections are being completed under the LCAP program. The facility is located 2 miles northeast of the town of Williamson. The Mingo County Solid Waste Authority is the permittee. Monongalia County Landfill (27): The design was completed by IT Corp. The construction by Kimberly Industries began in the fall of 1999. The cap was completed in January 2001. The LCAP is paying for the hauling of leachate. This site is in post-closure monitoring and maintenance phase. The facility is located approximately 0.3 miles southeast of Route 19, 7.5 miles west of the junction of Route 19 and US 119 near Little Indian Creek. The permit holder is the WV Solid Waste Management Board. Montgomery Landfill (42): The construction of the cap was completed in January 1998. This site is currently in post-closure monitoring and maintenance phase. The City of Montgomery is performing water quality monitoring. Leachate is being controlled by sewer and being paid for by the city. The City of Montgomery is the permit holder.

4-18 Chapter 4: Solid Waste Facility Status
Morgan County Landfill (35): The Morgan County facility is in the post-closure phase. Landfill site inspections, methane gas inspections, surface water inspections, and groundwater inspections are being completed under LCAP. The permit holder is the Morgan County Solid Waste Authority. The facility is located at Wiggins Run on County Rt. 9/14, 1/2 mile south of the junction of County Rt. 9/14 and County Rt. 18. Morgantown Landfill (28): The closure cap design and construction has been completed. This site is currently in post-closure phase. Recently, upper and lower liners were seamed to prevent the infiltration of water. Leachate is collected via sewer with the cost being covered by the City of Morgantown. Groundwater monitoring is being performed by LCAP. The permittee is the City of Morgantown; the facility is in Monongalia County. The facility is adjacent to the municipal airport in Morgantown. Moundsville Landfill (19): Intermediate work has been completed, including the diversion of stormwater. Landfill site inspections, methane gas inspections, surface water inspections, and groundwater inspection are being completed under the LCAP program. The facility went into post-closure phase in the spring of 2012. The permit holder is the City of Moundsville. The location of the Moundsville Landfill is 4.2 miles from the intersection of Rt. 54 and State Secondary Rt. 17 at Moundsville. Petersburg Landfill (36): The cap was completed in February 2003. This site is currently in post-closure phase. A sewer line was installed to pump leachate to the local sewer plant. The design was completed in 1999 by Triad Engineering. Landfill site inspections, methane gas inspections, surface water inspections, and groundwater inspections are being completed under LCAP. The permittee is the Region VIII Solid Waste Authority and the facility is in Grant County. Petersburg Landfill is 0.5 miles south of Petersburg on U.S. Rt. 220.
Pine Creek/Omar Landfill (49): This site is currently in post-closure. The design work was completed by Marshall Miller & Associates in 1999. Landfill site inspections, methane gas inspections, surface water inspections, and groundwater inspections are being completed under LCAP. The permit holder is Pine Creek Omar, Inc. and the facility is in Logan County. The facility is 1 mile off Rt. 44, west of Omar. Preston County (Rehe) Landfill (29): The cap and construction were completed in August 2003. This site is currently in post-closure phase. The design work was completed by IT Corp. Landfill site inspections, methane gas inspections, surface water inspections, and groundwater inspections are being completed under LCAP. The permit holder is Hadre Enterprises, Inc. The facility is in Preston County approximately 1.5 miles southeast of Reedsville. South Charleston Landfill (51): The facility is currently in closure status. It is expected to be capped sometime in 2014. Landfill site inspections, methane gas inspections, surface water inspections, and groundwater inspections are being completed under the LCAP program. The permit holder is the City of South Charleston; the facility is located in Kanawha County. Wheeling – North Park (20): Wheeling Landfill is currently in closure status. It was to be capped sometime in 2012. Landfill site inspections, methane gas inspections, surface water inspections, and groundwater inspections are being completed under LCAP. The facility is in Ohio County, the permit holder is the City of Wheeling. The facility is 1.5 miles north of Wheeling on Mount Wood Road. Wyoming County Landfill (43): This site is currently in post-closure phase. Leachate is currently being piped to the wastewater treatment plant. Groundwater and surface water monitoring is being completed under LCAP. The permit holder is the Wyoming County

4-19 Chapter 4: Solid Waste Facility Status
Commission. The Wyoming County Landfill is located on Rt. 9/6 approximately 4 miles from Pineville, WV. Other Non-Operational Facilities: Several other facilities are closed and have not been accepted into the LCAP program. Following is a listing of these facilities, the status of each, and a summary of the problems that lead to the closing:
The City of Huntington’s Landfill (47) was ordered closed in 1994 by the DEP because it was unable to comply with state and federal regulations requiring multiple liners and a comprehensive leachate management system.
The Prichard Landfill (50) in Wayne County closed in 1996 due to its inability to compete with Kentucky facilities offering lower tipping fees.
The Webster County Landfill’s (37) permit was revoked by the DEP in 2004. PSC denied the facility a CON the following year. The facilities problems were related to decreasing tonnage and income. The Webster County Landfill ceased operation in 2002.
The Elkins/Randolph Landfill (24-b) closed in the fall of 2011, unable to generate enough income to cover cost due to the low tonnages. Closing cost for the facility was estimated by Environmental Solutions, Inc. during July 2012 at $6,080,310.
4.6.2 LCAP Summary Closure means that a facility is in the design and/or construction stage of the final capping process, and Post-Closure means that closure activities are complete and the facility is in the
30 year monitoring period. Of the original 28 facilities in the LCAP program and the 2 other facilities that were later added, 25 are in post-closure phase and another 5 are in closure. The five facilities in the closure phase are Clarksburg, Kingwood, Marion County, South Charleston, and Wheeling/North Park. All others are in Post-Closure. Four of the facilities in closure are expected to be capped, construction complete, and in the post-closure monitoring and maintenance phase by 2014. Marion County will not be in post-closure until 2018. 4.7 Transfer Stations West Virginia currently has 18 municipal solid waste transfer stations. Most of these facilities are either in the eastern panhandle or the southwestern part of the state, commonly known as the coalfield counties. Transfer stations allow garbage from packer and smaller trucks to be transferred to larger trucks in areas where a long haul to the nearest landfill is necessary. On average, one large vehicle can haul 4 times the load of one standard size garbage truck saving time, wear and tear on the trucks and fuel. Transfer stations are an essential part of the waste management system. For 2011, West Virginia’s 18 transfer stations collected and transferred 221,094 tons of waste, approximately 10% of the total volume going into the state’s landfills. They process and transfer residential waste, non-hazardous commercial waste, bulky goods, construction and demolition waste and a few tires. The following transfer stations are operational in West Virginia.

4-20
Chapter 4: Solid Waste Facility Status
Table 4-8
Operational Transfer Stations
Tipping Fees
WS No. County Facility Name Current
Base Rate
State and Local
Assessment Fee
Totals
B 52 Barbour Philippi, City of 59.43 8.75 68.18
53 Monongalia Mountaineer 41.25 8.75 50.00
54 Preston *Kingwood, City of 63.35 63.35
55 Randolph Tygarts Valley Sanitation 58.25 8.75 67.00
56 Upshur Buckhannon, City of 53.25 8.75 62.00
E 57 Grant Region VIII SWA – Petersburg 73.10 8.75 81.85
58 Hampshire Region VIII SWA - Hampshire 74.10 8.75 82.85
59 Jefferson Jefferson County SWA 70.25 8.75 79.00
G 60 Wyoming Wyoming Country - Pineville 59.17 8.75 67.92
61 Wyoming Wyoming County – Baileysville (Bags Only) 1.10
62 Wyoming Wyoming County – Glen Fork/Jesse (Bags Only) 1.10
63 Wyoming Wyoming County – Tralee (Bags Only) 1.10
H 64 Boone Boone County Commission - #1 38.75 38.75
65 Boone Boone County Commission - #2 ---- ----
66 Kanawha *Chesapeake, Town of NO RATE
67 Kanawha *Marmet, Town of NO RATE
68 Kanawha *St. Albans, City of NO RATE
69 Logan Waste Management – Peck’s Mill 69.70 9.25 78.95
*Municipal use only transfer stations. No fee to residents.

Map 4-3 Operation
BaileysviStation isCommisswaste in 2Waste coRaleigh Cusers $1Wyoming Boone CBoone processestransferrintransferreTipping fecustomerscharged. Danville a
nal Transfer
ille (61): Ts owned byion. The fac2011, an averollected is traCounty Land.10 per bagCounty.
County No. County Cos an averageng 6,221 toed to the Citees are $38.7s. Citizens o
Primary uand Madison.
Stations
The Baileysvy the Wyom
cility managedrage of 54 tonansferred by fill. The fac
g and serve
1 (64): Owommission, e of 518 tonons in 2011ty of Charles75 per ton foof Boone Cousers are th
ville Transferming Countyd 645 tons ofns per month
truck to thecility chargess entities in
wned by thethe facility
ns per month1. Waste isston Landfill
or commerciaounty are nothe towns of
r y f .
e s n
e y h s . l t f
BooBoonprocand transTipp$38.Citizfaciliarea BucBuck1,38for th Chesthe fand durin
Chapte
one County Nne County
cesses on avprocessed 2
sferred to thping fees at th
75 per tonzens of Booneity serves t
as.
khannon (5khannon, the
81 tons per mhe year.
sapeake (66)facility is ownprocessed an
ng 2011 and 6
er 4: Solid W
No. 2 (65): ACommissio
verage of 242,914 tons inhe City of Che facility, as n for comme County are he Whitesvi
56): Ownedey processed
month in 2011
): Located inned by the Cn average of 674 tons for t
Waste Facility S
Also owned bon, this f3 tons per m
n 2011. WaCharleston La
of May 2011,mercial custo
not charged.lle and Sylv
d by the Cd an averag1 and 16,537
n Kanawha CoCity of Chesap
56 tons per mthe year.
4-21
Status
by the facility month ste is
andfill. , were
omers. . The vester
ity of ge of 7 tons
ounty, peake month

4-22
Chapter 4: Solid Waste Facility Status
Glen Fork/Jesse (62): Owned by the Wyoming
County Commission, the station processed an
average of 51 tons per month and 614 tons for
the year 2011. They charge a user fee of $1.10
per bag. All waste goes to the Raleigh County
Landfill. Glen Fork/Jesse serves the citizens and
businesses of Wyoming County.
Hampshire County (58): Owned and operated
by the Region VIII Solid Waste Authority, the
station managed 9,164 tons of waste in 2011
averaging 764 tons per month. All waste was
transferred to Tucker County Landfill. The
tipping fee at this facility is $82.85 per ton.
(Note: information reflects 2011 information.)
Jefferson County (59): Owned by the
Jefferson County Solid Waste Authority and
operated by Waste Management of West
Virginia, Inc., the facility processed 36,107 tons
in 2011, an average of 3,009 tons per month.
The facility charges a tipping of $79 per ton.
Kingwood (54): Owned by the City of
Kingwood in Preston County, the transfer station
processes an average of 495 tons per month.
Total waste processed for 2011 was 5,937 tons.
Kingwood’s PSC approved tipping fee, as of
May 2011, was $63.35 per ton. The facility
primarily serves the areas around Albright,
Kingwood, Masontown and Reedsville.
Marmet (67): Owned by the City of Marmet, the
facility is located in Kanawha County and
processed 921 tons of solid waste in 2011
averaging 77 tons per month. The facility serves
the City of Marmet.
Mountaineer Transfer Station (53): Formerly
Suburban Sanitation, the facility was sold in late
2011. Ownership was assumed by Republic
Services in November 2011. The facility
processed 49,682 tons of waste in 2011
averaging 4,140 tons per month. The facilities
tipping fee is $50 per ton. Mountaineer serves
Harrison, Marion, Monongalia and Preston
counties in West Virginia and Fayette, Green,
Somerset, Taylor, and Washington counties in
Pennsylvania.
Petersburg (57): Owned by the Region VIII
Solid Waste Authority, the Petersburg facility
processed 10,773 tons of solid waste in 2011
averaging 898 tons per month. The tipping fee
is $81.85 per ton. The facility serves the
communities of Franklin, Moorefield and
Petersburg. (Note: information reflects 2011
information.)
Philippi (52): Owned by the City of Philippi, the
facility processed 3,722 tons in 2011 averaging
310 tons per month. Philippi’s tipping fee is
$68.18 per ton. The facility is located in and
serves Barbour County.
Pineville (60): Pineville transfer station is
owned by the Wyoming County Commission.
The transfer station transported 3,154 tons of
waste in 2011 or an average of 263 tons per
month. All waste collected by this facility is
taken to the Raleigh County Landfill. Pineville’s
tipping fee is $67.92.
St. Albans (68): Owned by the City of St.
Albans, this transfer station processed and
transported 8,466 tons of waste in 2011. This is
an average of 706 tons per month. The facility
provides services for parts of Kanawha and
Putnam counties.
Tralee (63): Owned by the Wyoming County
Commission, the facility processed and
transported 413 tons of waste in 2011 or an
average of 34 tons per month. All waste
collected goes to the Raleigh County Landfill.
Tralee’s tipping fee is $1.10 per bag.
Tygart Valley (55): The Tygart Valley Transfer
Station is owned by Fred and Tim Hornick, and
processed 14,606 tons of waste in 2011 or
about 1,217 tons per month. The tipping fee is
$67 per ton. Tygart Valley serves Randolph
County.

4-23 Chapter 4: Solid Waste Facility Status
Waste Management of West Virginia (69): The facility is located at Pecks Mill in Logan County and processed 50,508 tons of waste in 2011 or an average of 4,209 tons per month. The transfer station is owned by Waste Management of West Virginia. The facilities tipping fee is $78.95 per ton. The facility serves Boone, Lincoln, Logan, Mingo, Wayne and Wyoming counties, all in West Virginia. 4.8 Material Recovery Facility Material Recovery Facilities (MRFs) are facilities at which wastes are separated, either mechanically or physically, and material is recovered for the purpose of recycling and reuse. According to the US EPA, 633 MRFs were operating in the United States, with an estimated total daily throughput of over 98,449 tons per day. The most extensive recyclables processing throughput occurs in the Northeast and Midwest. MRFs can be classified as clean or dirty. Those that are classified as clean, accept only source-separated material. These source separated materials may be commingled, but are separated from the remainder of the waste stream. Dirty MRFs, or mixed waste processing facilities, accept commingled waste that is not separated from the waste stream. There are no permitted MRFs in West Virginia. Several commercial recycling facilities exist and to some extent, sort materials. However, none of these are classified, or permitted, as MRFs. W.Va. Code § 22-15A-18(h) allows municipalities in the state with populations greater than 30,000 to use a MRF in lieu of curbside recycling. The four municipalities affected by this section of the Code are Charleston, Huntington, Parkersburg and Wheeling. The use of a MRF, in lieu of curbside
recycling, for these four municipalities must be approved by both the SWMB and the PSC. 4.9 Composting Facilities Yard waste, which traditionally includes grass clippings, leaves and brush, can be composted by the homeowner in backyards or by municipalities in a centralized composting operation. A waste quantification and characterization study conducted by the Solid Waste Management Board in 1997 indicated that yard waste makes up about 6.7% of the waste stream in West Virginia. The US EPA indicates that yard waste makes up approximately 13.4% of all waste in the US. W.Va. Code §22-15A-22(d) mandates that DEP promulgate rules for the handling of yard waste. Yard waste composting rules were enacted by legislative adoption on March 16, 1994, as Title 33 CSR 3 (formerly Title 47 CSR 38E) of the Municipal Solid Waste Management Rules. These rules (Title 33 CSR 3, formerly Title 47 CSR 38E) were revised/updated and became effective May 5, 1997. Under these rules, the permitting of commercial yard waste composting operations must be approved by the Director of DEP-DWWM. Residential backyard composting activities and non-residential composting activities would be exempted from the requirement to obtain a permit. Non-residential composting activities must obtain a registration number from the DEP. A non-residential composting activity includes a yard waste composting operation conducted by landscape contractors, nurseries or greenhouses to produce a soil amendment or soil conditioner. Table 4-9 identifies the commercial composting facilities that have been issued permits or registration numbers.

4-24 Chapter 4: Solid Waste Facility Status
Table 4-9 Registered Commercial and Activity Composting Facilities
Commercial Facility City County
City of Clarksburg Clarksburg Harrison Jefferson Solid Waste Authority Charles Town Jefferson
Mercer Solid Waste Authority Princeton Mercer
Raleigh Solid Waste Authority Lanark Raleigh
Activity Facility City County
City of New Martinsville New Martinsville Wetzel Short Creek Wheeling Ohio
City of Buckhannon Buckhannon Barbour
City of Philippi Philippi Barbour
City of Westover Westover Monongalia
Joseph Nurseries Bridgeport Taylor
Meadowfilll Landfill Bridgeport Harrison
North Hills Nursery Rock Cave Upshur
Taylor County Workshop Grafton Taylor
Davis Nurseries St. Mary’s Pleasants
Northwestern Landfill Parkersburg Wood
Pleasants Solid Waste Authority St. Mary’s Pleasants
Wood County Commission Parkersburg Wood
City of Martinsburg Martinsburg Berkeley
Greenbrier Solid Waste Authority Lewisburg Greenbrier
City of Charleston Charleston Kanawha
City of Huntington Huntington Cabell
City of St. Albans St. Albans Kanawha
City of South Charleston South Charleston Kanawha
4.10 Free Day
W.Va. Code § 22-15-7 provides free solid waste disposal for all persons “not in the business of hauling or disposing of solid waste” on one day per month. People are allowed to dispose of “up to one pick-up truckload or its equivalent” in all solid waste facilities within their wasteshed one day per month. All commercial and public solid waste facilities are required to have such a “Free Day”.
In addition, all facilities must publish a yearly schedule of their monthly “Free Days”. Non-residents must prove their home state allows “free days” in their state’s in order to participate in WV. Transfer stations were exempted from the free day.

4-25
Chapter 4: Solid Waste Facility Status
Table 4-10
Free Day Tonnage Received at West Virginia Landfills
Landfills Total Free Day Tons Total Tons
Free Day % of Total Tons
Brooke/Valero 168 37,220 0.45%
Charleston 78 219,036 0.04%
Copper Ridge 504 8,674 5.81%
Disposal Services 22 100,346 0.02%
Greenbrier 145 47,587 0.30%
Ham 46 26,197 0.18%
LSC 608 115,882 0.52%
Meadowfill 460 249,576 0.18%
Mercer 578 39,040 1.48%
Nicholas 131 25,569 0.51%
Northwestern 408 219,470 0.19%
Pocahontas 0 7,713 0.00%
Raleigh 732 121,360 0.62%
Short Creek 167 349,495 0.05%
S & S 317 88,540 0.36%
Sycamore 29 82,054 0.04%
Tucker 256 76,221 0.34%
Wetzel 177 82,060 0.22%
4.11 Waste Tire Monofills
According to the Department of Environmental
Protection’s Title 33 Series 5, Waste Tire
Management Rule, a Waste Tire Monofill is “an
approved solid waste facility where waste tires
not mixed with any other waste are placed for
the purpose of long term storage for eventual
retrieval for marketing purposes.” Three tire
monofills have been permitted and built in West
Virginia.
Preston Tire & Recycling, Inc.: Preston Tire
monofill is located near Kingwood in Preston
County. The facility is the smallest of the three,
taking in an average of about 80 tons of tires a
month for long term storage. The facility
processed 961 tons in calendar year 2011.
West Virginia Tire Disposal, Inc.: West
Virginia Tire Disposal, Inc. is the largest of the
three facilities averaging over 2,500 tons of used
tires per month. Located near Summersville in
Nicholas County, the facility processed over
30,000 tons of used tires in 2011. West Virginia
Tire offers a statewide tire pickup service.
Tire & Rubber, Inc.: Tire & Rubber, located
near Weston in Lewis County, is also permitted
to accept Construction and Demolition waste.
The facility managed over 660 tons a month in
calendar year 2011 with overall tonnage for the
year of 7,940. Tire & Rubber picks up tires in the
surrounding counties.

4-26 Chapter 4: Solid Waste Facility Status
Table 4-11 Operational Tire Monofills in West Virginia
WS Facility Name Tipping Fee Out-Of-State
Waste Average Tonnage
B Preston Tire & Recycling, Inc. Variable 0 80
Tire & Rubber Variable 0 662
F WV Tire Disposal, Inc. Variable 0 2,518
4.12 Discussion and Conclusions
As of September 1, 2012, West Virginia had 18 operational MSW landfills and 18 transfer stations. Of the 18 landfills, eight are publicly owned, and ten are privately owned. The state’s landfills are permitted to receive up to 3,812,256 tons of waste a year. Actual waste tonnage for FY 2011 was 2,012,391 or 53% of total capacity. The state is generally well served by available landfill capacity. However, there are some problems in areas of rapid growth and those lacking adequate highways and service providers. These problems often result in increased tipping fees and hauling charges.
In order to have the most efficient waste management system possible it is necessary to both import and export a certain amount of waste. The state is currently exporting more waste than is imported, largely due to lower tipping fees at out-of-state facilities and population pressures in the eastern panhandle. Over time, tipping fee increases in the surrounding states and the cost of fuel may alter this situation.

Chapter 5
West Virginia’s County and Regional Solid Waste Authorities

5-1 Chapter 5: West Virginia’s County and Regional Solid Waste Authorities
Chapter 5: West Virginia’s County and Regional Solid Waste Authorities
Solid waste management is a local responsibility. The state has 55 counties and 50 Solid Waste Authorities (SWA). Forty-eight of the counties have their own SWA, the other seven counties share one of two regional SWAs. The state’s 50 local solid waste authorities own and operate 8 of the state’s 18 operating landfills; 5 of 18 transfer stations, and they own, operate, or actively participate in at least 41 of West Virginia’s recycling programs providing services in rural areas where low population makes such operations prohibitive for private sector businesses. The SWAs are also involved in open dump cleanup, stream cleanup, litter control and other environmental projects. The Solid Waste Management Board (SWMB) assists statewide efforts in solid waste management by funding SWA projects, assisting in the development and updating of SWA Comprehensive Litter and Waste Control Plan, and Commercial Solid Waste Facility Siting Plans. The Department of Environmental Protection (DEP) Rehabilitation Environmental Action Plan (REAP) administers funds to the SWA’s and others for open dump cleanup, waste tire remediation, recycling, litter control and electronics recycling. 5.1 County and Regional Solid Waste Authority Responsibilities W. Va. Code § 22C-3 and 22C-4, the Legislature established a comprehensive program of solid waste collection, processing, recycling, and disposal. The Legislature intended to accomplish this goal by establishing county and regional solid waste authorities (SWAs) throughout the state. The authorities work with state and local government in cooperation with the private sector. On January 1, 1989, W. Va. Code § 22C-4-3 created county SWAs and established them as public agencies in every county. Counties could elect to form regional SWAs. And, any county
commission which, on July 1, 1988, held a valid permit for a commercial solid waste transfer station could elect to assume all duties and authorities vested in a county SWA. Boone County did so, and is still the only county commission acting as a solid waste authority. SWAs are required to develop and implement Comprehensive Litter and Solid Waste Control Plans to help reduce the solid waste management problems in the state. W. Va. Code § 22C-4-1 establishes an integrated waste management hierarchy on which to base these comprehensive plans. In order of preference, the hierarchy is as follows: 1) Source reduction. 2) Recycling, reuse, and materials recovery. 3) Landfilling. W. Va. Code § 22C-4-1 declared that a “proliferation” of solid waste facility proposals could have a “deleterious and debilitating impact upon the transportation network, property values, economic growth, environmental quality, other land uses and the public health and welfare in affected communities” and that the siting of such facilities was, “not being adequately addressed to protect the interests of counties and local communities.” Therefore, each SWA was also required to submit a Commercial Solid Waste Facility Siting Plan to identify zones where the siting of certain solid waste facilities is authorized, prohibited, or tentatively prohibited. Citizens and local governments often look to state environmental regulatory agencies to resolve local land use conflicts. Often, however, these conflicts are more effectively resolved in a local governmental forum where citizens can participate in the process. County and/or regional SWAs were established to be such a forum.

5-2 Chapter 5: West Virginia’s County and Regional Solid Waste Authorities
SWA management is vested in their Board of Directors. Board members receive no compensation for their service, but are reimbursed for their actual expenses incurred in the discharge of their duties. They are appointed for terms of four years. Each county SWA Board of Directors is comprised of five members who are appointed as follows: one by the Secretary of the DEP, two by the county commission, one by the Board of Supervisors for the Conservation District in which the county is situated, and one by the Chairman of the PSC. Any two or more counties can establish a regional SWA. The Board of the regional SWA are appointed as follows: one by the Secretary of the DEP, two by the county commission of each participating county, one appointed by the Board of Supervisors for each Conservation District in which a county of the region is situated, one by the Chairman of the PSC, and two municipal representatives from each county having one or more participating municipality from each county. SWAs may exercise all powers necessary or appropriate to carry out the purposes and duties to achieve their responsibilities as defined in W. Va. Code § 22C-4-8. The SWMB provides assistance to the county or regional SWAs, municipalities, and other interested parties in identifying and securing markets for recyclables. Each SWA has completed an initial Comprehensive Litter and Solid Waste Control Plan, and a Commercial Solid Waste Facility Siting Plan, and submitted these plans to the SWMB, as required by W. Va. Code § 22C-4-8.
5.2 Review of SWA Comprehensive and Siting Plans In accordance with Legislative Rules 54CSR3 and 54CSR4, each county and regional solid waste authority is responsible for completing a Comprehensive Litter and Solid Waste Control
Plan and a Commercial Solid Waste Facility Siting Plan. The comprehensive plan must address 14 points.
1. An assessment of litter and solid waste
problems in the county. 2. The establishment of solid waste
collection and disposal services for all county residents at their residences.
3. An evaluation of the feasibility of
requiring or encouraging the separation of solid waste to facilitate recycling and waste reduction measures.
4. The establishment of an appropriate mandatory garbage disposal program.
5. A recommendation for the siting of one
or more properly permitted public or private solid waste facilities to serve the solid waste needs of the county or the region.
6. A timetable for the implementation of the
comprehensive plan. 7. A program for the cleanup, reclamation,
and stabilization of any open and unpermitted dumps.
8. Coordination of the plan with the related
solid waste collection, and disposal service of municipalities, and if applicable, other counties.
9. A program to enlist the assistance of
private industry and civic groups in volunteer cleanup efforts.
10. Innovative incentives to promote
recycling. 11. A program to identify the disposal of out-
of-county or out-of-region solid waste. 12. Coordination with the Division of
Highways and other local, state, and

5-3 Chapter 5: West Virginia’s County and Regional Solid Waste Authorities
federal agencies in the control and removal of litter, and the cleanup of open and unpermitted dumps.
13. Establishment of a program to
encourage and utilize those individuals incarcerated in the county jail, and those adults and juveniles sentenced to probation for the purposes of litter pickup.
14. A provision for the safe and sanitary
disposal of commercial and industrial solid waste produced within the county or region, excluding refuse from sources owned or operated by the state or federal governments.
The Commercial Solid Waste Facility Siting Plan must identify zones within each county where the siting of solid waste facilities is authorized, prohibited or tentatively prohibited. According to W. Va. Code §22C-4-24, the types of solid waste facilities to be included in the siting plan are:
1. Commercial solid waste facilities which may accept an aggregate of more than 10,000 tons of solid waste per month.
2. Commercial solid waste facilities which
shall accept only less than an aggregate of 10,000 tons of solid waste per month.
3. Commercial solid waste transfer stations
or commercial facilities for the processing or recycling of solid waste.
The county or regional SWA shall develop the siting plan based upon the consideration of the following criteria:
1. The efficient disposal of solid waste including all solid waste generated within the county or region.
2. Economic development. 3. Transportation facilities.
4. Property values. 5. Groundwater and surface waters. 6. Geological and hydrological conditions. 7. Aesthetic and environmental quality. 8. The present or potential land uses for
residential, commercial, recreational, environmental conservation or industrial purposes.
9. Historic and cultural resources. 10. The public health, welfare, and
convenience. The siting plan is developed based upon readily available information. Unless, that information clearly establishes an area suitable for the location of a commercial solid waste facility, or not suitable for such a facility, the area is designated as tentatively prohibited. 5.3 Summary of County and Regional Plans The following summaries of county and regional solid waste plans are based on the most recent plan submitted to the SWMB. Plans are updated every five years. Some information in the summary may not reflect recent changes in solid waste management within the county. Plan summaries are grouped according to waste shed. 5.3.1 Wasteshed A Brooke County is host to a Class A landfill, Brooke/Valero Landfill, which accepts the majority of the waste generated within the county. Two municipalities, Weirton and Follansbee, provide collection service for their residents with two private haulers, Allied Waste Services of West Virginia, and Solid Waste Services of West Virginia, Inc. providing service to the remainder of the county. They operate six recycling drop-off locations throughout the county, and a recycling facility located in Beech

5-4 Chapter 5: West Virginia’s County and Regional Solid Waste Authorities
Bottom. The SWA has had a mandatory disposal program in effect since 1999 and continues to work with the Department of Environmental Protection on minimizing open dumps throughout the county. Hancock County’s close proximity to Ohio and Pennsylvania provides both opportunity and issues. Currently, solid waste generated within the county is deposited in either the Brooke County Landfill, or one of the three commercial landfills outside the state. Collection for most of the county is provided by two commercial haulers. The City of Weirton provides residential collection service to its residents and operates the only curbside recycling program within the county. The SWA offers all county residents the opportunity to recycle with their drop-off program housed at Tomlinson Run State Park. Authority members are also actively conducting surveys within the county to identify and locate open dumps, and assisting in the enforcement of mandatory collection. Marshall County’s solid waste is currently deposited in a Class A facility in Ohio County, and a Class B facility in Wetzel County. The county SWA has developed a map of open dump sites and is using volunteers in a long-term plan to clean the sites. Also, it has begun to compare customer lists provided by commercial haulers with tax data to identify non-subscribers, with the intent of requiring them to document proper disposal of solid waste. The SWA currently has recycling trailers in place in McMechen, Benwood and Cameron. These communities have volunteer recycling programs in place. Glen Dale has a recycling program which has been in place since 1991. Ohio County has one permitted Class A landfill, Short Creek Landfill, which accepts all waste generated within the county. The City of Wheeling provides collection service within the city limits, and the rest of the county is serviced by two private waste haulers, Jack Jochum Truck Service, and American Disposal. The SWA has identified plastic, metals, and newspapers as the materials to be collected at
four drop-off locations throughout the county. The City of Wheeling collects magazines, metals, and newspapers curbside. The Authority provides educational information to residents and students and is currently working on starting a school recycling program. Tyler and Wetzel Counties have implemented a curbside recycling program which serves Middlebourne, Pine Grove, Reader, Friendly, New Martinsville, Paden City, Sistersville, Rolling Acres, Beechwood Estates, and two housing developments through the “Tyler/Wetzel Recycling Project”. Tyler County is committed to cleaning up open dumps throughout the county and continues to work with the DEP, DNR, and local law enforcement officials in enforcing the Mandatory Solid Waste Disposal Rules. 5.3.2 Wasteshed B Barbour County, a rural county generating less than 1,000 tons a month, has a very high percentage of residents using proper solid waste collection and disposal service. Philippi and Stewart Sanitation currently offer curbside recycling in the county. There are drop-off locations in Philippi, and at the Barbour County SWA Recycling Center. Barbour County utilizes the Randolph County Landfill and the Meadowfill Landfill in Harrison County for solid waste disposal. According to the DEP, from 1989 to 2008, there were 94 open dumps eliminated within the county. The SWA continues to educate the public on mandatory disposal laws and the penalties for not complying. Important to note that since the publication of the last plan, the Randolph County landfill has since ceased operations. Braxton County SWA has one drop-off program at Mountain Recycling, located in Gassaway. They also have a curbside program located in Sutton. The program serves approximately 300 households. The SWA offers cardboard pickup to county businesses once per week. The SWA has identified and is in the process of cleaning up six open dumps within the county.

5-5 Chapter 5: West Virginia’s County and Regional Solid Waste Authorities
Clay County was very careful in preparing its commercial solid waste facility siting plan, especially to protect areas along the scenic Elk River. Clay County has had difficulty in developing a recycling program for their county because of its rural character. The SWA is actively working with the DEP’s PPOD program to cleanup open dumps within the county. They have compiled and mapped open dumps found in the county and have prioritized them for cleanup. Doddridge County is serviced by two commercial haulers which use two existing solid waste facilities in Harrison County. With the cooperation of the DEP’s PPOD Program, there have been 79 open dumps cleaned up throughout the county reclaiming over 36 acres of land. Due to the rural nature and low population density, curbside recycling collection is not a viable option, however, residents of the county do have access to a recycling drop-off trailer in West Union which is operated by the SWA. Harrison County, the home of the Federal Bureau of Investigation (FBI) Fingerprinting Center, is also the home of two landfills which serve most of Wasteshed B. The two landfills have a permitted capacity of 29,999 tons per month. More than 60 illegal dumps have been cleaned up with the aid of DNR Conservation Officers, DEP Environmental Inspectors, the sheriff’s department, 4-H clubs and other volunteers over the last six years. Clarksburg operates a compost facility at the site of the closed municipal landfill. Lewis and Gilmer County haulers take approximately 1,045 tons of solid waste per month to two landfills in Harrison County. A private individual has opened a Class D landfill for construction/demolition debris, municipal solid waste, and tire collection. The Lewis/Gilmer Regional SWA is identifying households that do not subscribe to collection services, and are not landfill customers. This information is forwarded to county and state law enforcement agencies. Most of the open dumps
identified in the SWA’s original comprehensive plan have been cleaned up. Large and small dumps are still scattered throughout the region. The dumps continue to be monitored while resources are being acquired for their cleanup. Lewis/Gilmer participates in North Central WV Recycling Cooperative (NCWVRC) to comply with its recycling ordinance. Drop-off recycling programs are established in Jane Lew, Weston, and Glenville. Marion County’s landfill closed in December 1995. The SWA is involved in several recycling programs, and open dump cleanup efforts. They currently have recycling trailers placed at Idamay, Rivesville, and the Middletown Mall, in addition to, a cooperative agreement with the Monongalia County SWA for materials processing and marketing. Marion County SWA also sponsors an annual telephone book, and Christmas card recycling program. Monongalia County has a progressive campaign to implement mandatory disposal. The SWA has prohibited solid waste facilities from being constructed over mined areas. There are eight private haulers and three municipalities that provide collection service to the residents of the county. After a state operated landfill closed in 1993, solid waste has been hauled either to Harrison County landfills, Meadowfill or S&S, or to the Ardens-USA Waste and CBF landfills in Pennsylvania. With the cooperation of the DEP’s PPOD, there have been 550 dumps cleaned up since 1989. The authority has been operating the county’s recycling center since 2002 and maintains six drop-off sites throughout the county. Preston County has four municipalities that offer solid waste collection for its residents, two permitted commercial solid waste haulers, and one transfer station, which is operated by the City of Kingwood, but open to all residents within the county. Solid waste is deposited in either the Tucker County Landfill, or Meadowfill Landfill in Harrison County. Recycling opportunities are plentiful in Preston County. There are three known commercial recyclers, two curbside

5-6 Chapter 5: West Virginia’s County and Regional Solid Waste Authorities
collection programs, and various drop-off sites. Both commercial haulers provide drop-off locations, plus the Authority operates a mobile drop-off service in eight towns within the county. With the assistance of the DEP’s PPOD program, individuals from the Community Corrections Program, and various other volunteers, the SWA has cleaned up 114 open dumps since 2004. The PCSWA also supports and actively promotes the state’s Mandatory Garbage Disposal laws. Randolph County waste is disposed of at landfills in Harrison, Randolph, and Tucker counties. Residential and commercial collection is provided by the City of Elkins, and the Town of Mill Creek. Three private companies are certificated by the WV Public Service Commission to provide service throughout the remainder of the county with Tygarts Valley Sanitation being the largest. Important to note that since the publication of the last plan, the Randolph County landfill has since ceased operations.
The Tucker County Solid Waste Authority operates a Class B landfill within the county. Residents and commercial businesses are serviced by one private waste hauler, Sunrise Sanitation, and five municipalities: Parsons, Hendricks, Hambleton, Thomas, and Davis. Sunrise Sanitation operates three drop-off sites and collects steel cans, aluminum, cardboard, newspapers, batteries, and used motor oil. The Authority assists in recycling education by providing information on proper recycling techniques and locations of drop-offs. Taylor County adopted a countywide recycling ordinance in 1999 which established guidelines for recycling. There are two major recyclers located within Taylor County: RRHAMCO deals with non-residential recyclables and Refuse Control Systems who processes residential recyclables. It is determined that approximately 65% of county residents recycle with approximately 78% of the businesses participating. Disposal needs are being met by the two landfills located within Harrison County,
and residents are serviced by four solid waste haulers. Three private haulers: Allied Waste, Refuse Control Systems, and Waste Management, Inc. The City of Grafton provides residential services within city limits. Upshur County’s residents are serviced by two solid waste haulers, Weston Transfer, Inc. and the City of Buckhannon. Commercial and industrial accounts are provided service by Allied Waste Services. All waste is deposited into the S & S Landfill in Harrison County. The City of Buckhannon operates a transfer station and a recycling center which is operated in conjunction with the SWA. The North Central West Virginia Recycling Cooperative (NCWVRC) is contracted to market the processed materials for the program. Buckhannon also offers a drop-off program as well as one of the two curbside recycling collection programs. 5.3.3 Wasteshed C Jackson County Solid Waste Authority operates four drop-off trailers and a recycling center in Cottageville where they accept glass, plastic, newsprint, aluminum cans, and cardboard. The majority of the county’s solid waste is transported to Northwestern Landfill in Wood County, and the remainder deposited at the Athens Hocking Landfill in Ohio. Two municipalities, Ripley and Ravenswood, provide services for their residents with Waste Management, Inc. providing services for the remainder of the county. The Authority supports the state’s mandatory disposal laws and is also active in assisting the DEP-PPOD program with identifying and cleaning up open dumps throughout the county. Pleasants County waste is deposited at landfills located in Wood and Wetzel Counties by one of the three certificated private haulers. Waste Management of WV, Inc., Solid Waste Services of West Virginia, Inc., and N&N Disposal, Inc. provide weekly collection for all residents and commercial customers. The Authority operates a recycling facility in St. Marys, and is quite active
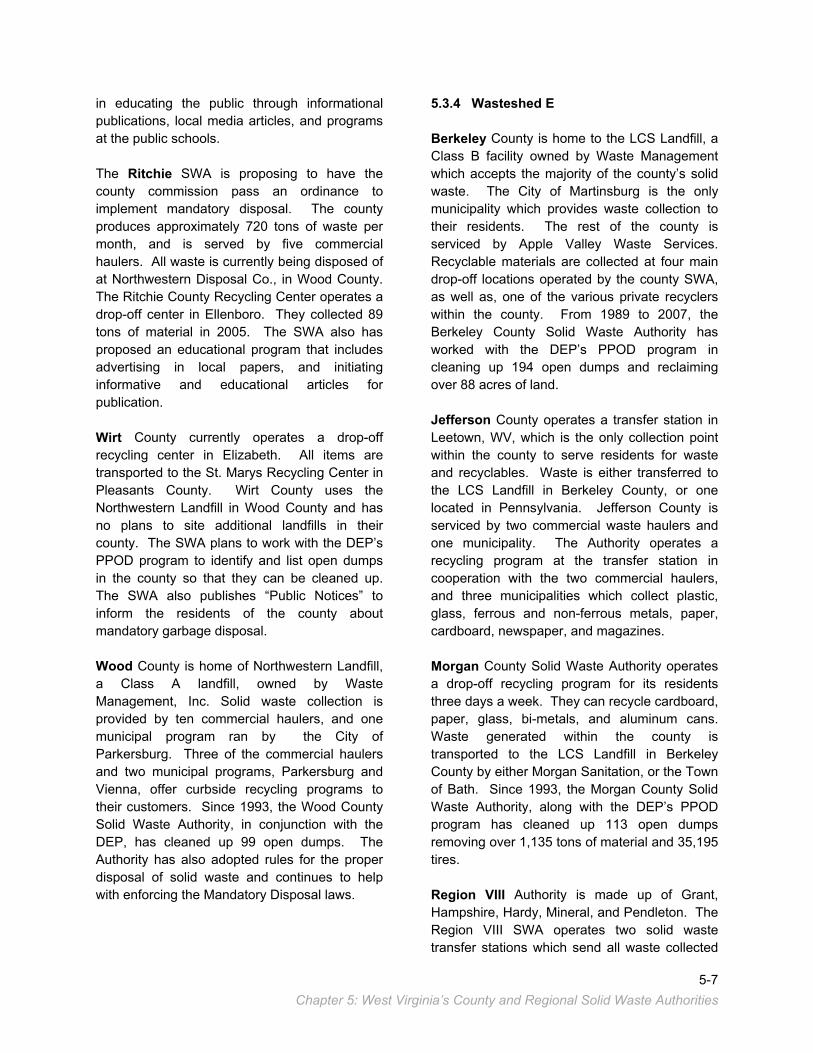
5-7 Chapter 5: West Virginia’s County and Regional Solid Waste Authorities
in educating the public through informational publications, local media articles, and programs at the public schools. The Ritchie SWA is proposing to have the county commission pass an ordinance to implement mandatory disposal. The county produces approximately 720 tons of waste per month, and is served by five commercial haulers. All waste is currently being disposed of at Northwestern Disposal Co., in Wood County. The Ritchie County Recycling Center operates a drop-off center in Ellenboro. They collected 89 tons of material in 2005. The SWA also has proposed an educational program that includes advertising in local papers, and initiating informative and educational articles for publication.
Wirt County currently operates a drop-off recycling center in Elizabeth. All items are transported to the St. Marys Recycling Center in Pleasants County. Wirt County uses the Northwestern Landfill in Wood County and has no plans to site additional landfills in their county. The SWA plans to work with the DEP’s PPOD program to identify and list open dumps in the county so that they can be cleaned up. The SWA also publishes “Public Notices” to inform the residents of the county about mandatory garbage disposal. Wood County is home of Northwestern Landfill, a Class A landfill, owned by Waste Management, Inc. Solid waste collection is provided by ten commercial haulers, and one municipal program ran by the City of Parkersburg. Three of the commercial haulers and two municipal programs, Parkersburg and Vienna, offer curbside recycling programs to their customers. Since 1993, the Wood County Solid Waste Authority, in conjunction with the DEP, has cleaned up 99 open dumps. The Authority has also adopted rules for the proper disposal of solid waste and continues to help with enforcing the Mandatory Disposal laws.
5.3.4 Wasteshed E Berkeley County is home to the LCS Landfill, a Class B facility owned by Waste Management which accepts the majority of the county’s solid waste. The City of Martinsburg is the only municipality which provides waste collection to their residents. The rest of the county is serviced by Apple Valley Waste Services. Recyclable materials are collected at four main drop-off locations operated by the county SWA, as well as, one of the various private recyclers within the county. From 1989 to 2007, the Berkeley County Solid Waste Authority has worked with the DEP’s PPOD program in cleaning up 194 open dumps and reclaiming over 88 acres of land. Jefferson County operates a transfer station in Leetown, WV, which is the only collection point within the county to serve residents for waste and recyclables. Waste is either transferred to the LCS Landfill in Berkeley County, or one located in Pennsylvania. Jefferson County is serviced by two commercial waste haulers and one municipality. The Authority operates a recycling program at the transfer station in cooperation with the two commercial haulers, and three municipalities which collect plastic, glass, ferrous and non-ferrous metals, paper, cardboard, newspaper, and magazines. Morgan County Solid Waste Authority operates a drop-off recycling program for its residents three days a week. They can recycle cardboard, paper, glass, bi-metals, and aluminum cans. Waste generated within the county is transported to the LCS Landfill in Berkeley County by either Morgan Sanitation, or the Town of Bath. Since 1993, the Morgan County Solid Waste Authority, along with the DEP’s PPOD program has cleaned up 113 open dumps removing over 1,135 tons of material and 35,195 tires. Region VIII Authority is made up of Grant, Hampshire, Hardy, Mineral, and Pendleton. The Region VIII SWA operates two solid waste transfer stations which send all waste collected

5-8 Chapter 5: West Virginia’s County and Regional Solid Waste Authorities
to the Tucker County Landfill in Davis, WV. The five county regions are serviced by seven solid commercial waste haulers. The Authority intends to identify all open dumps in the region, and maintain them on a map in their office. Dumps will be rated and prioritized for cleanup. The SWA will continue to work with DEP’s PPOD program to assist them in cleaning up these dumps. Due to the rural nature of the region, curbside recycling is not a practical option at this time, however, there are three buy-back centers operating in Moorefield, Petersburg, and Ridgeley. 5.3.5 Wasteshed F Greenbrier County has four municipalities and four commercial haulers who provide solid waste collection services to both residential and commercial customers within the County. The Greenbrier County Solid Waste Authority operates the Greenbrier Sanitary Landfill, a Class B Commercial Solid Waste Facility in Lewisburg, which accepts all waste from within the county. The GCSWA also operates a large recycling center in Ronceverte where drop-off services are offered to county residents. This facility has recycled an average of over 11,000 tons of material per year since 2000. The Authority has cleaned up over 100 open dumps within Greenbrier County since 2004 with the assistance of the DEP and various other volunteers.
Nicholas County is home to the Nicholas County Landfill, owned and operated by the Nicholas County Solid Waste Authority, which currently recycles all white goods. The county is serviced by three commercial solid waste haulers with the City of Richwood providing their own collection service to the residents within the municipality. The NCSWA works closely with the various state agencies in enforcing the Mandatory Disposal Laws and in identifying and cleaning up open dumps within the county. Pocahontas County has a small, centrally located landfill that serves the entire county. The landfill is owned and operated by the
Pocahontas County Solid Waste Authority. Federal and state government own approximately two-thirds of Pocahontas County. Due to government refusal and the limitation of private land, it would be extremely difficult to site another solid waste facility in the county. No cases of major open dumps have been documented since 1990, due mainly to mandatory collection which has been enacted through an assessment fee placed on all dwellings in the county. The fee gives the property owner the right to use the green boxes designated for solid waste disposal placed throughout the county. Recycling bins are available at all green box locations. The SWA intends to increase awareness of the benefits of recycling through public school programs. Webster County has notified its residents of the mandatory garbage disposal law by public notice in the two county newspapers. Because of the geography of the county, curbside recycling is not the most efficient or effective manner to collect recyclables. The SWA will continue to promote placement of drop-off boxes for recyclables at the five county schools and at special events. The Webster County Landfill, owned by the Webster County Solid Waste Authority, is currently non-operational. 5.3.6 Wasteshed G Fayette County had previously submitted a regional comprehensive litter and solid waste plan in conjunction with Raleigh and Wyoming Counties. In 2009, it was agreed that each county would provide their updates individually. Currently, at the time of publication, Fayette County has yet to file an updated plan for approval. McDowell County waste is deposited in the Copper Ridge Landfill which is located within the county. Copper Ridge Landfill opened for business in October of 2007, and is currently only accepting local waste, and construction and demolition materials. The towns of Anawalt, Bradshaw, Davy, Gary, Iaeger, Keystone, Kimball, Northfork, and War provide collection

5-9 Chapter 5: West Virginia’s County and Regional Solid Waste Authorities
services for approximately 6,940 residents. The rest of the county is serviced by seven private haulers which assure that access to disposal services is available to all county residents. Through “Public Notices” and mailings, the McDowell County SWA has notified all residents of the law requiring proof of proper disposal. Enforcement of 33CSR7 is carried out through the use of law enforcement assistance and the county’s litter control officer. The Authority recognizes the county’s open dump problem and is committed to eliminating the problems. Since 2005, the City of Welch, MCSWA, and the DEP’s REAP-PPOD program, have cleaned up a total of 95 dumps and reclaimed over 53 acres of land. Currently, there are only three commercial recyclers within the county. The City of Welch has instituted a volunteer recycling program for its citizens. Due to the geographic and market challenges that face the county, the MCSWA has made recycling education a first priority with the objective of implementing local programs in the future. Mercer County was the first public landfill to have a composite liner installed. Solid waste collection is provided to the residents of the county by three private haulers and three municipalities. The Mercer County Solid Waste Authority has been working with the DEP’s PPOD and the Mercer County Environmental Restoration Program to clean up the open dumps, roadsides, streams and hollows throughout the county. Since 1991, they have removed over 8,300 tons of waste from the county. It is estimated that 90 percent of the residents either subscribe to a waste hauling service, or dispose of the waste legally at the landfill. The Authority plans to increase efforts to enforce the mandatory disposal laws with the development of a database over the next five years. The MCSWA accepts recyclable materials at the landfill and provides a drop-off bin at Concord College. In Mingo County, the problem of landfill closures and new landfills construction is particularly acute since the landfill closed on September 30, 1994. Mingo County is serviced by two private
haulers, Waste Management of WV, Inc., and Morgan Sanitation & Recycling. Williamson is the only public hauler in the county. The county currently produces approximately 52.7 tons of solid waste per day which is being transported to landfills in Kentucky. The Authority has worked closely with the DEP’s PPOD program in cleaning up 25 open dumps to date removing almost 700 tons of waste. Mingo County has had a solid waste ordinance in place, yet has enforcement issues in dealing with the county’s problems. Recycling facilities are limited in such a rural county. Residents and businesses have two options which are both limited in the items they accept. The Authority has been working with the teachers in the county to include more environmental information into the curriculum. Monroe County is home to one Class B Commercial Solid Waste Facility, HAM Landfill, which accepts the majority of the county’s municipal solid waste. The Monroe County Solid Waste Authority operates a recycling center and drop-off program at the HAM Landfill. There are four commercial solid waste haulers who service the county’s residential and commercial customers and provide curbside recyclable collection; Union Disposal; Humphrey’s Trash Disposal; Southern Sanitation, Inc.; and Greenbrier Valley Solid Waste. Raleigh County Solid Waste Authority owns and operates the Raleigh County Landfill, a Class A facility, which accepts the majority of the county’s solid waste. The RCSWA also operates a buy-back recycling center at the landfill, drop-off locations throughout the county as well as the Last Chance Mercantile, a retail store where citizens can buy refurbished items that were previously being disposed of at the landfill. There are five commercial haulers and one municipality providing collection service to the county residents. Since 1994, 1,270 open dumps have been cleared reclaiming over 579 acres of land. The Authority continues to educate its residents on the importance of recycling, mandatory disposal laws, and the penalties of illegal dumping.

5-10 Chapter 5: West Virginia’s County and Regional Solid Waste Authorities
The Summers County Solid Waste Authority has developed its siting plan to protect the scenic beauty of the county since tourism is the number one industry. The Authority has also developed a mandatory garbage disposal program in support of W.Va. Code §22C-4-10. Flyers promoting the program have been distributed in personal property taxes and they have developed a database to help track waste service subscribers. Wyoming County Commission owns and operates four transfer stations within the county, allowing residents in some of the rural areas an alternative way to dispose of their solid waste. Residents living close to the Mullins and Pineville area are serviced by one of the three commercial haulers who are certificated to operate within the county. The Wyoming County Solid Waste Authority, in cooperation with the county commission, operates the only noted recycling center in Wyoming County, and provides a mobile recycling drop-off program. Also, the SWA in conjunction with the DEP have cleaned up over 433 open dumps to date and continue to support, and enforce the mandatory disposal laws with the use of the county litter control officer. 5.3.7 Wasteshed H The Boone County Commission owns and operates two transfer stations. Solid waste is transported to Sycamore Landfill in Putnam County. Boone County provides free solid waste disposal provided residents bring their waste to one of the transfer stations. The service is funded by coal severance taxes. In the future, Boone County residents may have to pay a fee as coal production declines and landfill tipping fees increase. The cleanup of open dumps has been a continuous effort. A real estate appraiser notifies the county commission of any new illegal sites. Sites are cleaned up as funding becomes available. The plan calls for increased recycling because a landfill is unlikely due to the topography of the area and the fact that much of the area is undermined. The commission has opened a recycling center at a
closed school building for storage and baling of materials. Ferrous metal is collected at the transfer stations, and office paper at the county courthouse. Cabell County is working with Huntington to manage their solid waste with a recycling program and composting facility. Most of the county’s solid waste gets transported to Kentucky landfills. Calhoun County is serviced by two waste haulers, one commercial and one residential. All county waste is deposited in the Northwestern Landfill in Wood County. The Town of Grantsville provides service for its residents and has a mandatory collection ordinance. The Calhoun County Solid Waste Authority operates the Cabot Recycling Center, which accepts various source separated recyclables by residents on a voluntary basis. In Kanawha County, recyclables are collected using three principal methods; mobile drop-off stations, a permanent drop-off site, and source separated curbside collection by certain municipalities. There are seven municipalities that offer curbside recycling collection programs which are transported to the Kanawha County Solid Waste Authority’s recycling facility for separation and processing. The KCSWA’s facility also houses a drop-off area for county residents to use. There are ten municipalities within the county that provide solid waste collection for its residents, as well as five private haulers who service the rest of the county residents and businesses. Kanawha County’s disposal needs are being met by the Charleston Sanitary Landfill, a Class A Commercial Solid Waste Facility owned by the City of Charleston and operated by Waste Management. The Authority continually reviews an extensive list of illegal open dumps within the county for cleanup which is done in cooperation with DEP’s PPOD program and other local and county organizations. Lincoln County SWA operates three drop-off locations in the county. The SWA works with

5-11 Chapter 5: West Virginia’s County and Regional Solid Waste Authorities
the DEP’s PPOD program to cleanup open dumps in the county. Since the program’s inception, 273 illegal dumps have been cleaned up, reclaiming 241 acres of land and removing 2,169 tons of materials. The SWA has adopted a plan to support mandatory disposal and continues to promote and educate the public on the collection laws. Lincoln County is serviced by one certified hauler, Allied Waste, which transports all waste to either the Charleston Landfill in Kanawha County, or Disposal Services and Sycamore Landfills in Putnam County. Logan County has one permitted transfer station located in Peck’s Mill. From the transfer station, all county waste is transferred to landfills in Putnam or Kanawha Counties. Four of the five municipalities provide collection service for their residents which leaves the remainder of the county serviced by Waste Management, Inc. Recycling within the county is served by four commercial recycling companies. Open dumps remain a problem within Logan County. With the hiring of a solid waste inspector, the Authority has focused a majority of their attention on the education and enforcement of mandatory disposal laws aiding in the reduction of those problem areas. The Mason County Solid Waste Authority operates the county’s drop-off recycling center along with some assistance from the county commission. There are two municipalities and four commercial solid waste haulers who provide service for Mason County’s residential and commercial customers. The majority of the disposal needs are being met by landfills in either Putnam or Harrison County. To date, the MCSWA and the DEP’s PPOD program have eliminated 70 open dumps, reclaimed 105 acres, and removed over 760 tons of waste within the county. Putnam County, one of the fastest growing counties in the state, is home to two landfills, Disposal Services and Sycamore Landfills. Located between Charleston and Huntington, Putnam County landfills serve as the disposal
area for significant portions of Wasteshed H. The City of Nitro provides solid waste collection services to its residents while the rest of the county uses one of the two certificated private haulers. It is estimated that curbside collection is available to 98% of county residents. The Solid Waste Authority continues to work with the DEP, DOH, and the DNR in cleaning up open dumps and enforcing mandatory disposal laws. Also, the PCSWA continues to encourage and coordinate the development of an infrastructure that provides county residents with accessible and affordable recycling services. The Roane County SWA operates a drop-off recycling facility in Spencer and has one collection trailer placed at the Roane-Jackson Vocational Technology School. Two haulers presently provide pickup service for county residents and businesses. Waste is disposed of at the Charleston landfill in Kanawha County. The SWA intends to use public education and punitive measures to enforce mandatory disposal. A media campaign is used to assist in identifying open dumps. There have been a total of 27 dumps cleaned up, which reclaimed 22 acres of land. Volunteer programs are in place to assist in the cleanup efforts. Wayne County SWA provides curbside recycling for businesses located in the Town of Wayne, and a mobile drop-off program for residents in Lavalette, Fort Gay, and Wayne. Currently, there are three private haulers and four municipalities that provide solid waste collection services for their customers and residents. There are no Class A, B, C or D landfills located in Wayne County. Waste is deposited in either one of the two landfills in Putnam County, or by using one of the two landfills located just over the border in Kentucky. The Wayne County SWA works very closely with the DEP’s PPOD program and the West Virginia Contractor’s Association in cleaning up open dumps. To date, there have been 622 dumps cleaned up which has reclaimed 541 acres of land. The Authority has also implemented an alternative sentencing program in cooperation with local law

5-12 Chapter 5: West Virginia’s County and Regional Solid Waste Authorities
enforcement to facilitate open dump cleanup and litter control. 5.4 Solid Waste Management Board/Solid Waste Authority Coordination The SWMB is the coordinator between the SWAs and other state agencies involved in solid waste management. The Board is composed of seven members. The Secretary of the Department of Health and Human Resources (DHHR), and the Secretary of the DEP, or their designees, are members ex officio. The other five members are appointed by the Governor, by and with the advice and consent of the Senate; two appointees having three years of professional experience in solid waste management, civil engineering, or regional planning, and three appointees representing the general public. One of the major duties of the SWMB staff includes providing technical assistance to the county and regional SWAs in the preparation, review, implementation, and update of their Comprehensive Litter and Solid Waste Control Plans and Commercial Solid Waste Facility Siting Plans. If an authority fails to submit a plan, the SWMB staff must develop a plan for them. In addition to identifying and securing markets for recyclables for the SWAs, municipalities and other interested parties, the SWMB must provide help educating the public on source reduction, recycling and reuse. The critical need in waste management is communication through marketing and public education to encourage people to recycle properly, and to realize that they are part of a larger continuous effort. 5.5 Solid Waste Management Board Grants In accordance with W. Va. Code § 22C-4-30, an assessment fee of $1.25 per ton on solid waste disposed is collected at all solid waste disposal facilities in the state. This fee is deposited in a special revenue account, the “Solid Waste Planning Fund,” to be allocated by the SWMB.
Fifty percent of the fee is divided equally among each county SWA. The other 50% is expended by the SWMB for (1) administration, technical assistance or other costs necessary to implement the purposes of Chapter 22C, Article 4 and (2) grants to the county or regional solid waste authorities. The grant rules, found in 54CSR5, prioritize the purposes for which grants can be awarded.
1. Source Reduction. 2. Reuse. 3. Recycling. 4. Open Dump Cleanup. 5. Transfer Stations. 6. Landfills. 7. Administrative Costs. 8. Projects for Education.
In recent years the SWMB has limited SWA awards for salary and wages to no more than 50% of the grant total in an effort to move authority’s towards self-sufficiency.

Chapter 6
West Virginia’s Recycling Plan

6-1 Chapter 6: West Virginia’s Recycling Plan
Chapter 6: West Virginia’s Recycling Plan
6.1 Introduction West Virginia Recycling Act, § 22-15A emphasizes the importance of integrated waste management. This involves a combination of techniques and programs to manage municipal solid waste. Instead of immediately developing large, high-technology programs or setting unrealistic expectations about what portion of the waste stream can be recycled; decision-makers implement a series of smaller, complimentary programs. The goal of the system is to support the waste management hierarchy: source reduction, reuse, recycling, and landfilling.
6.1.1 State Recycling Goals The West Virginia Recycling Act established disposal goals that would reduce the per capita disposal of solid waste 20% by January 1, 1994; 30% by January 1, 2000; and 50% by January 1, 2010. At this time these goals have not been changed or re-evaluated. As the evolution towards energy conservation continues across the nation and world, sustainability is becoming more and more important. Source reduction, reuse, and recycling are all key factors in sustainability. Encouraging an increase in recycling to improve our state’s sustainability would require establishing reasonable recycling goals and related reporting requirements. There are no reporting requirements for recyclers in West Virginia which makes calculating an accurate recycling rate for the state difficult. When recycling goals are established they should be reasonable in scope. If percentage goals are used, the State should establish some way of measuring and reporting them statewide. In a recent survey of 6 states in the region, 5 require some type of recycling report from their local solid waste management districts, or counties, on an annual basis. Some also require annual recycling reports from state agencies, newspaper publishers, telephone directory publishers, cities and towns, and
private firms. For more information on recycling in the surrounding states, see Appendix E of this document. Other goals used by West Virginia’s neighboring states include setting a two tiered goal, one for residential waste, and another for commercial and industrial waste. Residential waste tends to be more costly to collect, therefore, when establishing such a goal it should be calculated at a smaller percentage than that for commercial and industrial waste. Another way to measure recycling is by using an “access goal”, making recycling available to an identifiable percentage of residential, commercial, and industrial entities. Public education and awareness goals also measure recycling. Requiring each local solid waste authority to have a website listing local recycling opportunities, and providing educational materials for its citizens and schools is a measurable goal. 6.1.2 Recycling Planning The West Virginia Recycling Act authorized the establishment of county recycling programs through referendum. The Act requires the establishment of curbside, source separated municipal recycling programs in municipalities of 10,000 or more and also required county and regional Solid Waste Authorities (SWAs) to prepare and adopt a comprehensive Recycling Plan as part of their Comprehensive Litter and Solid Waste Control Plan. Per the Act, all State agencies, primary and secondary schools, as well as colleges and universities must establish recycling programs. In addition, State agencies, to the maximum extent possible, should purchase recycled products. Also, the Act prohibited yard waste, tires, lead acid batteries and certain electronic waste from being deposited in landfills. It also directed the SWMB to prepare a program for the proper handling of these materials. Copies of

6-2 Chapter 6: West Virginia’s Recycling Plan
these documents are available at www.state.wv.us/swmb/. Recycling is a fundamental part of any integrated waste management plan, and while it can’t solve the State’s solid waste management problems alone, it can divert a significant portion of the waste stream from disposal in landfills. Recycling program development requires strategic planning. This involves understanding material markets, building local expertise, setting realistic goals, and fostering public participation, as well as public awareness, and education. It is the goal of this plan to help provide direction to state and local agencies, and the 50 SWAs when spending public monies so that the collection, processing, transporting, and marketing of recyclables can be implemented as cost-effectively as possible. This involves several things: a) analyzing alternatives that work best in urban v. rural areas, b) identification of existing facilities and associated equipment, c) an analysis of existing markets, including their location and the quantity, quality, and processing requirements, d) the potential development of new markets, e) an analysis of the possible effectiveness of regionalized processing centers, and f) making incentives available to facilitate the development of these markets. The planning process in West Virginia is multi-level, occurring on both state and local levels. Locally, the state’s SWAs are required to have a recycling plan on file with the SWMB as part of their Comprehensive Litter and Solid Waste Control Plan. Local recycling plans are required to set goals, designate three items that can be source separated and recycled most effectively, describe the existing and anticipated markets for recyclable materials, designate potential strategies for the collection and marketing of each material, estimate the likely program recovery rate, and establish the requirements for a recycling program appropriate for the county or region.
Plans are required to describe public education programs, outline the goals, and identify target audiences and messages for those audiences. Plans must also identify methods to disseminate information and develop an effective media strategy. Summaries of each county’s plan and the planning process itself are described in Chapter 5. 6.2 Recycling Problems Specific to West Virginia 6.2.1 Population Density All waste management, including recycling, is volume dependent. Recycling centers must collect enough material for income to meet or exceed operational costs. Low population density areas have increased collection cost for all types of waste. This problem has accelerated significantly in recent years due to increases in operating cost, much of which are fuel related. West Virginia has a population density of 77 persons per square mile (2010 US Census.) Surrounding states have population densities that are significantly higher; Kentucky, 110; Maryland, 595; Pennsylvania, 284; Ohio, 282, and Virginia, 203. In order for recyclers in West Virginia to make a profit or break-even, they must operate in a highly efficient manner. Costs have to be controlled, and materials should be collected and marketed in bulk. This puts rural recycling programs at a disadvantage compared to their urban counterparts. Population density has an impact on the collection of recyclable materials. The most productive recycling programs tend to be curbside programs where a municipality or waste hauler picks up recyclables on a regular schedule. Low population density or rural areas usually don’t receive this type of service because of low volumes, labor, and fuel costs. Rural areas tend to offer drop-off services which present other problems, access and contamination.

6-3 Chapter 6: West Virginia’s Recycling Plan
6.2.2 Marketing and Management Problems for Small Recycling Centers Small recycling centers, both public and private, sometimes have trouble paying for everyday expenses like utilities, payroll, and fuel, because of irregular cash flow and/or limited resources. They often have to market their materials to a middle man, local processing centers, scrap yards, or material brokers rather than end-user that pay more. Smaller facilities may have to hold materials until they have amassed truckload quantities. Light weight material like plastic, can be held up to a year or more. As of this writing, Caraustar, a large manufacture of paper products based in Austell, GA, has been splitting loads of paper for small West Virginia recycling centers. This is most likely a reaction to higher demand for recycled paper. Equipment can also be a problem for small recyclers. Smaller pieces of equipment, balers for instance, tend to have a long cycle time, and increasing labor cost. They also offer limited compaction and may not be able to produce a mill-ready bail. Larger machines can be cost prohibitive. Many smaller recyclers, both private and municipal, sell their inventory loose and/or commingled to any buyer available. Recyclable materials are by definition commodities. As such, they tend to have a low per unit value, and at some point in the marketing channel are graded. Materials must be collected in volume to make recycling even marginally profitable. Providing a clean product is essential to maximum market value. Due to price fluctuation, larger recycling processers often hold materials while waiting for prices to rise. Smaller operations often don’t have that option. Another problem that small, and sometimes larger, recycling facilities have is the use of inmate labor. W.Va. Code §22C-4-22 directs the SWA’s to utilize incarcerated individuals in their programs. Inmate labor from the regional
jails and local day reporting centers is often unavailable on a daily basis, leaving facilities short on labor for periods of time; a situation that causes donated materials to pile up at the center or at other places such as remote drop-off sites. 6.2.3 Lack of Immediate Markets for Materials Another problem inherent to recycling in West Virginia is the lack of local markets for materials. This has a negative impact on both small and large recycling centers. The West Virginia Recycling Directory, a listing of recycling collectors, processors and end-users, managed by the West Virginia Department of Commerce, shows only 6 end-user markets in the state. These listings included one for metals, two for plastics and three for paper. Regional markets are usually only practical for larger processing centers. Typically, once a market is found, an arrangement is made between buyer and seller, sometimes by contract and sometimes by verbal agreement. The buyer picks up the material from the seller deducting hauling expenses from the price paid for the material. Markets are sometimes found in the five surrounding states, and other times, materials must be shipped as far as three to six hundred, or more miles. There are many types of markets. Some choose to use material brokers, some use local or regional processing centers, some use the services of recycling cooperatives, and some market directly to mills. The Solid Waste Management Board can help recyclers find both in-state, and regional markets for recyclable materials. Some of our smaller recycling centers, unfortunately, find themselves giving materials to transporters free of charge to cover hauling cost. Others pay significant fees to haulers to transport materials to market. This is in part due to the current high prices for fuel. In the FY 2012 Solid Waste Management Board grant-cycle, approximately 22% of all grant funds awarded

6-4 Chapter 6: West Virginia’s Recycling Plan
were for expenses related to transporting materials. 6.2.4 Public vs. Private Recycling Centers Public sector recyclers set up programs that best serve their communities. These programs often accept materials because there is community demand. Unfortunately, sometimes these materials have little or no market value, are expensive to collect and store, difficult to market, or otherwise have limited profitability. Private sector firms, in order to stay in business, must make a profit on all, or most, of the materials they collect. These firms will sometimes come into an area and focus on collecting materials that have a high market value, can be collected at a low cost, or can be collected in bulk easily. This leaves low value, low volume, or hard to market materials in the waste stream and destined for possible landfill disposal, or public sector recycling programs that often end up taking what the private sector firms leave behind. A recent trend in recycling is for large recyclers to implement single-stream recycling programs. These programs collect commingled materials, and ship to regional processing centers equipped with high-tech material sorting technology. This reduces collection cost, however, many feel that sorting technology is not advanced enough at this time to produce clean, high grade materials. One of the unanswered questions about single-stream recycling is; what effects will dumping large volumes of low grade material on the recyclable markets have on recyclable materials long term? On the other hand, there are several examples of public/private cooperation in the state. Several public recycling programs collect material and market them to locally owned private processing centers at fair market value. Other public programs work in tandem with private recyclers providing education and awareness, while the private sector recycler provides recycling services to the community. Other public programs solicit state grant funds to
purchase recycling equipment which is then leased to private firms. 6.2.5 Lack of Incentives in the System There are several ways to provide recycling incentives. Many states provide tax incentives. West Virginia will provide a disposal tax waiver to commercial recyclers who dispose of 30% or less of total waste processed for recycling. Other states provide tax waivers on equipment purchases, property tax exemptions, income tax exemptions, employment tax exemptions, and investment tax credits, etc. Not all incentives are tax related, nor are they all about rewards. Some states provide incentives that punish. Pennsylvania has civil and other penalties for not meeting local recycling goals. Virginia provides possible civil and permitting penalties for those that do not meet recycling goals. Maryland allows state and local authorities to prohibit the issuance of building permits for all new construction for failure to reach mandated recycling rates. Appendix E provides more information on incentives in neighboring states.
6.3 Market and Infrastructure Development 6.3.1 Recycling Potential Analysis According to the 2010 US Census, West Virginia has a population of 1,852,994. When factored into a 4.43 lb. per person, per day municipal solid waste disposal rate established by a 2010 U.S. EPA waste characterization study, West Virginian’s dispose of approximately 1,498,099 tons of municipal waste annually. Municipal waste includes household garbage, and non-restricted commercial waste such as paper and cardboard. This measure of the state’s waste includes waste going into the West Virginia’s landfills, waste generated in state but being disposed of out of state, the portion of the waste stream being composted, and that portion being recycled.

6-5 Chapter 6: West Virginia’s Recycling Plan
Table 6.1 details the amount of the waste stream that could potentially be recycled. Until such a time, a more manageable approach
would be to ask what portion of the waste stream is it reasonable to expect to recycle in West Virginia.
Table 6-1 Recycling Potential in West Virginia
Material Percentage in Waste Stream
Recycling Potential In Tons
Average Market Value - Per Ton
Potential Market Value
Glass 4.8% 70,448 $27 $1,902,096
Metals 8.6% 126,219 $135 $17,039,565
Paper 28.2% 413,881 $108 $44,699,148
Plastics 12.3% 180,523 $720 $129,976,560
53.9% 791,071 $193,617,369 Market value for all materials was determined through a market index maintained of the northeastern region of the US by Waste & Recycling News. The price of glass is for clear container glass, the price for metals represents the average prices paid in 2011 for steel cans and appliances. The price for paper is for mixed paper and the price for plastics is for HDPE type plastics. These values change frequently.
Table 6-2 details possible tonnages with a 50% recycling rate, a 25% rate and a 10% rate. While the state doesn’t have a system in place to measure recycling, it is believed that many areas have exceeded the 10% rate and are moving toward higher recycling tonnages. To date, the state has no known food waste recycling programs, and only a few that collect textiles.
Table 6-2 Recycling Potential in West Virginia: Sensitivity Analysis
Recycling Potential In Tons at…
Material Percentage in Waste Stream 50% 25% 10%
Glass 4.8% 35,224 17,612 7,045
Metals 8.6% 63,110 31,555 12,622
Paper 28.2% 206,941 103,470 41,388
Plastics 12.3% 90,261 45,131 18,052
Total 53.9% 395,536 197,768 79,107 For a look at the volume and market values of recyclable materials on a wastesheds by wasteshed (regional) basis, see Appendix D of this document. 6.3.2 Material Markets Markets for recyclable materials have traditionally been somewhat volatile. In the fall of 2008, markets experienced a significant and
sustained decline. Some paper markets fell by 80% or more, while some paper markets dried up all together. Similar declines were observed in plastics. Metals also experienced significant declines. These price fluctuations were due to a worldwide economic recession. Prices have mostly returned to their pre-recession levels, and in some cases, even higher. It should be noted that markets tend to be cyclical. Following

6-6 Chapter 6: West Virginia’s Recycling Plan
are market summaries for the most commonly recycled material. Glass: In 2011, West Virginia’s Solid Waste Authorities (SWAs) and the 14 municipalities with populations of over 10,000 collected nearly 3,000 tons of glass for recycling. The market value of glass has been low relative to other recyclables for a long time. Only container glass is considered recyclable, with clear glass, sometimes called flint, bringing the highest price, and brown (amber), or green glass much less. Low market value and significant transportation
cost have forced many recyclers to discontinue glass recycling. As of October 2011, 14 of the above mentioned programs were collecting glass. Most of these are located in northern West Virginia in close proximity to markets in Ohio and Pennsylvania. While there are no markets for recyclable container glass in West Virginia, limited markets exist in Pennsylvania, Kentucky, and Ohio. Glass prices have been flat for a long time. A significant increase in prices occurred in August 2011, but probably not enough to drive an increase in glass collection.
Figure 6-1 Glass Prices – Average Price Per Ton (January 2009 – January 2012)
Metals: Solid Waste Authorities (SWAs) and the 14 municipalities with populations over 10,000 recycled at least 2,125 tons of metals in 2011. Materials include aluminum and steel cans, scrap metal, non-ferrous metals and white goods. The most valuable materials are various non-ferrous metals such as aluminum and copper. The types of metal that end up at community recycling centers make up about 8.8% of the municipal waste stream. Most metals go to scrap yards. Most community
recycling centers collect aluminum and steel cans and various types of non-ferrous metals. Some operate as buy-back centers while some accept the material on a donation basis. Metals are most often sold to local scrap yards that are equipped to handle large volumes of metals. Metal prices have been flat since the market disruption in late 2008 and are expected to stay that way until sales of autos and durable goods improve.
$0.00
$5.00
$10.00
$15.00
$20.00
$25.00
$30.00
$35.00
Jan 2009 July 2009 Jan 2010 July 2010 Jan 2011 July 2011 Jan 2012
Pri
ce P
er T
on
Glass PricesJanuary 2009 - January 2012
Glass - Clear Glass - Brown Glass - Green

6-7 Chapter 6: West Virginia’s Recycling Plan
Figure 6-2 Ferrous Metal Prices - Average Price Per Ton (January 2009 – January 2012)
Papers: Paper includes newspapers, cardboard, office paper, magazines, and mixed paper. In 2011, Solid Waste Authorities (SWAs) and the 14 municipalities reported recycling 16,430 tons of paper and 10,097 tons of cardboard. Paper makes up over ¼ of the waste stream and can be collected in bulk from commercial sources. West Virginia has three paper mills. Fibrek, formerly SKF Pulp in Fairmont, WV is a large fiber recovery facility which processes around 1,200 tons of recyclable paper per day. They reported processing 327,557 tons of recycled paper stock for calendar year 2010. Ox Paperboard, former Halltown Paperboard, located in Halltown, WV recently completed a
$1.8 million upgrade and expects to produce an estimated 75,000 tons of paper annually from recycled books, newspapers, and other types of recycled paper. West Virginia recyclers also have access to Banner Fiberboard in Wellsburg, WV. In general, the markets for paper are strong. Other markets in the Eastern U.S., utilized by West Virginia recyclers include Chambersburg Waste Paper, Southeast Paper Company, Valley Converting, Georgia Pacific, Midland Davis, Royal Paper Stock, Bowater, Caraustar Industries, Associated Paper Stock, and Sonoco.
$0.00
$20.00
$40.00
$60.00
$80.00
$100.00
$120.00
$140.00
$160.00
Jan 2009 July 2009 Jan 2010 July 2010 Jan 2011 July 2011 Jan 2012
Pri
ce P
er T
on
Ferrous Metal PricesJanuary 2009 - January 2012
Steel Cans White Goods

6-8 Chapter 6: West Virginia’s Recycling Plan
Figure 6-3 Fiber Prices - Average Price Per Ton (January 2009 – January 2012)
Plastics: West Virginia’s SWAs and mandated municipalities collected 1,316 tons of plastics in 2011. Most collections were mixed plastics, #1 PET and #2 HDPE with a few collecting plastic film. Commercial Plastics Recycling, and Flying
W Plastics, both located in Glenville, WV, use recycled feedstock in their processes. Other markets utilized by WV recyclers include Blue Ridge Plastics, Caraustar, Clearport, Envision, Southern Scrap, and Mondo Polymers.
Figure 6-4 Aluminum/Plastic Prices - Average Price Per Ton (January 2009 – January 2012)
$0.00
$50.00
$100.00
$150.00
$200.00
$250.00
$300.00
$350.00
Jan 09 July 09 Jan 10 July 2010 Jan 2011 July 2011 Jan 2012
Price Per To
n
Fiber PricesJanuary 2009 ‐ January 2012
Mixed Paper Newsprint Cardboard Office Paper
$0.00$0.10$0.20$0.30$0.40$0.50$0.60$0.70$0.80$0.90$1.00
Jan 2009 July 2009 Jan 2010 July 2010 Jan 2011 July 2011 Jan 2012
Pri
ce P
er P
ou
nd
Aluminum/Plastic PricesJanuary 2009 - January 2012
Aluminum Cans PET Plastics HDPE Plastics

6-9 Chapter 6: West Virginia’s Recycling Plan
In 2011, West Virginia Solid Waste Authorities (SWA) recycled 37,528 tons of material and realized $3,462,196 in recycling revenues. The following table illustrates the top 5 materials
recycled in terms of tonnage, and the top five materials in recycling revenue. For a complete analysis of SWA recycling programs, see Appendix D of this document.
Top 5 Materials Collected Top 5 Money Makers Materials Tons Materials Revenue
Paper, Mixed 9,407.91 Cardboard $1,129,879
Cardboard 9,064.95 Paper, Mixed $648,935
Yard Waste 8,231.98 Paper, Office $449,528
Paper, Office 2,684.50 Aluminum Cans $348,615
Electronics 1,221.90 Metals, Mixed $245,393
Totals 30,611.24 $2,822,350 6.4 Recycling and Marketing Restricted or Difficult to Manage Materials 6.4.1 Electronic Waste According to the US EPA, the US discards 30 million computers each year. They estimate that only 15-20% of e-waste is recycled, and 70% of heavy metals in landfills come from discarded electronics. Electronic waste may contain one or more of the following: lead, mercury, cadmium, beryllium, bromated flame retardants, or other hazardous substances. Your local landfill, although built to US EPA standards, may not be able to contain hazardous substances over long periods of time. Recycling electronic waste has been a challenge to West Virginia on both the state and local levels. In 2002, US EPA Region III including, West Virginia, Maryland, Pennsylvania, Delaware, Virginia, and Washington DC initiated a pilot project focusing on end-of-life electronics recycling. The e-Cycling program was designed to utilize a system of shared responsibility to address an important and growing environmental and social issue. First, an electronics recycling contractor was chosen with the capability to serve the entire region. State agencies coordinated e-cycling in their areas of responsibility, working with the localities to organized single day collection events. The
Solid Waste Management Board, working with local solid waste authorities, set up a series of 7 local collection events. By the end of the year, the program had collected 137 tons of e-waste in West Virginia. The program continued through 2003 and 2004 collecting 142 and 160 tons respectively. In 2004, the first electronics recycling business capable of handling significant tonnages on a statewide scope emerged – West Virginia P C Renewal, located near Morgantown, WV.
To further facilitate electronic recycling in West Virginia, the 2008 Legislature passed Senate Bill 746. The bill requires all manufactures of computers, monitors, televisions, and video display devices with screens 4" or larger, to register with the WV Department of Environmental Protection. Manufactures who market covered electronic devices in West Virginia are required to pay a registration fee, to set up a take-back program, (either through a mail-in program, a collection events program or a collection center), and to pay a yearly fee. All fees, fines and penalties were deposited in the "Covered Electronic Devices Takeback Fund," administered by the Secretary of the WV DEP, and are to be used for recycling grants for counties and municipalities.
In the 2009 - 2010 legislative sessions, Senate Bill 398 was passed banning electronics from

6-10
Chapter 6: West Virginia’s Recycling Plan
West Virginia landfills, effective January 1, 2011.
The Solid Waste Management Board was
directed to design a comprehensive program for
the proper handling of electronic devices. The
plan was completed and submitted to the
legislature on January 1, 2011.
As of November 2011, the state has collected
over 8.7 million lbs. of electronics for recycling.
6.4.2 Household Hazardous Waste
Household Hazardous Waste (HHW) has one or
more of the following characteristics; toxicity,
corrosiveness, ignitability and/or reactiveness.
HHW can be, but is not limited to, the following:
pesticides, battery acid, bleach, gasoline, paint
thinner, glue, nail polish remover, fertilizer, pool
cleaning chemicals, lighter fluid, oil based paint,
and many other things. These chemicals are not
allowed in West Virginia’s landfills.
The primary tool for managing HHW is for one or
more public sector entities, usually the Solid
Waste Authorities, to hold a one day collection
event. To do this, a qualified contractor must be
found to package and process collected
materials. These events are costly. The Solid
Waste Management Board grant program will
fund these programs for the local solid waste
authorities.
Over the last decade, cost for these single day
events have averaged $27,700, from $15,000 to
$35,500 per event. Typical intakes at HHW
events include paints, resins, caulks, antifreeze,
flammable liquids, dry cell batteries, lead acid
batteries, aerosols, oil, asbestos, RCRA exempt
acids, pesticides, fluorescent lights, mercury and
other, sometimes unidentifiable materials. The
events take in large volumes of material. HHW
collection events in West Virginia have been
sponsored most often by the Ohio County Solid
Waste Authority.
Some entities have continuous collection of
limited types of material. Many programs offer
Freon extraction as part of a white goods
(appliance) collection program. Other public
sector recycling programs collect compact
florescent lights (CFLs), various types of
batteries, oil, and other materials. Some
recycling centers charge a small fee for these
services.
Household hazardous waste is a problem yet to
be adequately addressed in West Virginia.
6.5 Innovative Incentives and Strategies for
Recycling
6.5.1 Effective Program Strategies
Public sector recycling programs sometimes
operate in areas where recycling may not be
profitable. These programs often depend on
grant funding, or other assistance to maintain
financial stability. Programs like this must use
innovative business strategies if they are to
continue to exist. A wide variety of innovative
strategies are employed in West Virginia, as no
two programs are the same. Several programs
have developed long term cooperative
relationships with their county commissions. By
sharing responsibility for litter control, stream
and highway cleanup, recycling, open dump
cleanup and other environmental programs, both
can benefit. Organizations like the local solid
waste authorities usually have the resources
and experience to manage these programs but
are somewhat lacking in funding. County
commissions often have the funding, but lack
the experience. In this situation, shared
responsibility gets the job done. For FY 2010,
County Commissions subsidized the activities of
local Solid Waste Authorities by over $360,000.
Other public sector programs develop
relationships with private sector businesses.
Some solid waste authorities provide
educational and public awareness services in
cooperation with private business that provide
recycling services. Other programs have
developed long term relationships with private

6-11 Chapter 6: West Virginia’s Recycling Plan
sector processing, and marketing services in order to facilitate local markets for small recycling collection programs. Many public programs drive innovation by working together. Several of the state’s solid waste authorities own and operate recycling processing centers. These processing centers clean up, bale, and market materials for smaller programs, and deduct appropriate fees for their services from the sale price. Another innovation is managing public sector recycling programs like private sector businesses. Programs of this type don’t collect materials they can’t make money on. If the public asks for a service which can’t be provided on a profitable basis, they provide the service for a fee. Marketing cooperatives are another option. The North Central Recycling Cooperative operating in the Taylor-Upshur county area provides marketing services for several recycling programs in the area. They help local recyclers by combining materials from different programs to create truck-load quantities that bring top dollar at the region’s best markets. They charge a fee for their services. 6.5.2 Regionalization Informal discussions have occurred within state and local government for some time about regionalization in recycling. The concept of regionalization in recycling involves creating several large material processing centers strategically placed so the state’s smaller recycling centers and municipal collection programs have access to local markets for the materials they collect. At the time of publication, in-state markets are available, but the state is not adequately covered. The processors that provide services regionally are scattered, each serving one or more counties. In most cases, these facilities provide processing, and marketing for one or more materials, and may not be assisting every recycling center located in the counties they serve.
The Greenbrier SWA Recycling Center, Monongalia SWA Recycling Center, and Raleigh SWA Recycling Center are all publically owned and provide regional service for smaller recycling centers. West Virginia Cashin’ Recycling, JR Recycling, Ashley’s, and other private sector firms provide markets for one or more materials. The North Central West Virginia Recycling Cooperative (NCWVRC) is a nonprofit corporation which provides marketing services for public and private programs. NCWVRC does not process materials. Appendix D of this document provides listing of markets used by Solid Waste Authorities and Municipalities in the state. Several of the smaller recycling programs not covered by regional centers have their own processing facilities. Many of these programs don’t collect a sufficient volume to command premium prices. These facilities generally finance equipment purchases, and sometimes operating cost from the SWMB and REAP grant programs. 6.6 Outreach and Public Education Public education and awareness is a crucial part of any recycling program. Unfortunately, a shortage of funds due to ever increasing prices for essential expenses such as fuel, insurance, material transportation, and other things has curtailed the amount of state and local funding going into recycling education. For FY 2012, only about 5% of the SWMBs grant funding went into public education. On the local level, recycling is promoted by the Solid Waste Authorities. Many of the authorities go into schools, and work directly with students. The authorities also disseminate information about local recycling opportunities within the community. On the state level, the Solid Waste Management Board (SWMB), and DEP REAP grant programs provide funding for public education when available.

6-12
Chapter 6: West Virginia’s Recycling Plan
6.6.1 West Virginia Recycles
The SWMB, DEP REAP, and several other
state, local and private organizations have
joined together to form the Recycling Coalition of
West Virginia, a fully chartered 501.c.3 nonprofit
corporation. The coalition purpose is to promote
recycling statewide.
In November, the coalition sponsors West
Virginia Recycles. This statewide event
promotes recycling by holding contests and
sponsoring events such as the annual Re-
Fashion Show.
The coalition solicits contributions from both
public and private sources and grant programs
to finance its activities. In addition to the
aforementioned events, the coalition sponsors a
website www.wvrecycles.org, which focuses on
recycling education, promotion and public
awareness.
6.6.2 West Virginia Materials Exchange
To further promote recycling, the Solid Waste
Management Board created the West Virginia
Materials Exchange. The exchange is an
interactive web based program that allows users
to place ads for unwanted materials. The
exchange accepts ads from both buyers and
sellers, and runs the ads free of charge. Users
post ads for left over or unneeded industrial
material such as equipment, unused feedstock,
and reusable waste. Recyclers post ads for
materials wanted and material available. The
exchange currently has approximately 800
registered users.
6.7 Roles and Responsibilities
6.7.1 County Responsibilities
A comprehensive recycling program for solid
waste may be established in any county of West
Virginia by action of a county commission.
Comprehensive recycling programs for a county
may also be established by referendum. The
process involves filing a petition with the
commission bearing the signatures of registered
voters in the county equal to, but not less than,
5% of the number of votes cast within the county
for governor in the preceding gubernatorial
election.
If the comprehensive program is established by
petition and referendum, it may only be
rescinded by the same procedures that
established the program. If a majority of legal
votes are for termination of the previously
established recycling program, the county
commission shall, upon certification of the
results, rescind the program by ordinance.
6.7.2 Municipal Responsibilities
To help accomplish recycling goals, the
Legislature mandated municipalities with a
population of 10,000 or more to establish and
commence implementation of a source
separation and curbside collection program for
recyclable materials. There are currently
fourteen mandated municipalities in West
Virginia: 1) Beckley; 2) Bluefield; 3) Charleston;
4) Clarksburg; 5) Fairmont; 6) Huntington; 7)
Martinsburg; 8) Morgantown; 9) Parkersburg;
10) St. Albans; 11) South Charleston; 12)
Vienna; 13) Weirton; and 14) Wheeling. Many
other smaller municipalities have either a drop-
off or curbside recycling programs.
6.7.3 Solid Waste Management Board
(SWMB)
Along with providing assistance to the SWAs,
municipalities, and other interested parties in
identifying and securing markets for recyclables,
the SWMB must provide assistance in public
education for source reduction, recycling, and
reuse.
The SWMB has prepared comprehensive
programs for the proper handling of yard waste,

6-13 Chapter 6: West Virginia’s Recycling Plan
lead-acid batteries, tires, and covered electronic waste. They have created a website for electronic waste and electronic recycling. www.state.wv.us/swmb/rmdp/ewaste. Approximately $6.7 million has been awarded by the SWMB in recycling grants to local SWAs since 1991. Grant descriptions can be found in Appendix A of this document. Grants have been awarded for recycling education programs, equipment purchases, facility construction, and operating expenses.
6.7.4 Department of Environmental Protection (DEP) The DEP’s Division of Water and Waste Management (DWWM), and Division of Land Restoration are involved in solid waste management. Regulations promulgated by the DWWM are enforced by the Environmental Enforcement unit. If a permit is required for a recycling facility wishing to charge a tipping fee, the facility is then subject to the DEP rules regarding commercial solid waste facilities. The Division of Land Restoration’s Rehabilitation Environmental Action Plan (REAP) has an effective, and streamlined system that serves the environmental remediation programs. REAP is comprised of the Pollution Prevention and Open Dump Program (PPOD), the WV Make It Shine Program, Adopt-A-Highway Program, Operation Wildflower Program, and the state’s Recycling Program. The REAP Recycling Assistance grant program distributes approximately $1.5 million per year to government, nonprofit and private sector entities. In 2008, the WV Covered Electronic Devices Manufacturer Registration, and Takeback Program was established as a result of SB 746. The goal of this bill was to establish a registration process for manufacturers of CEDs. The initial and subsequent registration fees are used to fund the CED grant program, managed
by REAP. This grant program assists municipalities and county governments in establishing ongoing electronic collection programs or single day collection events. 6.7.5 Public Service Commission (PSC) The PSC can grant, or deny a Certificate of Need, which is a permit required for construction, operation and expansion of a commercial solid waste facility. They become involved in recycling if a Certificate of Need is required for a recycling facility wishing to charge a tipping fee. The facility is then subject to PSC rules regarding commercial solid waste facilities. They also regulated municipal waste haulers.
6.7.6 West Virginia University Extension Service The WVU Extension Service, through offices at the county and state program levels, provide objective information on solid waste issues particularly relating to waste utilization such as land application of sewage, sludge and other organic material, backyard composting, mulching, recycling, resource reduction, environmental shopping, etc. 6.7.7 West Virginia Division of Energy The West Virginia Division of Energy’s Energy Efficiency Program maintains a database of commercial, community, and secondary recycling markets in West Virginia to assist the public and business sectors in finding local markets to sell or donate recyclable materials. The WVDO Energy Efficiency Office updates the database annually, and distributes it in print and on the internet at www.wvdo.org/recycling. 6.8 Funding Although West Virginia encourages private sector development in recycling, the state places a large part of the responsibility for municipal

6-14 Chapter 6: West Virginia’s Recycling Plan
solid waste management and consequently the development of recycling programs on local SWAs. For the most part, the SWA’s cover their operating cost with a monthly allotment drawn from the state’s landfill assessment fee. The average monthly SWA assessment check for FY2012 was $1,948. SWAs that have a solid waste disposal facility in their county are permitted to impose an additional $0.50 per ton assessment on every ton of waste deposited in their county. They retain the money to operate programs within the county.
SWAs are eligible for additional funding through grant programs administered by the Solid Waste Management Board, and the DEP REAP Recycling Program. Both programs are open to the SWAs, and the REAP program is open to other government entities, as well as the general public. The two programs combined usually release approximately $1.8 million each year.
Funding for both grant programs comes from the landfill assessment fees. Using tonnage based landfill assessment fees to finance recycling/environmental programs tends to be problematic because it does not provide an incentive to reduce waste at its source. For complete information on recycling grants from the SWMB and the DEP REAP programs, see Appendices A and B.

Chapter 7
Special Waste

7-1 Chapter 7: Special Waste
Chapter 7: Special Waste
7.1 Hazardous Waste Hazardous wastes have been regulated since 1976 by the Resource Conservation and Recovery Act (RCRA). RCRA is divided into 10 subtitles, A through J. The most significant of these is Subtitle C, which establishes the national hazardous waste management program, and the basic structure for the RCRA program. The regulations that define and govern management of hazardous wastes are codified in Parts 260 through 279 of Title 40 of the Code of Federal Regulations (40 CFR), “Protection of the Environment.” The main objectives to RCRA’s enactment were: 1. To make land disposal of waste safer. 2. To force the employment of new
technologies for landfill disposal. 3. To reduce the amount of waste
produced. 4. To encourage recycling and resource
recovery. 5. To maintain state responsibility for solid
waste.1 In 40CFR261, subpart D, USEPA has listed specific hazardous wastes that meet one or both of the above criteria. If a waste is not listed as hazardous, the waste is still regulated by RCRA, if it exhibits one of four characteristics: ignitability, corrosivity, reactivity, or toxicity.2 The prohibitive cost of hazardous waste transportation and disposal has been an incentive in source reduction efforts. In addition, RCRA hazardous waste reduction program has resulted in industrial source reduction through process modifications that produce less waste. 7.1.1 WV Hazardous Waste Rule, 33CSR20 W. Va. Code § 22-18 is the Hazardous Waste Management Act. The WV Department of
Environmental Protection (DEP) was designated as the lead agency for West Virginia hazardous waste management, and is also the authorized enforcement agency in the regulation of hazardous waste (W.Va. Code § 22-18-4). “Hazardous Waste Management System Rule”, 33CSR20, established and adopted a program of regulation for the generation, treatment, storage, and disposal of hazardous waste to the extent necessary for the protection of the public health and safety of the environment.
7.2 Household Hazardous Waste (HHW) The US EPA criteria for hazardous waste applies to paints, thermometers, flammables, used motor oil, carcinogenic chemicals, cleaning supplies, and other home use chemicals. However, hazardous wastes that are generated in a household are generally accepted in non-hazardous municipal solid waste landfills because Congress did not intend to cover household items in the rigid waste control mechanism of RCRA.3 Under RCRA this is known as the household exclusion, 40CFR261.4(b). 7.2.1 Household Chemicals Aerosol sprays, ammonia, batteries, bleach, cosmetics, detergents, disinfectants, solvents, cleaners and medicines are all household hazardous waste (HHW). Even minute amounts of many household chemicals can seriously harm or kill children and pets. HHW in the solid waste stream can pose health risks to sanitation workers, and hazards to the environment. Improper disposal can contaminate the air we breathe, the food we eat and the water we drink.
The average U.S. household generates more than 20 pounds of HHW per year. The average home can accumulate as much as 100 pounds of household hazardous waste in the basement or garage and in storage closets.4

7-2 Chapter 7: Special Waste
Proper disposal of HHW is an important management objective for state and local governments. Management must take place at the local level and can be extremely effective when utilizing the following tools:
1. Public education programs. 2. Telephone hotlines. 3. Exchange programs. 4. Collection programs.
Educational programs for school age children, civic groups, and the general public should be given a high priority at the local level. A hotline could be shared with another agency, such as the Health Department or the WVU Extension Service.
Collection and exchange programs are important options, but they are not long term solutions for management of HHW. The purchase of environmentally safe products should be promoted. Manufacturers and retailers should be encouraged to work cooperatively to eliminate HHW products from the market as safer products become available. Various state agencies offer brochures, audio/video materials, and other educational materials for the general public which briefly describe problems, disposal methods, and alternative products. A statewide inventory of used oil collection centers is also available from the WV Department of Commerce, Division of Energy, Energy Efficiency Program – motor oil and bulk oil collection sites: www.wvcommerce.org/directory/recycling/default.aspx. This site also provides listings for some universal waste sites. Recycling HHW and completely using existing stocks of household products should be encouraged. Choosing less toxic alternatives is the best solution to using household chemicals. For example, use soaps instead of detergents, leave vinegar in an open dish instead of using air freshener, use cedar chips for mothballs.
The Solid Waste Management Board has a webpage which lists contact information for businesses and collection sites that manage various forms of special waste available to the publ ic and business community: www.state.wv.us/swmb/admn/specialwaste. There are several ways to handle, recycle and dispose of HHW. DRAIN DISPOSAL - Products which can be poured down the drain with plenty of water. If you have a septic tank, additional caution should be exercised when dumping these items down the drain. SANITARY LANDFILL - Materials which cannot be poured down the drain, but can be safely disposed of in a sanitary landfill. Be certain the material is properly contained before it is put out for collection or carried to the landfill. If you have questions regarding a specific waste contact your waste hauler. HAZARDOUS WASTES DISPOSAL - Hazardous wastes which should be saved for a community wide collection day or given to a licensed hazardous wastes contractor. (Even the empty containers should be taken to a licensed contractor.) RECYCLABLE MATERIAL - If there is a recycling program in your area, take the materials there. If not, encourage local officials to start such a program. Often the best disposal route is to use up the product according to the directions on the label. DEP’s Division of Water and Waste Management-Emergency Response handles disposal on an as needed basis for residents. For more information on West Virginia’s efforts to recycle, or otherwise remove HHW from the waste stream, see Chapter 6, Section 4, Recycling and Marketing Restricted or Difficult to Manage Materials or visit

7-3
Chapter 7: Special Waste
7.2.2 Used Motor Oil
While hazardous waste characteristics may
apply to used oil, EPA decided not to list used
oil that is destined for recycling as a hazardous
waste. Instead they established management
standards for its collection and recycling.
USEPA estimates that in the United States
alone, 200 million gallons of used motor oil are
improperly disposed of by being dumped on the
ground, tossed in the trash (ending up in
landfills), and poured down storm sewers and
drains.5 These improper disposal methods can
have devastating effects on the environment.
For example, a gallon of used oil from a single
oil change can contaminate one million gallons
of water. One pint of used oil can create an oil
slick an acre in size. Improperly disposed oil can
reduce the productivity of soils and have toxic
effects on aquatic life, even when only present
in small concentrations. Improperly disposed oil
not only poses a serious threat to the
environment, but it also constitutes an
unnecessary waste of a renewable resource.
Used oil that is properly recycled can be:
1. Re-refined into high quality motor oil.
2. Used in the production of industrial
lubricants, transform and quench oils.
3. Used in rust prevention efforts and
synthetic rubber production.
4. Processed and burned as fuel.
In addition, less energy is required to produce a
gallon of re-refined base stock than a base stock
from crude oil.6
Obstacles in developing a used oil recycling
program include lack of public awareness,
contamination of oil to be recycled, and liability.
The public is generally unfamiliar with the effects
of improperly disposing of used oil, the
magnitude of environmental degradation caused
by mismanagement, and the benefits of used oil
recovery and recycling. To increase awareness,
an educational campaign is needed to promote
its proper disposal and recycling. Education
could also prevent the contamination of used oil
at collection sites by instructing people not to
mix solvents, or other household and automobile
fluids with oil to be recycled.
Drop-off collection centers have been
established at some gasoline stations and auto
parts stores where one can dispose of up to five
quarts of used motor oil free of charge. Some
counties have numerous sites while others have
just one or two.
7.3 Municipal Sewage Sludge Disposal
The disposal of municipal sewage sludge (MSS)
generated within WV is regulated by the DEP.
Disposal is regulated in two ways; through the
issuance of National Pollutant Discharge
Elimination System (NPDES) permits, and by
defining wastes that can be disposed of in solid
waste facilities under Section 4.13.h. of the
DEP’s Title 33 Series 1 rules. The issuance of
NPDES permits is the responsibility of the
Division of Water and Waste Management
(DWWM) of the DEP and is the primary method
of regulating MSS disposal.
When a wastewater treatment facility applies for
an NPDES permit, a certain method of MSS
disposal is chosen. Individual treatment facilities
are free to choose from a total of four
permissible disposal options. The four options
include landfilling, land application, marketing of
the sludge, or a catch-all “other” option. This
“other” option is a broad category encompassing
disposal methods not falling under the other
three categories. Regardless of the method
chosen, disposal must be approved by the
DWWM Director prior to receiving an NPDES
permit.
In 1993, Senate Bill 288 provided the necessary
authority for DEP to develop and implement a
comprehensive program for the regulation and

7-4 Chapter 7: Special Waste
management of sewage sludge. The DEP was authorized to file emergency rules dealing with municipal sewage sludge management. The rules manage all sewage sludge produced at a wastewater treatment plant and shipped to a commercial solid waste facility. 33CSR2, requires:
1. Test on the sludge for heavy metals,
pathogens, toxin and vectors. 2. Reports on the source and amount of
sludge actually generated or imported. 3. Access to the processing facility for DEP
inspection and monitoring. 4. Posting of bonds for environmental
remediation. 5. The development of reports on
municipal sewer sludge volumes and activities.7
The DEP is authorized to require permits for all facilities and activities which generate, process or dispose of sewage sludge by whatever means, including, but not limited to, land application, composting, mixed waste composting, incineration or any other method of handling sewage sludge within the state.
Water treatment facilities fall under DEP’s regulatory control similar to wastewater treatment facilities. The regulating of these facilities will be part of the comprehensive program for managing sludge. Septic tank pumping’s and package plants are permitted by DEP as part of their comprehensive sludge management program.
Landfilling of municipal sludge has been a disposal method for many years. According to DEP-DWWM monthly landfill tonnage reports, sewage sludge deposited in landfills in FY 2012 amounted to 45,875 tons. This is about 2.3% of the total waste going into WV’s landfills and includes out of state waste.
Sludge composting has occurred at the Wetzel County Landfill, according to the PSC. Composting was incorporated into the two landfill’s operating permits issued on November 25, 1992. In 2006, the PSC was directed to issue a Cease and Desist Order to the commercial composting facility. Philippi operated a sewage sludge composting facility until 2000. The facility was regulated by the DEP-DWWM and was permitted under minor modifications to their Public-Owned Treatment Works (POTW) Permit. 7.4 Agricultural Wastes Agricultural waste has been disposed of utilizing mainly land application. However, poultry producers are now being challenged to effectively utilize litter (waste). The industry is seeking ways to better capture the potential value of the litter as a fertilizer source, as a stock material for compost production, or as a feed for cattle. Other methods of disposal may have to be developed to avoid potential ground and surface water contamination. The state legislature passed House Bill 4380 in 2000 to promote the beneficial use of poultry litter by (1) allowing a tax credit for its use as an agricultural fertilizer, and (2) requiring that the use of composted or deep stacked poultry litter products be given priority by all state agencies in their land maintenance and landscaping activities. Agricultural waste problems can be caused by “farm dumps” and the disposal of chemicals, such as pesticides, herbicides, fertilizers and insecticides, used on the farm. Most of these old farm dumps are small and require a minimum effort to reclaim. Some farm dumps require pulling out the bigger solid waste items, hand picking and bagging the smaller household items and properly revegetating the area. Other farm dumps require covering the site with two feet of soil material and revegetating. These

7-5 Chapter 7: Special Waste
sites are inspected by a DEP Environmental Inspector or a DNR Conservation Officer. A program needs to be developed similar to the household hazardous waste section of this state plan. This program needs to be coordinated with representatives of each group involved with agriculture. According to DEP Industrial Solid Waste Rule, under 33CSR1, Section 2.59.a. “Animal Carcasses, Body Parts, Bedding and Related Waste” means contaminated animal carcasses, body parts, and the bedding of animals that are known to have been exposed to infectious agents during research, the production of biologicals, or the testing of pharmaceuticals, or for any other reason. The primary animal remains disposed of in landfills are livestock and poultry. The emergence of the aquiculture industry will be accompanied by an increase in the amount of fish carcasses and waste that must be disposed or composted. 7.5 Pollution Control Residuals In order to comply with USEPA guidelines, one of the wastes the plan shall consider is pollution control residuals. Only air pollution control residuals will be discussed here, since other types of residuals (e.g. sludge) have been discussed in other sections of this plan. The operation of thermal systems in power plants, foundries, etc., produces several impacts on the environment including gaseous and particulate emissions, solid residues and liquid effluents. The proper design of control systems for these emissions is a critical part of the design of a thermal processing system. End products of the thermal process include hot combustion gases composed primarily of nitrogen, carbon dioxide, water vapor (flue gas) and noncombustible residue (ash). Energy can be recovered by heat exchange from the hot combustion gases.8
The handling of air pollution control residuals is regulated by the DEP Division of Air Quality (DAQ), while the disposal of the residuals is regulated by the DEP Division of Water and Waste Management. The DAQ requires control equipment to minimize emissions to meet the Federal Clean Air Act.9 The major producers of air pollution control residuals are electric power generation plants, coal producers, foundries, chemical plants and cement kilns. Any facility that uses coal as a fuel produces an ash. The ash is either classified as fly ash or bottom ash. Fly ash is the lighter of the two and exits the combustion chamber in the flue gas stream. Fly ash is generally collected by electrostatic precipitators or bag-houses. The bottom ash is heavier than fly ash and falls to the bottom of the combustion-chamber, where it is collected and removed.10 According to DAQ officials, all state coal producers and cement kilns have their own landfills or refuse piles. Some chemical plants have their own landfills. The cost of on-site ash disposal is roughly equivalent to that of a municipal solid waste landfill.
Some residuals can be reused to keep disposal costs down. The dust from cement or asphalt production is used again in-house. Refuse from coal mining is returned to mine areas as a backfill. The sludge from scrubbers at chemical and/or manufacturing facilities are used on-site or shipped to hazardous waste sites by the chemical company or a contracted handler/hauler. Most hazardous wastes from pollution control residuals are sent to out-of-state facilities primarily in Ohio, South Carolina, and Alabama. The small amount of ash generated from medical incinerators and veterinarians is considered a hazardous waste and also transported out-of-state.11
New ways are being found to recycle residual waste. American Electric Power’s Kammer-Mitchell coal fired power plant in Marshall

7-6 Chapter 7: Special Waste
County uses a process for removing sulfur from coal residuals that produces a byproduct called calcium sulfite. Calcium sulfate is suitable for use as synthetic gypsum. Thanks to efforts from several state agencies including the West Virginia Department of Commerce, a CertainTeed wallboard plant was constructed next door to Kammer-Mitchel and produces it’s LEED certified ProRoc brand gypsum board, used in residential and commercial interior walls, from synthetic gypsum. Kammer-Mitchell produces over 600,000 tons of this waste product annually and most of it now goes to the gypsum plant for reuse. 7.6 Mining Wastes West Virginia is the second leading producer of coal in the U.S. Two types of mining exist within the state: underground and surface mines. Although the ways of extracting the coal differ greatly, the waste or “refuse” generated is the same. In both cases, only the seam of coal is removed. However, this seam contains unusable refuse along with the coal. The refuse is transferred to a preparation plant, where the usable coal is screened out. The rest of the refuse is disposed of on site in a coal refuse pile, also known as a gob pile. The DEP’s Division of Mining and Reclamation (DMR) promulgates all of the rules on refuse piles such as diversions, underdrains, and compaction requirements. The refuse is compacted on-site in order to maximize space and to compress water from the pile. Drains are installed for water that might infiltrate the pile and this water is treated if necessary. For refuse with high water content and no means to extract it, large impoundments are needed to filter the refuse down through the pond. After a variable length of time, the impoundment is drained and the compacted refuse remains. The DMR has stringent regulations for impoundments as well as dry refuse piles.
The mining operation sends the usable coal to the power plants. Ash is generated by the power plant when coal is burned. The power plant is responsible for separating the coal from the ash and for disposing of the unused portion. The power plant stockpiles it on-site with alternating layers of three feet of ash and six inches of dirt. In addition to the wastes generated through the mining processes, waste is produced through the mining offices and discarded machinery. Office waste is picked up and transported to a sanitary landfill and the discarded machinery may accumulate on-site during the operation, but is not permitted to remain afterward. The goals of the DMR as stated in the rules on mine refuse include the following:
1. Minimize adverse effects of leachate and surface-water runoff on surface and ground water quality and quantity.
2. Ensure mass stability and prevent mass movement during and after all phases of construction.
3. Ensure that the final disposal facility is sui table for rec lamat ion and revegetation compatible with the natural surroundings and the approved post-mining land use.
4. Not create a public hazard. 5. Prevent combustion.12
7.7 Industrial Wastes The management and disposal of industrial solid waste is authorized pursuant to W.Va. Code §22-15. According to DEP Solid Waste Rules, 33CSR1 Section 2.57, an industrial solid waste means any solid waste generated by manufacturing, or industrial processes that is not a hazardous waste regulated under subtitle “C” of RCRA. Such wastes may include, but are not limited to, waste resulting from factories, processing plants, refineries, fertilizer/ agricultural chemicals; food and related

7-7 Chapter 7: Special Waste
products/by-products; inorganic chemicals; iron and steel manufacturing; leather and leather products; nonferrous metals, manufacturing/ foundries; organic chemicals; slaughter houses, mills, tanneries, electric power generating plants, mines, or mineral processing operations; plastics and resins manufacturing; pulp and paper industry; rubber and miscellaneous plastic products; textile manufacturing; transportation equipment; and water treatment. This term does not include nonhazardous mining waste or oil and gas waste. Some exceptions would be lunchroom or cafeteria wastes, office wastes, etc. Only those wastes generated as a by-product of an industrial process meet the intention of the definition. Waste resulting from physical, chemical or thermal processes in an industrial setting are examples of industrial waste. Industrial waste is either disposed of at on-site landfills or transported to other solid waste facilities. The major producers of industrial wastes are mining operations (coal refuse) and coal fired electricity generators (fly ash and bottom ash). The handling of industrial waste varies depending on the type of waste. The majority of industrial wastes are disposed of in landfills. According to DEP Rule 33CSR1 Section 2.58, an industrial solid waste landfill means any solid waste disposal facility which is owned, operated, or leased by an industrial establishment for the land disposal of industrial solid waste created by that person or such person and other persons on a cost-sharing or non-profit basis. The term “industrial solid waste landfill” does not include land application units, surface impoundments, or injection wells. Industrial wastes are regulated by DEP-DWWM. Various types of industrial waste can, by special permit, be disposed of in municipal solid waste landfills. A total of 80,133 tons of industrial waste was disposed of in West Virginia MSW landfills in FY2010. This, however, is only a portion of the industrial waste generated in West Virginia in one year as most industrial waste
goes to Class F industrial disposal facilities. For a complete discussion of special waste in the state’s municipal landfills, see Chapter 4, section 4.2 of this document. Some industrial wastes which contain contaminants at levels greater than regulatory levels for hazardous waste are exempted from regulation under RCRA Subtitle C requirements and may be landfilled, e.g. chromium from tanneries and creosote from wood treatment plants. For exemptions and exceptions, refer to 40CFR1 Part 261 of the USEPA Regulations. 7.8 White Goods (Household Appliances) The term “household appliances” - often called “white goods” - usually includes large items such as refrigerators, freezers, clothes washers, dryers, dishwashers, ranges, water heaters, microwave ovens, dehumidifiers, trash compactors, and air conditioners. There are many problems in the collection and recycling of white goods. The major factor is transportation to a recycler or landfill. Environmental legislation requires 80% to 90% of all PCB’s, CFC or HCFC coolant be recovered with certified equipment by a certified technician. A provision in the EPA - Stratospheric Ozone Protection - Final Rule Summary (EPA-430-F-93-010) dated June, 1993, under the section “Mandatory Technician Certification,” states: “Persons removing refrigerant from small appliances and motor vehicle air conditioners for purposes of disposal to these appliances do not have to be certified.” In another section of this summary, “Safe Disposal Requirements,” it states “technician certification is not required for individuals removing refrigerant from appliances in the waste stream.” There is still a requirement that the equipment must be certified that it has been tested by an EPA approved testing organization. This is part of the 1990 re-authorization of the Clean Air Act which is designed to protect the atmosphere. SWAs should contract with

7-8 Chapter 7: Special Waste
authorized organizations to provide this service at a free or reduced cost. 7.9 Bulky Goods Collection The term “bulky goods” refers to those items of residential solid waste which are too large and/or otherwise inappropriate to be placed into suitable waterproof containers. It includes such items as furniture, large appliances, electronics and other household-generated materials which cannot reasonably be collected during regularly scheduled weekly waste collections. In accordance with 150CSR9, the Public Service Commission requires all common carriers of solid waste in West Virginia to establish a regularly scheduled monthly bulky goods collection service to be made available to all residential households in the carrier’s territory, effective January 1, 1999. To recover additional costs associated with the implementation of bulky goods collection service, any such carrier may apply to the PSC for approval of surcharges to be applied to both regular residential customers and all others in the territory that request bulky goods service. A carrier may propose a surcharge of one dollar per residential customer per month and not file the information required by Rule 42 of the Commission’s tariff rule. Proposed surcharges in excess of one dollar must include Rule 42 information. The carrier will be required to submit periodic reports detailing revenues collected from implementation of the service paid by subscribers and non-subscribers, respectively. In addition, tons of materials collected, disposed of and cost incurred to provide this service, (e.g. additional labor, fuel, landfill, equipment costs) must also be reported. In Chapter 4, Table 4-2 indicates bulky goods that are accepted at solid waste landfills around the state.
7.10 Tires Waste tire disposal has become a significant problem in the state due, in part, to regulatory controls. In accordance with W.Va. Code § 20-11-8(a), now W.Va. Code § 22-15a, waste tires were banned from municipal solid waste landfills effective June 1, 1996. In addition, state and federal air quality regulations prohibit the open burning of waste tires. Together, these regulations contributed to an increase in the number of waste tire piles, or “open tire dumps”, around the state. A 1998 report, completed by the SWMB and DEP-DWWM, revealed there were approximately six million waste tires in seventeen of the largest piles which range in size from as few as 5,500 tires, to as many as 2 million.13 Waste tires are bulky, do not decompose and endanger the public health and well-being as they become breeding grounds for rats and mosquitoes. The tire piles also constitute significant fire and pollution hazards. In 2000, the WV Legislature passed Senate Bill 427 in order to address the concerns over waste tire piles. The legislation prohibits salvage yards from accumulating more than 100 waste tires without a proper permit. It also created a new fund called the “A. James Manchin Fund” which is funded by a temporary tax of $5.00 on the issuance of motor vehicle titles. The Division of Highways was given the authority to administer the fund and oversee the remediation of the waste tire piles. Only tires collected as part of a DOH cleanup project or a DEP “Pollution Prevention and Open Dump” program, and for which no markets are available, may be deposited in solid waste facilities. In 2002, the WV Legislature passed Senate Bill 609 making it a felony to accumulate or dispose of 1000 or more tires illegally. A person convicted of this crime is subject to one to five years in jail and fines of up to $50,000 per day. The convicted person will also be required to

7-9 Chapter 7: Special Waste
properly clean up the site or reimburse the state for cleanup cost. Waste tires can legally be disposed of in waste tire monofills. Waste tire monofills are approved solid waste facilities in which waste tires are not mixed with any other waste for the purpose of eventual retrieval for marketing. Currently, there are three waste tire monofills in West Virginia. Recycling is another method of disposal. However, the use of recycled rubber is contingent upon the establishment of a collection and marketing system which will assure that waste tires are collected, transported, and processed for use by industry. New and established recycling technology should be identified and encouraged to create more market demand for recycled tire products. The involvement of private sector business to implement these processes should also be encouraged. Additional information may be found in the SWMB publication, Program for the Proper Handling of Waste Tires in West Virginia. http://www.state.wv.us/swmb/Admn/TIREFINA.pdf In August 2003, the Public Service Commission (PSC) approved changes to 150CSR9, of which several sections addressed the problem of residential tire disposal. The definition of “Bulky Goods” has been rewritten to include “waste tires off the rim, having a radius of no more than 16.5 inches, from automobiles, pickup trucks, motorcycles, all-terrain vehicles and from farm tractors.” The changes also require carriers to pick up a maximum of eight tires per year from each residential customer. To cover the costs associated with the service, an additional 50 cents per month will be charged to regular customers for hauling service, and 50 cents per tire plus landfill disposal costs for non-subscribers.14
During the 2005 legislative session, W. Va. Code § 22-15A-9 established that the Commissioner of the Division of Highways shall work with and may use moneys in the Fund to contract with the Secretary of the DEP to accomplish the remediation of waste tire piles. The Fund consists of the proceeds from the sale of waste tires, fees collected by the Division of Motor Vehicles, and any other funding source available for waste tire remediation. Any unused balance remaining in the Fund at the end of the fiscal year is transferred to the State Road Fund. In addition, W. Va. Code § 22-15A-10 gave the Secretary the authority to establish a tire disposal program within the DEP to provide for a cost effective and efficient method to accept passenger car and light truck waste tires at locations designated by the DEP. The Secretary may pay a fee for each tire and may also establish a limit on the number of tires an individual or business may be paid for during any calendar month. In response to SB 427, the DOH promulgated an emergency rule entitled “Waste Tire Remediation/ Environmental Clean Up” which became effective August 25, 2000. The new rule, 157CSR8, intends to eliminate the present danger resulting from discarded and abandoned waste tires, eliminate visual pollution resulting from the tires, and provide for the public health, safety, and welfare. Under this rule, the DOH identified waste tire piles, used a ranking system to prioritize their cleanup, and is currently administering remediation efforts. This rule also designated liability for the cleanup costs to any person who has illegally disposed of waste tires and any person who has waste tire piles on their property. Additional guidelines for rights of entry, remediation monitoring, hauling, notices, liens and records are established under this rule which can be found in 157CSR8.

7-10
Chapter 7: Special Waste
7.11 Lead Acid Batteries
Landfill disposal of lead acid batteries has been
banned since June 1, 1994. Most lead acid
batteries are collected at local automotive
service or repair garages. Some of these are
collected through local household hazardous-
waste collection programs operated by local
governments. Overall, the collection and
recycling efforts for lead acid based batteries
tends to be successful because collection and
recycling programs operated by automotive
garages and repair centers serve as a
centralized collection point with very little
inconvenience to the consumer. According to
the US EPA, approximately 97% of all lead acid
batteries are recycled. Ultimately, the primary
motivation for the recovery of automotive
batteries is the profit from the sale of lead.
Additional information may be found in the
SWMB publication, Program for Handling Lead
Ac id Bat te r ies in Wes t V i r g in ia .
7.12 Yard Waste
Yard waste is defined as grass clippings, weeds,
leaves, brush, garden waste, shrub or tree
prunings, and other living or dead plant tissues.
US EPA estimates that approximately 13% of
the total U.S. waste stream is composed of yard
waste.15
Since these organic materials are
relatively clean and biodegradable, disposal in
landfills is unnecessary and wastes space. For
these reasons, yard waste has been banned
from landfills in West Virginia since January 1,
1997.
Composting of yard waste is an attractive
disposal option for many communities who wish
to recycle plant nutrients, save landfill space,
and comply with WV laws prohibiting landfill
disposal. There are currently 4 composting
facilities permitted and 20 composting activities
facilities registered with the WV DEP. Rules
governing the permitting, design and
construction, and closure plans of composting
facilities can be found in 33CSR3.
Drop-off sites will be used to a greater extent if
they are well advertised. Leaflets or newspaper
advertisements with a map and the hours the
site is open will enhance public awareness of
the new program. Residents of small
communities may also be encouraged to empty
their own yard waste and save the bags for
reuse.
New collection methods and schedules will run
more smoothly if residents are well informed and
schedules are uniformly followed. Newspaper
articles, television and radio spots, and
neighborhood promotion prior to collection days
will increase the level of compliance. If special
bags must be purchased for yard waste, this fact
should be advertised along with the purchase
locations. Additional information may be found in
the SWMB publication, Program for Handling
Yard was te in Wes t V i rg in ia .
7.13 Universal Wastes
In 1995, USEPA promulgated the “Universal
Waste Rule” as an amendment to the Resource
Conservation and Recovery Act (RCRA)
governing hazardous waste. While universal
wastes are hazardous wastes, the Universal
Waste Rule was designed to reduce the amount
of RCRA hazardous waste disposed of in
municipal waste landfills, encourage recycling
and proper management of some common
hazardous wastes, and reduce the regulatory
burden on businesses currently managing these
materials as hazardous waste. The rule extends
the amount of time that businesses can
accumulate these materials on-site, allows for
common carriers to transport them, and no
longer requires businesses to obtain a
hazardous waste manifest to accompany the
wastes during off-site shipment.

7-11 Chapter 7: Special Waste
“Universal wastes” include the following general categories:
Batteries, such as nickel-cadmium and small sealed lead-acid batteries, which are found in many household and business items, including electronic equipment, mobile telephones, portable computers and emergency backup lighting.
Agricultural pesticides that have been recalled or banned from use, are obsolete, have become damaged or are no longer needed due to changes in cropping patterns or other factors. They are often stored for long periods of time in sheds or barns.
Lamps, (effective January 6, 2000), that typically contain mercury and sometimes lead, such as fluorescent, high intensity discharge, neon, mercury vapor, high-pressure sodium and metal halide lamps, if they are characteristically hazardous.
Thermostats, which can contain as much as 3 grams of liquid mercury and
are located in almost any building, including commercial, industrial, agricultural, community and household buildings. On August 5, 2005, thermostats were added to a new category of universal waste called spent mercury containing equipment (MCE). Other such MCE’s are thermometers, switches, barometers and manometers. Basically MCE’s were to include all mercury containing devices.
The EPA issued a ruling in July of 2006 (effective date, January 29, 2007), which excludes CRTs and glass removed from CRTs from the RCRA definition of solid waste if certain conditions are met.
States that are authorized to implement the RCRA program are strongly encouraged to adopt this rule. Because the Universal Waste Rule is less stringent than the current requirements under RCRA, state adoption is optional. West Virginia has adopted the Universal Waste Rule (33CSR20.13).

7-12
Chapter 7: Special Waste
END NOTES FOR SECTION 7
1. Percival, Robert V., Miller, Alan S., Schroeder, Christopher H., and Leape, James P.
Environmental Regulation: Law, Science and Policy, second edition. Aspen Law and Business,
1996. p. 209-213.
2. Title 40, Code of Federal Regulations, Chapter 1, Subchapter I, Part 260, Identification and
Listing of Hazardous Waste.
3. O’Reilly, James T., State and Local Government Solid Waste Management, Clark, Boardman
Callaghan, p. 3-39.
4. EPA website http://www.epa.gov/wastes/conserve/materials/pubs/manual/r92026.pdf
5. Collecting Used Oil for Recycling/Reuse: Tips for Consumers Who Change Their Own Motor Oil
and Oil Filters, U.S. Environmental Protection Agency, EPA 530-F-94-008.
6. Title 47 Series 10, National Pollutant Discharge Elimination System (NPDES) program, West
Virginia Department of Environmental Protection.
7. Title 33 Series 2, Sewage Sludge Management.
8. Tchobanoglous, George, Theisen, Hilary, and Vigil, Samuel, Integrated Solid Waste
Management, McGraw-Hill, Inc.
9. Personal Communication with Paul Radar, DEP Division of Air Quality.
10. Fly Ash Grouts for Remediation of Acid Mine Drainage at Reclaimed Surface Mines. Thesis by
Kevin L. Harshberger, School of Civil Engineering, WVU, p. 24.
11. Personal Communication with Paul Radar, DEP Division of Air Quality.
12. DEP Division of Mining and Reclamation, 38CSR2.
13. Proposal for Scrap Tire Collection and Disposal, West Virginia Solid Waste Management Board.
14. Personal Communication with Bill Flenner for information used in January 2004 “Under the
Dome” published by the Solid Waste Management Board.
15. Basic Facts Page. USEPA.

Chapter 8
Solid Waste Disposal Fees

8-1 Chapter 8: Solid Waste Disposal Fees
Chapter 8: Solid Waste Disposal Fees 8.1 Assessment Fees The state has imposed assessment fees on the disposal of solid waste as a mechanism to fund solid waste management programs. These fees are collected on a rate per ton basis by the solid waste disposal facility and are remitted to the Department of Tax and Revenue monthly. The Auditor’s Office and the Department of Tax and Revenue have jointly developed a system which deposits the dollars directly into the appropriate funds. The $8.25 assessment fee is distributed among three separate agencies, Department of Environmental Protection (DEP), Division of Natural Resources (DNR) and the Solid Waste Management Board (SWMB). The Solid Waste Assessment Fee (DEP) - provides funding for the Solid Waste Reclamation and Environmental Response Fund, Solid Waste Enforcement Fund and the Solid Waste Management Board Reserve Fund, for bond reserve. Solid Waste Assessment Interim Fee – (SWMB Solid Waste Planning Fund) provides funding for
grants and monthly operations for the 50 local solid waste authorities (SWAs) and SWMB administration costs and grants. The Recycling Assessment Fee funds the DEP’s REAP Recycling Assistance Program, Solid Waste Reclamation and Environmental Response Fund, Hazardous Waste Emergency Response Fund, a portion of DNR’s Conservation Officer’s salaries, and local solid waste authority assistance. Closure Cost Assessment Fee (DEP), is primarily used for expenses associated with proper landfill closure. “Commercial Recyclers” may receive a special exemption, resulting in a $2.00 Recycling Fee. To receive the exemption Commercial Recyclers must have DEP certification that 70% of the waste received at the disposal facility is recycled. The remaining 30% being disposed of at a landfill will be assessed $2.00 per ton. This section describes the fees the state collects and distributes to environmental agencies and programs. Table 8-1 represents the distribution of fees effective since July 1, 2005.

8-2 Chapter 8: Solid Waste Disposal Fees
TABLE 8-1 Dedication Of Proceeds Of The Solid Waste Assessment Fees (Revised July 1, 2005) Rates Per Ton $1.75 1. SOLID WASTE ASSESSMENT FEE - DEP W. Va. Code § 22-15-11 Effective 1-1-88, Revised 7-9-93, Revised 7-1-98*
A. $0.25 per ton for Solid Waste Reclamation and Environmental Response Fund.
B. First $1,000,000 for Solid Waste Enforcement Fund. C. Next $50,000 to $500,000 to Solid Waste Management Board Reserve Fund - For Bond Reserve. D. Remaining funds shall be allocated to the above three accounts to
maintain reasonable balances. $1.00 2. SOLID WASTE ASSESSMENT INTERIM FEE - SWMB Solid Waste Planning Fund W. Va. Code § 22C-4-30 Effective 7-1-89, Revised 7-9-93, Revised 7-1-98* A. $0.50 per ton is distributed equally among all 50 local solid waste
authorities on a monthly basis. B. $0.50 per ton divided equally for grants to local solid waste authorities
and administration and technical assistance costs of the SWMB. *The language of W.Va. Code § 22-15-11 did not change, however, portions of Senate Bill 602, incorporated into W. Va. Code § 22-16-4(h)(1), provided that the DEP may transfer up to fifty-cents per ton from the Closure Cost Assessment Fee into the Solid Waste Enforcement Fund. $2.00 3. RECYCLING ASSESSMENT FEE W. Va. Code § 22-15A-19(h)(1)** Effective 1-1-92, Revised 7-9-93, Revised 7-1-98, Revised 7-1-05 A. $1.00 per ton to DEP’s REAP Recycling Program for grants to assist with
recycling project for local governments, municipalities, non-profits, county commissions and private businesses.
B. $0.25 per ton to DNR for personal services and benefit expenses of full-
time salaried conservation officers.
C. $0.25 per ton to the Solid Waste Planning Fund. Fifty percent (50%) to be distributed to the local SWAs and the remaining fifty percent (50%) to

8-3 Chapter 8: Solid Waste Disposal Fees
provide the local SWAs with the Business and Financial Assistance Program. Prior to July 1, 1998, this $0.25 per ton went to WVDO, to assist counties and municipalities with wastewater treatment projects.
D. $0.25 per ton to DEP’s Solid Waste Reclamation Fund and
Environmental Response Fund (PPOD). Same fund as 1A on page 8-2. E. $0.25 per ton to DEP’s Hazardous Waste Emergency Response Fund.
**Senate Bill 428 was passed and enacted on July 1, 2005, which removed the Environmental Resources Section from the Division of Natural Resources to create the Rehabilitation and Environmental Action Plan under the Department of Environmental Protection. With this transfer, W. Va. Code § 20-11 was repealed and language was amended and moved to W. Va. Code § 22-15A-19. $3.50 4. CLOSURE COST ASSESSMENT FEE - DEP W. Va. Code § 22-16-4 Effective 1-1-92, Revised 7-9-93, Revised 7-1-98 A. All money for the Closure Cost Assistance Fund for proper landfill
closure. B. $0.50 per ton on collections on or after July 1, 1998, may be transferred
to the Solid Waste Enforcement Fund per W. Va. Code § 22-16-4. C. For any landfills taking in more than 30,000 tons per month, 50% of the
fees collected in excess of the 30,000 TPM shall be remitted to the county commission in the county where the landfill is located. Not currently applicable.
$8.25 TOTAL REQUIRED FEES PER TON W.Va. Code §7-5-22 allows local solid waste authorities to impose a $0.50 per ton assessment fee on waste deposited in commercial solid waste facilities in their respective counties, in addition to the $8.25 per ton fee dedicated to environmental programs. Section 8.3.1 of this plan gives more details on the optional County Solid Waste Assessment Fee.
8.2 Allocation and Use of Assessment Fee Funds The following graphs labeled Figure 8-1 and Figure 8-2 depict the allocation and use of funds by Agency as well as Program. The graphs reflect the change in rates, as a result of redistribution of funds mandated in Senate Bill 602, which was subsequently incorporated into W. Va. Code § 22-15A-19, and the rates were effective as of July 1, 1998.

8-4 Chapter 8
Figure 8-Solid Wa
Figure 8-Solid Wa
DE
: Solid Waste
1 ste Assessm
2 ste Assessm
DNR
DNR COffi
EP LCAP Progra$3.50
e Disposal Fe
ment Fees Di
ment Fees Di
R $0.25
SWM
Solid Waste
Conservation cers $0.25
am
Solid Wa
es
stributed by
stributed by
MB $1.25
e Assessmen
SWMB GrantAdministrat
$0.62
aste Assessm
Agency
Program
nt Fees Distr
ts & ion SWMB
SWA
ment Fees Di
ributed by A
B to Local As $0.63
istributed by
DEP $6.7
Agency
DEP RecyclingGrants $1.00
DEP HazFund
DEP P
DEP EnfoPermittin
y Program
75
g
zWaste $0.25
PPOD Program $0.50
orcement, ng $1.50

8-5 Chapter 8: Solid Waste Disposal Fees
8.2.1 Fee Distribution by Program Table 8-2 reflects the actual dollars generated and distributed by Agency and Program for FY 2010 through FY 2012. Program amounts reflect actual dollars received by the agencies during the fiscal year noted. There is a two-month delay from the time the landfill collects the tonnage fees to the time the agency actually
receives the funds. For example, landfills collect fees on tonnage disposed during the month of July. By August 15, they will report tons collected and remit fees collected to the Department of Tax and Revenue. By September 15, the Tax Department has the fees tallied, and the funds can be transferred to the various agencies and programs.
Table 8-2 Solid Waste Assessment Fee Distribution by Program (FY 2010-2012)
2010 – 2012 Assessment Fee Distribution by Program
Fee Per
Ton *FY 2010 *FY 2011 *FY 2012
DEPARTMENT OF ENVIRONMENTAL PROTECTION
Reclamation, Environmental Response $0.50 $886,624 $969,805 $1,035,016
Solid Waste Enforcement Fund $1.50 $2,612,005 $2,861,436 $3,071,774
Closure Fund $3.50 $6,094,693 $6,676,699 $7,167,490
Hazardous Waste Emergency Response $0.25 $451,289 $492,899 $523,053
Recycling Grant Fund $1.00 $1,805,158 $1,971,595 $2,092,213
$6.75 $11,849,769 $12,972,433 $13,889,546
DIVISION OF NATURAL RESOURCES
Conservation Officers $0.25 $451,289 $492,899 $523,053
$0.25 $451,289 $492,899 $523,053
SOLID WASTE MANAGEMENT BOARD
SWMB Grants and Administration $0.62 $1,096,310 $1,200,261 $1,285,451
Local Solid Waste Authorities $0.63 $1,096,316 $1,200,261 $1,285,451
$1.25 $2,192,626 $2,400,522 $2,570,902
Totals $8.25 $14,493,684 $15,865,854 $16,983,501
Source: Office of State Auditor, Solid Waste Tax Special Fund Distribution, Validated Receipts, Monthly Reports, FYs 2010-2012. *Dollar amounts may vary from actual payments due to rounding.

8-6 Chapter 8
Figure 8-Solid Wa
8.3 Misc 8.3.1 Cou W.Va. CoAuthoritiefacilities oon all soThese feelocal SWcollected administrarefuse cleother solito fulfill idisposal f 8.3.2 Gro The Groinvoiced Waste MaCode § assess fHowever,
$1
$2
$3
$4
$5
$6
$7
$8
Ass
essm
ent
Fee
s C
oll
ecte
d
: Solid Waste
3 ste Assessm
cellaneous A
unty Solid W
ode § 7-5-22 s to assesoperating witholid waste aes are remitte
WAs to pay are to be
ation and eeanup, litter d waste progts duties. O
facilities can c
oundwater P
undwater Prby the DEPanagement in22-12-9 sin
fees based fees may als
$0
,000,000
,000,000
,000,000
,000,000
,000,000
,000,000
,000,000
,000,000
e Disposal Fe
ment Distribu
Assessment F
Waste Assess
allows local ss solid wahin their couaccepted by ed monthly doperating capplied to t
expenses incontrol progrgrams deemeOnly those ccollect this fee
rotection Ac
rotection Fee’s Division on accordancece July 199on reporte
so be assesse
FY 2010
es
ution
Fees
sment Fee
Solid Wasteste disposanty $0.50/tonthat facility
directly to thecosts. Feesthe costs of
ncurred fromrams, or anyed necessarycounties withe.
ct Fee – DEP
e has beenof Water ande with W.Va92. Facilitiesd tonnagesed from other
FY 2011
Solid Wast
e l
n .
e s f
m y y h
n d . s . r
facilito poadminspegrou 8.4 8.4.1 The per reneLitteCodemainFY 2$1,5expe$2,4expeApprprogwithi
FY 201
e Assessm
ities and/or aollute groundwinistration, ection, monito
undwater prote
Litter Contr
1 Highway L
Division of each certific
ewals. That fer Control Fue §17A-10-1ntenance of th2011 and FY
585,878 respenditures in 427,997 andenditures werropriation in
grams are typin the Division
12
ent Distribu
Re
So
Co
Ha
Re
Co
SW
Lo
activities that water. These
certificationoring, planninection.
rol Programs
Litter Control
Motor Vehiccate of regisee is transferrund in accord5 to be usehe highways.Y 2012 werepectively. FY 2011 an $2,967,740
re funded fromthe State Ro
pically fundedn of Highways
ution
eclamation, Envir
olid Waste Enforc
olsure Fund
azardous Waste
ecycling Grant Fu
onservation Offic
WMB Grants and
ocal Solid Waste
have the pote fees are usn, enforceng and resea
s
l Fund1
cles collects stration, newred to the Higdance with W
ed for litter c Fees collece $1,911,762However, a
nd FY 20120. The em the Maintenoad Fund. T as “Litter Cos.
ronmental Respo
cement Fund
Emergency Resp
und
cers
d Administration
Authorities
tential ed for
ement, rch of
$1.00 w and ghway W.Va. control cted in 2 and annual
were xcess nance These ontrol”
onse
ponse

8-7 Chapter 8: Solid Waste Disposal Fees
Transfer to Department of Environmental Protection (DEP) – The Division of Highways transfers approximately $500,000 annually to the Department of Environmental Protection to be used for administrative costs, educational materials, and promotional materials for the West Virginia Adopt-A-Highway Program, Wildflower Program and the District Coordinators’ Educational Program. Litter Pickup and Disposal – The purpose of this program is to pick up litter from along the roadways, medians and rights-of-way to improve appearance, prevent ditch and head wall blockages, fire hazards and eliminate safety and health hazards. Litter pickup is performed by the Division of Highways staff. Expenditures in FY 2011 totaled $1,438,558 and expenditures in FY 2012 totaled $1,947,928. Litter Disposal/Support (Non-DOH Forces) – This program covers all the administrative support expenses and the actual disposal of collected litter for other programs/groups such as:
Governor’s Summer Youth Program.
Department of Corrections Work Release.
Community Worker’s Employment Programs.
Activities are performed upon notification or as required by the Division in any of these programs. Disposal site fees for non-DOH collected litter is charged to this program. Expenditures totaled $489,439 in FY 2011 and expenditures totaled $519,812 in FY 2012. 8.4.2 Department of Environmental Protection The Litter Control Grant Program and the Litter Control Fund, originally established under W.Va. Code § 20-7-25 and W.Va. Code § 20-7-26, was transferred from the DNR to the DEP as a result of Senate Bill 428 in July of 2005. With the creation of W. Va. Code § 22-15A-3 and W.Va.
Code § 22-15A-4 the additional duties of overseeing these programs were transferred to the Secretary of the Department of Environmental Protection. All money collected from civil penalties imposed on those found guilty of a litter violation are split evenly between the Litter Control Fund and the county or regional solid waste authority in which the violation occurred. At least 50% of monies collected in the Litter Control Fund must be awarded in the form of Litter Control Grants. This grant program is available to county commissions, local solid waste authorities, and municipalities for the purpose of establishing litter control projects, cleanup projects, or other environmental projects. Litter Control Grants awarded from litter control fines for FY 2011-2013 were $59,371, $57,241 and $60,528, respectively. In October 2007, Governor Joe Manchin III signed an Executive Order creating a permanent work crew cleanup program to help keep West Virginia’s roads and waterways clean. Under this program, the Regional Jail and Correctional Facility Authority, Division of Corrections, Division of Highways, and the Department of Environmental Protection can enter into interagency agreements authorizing inmate participation in work crews to assist in cleanup efforts and litter eradication within the state. 8.4.3 A. James Manchin Fund Effective July 1, 2000, the Division of Highways began receiving $5.00 for each application for certificate of title and renewals. This fee is transferred to the A. James Manchin Fund, established by the Division of Highways in accordance with W.Va. Code §17A-10-16. Those funds are to be used for the remediation of waste tire piles in the state. This fee will continue until the Secretary of the Department of Environmental Protection certifies to the Governor and the Legislature that they

8-8 Chapter 8: Solid Waste Disposal Fees
have completed the remediation of all waste tire piles that were determined by the Commissioner to exist on the first day of June, two thousand six. As of June 30, 2012, the program had collected $39,043,402, expended $17,725,804
to eliminate tire piles, conducted yearly tire collection programs, and transferred $19,290,742 to the State Road Fund, as allowed by statute.2
END NOTES FOR CHAPTER 8 1. Email from David Davidson, WV Department of Transportation, Budget Division, November 2012. 2. Ibid.

Chapter 9
Economic Impact of Municipal Solid Waste Management in West Virginia

9-1 Chapter 9: Economic Impact of Municipal Solid Waste Management in West Virginia
Chapter 9: Economic Impact of Municipal Solid Waste Management in West Virginia
9.1 Executive Summary Workforce West Virginia and the U.S. Census Bureau have compiled statistics showing some of the economic benefits West Virginia realizes from solid waste management activities:
Solid waste collectors, recycling centers, and landfills in West Virginia paid an estimated $73.6 million dollars in wages and salaries in 2011.
These businesses maintained 2,078 jobs with average weekly salaries ranging from $642 to $750; compared to an average weekly salary in the retail trades of $456.
For the year 2010, various WV governmental entities, including municipal, county, and state, employed at least 754 workers in their waste management activities with an annual payroll of $21,462,300.
In 2011, the state’s public and private waste management infrastructure consisted of 18 landfills, 3 tire monofills, 18 transfer stations, and 24 composting facilities, all fully operational and approved through the West Virginia Department of Environmental Protection. In addition, the state has at least 92 recycling centers1, many of which have one or more remote collection sites.
The states’ 50 local solid waste authorities own, operate, and/or sponsor recycling programs in 42 counties. These programs recycled 37,437 tons of
material, and brought in over $3.4 million dollars in recycling revenue during CY 2011. An estimated 75,000 cubic yards of landfill airspace has been saved by diverting these materials from landfills in the year specified.2
According to the US Department of Commerce, the state’s recycling and scrap industry exported $24,763,418 worth of recyclable materials in 2011.
9.2 Jobs3
In 2011 West Virginia landfills employed approximately 313 people, paying an average weekly wage of $750, with an annual wage and salary payout for the sector of $12,205,718. Positions include equipment operators, laborers, engineers, managers, mechanics, bookkeepers, accountants, clerical, office workers, scale operators, and others. The state’s waste haulers employ at least 732 people with an annual payroll of $26,917,009. The average weekly salary per employee is $707. The majority of employees have positions as drivers or laborers, however, also included are clerical, office workers, mechanics, accountants, bookkeepers, and managers. West Virginia’s recycling centers have approximately 1,033 employees with an annual payroll of $34,506,155. These centers pay an average weekly salary of $642. Employees include material collectors and processors, drivers, clerical and office workers, managers, and recycling coordinators.

9-2 Chapter 9
Table 9-1Employm
Recyclin
Waste H
Landfills
Total/Av
While wagare not sectors, s
Figure 9-2011 Ave
9.3 Direct MunicipalVirginia hstate. Tstations, wexcess of2011, crerevenue significant
9: Economic Im
ment Data: 20
ng Centers
Haulers
verage
ges and salarcomparable
such as minin
1 erage Annual
t Impact
solid wastehas a measurThe state’s rewaste haulerf $73,628,88ating an estimgenerated
t. Based on
$0
$5,000
$10,000
$15,000
$20,000
$25,000
$30,000
$35,000
$40,000
R
mpact of Mun
011 West Virg
Number ofFirms
100
67
18
185
ries in waste with some
g and manufa
l Income for
e managemerable direct imecycling centrs and landfill2 salaries anmated 2,078 jby these o
n monthly lan
Recycling WH
2011 An
nicipal Solid W
ginia Municip
f Number Employe
1,033
732
313
2,078
managementoccupationa
acturing, they
Selected Oc
ent in Westmpact on theters, transferls paid out innd wages, injobs. Annua
operations isndfill tonnage
Wasteaulers
Lan
nual Wages
Waste Manag
pal Solid Wa
of ees
AveWeek
$
$
$
$
t l y
do dem
ccupational S
t e r n n l s e
repo$44.procgenetippin The Reveassetrans
ndfills Reta
for Selected
gement in Wes
aste Employm
erage kly Wage A
642
707
750
700
compare faonstrated in t
Sectors
orts, with an 42, in CY 2
cessed 1,969,erated at leasng fees.
West Virgienue collecessment feessfer stations i
ail Agricultu
d Occupation
st Virginia
ment Analys
Average Annual Wage
$33,384
$36,764
$39,000
$36,383
avorably in the following
average lan2011, West ,920 tons of tst $93,177,21
nia Departmcted $16,98s from the stn 2011. This
ure Real Estat
nal Sectors
sis
Total AnnWages P
$34,506,1
$26,917,0
$12,205,7
$73,628,8
other areasgraph.
dfill tipping fVirginia’s la
taxable waste6 in revenues
ment of Tax83,602 in wtate’s landfillsrevenue is us
te
nual aid
155
009
718
882
s, as
fee of ndfills
e, and s from
x and waste s and sed to

9-3 Chapter 9: Economic Impact of Municipal Solid Waste Management in West Virginia
fund many of West Virginia’s environmental programs including: 1) The solid waste landfill closure assistance
program (LCAP) 2) The hazardous waste emergency response
program 3) The environmental reclamation program 4) REAP and SWMB grant programs 5) Monthly assessment fees for the state’s fifty
local solid waste authorities 6) Partial funding of West Virginia’s conservation
officers’ salaries A breakdown of expenditures can be found in Chapter 8 of this document. The Department of Environmental Protection’s (DEP) Landfill Closure Assistance Program4 (LCAP) is an example of a state level waste management program. Assessment fees made $7,167,490 available for closure activities for the program in FY 2011. LCAP is currently working on 30 landfill closures. For more information on LCAP, see Chapter 4 of this document. According to the US Census Bureau, in FY 2008-09, the state, municipalities and counties injected $68,850,000 into the state’s economy to cover the cost of waste management in their areas of responsibility.5 These same entities received $57,773,000 in fees for their waste management programs. Workforce West Virginia projections indicate waste management and remediation jobs are
expected to increase by 2.34% in the next ten years, compared to 3.27% in all occupational areas. In the past two years employment in recycling has increased by 24.8% and wages have increased 21.9%. Similarly, wages in waste hauling have increased 10.3% and the state’s landfill pay is up 9.9%. Recycling is an essential component of an integrated waste management system. In West Virginia, the state’s 50 local Solid Waste Authorities (SWAs) play an important role in waste management through recycling programs. All SWAs participate in recycling in some fashion. Many fill a void by providing recycling to areas with low population density not considered profitable for private sector recyclers. The role a SWA chooses to play in recycling varies based on the needs and available resources of the area. Twenty-two authorities presently own and operate materials processing centers, serving as recycling drop-off centers or regional processing centers for both public and private sector recyclers in multiple counties. Eight authorities own collection equipment, and operate collection programs; however, they do not process materials. Still others participate in whatever way their situations and resources allow; sponsoring public and private sector programs or through public education efforts.

9-4 Chapter 9
Figure 9-Solid Wa
Solid wacollected in CY 201of $44.42$1,662,95 Authoritiethe sale oput back costs. Tauthority estimated 9.4 Indire Solid waimpact opurchase immediate Landfills sequipmenengineerinmaintenanother profeighteen plans for
2
4
6
8
10
12
9: Economic Im
2 ste Authority
aste authorapproximatel
11. With an a2 per ton, this52 in tipping fe
s received $3of recyclables
into prograTotal landfill
recycling prd $5,000,000.
ect Impact
aste facilitiesn the state’
of goods e communitie
spend significnt, construcng servicence, groundfessional servlandfills repo
r building 63
0.0
2,000.0
4,000.0
6,000.0
8,000.0
0,000.0
2,000.0
mpact of Mun
y Recycling
rity recyclingly 37,437 tonaverage landfs represents ees.
3,464,106 in s. These fundams to cove
savings andrograms am
s also have ’s economy
and servics.
cant amounts ction, conses, fuel, water mon
vices. Fifteen ort current co3.1 acres o
SWA
nicipal Solid W
Tonnage by
g programsns of materiafill tipping feea savings of
revenues fords are usuallyr operationa
d income forounts to an
an indirectthrough the
ces in their
of money onsulting and
equipmentnitoring, andof the state’snstruction, orf new cells
A Recycling
Waste Manag
Wasteshed
s l
e f
r y l r n
t e r
n d t
d s r .
Estim$164 Wasthe purcpurccan inclu RecymateoverFY20compurcserv 9.5 I Whepurcthey econ Indutheirarea
Tonnage by
gement in Wes
mated cons4,000 to $700
ste haulers mstate’s ec
chases, mainchases. A newcost in exces
ude roll-off co
ycling centerserial collectorr $1.8 million013. These fmunities by
chasing of recices and emp
nduced Impa
en workers inchase goods
in turn stinomy, thus cr
ced impactsr earnings on a or regio
y Wasteshed
st Virginia
struction co0,000 per acre
make significaconomy thrntenance expw 20 yard garss of $200,00ntainers, dum
s, material prs, and manun from state funds were pway of capi
cycling equipmployment.
act
n direct and and servicesimulate anotreating an ind
s occur whegoods and sn. Purchas
sts range e.
ant contributiorough equippenses, andrbage packer
00. Other expempsters and fu
rocessing ceufacturers recgrant progra
put back intoital improvemment and veh
indirect indus for consumther layer ouced impact.
en workers services in thees can in
from
ons to pment d fuel r truck enses uel.
enters, ceived ms in
o local ments, hicles,
ustries mption, of the
spend e local nclude

9-5 Chapter 9: Economic Impact of Municipal Solid Waste Management in West Virginia
household items such as food and clothing, as well as various services like insurance, financial services, and healthcare. In turn, these local businesses return revenues back to the local economy in the form of payroll, inventory and other business expenditures. As these funds circulate they continue to generate additional levels of economic activity including business expansion and job creation. These benefits are often referred to as spill-over effects. 9.6 Waste and Scrap Exports Exports are one of West Virginia’s most important economic drivers. In 2011, a total of 741 West Virginia companies exported goods. Of those, 578 (78%) were small and medium size enterprises with fewer than 500 employees. These small and medium size firms generated over one quarter of the state’s total exports.
Scrap exports are made up of a wide variety of recyclable materials, the top two being metals and paper. Scrap also includes plastics, glass, textiles, and electronics and just about anything else that is recyclable. Several critical global trends have influenced export markets for scrap in recent years including higher energy costs, economic growth overseas, high commodities demand and better recovery technologies. These elements are working together to ensure future markets for West Virginia’s surplus recyclable materials. According to the US Department of Commerce in 2011, West Virginia exported over $24.7 million in scrap and waste material worldwide. More than $12.7 million went to our principle international trading partner Canada; $5.7 million to China and $2.8 million to the United Kingdom. While Canada is our most frequent trading partner, China is our fastest growing international market for scrap.6

9-6 Chapter 9: Economic Impact of Municipal Solid Waste Management in West Virginia
The following table details West Virginia’s waste and scrap exports over the last 5 years: Table 9-2 NAICS 910, West Virginia Waste and Scrap Exports 2007 2008 2009 2010 2011
World $30,797,446 $20,715,022 $26,154,125 $18,166,993 $24,763,418
Canada $24,643,849 $14,637,374 $5,657,226 $8,630,479 $12,720,494
China $3,343,943 $2,859,353 $1,736,114 $7,232,759 $5,769,086
United Kingdom $808,774 $1,781,872 $692,202 $222,782 $2,869,821
Australia $0 $190,444 $60,860 $1,085,134 $1,027,975
Belgium $293,216 $0 $0 $3,955 $987,565
Malaysia $33,705 $377,785 $0 $0 $339,898
France $0 $0 $0 $161,388 $244,886
Germany $0 $0 $0 $5,180 $227,088
Greece $0 $0 $0 $0 $172,904
Spain $0 $0 $0 $0 $162,451
India $47,913 $51,052 $97,924 $14,526 $80,828
Hong Kong $289,544 $344,501 $533,080 $508,540 $69,456
Turkey $0 $0 $16,630,407 $0 $55,979
El Salvador $0 $0 $0 $0 $15,482
Taiwan $42,620 $187,002 $163,406 $0 $12,005
Indonesia $0 $0 $0 $19,000 $7,500
Bangladesh $0 $17,912 $0 $0 $0
Egypt $0 $0 $21,524 $0 $0
Italy $6,169 $131,878 $0 $0 $0
Japan $5,022 $0 $0 $43,441 $0
Mexico $524,857 $0 $37,969 $7,562 $0
Netherlands $619,888 $0 $0 $0 $0
Pakistan $0 $0 $15,397 $0 $0Saint Vincent-Grenadines
$0 $0 $8,816 $0 $0
Singapore $0 $0 $0 $0 $0
South Africa $26,112 $5,303 $0 $0 $0
South Korea $111,834 $115,546 $207,731 $232,247 $0
Sweden $0 $0 $266,219 $0 $0
Thailand $0 $15,000 $25,000 $0 $0 Source: International Trade Division, US Department of Commerce

9-7 Chapter 9: Economic Impact of Municipal Solid Waste Management in West Virginia
End Notes for Section 9 1. WV Recycling Directory, WV Department of Commerce, 2012. 2. US Department of Commerce, International Trade Division. 3. WV Bureau of Employment Programs, Employment Statistics, “Employment & Wages, 2011.” 4. Department of Environmental Protection, Landfill Closure Assistance Program, Paul Benedum,
September, 2012. 5. US Census Bureau, “Local Government Finances by Type of Government and State: FY 2006 –
07.” 6. Various surveys conducted by the West Virginia Solid Waste Management Board, 2012.

Appendix A
Solid Waste Management Board Grants

A-1 Appendix A: Solid Waste Management Board Grants
Appendix A: Solid Waste Management Board Grant Overview
2013 SWMB GRANTS
SWA Amount Purpose
Berkeley $12,500 Brush grinding services and office improvements.
Brooke $20,000 Transportation of recyclables, wages, equipment maintenance and a Household Hazardous Waste event.
Calhoun $18,056 Concrete ramp, insurance, wages, crane inspection and shipping materials.
Hancock $11,300 Roll-off charges, wages and a financial examination.
Jackson $17,814 Wages, fuel, utilities and equipment maintenance.
Jefferson $1,000 Battery disposal fees.
Lincoln $20,000 Transportation of recyclables, wages and financial examinations.
Logan $10,000 Purchase a pickup truck.
Marion $13,390 Recycling bins, educational conference, office equipment and supplies.
Mason $7,600 Tires, maintenance costs, educational conference expenses, baling wire, gravel for recycling center and a financial examination.
McDowell $10,650 Educational conference expenses, educational/promotional expenses and a financial examination.
Mercer $11,755 Tires, baling wire and litter bags.
Monongalia $5,675 Educational conference expenses, fuel, tires and maintenance school.
Monroe $16,650 Equipment maintenance and supplies, insurance, wages, financial examination, educational conference, utilities, education, fuel and computer software.
Morgan $17,800 Hauling fees, financial examination, wages, utilities, insurance, rent, advertising and equipment rental.
Ohio $11,600 Household Hazardous Waste event, website design and a computer tablet.
Pleasants $19,500 Educational conference, fuel, recycling supplies, wages, insurance and utilities.
Pocahontas $17,900 Purchase seven recycling cage trailers.
Putnam $3,000 Educational conference and signage for events.
Region VIII $20,000 Truck scales for Petersburg Transfer Station.
Upshur $2,655 Insurance, billboards and field trips.
Wayne $13,615 Fuel, tires, insurance, utilities and baling wire.
Webster $6,500 Insurance, wages and taxes and educational flyers.
Wood $11,040 Purchase recycling containers.
24 Recipients $300,000

A-2 Appendix A: Solid Waste Management Board Grants
2012 SWMB GRANTS
SWA Amount Purpose
Berkeley $12,000 Household Hazardous Waste collection event.
Brooke $10,000 Transportation of recyclables and equipment maintenance.
Cabell $2,900 Audits.
Calhoun $4,367 Utilities and office equipment.
Doddridge $20,000 Purchase a collection truck.
Greenbrier $12,000 Purchase of a self-contained compactor.
Hancock $8,600 Roll-off charges and wages.
Jackson $15,100 Wages, fuel, lighting at recycling center and educational conference attendance.
Jefferson $12,585 Purchase a skid loader and pallet truck.
Kanawha $12,500 Vehicle repairs and fuel.
Lincoln $14,300 Transportation of recyclables and wages.
Logan $20,000 Assist with the purchase of a litter control vehicle.
Mason $13,156 Fuel, maintenance costs, wages and educational conference expenses.
McDowell $8,400 Educational conference expenses and educational/promotional expenses.
Monongalia $6,315 Educational conference expenses, safety equipment, fuel and tools.
Monroe $9,000 Transportation of recyclables and wages.
Pleasants $12,500 Educational conference expenses, fuel, financial review, recycling supplies and wages.
Pocahontas $15,000 Purchase a truck.
Raleigh $12,000 Purchase recycling roll-offs.
Region VIII $20,000 Maintenance and repair of equipment.
Roane $9,036 Fuel, maintenance & repairs, wages and educational conference expenses.
Taylor $2,756 Insurance and recycling drop-off stipend.
Tucker $19,600 Software, laptop and an ATV.
Wayne $5,647 Fuel and audits.
Wetzel $7,000 Fuel, maintenance and wages.
Wood $7,200 Pallet jacks and delivery carts.
Wyoming $8,038 Litter control supervisor wages and public education.
27 Recipients $300,000

A-3 Appendix A: Solid Waste Management Board Grants
2011 SWMB GRANTS
SWA Amount Purpose
Barbour $11,500 Fuel, equipment repairs and wages.
Berkeley $10,000 Contracting to grind brush.
Brooke $18,380 Transportation of recyclables, equipment maintenance, floor scale and wages.
Calhoun $9,544 BRIM insurance, workers compensation costs, equipment inspections, tires for forklift and wages.
Greenbrier $9,753 Purchase a shredder cutter head.
Hancock $10,500 Transportation of recyclables.
Jackson $9,127 Insurance and storage containers.
Jefferson $3,915 Installation of security doors on e-cycling containers and recycling informational brochures.
Kanawha $10,000 Mechanical repairs to forklifts and replacement of tires for roll-off truck and skidsteer.
Lincoln $16,000 Transportation of recyclables and wages.
Mason $6,700 Fuel, maintenance costs and educational conference expenses.
McDowell $9,700 Financial review, educational conference expenses and educational/promotional expenses.
Monroe $4,540 Recycling vehicle fuel.
Morgan $12,000 Transportation of recyclables, BRIM insurance and wages.
Ohio $14,594 Purchase a roll-off container.
Pleasants $16,644 Educational conference expenses, fuel, financial review, equipment maintenance, recycling handbooks and wages.
Pocahontas $5,576 Purchase two cage trailers and recycling informational pamphlets.
Preston $5,600 Purchase a 5 ton truck.
Putnam $1,000 Purchase one litter vacuum for the SWA.
Region VIII $20,000 Scale systems software for transfer stations and purchase three computers.
Ritchie $15,600 Equipment, informational brochures and lettering for truck, trailers and the recycling center.
Tucker $7,500 Scale house electronics.
Tyler $10,500 Fuel, equipment maintenance, wages and insurance.
Upshur $4,157 Utilities, insurance, educational conference expenses, Shred Day event and school trips.
Wayne $16,349 Insurance, fuel, utilities and wages.
Webster $9,300 Recycling trailer and wages.
Wetzel $10,500 Fuel, insurance, maintenance and wages.

A-4 Appendix A: Solid Waste Management Board Grants
SWA Amount Purpose
Wirt $11,250 Educational conference expenses, wages and audits.
Wood $6,770 Recycling containers and related supplies.
Wyoming $3,000 Audits.
30 Recipients $300,000

A-5 Appendix A: Solid Waste Management Board Grants
1991-2010 SWMB GRANTS*
AUTHORITY 91 92 93 94 95 96 97 98 01 02 03 04 05 06 07 08 09 10
Barbour ● ● ● ● ● ● ● ● ● ● ● Berkeley ● ● ● ● ● ● ● Boone ● ● ● ● ● ● Braxton ● ● ● ● ● ● ● Brooke ● ● ● ● ● ● ● ● ● ● ● Cabell ● ● ● ● ● ● ● Calhoun ● ● ● ● ● ● ● ● ● ● ● Clay ●2 ● ● ● ● Doddridge ● ●3 ● Fayette ● ● ● ● ● ● ● ● ● ● ● Greenbrier ●2 ●2 ● ● ● ● ● ● ● ● ● Hancock ● ● ● Harrison ● ● ● ● Jackson ●2 ● ● ● ● ● ● ● ● Jefferson ● ● ● ● ● ● Kanawha ● ● ● ● ● ● ● ● ● ● ● Lewis/Gilmer ●3 ●2 ●2 ● Lincoln ● ● ● ● ● ● ● ● Logan ● ● ● ● ● ● ● ● ● Marion ● ● ● ● ● ● ● ● ● ● Marshall ● ● ● ● Mason ● ● ● ● ● ● ● ● ● ● McDowell ● ● ● ● ● ● ● ● ● Mercer ● ● ● ● ● ● Mineral Mingo ● ● ● ● ● ● ● ● Monongalia ● ● ●2 ● ● ● ● ● ● ● ● Monroe ● ● ● ● ● ● ● ● ● Morgan ● ● ● ● ● ● ● ● ● Nicholas ● ● Ohio ● ● ● ● Pleasants ● ● ● ● ● Pocahontas ● ● ● ● ● ● ● ● Preston ● ● ● ● ● Putnam ●2 ● ● ● ● ● ● ● ● Raleigh ●2 ● ● ● ● Randolph ●2 ● ● ● ● ● ● Region VIII ● ● ● ● ● ● ● ● ● Ritchie ● ● ● ● ● ● ● ● ● ● Roane ● ● ● ● ● ● ● ● Summers ● ● ● ● ● ● ● ● Taylor ●2 ● ● ● ● ● ● Tucker ● ● ● ● ● ● ● ● Tyler ● ● ●2 ● ● ● ● ● ● ● ● ● Upshur ● ● ● ● ● ● ● ● ● ● ● Wayne ● ● ● ● ● ● ● ● ● ● ● Webster ●7 ● ● ● ● ● ● ● ● ● Wetzel ● ● ● ● ● ● ● ● ● ● ● Wirt ● ● ● ● ● ● ● Wood ●3 ●2 ● Wyoming ● ● ● ● ●
*In electronic format, click on any cell to see complete grant year overview.

Appendix B
DEP-REAP Recycling Assistance Grant Overview

B-1 Appendix B: DEP-REAP Recycling Assistance Grant Overview
Appendix B: DEP-REAP Recycling Assistance Grant Overview 2012 DEP-REAP Recycling Assistance Grants
Entity Amount Purpose
Barbour County SWA $71,000 A baler/conveyor system and assist with personnel and equipment repairs for the on-going countywide program.
Brooke County SWA $87,767 Personnel, transportation costs, utilities, supplies, equipment maintenance and purchase a self-compacting unit for on-going program.
Calhoun County SWA $41,552.92 Personnel, equipment maintenance and purchase a box-truck for countywide program.
Hancock County SWA $24,080 Personnel, purchase a composter and recycling bins for current program.
Kanawha County SWA $126,891 Purchase truck scales with site modification and installation, a forklift, skid steer and assist with fuel for recycling vehicle.
Mason County SWA $109,099 Personnel and to purchase fuel, a forklift and recycling trailers for the current program.
Monroe County SWA $32,000 Assist with personnel, transportation costs of recyclables, educational conference attendance, advertising, fuel and to purchase a baler.
Pleasants County SWA $42,100 Personnel, insurance, utilities, recycling vehicle expense, operational supplies and advertising.
Pocahontas County SWA $40,542 Assist with recycling contract/transportation expenses and to purchase trailers and educational pamphlets for ongoing program.
Putnam County SWA $13,000 Recycling roll-off pulls and mobile home recycling for current program.
Randolph County SWA $6,300 Personnel and purchase advertising and supplies for recycling education program.
Upshur County SWA $8,778 Purchase recycling bins and assist with supplies, utilities, and educational conference attendance for the program.
Wetzel County SWA $25,500 Personnel, vehicle fuel and maintenance for ongoing program.
Wood County SWA $9,800 Purchase a trailer for a new school recycling program.
Boone County Commission $73,080 Assist with personnel, educational conference attendance, utilities, supplies and advertising and purchase a recycling facility abutment wall, baler, mini-cyclers and recycling bags.
Brooke County Commission $14,000 Building repairs (heat & insulation) and bid advertising.
Marion County Commission $102,539 Purchase a new cab and chassis truck with hook-lift system and recycling containers for the restructuring of program.
Summers County Commission $34,584 Purchase bin trailers, recycling containers and assist with fuel, equipment maintenance and supplies.
Alderson-Broaddus College $2,000 Purchase recycling containers for the campus-wide project.

B-2 Appendix B: DEP-REAP Recycling Assistance Grant Overview
Entity Amount Purpose
Davis & Elkins College, Center for Sustainability Studies
$33,045 Personnel and purchase a recycling utility vehicle, recycling trailer and bins for campus-wide program.
Marshall University Sustainability Department
$42,811 Assist with personnel and the purchase a recycling truck and bins for current program.
West Virginia Higher Education Policy Commission
$13,521 Purchase rollout carts and recycling bins to establish a new recycling program.
West Virginia State University $5,500 Educational conference attendance and supplies for current campus-wide program.
West Virginia Wesleyan College
$6,720 Purchase recycling bins and bags and to assist with educational conference attendance for current campus-wide program.
City of Buckhannon $50,987 Purchase a recycling trailer and 12-yard open top containers for city-wide program.
City of Kingwood $59,199 Purchase a baler and grapple bucket for the program.
City of South Charleston $75,000 Purchase a recycling truck for current program.
City of Westover $66,836 Purchase a recycling truck and to assist with personnel for the current program.
St. Mary’s Correctional Center $6,600 Assist with educational conference attendance and to purchase recycling containers and advertising for current operation.
Beckley Garbage Disposal, Inc.
$36,275 Purchase cardboard recycling dumpsters for ongoing program.
D&D Recycling $13,515 Purchase dumping hoppers and shears for recycling operation.
Habitat for Humanity of Kanawha & Putnam Counties
$50,344.50 Purchase a recycling truck and fuel for ongoing operation.
Historic Fayetteville Convention & Visitors Bureau
$21,950 Purchase a recycling trailer, bins and steel wire containers for community program.
Jerry’s Salvage $37,500 Partially fund the purchase of an excavator with magnet/grapple attachment.
North Central West Virginia Recycling Cooperative, Inc.
$25,000 Assist with personnel costs for the ongoing recycling operation.
Pipestem Resort State Park $20,000 Purchase recycling receptacles to expand current program.
Refuse Control Systems $48,433 Purchase a recycling truck and assist with fuel and truck insurance.
Sunrise Sanitation Services, Inc.
$34,783 Purchase recycling containers for current operation.
Tygarts Valley Sanitation, Inc. $37,366 Purchase cardboard dumpsters and recycling trailers for current program.
39 Recipients $1,549,998.00

B-3 Appendix B: DEP-REAP Recycling Assistance Grant Overview
2011 DEP-REAP Recycling Assistance Grants
Entity Amount Project
Berkeley County SWA $98,000 Purchase a forklift, road trailers, safety dock plates for e-cycling and recycling center upgrades for current program.
Jackson County SWA $135,000 Purchase a recycling trailer and conveyor, assist with personnel and provide support for countywide program.
Lincoln County SWA $25,500 Personnel and provide support for ongoing countywide program.
Morgan County SWA $15,800 Personnel and provide support to ongoing program.
Ohio County SWA $24,367 Purchase a roll-off container and provide support for ongoing countywide program.
Ritchie County SWA $61,555 Purchase a used box truck, baler and overhead bay door and provide support for countywide program.
Taylor County SWA $13,950 Assist with personnel and the Great Paper Chase administration and support for countywide program.
Wayne County SWA $54,685 Purchase a truck, recycling trailers and provide support for countywide program.
Webster County SWA $10,000 Assist with demolition contractors for mobile home recycling within the county.
Wirt County SWA $20,500 Purchase a baler and assist with countywide program.
Ritchie County Commission $40,000 Assist with the installation of a truss roof for the county recycling center.
Wyoming County Commission $37,000 Purchase a recycling truck for the ongoing countywide program.
Village of Beech Bottom $9,800 Purchase a receptacle trailer for the recycling program.
City of Bluefield $11,938.78 Personnel and provide support for ongoing citywide program.
City of Charleston $102,770 Purchase a recycling vehicle and provide support for citywide program.
Town of Fayetteville $66,500 Purchase a new truck, down stroke baler and provide support for current program.
City of Parkersburg $62,407 Purchase a fork lift, assist with personnel and provide support for citywide recycling program.
City of Princeton $10,000 Assist with contractors for recycling mobile homes, appliances and junk cars and provide support for ongoing citywide program.
Town of Terra Alta $62,628 Personnel and provide support for current program.
Concord University Research and Development
$37,480 Purchase a 22” recycling bin, utility vehicle and provide support for campuswide program.

B-4 Appendix B: DEP-REAP Recycling Assistance Grant Overview
Entity Amount Project
Davis and Elkins College $6,400 Purchase wooden recycling bins and provide support for campus wide program.
WVU at Parkersburg $17,530.27 Purchase a recycling trailer, recycling containers and provide support for campuswide program.
Adams Trucker and Supply $75,000 Purchase a glass recycling system for a new recycling operation.
AW Recycling $30,000 Purchase a used recycling truck for the ongoing operation.
Canaan Valley Resort and Conference Center
$59,263.64 Purchase recycling containers, compost tumblers and assist with establishing the recycling program.
Clarksburg Scrap Metals $18,050 Purchase a shear and wire stripper for current recycling program.
Eaves Recycling $50,000 Purchase a granulator.
Goodwill Industries of KYOWVA
$67,899 Purchase a rollback truck and commercial recycling containers for the current collection program.
Harold’s Refuse Removal $33,055 Purchase a lift trailer, dumping bin and roll-off boxes and provide support for current recycling operation.
New River Trading $10,000 Purchase a used skid loader for current program.
PC Renewal $16,000 Purchase a hard drive shredder for current operation.
Randolph County Recycling Center
$75,000 Purchase a baler, belt conveyor and provide support for recycling operation.
Recycling Coalition of WV, Inc. $42,500 Assist with America Recycles Day, 8 page insert for statewide advertising.
United Disposal Service $37,407.50 Assist in the purchase of recycling containers for current operation.
Wheeling Area Training Center for the Handicapped
$41,851 Purchase a baler and conveyor for recycling operations.
Zanesville Welfare Organization and Goodwill Industries
$70,000 Purchase a horizontal baler for the current recycling operation.
36 Recipients $1,549,837.19

B-5 Appendix B: DEP-REAP Recycling Assistance Grant Overview
2010 DEP-REAP Recycling Assistance Grants
Entity Amount Project
Brooke County SWA $81,893.39 Assist with personnel, purchase a truck with hoist system and provide support for the ongoing program.
Calhoun County SWA $31,788 Assist with personnel and provide support for the ongoing program.
Greenbrier County SWA $45,935 Purchase a can sorter/densifier and roll-off container to assist with current recycling operations.
Hancock County SWA $63,530 Purchase roll-off containers, vertical balers, fork lift, platform scales and provide support for ongoing program.
Kanawha County SWA $65,280 Purchase a forklift, can densifier and fuel.
Mason County SWA $44,090 Purchase recycling trailers and provide support for the countywide program.
Mercer County SWA $62,160 Purchase a baler, paper shredder and to expand the recycling program.
Monongalia County SWA $70,000 Purchase compartmentalized hook lift containers for the countywide program.
Monroe County SWA $25,975 Assist with personnel and provide support for the countywide program.
Pleasants County SWA $72,825.56 Assist with personnel, purchase a box truck and provide support to the ongoing program.
Pocahontas County SWA $59,250 Purchase a baler and provide support to the countywide program.
Raleigh County SWA $55,000 Assist in the purchase of a tub grinder for the ongoing program.
Roane County SWA $35,016 Assist with personnel and provide support for the ongoing program.
Wetzel County SWA $34,025 Purchase a new recycling truck for the ongoing program.
Brooke County Commission $15,874 Purchase new garage doors and lights for the recycling facility.
Fairmont State University $9,838 Purchase recycling bins and provide support for the campus wide program.
Town of Chesapeake $7,675 Purchase recycling bags, stands and educational material.
City of Kingwood $11,175.92 Purchase compartmentalized recycling bins and construction of bays for the current program.
Corporation of Shepherdstown
$34,870 Purchase a dump truck for yard composting and recyclables and provide support to the ongoing program.
City of St. Marys $25,580 Assist with personnel and vehicle insurance for the ongoing program.
Town of Star City $34,950 Purchase a recycling truck and non-residential recycling containers for the citywide program.

B-6 Appendix B: DEP-REAP Recycling Assistance Grant Overview
Entity Amount Project
City of Westover $7,049 Assist with personnel and provide support for the ongoing program.
City of Wheeling $45,000 Purchase a truck for the citywide recycling program.
Afterlife Electronics $15,500 Purchase van trailers and provide support to the current operation.
Apple Valley Waste $30,000 Purchase a packer truck for recyclables.
BeBe Enterprises $71,354 Purchase a skid loader and truck for the recycling operation.
Beckley Garbage $30,000 Assist in the purchase of a packer truck for cardboard recycling.
Clarksburg Mission $27,700 Purchase a vertical baler and box truck for the ongoing program.
Evans Recycling $31,700 Purchase a skid loader for the current operation.
Habitat for Humanity of Kanawha/Putnam Counties
$36,690 Purchase a truck for hauling reusable material.
KHM Enterprises $28,875 Assist with personnel, purchase a fork lift and recycling containers for the current recycling program.
Knight-Horst Shredding $37,500 Purchase a shredding truck for paper recycling.
North Central WV Recycling Cooperative
$25,000 Assist with personnel for the ongoing program.
Preston Tire and Recycling $75,000 Purchase a shear shredder, various equipment shredding parts and welders for the current operation.
RRHAMCO, Inc. $25,000 Assist with the purchase of a new scale system for the existing facility.
Russell Moore Recycling $25,000 Assist in the purchase of a pole building for the existing operation.
Smalley Sanitation $30,022.04 Purchase a lift gate and material loader for the recycling operation.
Stonewall Resort $15,000 Purchase compartmentalized recycling bins to assist in the ongoing operation.
Sunrise Sanitation $29,990 Purchase recycling bin units for the current operation.
Union Mission of Fairmont $21,916 Purchase a fork lift truck for the current operation.
Wood County Habitat for Humanity
$15,319 Purchase a fork lift and pallet jack to assist with the overall program.
WV University Research Corporation
$39,654 Purchase compartmentalized recycling trailers and recycling bins for the Mountaineers Recycle Program.
42 Recipients $1,549,999.91

Appendix C
DEP-REAP Covered Electronic Devices (CED) Grant Overview

C-1 Appendix C: DEP-REAP Covered Electronic Devices (CED) Grant Overview
Appendix C: DEP-REAP Covered Electronic Devices (CED) Grant Overview
2012 DEP-REAP CED Grants
Entity Amount Purpose
Berkeley County SWA $18,000 Fund contracted electronic recycling/transportation, labor and fuel for the ongoing CED collection program.
Brooke County SWA $11,840 Fund advertisement and labor wages for the ongoing CED collection program.
Cabell County SWA $7,500 Fund advertisement and an electronic recycler for an electronic recycling collection event.
Fayetteville, Town of $7,500 Fund electronic recycling contractor and advertisement for a CED collection event.
Gilmer County Commission $3,600 Fund personnel and newspaper advertisements for an electronic recycling collection event.
Grafton, City of $7,500 Purchase Gaylord storage boxes and fund the transportation and processing of electronics.
Greenbrier County SWA $7,700 Fund collection/processing, packing/shipping supplies and advertisement for the ongoing CED collection program.
Hancock County SWA $7,280 Purchase plastic stretch wrap, Gaylord boxes, and to fund the electronic goods transportation for the ongoing CED collection program.
Hurricane, City of $6,000 Fund an electronic recycler for transportation of electronics.
Jackson County SWA $15,000 Fund partial cost of an addition to the existing recycling center building to store electronics for the ongoing CED collection program.
Jefferson County SWA $15,344.78 Purchase a dry van trailer and pallet truck and to fund electronic recycling costs for the ongoing CED program.
Kanawha County SWA $15,763 Fund fuel and maintenance for the forklift and partial personnel cost for the ongoing CED collection program.
Kingwood, City of $7,500 Fund advertisement/flyers and an electronic recycling contractor for a CED collection event.
Marion County SWA $7,500 Fund an electronic recycling contractor and advertisement for a CED collection event.
McDowell County SWA $7,500 Fund an electronic recycling contractor and advertising for a CED collection event.
Monongalia County SWA $7,500 Fund an electronic recycling contractor and advertising for a CED collection event.
Morgan County SWA $7,500 Fund advertising for an electronic recycling contractor for a CED collection event.

C-2 Appendix C: DEP-REAP Covered Electronic Devices (CED) Grant Overview
Entity Amount Purpose
Pleasants County SWA $10,000 Fund electronic recycling/transportation costs and advertising.
Putnam County SWA $7,500 Fund an electronic recycler and advertisement for one CED collection event.
Region VIII SWA $20,000 Fund an electronic recycling contractor, advertising and RFP development for five countywide CED collection events.
Terra Alta, Town of $6,300 Fund recycling costs of electronics, advertising and to purchase storage boxes and equipment for the ongoing CED collection program.
Tucker County SWA $17,500 Purchase a cargo container, forklift loading ramps and CED pick up and recycling for the ongoing CED collection program.
Wayne County SWA $4,280 Fund fuel, pallets and advertising for the ongoing CED collection program.
Wood County SWA $3,000 Fund a spring and fall advertising campaign for recycling electronics.
Wyoming County Commission
$8,430 Purchase one container box for electronic recycling purposes.
25 Recipients $237,537.78

C-3 Appendix C: DEP-REAP Covered Electronic Devices (CED) Grant Overview
2011 DEP-REAP CED Grants
Entity Amount Purpose
Barbour County SWA $8,000 Fund wages, advertising, Gaylord boxes, fuel for pickups and electronic recycling processing for a CED collection event and drop-off program.
Berkeley County SWA $14,620 Fund contracted transportation and recycling services, shrink wrap, informational signage and posts for the ongoing CED collection program.
Brooke County SWA $10,500 Fund recycling contractual services and advertising for a CED collection event.
Cabell County SWA $8,312 Purchase a stretch wrap machine, approach ramp and shipping costs and supplies for the ongoing CED collection program.
Clay County Commission $6,250 Fund contractual recycling services, advertising and management flow control for a CED collection event.
Greenbrier County SWA $8,200 Fund collection, processing and packing costs, shipping supplies and advertising for the ongoing CED collection program.
Hancock County SWA $20,000 Purchase pallets, shrink wrap, Gaylord boxes, fork truck and fund transportation and disposal for the ongoing CED collection program.
Harrison County SWA $10,500 Fund recycling and transportation fees and advertising for a CED collection event.
Kanawha County SWA $13,300 Fund labor, advertising, fuel, TV disposal, signage, supplies, event truck usage and recycling processing for the ongoing CED collection program and county cleanup event.
Kingwood, City of $7,500 Fund recycling contract services and advertising for a CED collection event.
Lincoln County SWA $10,500 Fund recycling and transportation costs and advertising for a CED collection event.
McDowell County SWA $9,000 Fund disposal, rental, labor and advertising for a CED collection event.
Mercer County SWA $10,200 Fund the electronic recycling cost and advertising for a CED collection event.
Morgan County SWA $5,900 Fund contractual electronic recycling processing, advertising and site management for a CED collection event.
Ohio County SWA $7,000 Fund an electronics recycling contractor and advertising for a CED collection event.

C-4 Appendix C: DEP-REAP Covered Electronic Devices (CED) Grant Overview
Entity Amount Purpose
Pleasants County SWA $10,500 Fund the recycling and transportation costs and advertising for a CED collection event.
Pocahontas County SWA $9,000 Fund an electronics recycling contractor and advertising for a CED collection event and purchase a CED storage unit.
Putnam County SWA $7,500 Fund an electronics recycling contractor, advertising and contract labor for a CED collection event.
Randolph County SWA $6,605 Fund box trailer rental, forklift rental, disposal fees, labor, advertising, event signage, and packing materials for a CED collection event.
Region VIII SWA $20,000 Fund an electronics recycling contractor and CED RFP development and management for ongoing CED collection program.
Tucker County SWA $19,700 Purchase a forklift and pallet jack and fund box trailer rental, CED recycling fees, TV recycling fees and advertising for the ongoing CED collection program.
Upshur County SWA $1,400 Fund electronic recycling fees and advertising for a CED collection event.
Wayne County SWA $5,400 Fund an electronics recycling contractor and advertising for a CED collection event.
Wood County SWA $3,700 Fund advertising, signs and banners for a CED collection event.
24 Recipients $233,587.00

C-5 Appendix C: DEP-REAP Covered Electronic Devices (CED) Grant Overview
2010 DEP-REAP CED Grants
Entity Amount Purpose
Berkeley County SWA $17,800 Fund contracted CED recycling services, education/public awareness and traffic control staffing.
Brooke County SWA $20,000 Contracted services for 1 or 2 day CED collection events, TV and newspaper advertising.
Greenbrier County SWA $20,000 Funding for transportation, processing and packaging of electronics.
Hancock County SWA $14,000 Cover costs of material collection, transportation and processing of CED’s.
Kanawha County SWA $22,000 Fund contractual program consulting, recycling fees, advertising and assist in fuel for forklifts, personnel/labor costs and supplies.
Kingwood, City of $9,391 Advertising, printing, promotional bags, facility usage and e-cycling vendor fees.
Lewisburg, City of $6,000 Advertising, public education, labor and fuel for CED pick up bi-monthly.
McDowell County SWA $13,030 Fund rental, labor and disposal fees, advertising, educational materials and promotional items for a CED collection event.
Morgan County SWA $20,000 Provide an electronics recycling service.
Ohio County SWA $16,800 Funding for a 1 or 2 day CED collection event, advertising and dumpster for waste.
Pocahontas County SWA $17,134 Advertisement and contractor fees for a CED collection event.
Preston County Commission $7,159 Advertisement, printing and e-cycling vendor costs associated with holding a CED collection event.
Putnam County SWA $18,000 Fork truck rental, transportation, contract labor and processing for 2 CED events, plus advertisement, promotion and transportation costs for school board computer recycling project.
Raleigh County SWA $26,676 Assist in the purchase of a forklift, Gaylord boxes, box trailer and advertisements.
Ritchie County SWA $16,800 Funding for contractual services, educational materials, advertisement and site rental associated with a CED event.
Upshur County SWA $20,000 Funding for one employee for a CED collection program, purchase Gaylord boxes, 6 trips to PC Renewal and advertising.
Wood County SWA $8,500 Funding for advertising and a 2 day collection event.
17 Recipients $273,290.00

Appendix D
Solid Waste Authority Recycling Survey/Analysis: CY 2011

D-1
Appendix D: Solid Waste Authority Recycling Survey/Analysis: CY 2011
Appendix D: Solid Waste Authority Recycling Survey/Analysis: CY 2011
Following are the results of CY 2011 surveys of the
states 50 Solid Waste Authorities (SWAs) and 14
mandated municipalities. As per W. Va.Code §22-
15A-18 (b) cities with populations over 10,000 are
mandated to provide curbside recycling to their
citizens.1
In West Virginia there are no reporting requirements
for public or private recycling programs. All reporting
was voluntary and sometimes fragmented. Note:
Many municipal and SWA collection programs are
outsourced to private sector contractors. When
records or surveys are not always available other
sources were used to compile this information
including, Solid Waste Management Board grant
applicants, WV DEP REAP Recycling Assistance
Grant applications and information from the 2011
West Virginia Solid Waste Management Plan.
The number of drop-off and curbside collection
programs was obtained from the West Virginia
Recycling Directory. The directory is published by the
West Virginia Department of Commerce and updated
annually. Drop-off programs include community
recycling centers, municipal programs, remote drop-
off sites and drop-off centers that collect only one
material such as electronics or motor oil. Listings also
include collection sites at local schools. It does not
include retail programs, manufacturer sponsored
programs and mail-in programs.
Most of the tonnages numbers are for Solid Waste
Authority or municipal collection programs. Tonnages
were also listed in cases where Solid Waste
Authorities work closely with private or public sector
programs.
All recycling revenues listed are earned by the
entities they listed under. It should be understood that
the prices obtained by the sale of recyclable
materials are highly dependent on the volumes
collected, the type of processing technology used,
the availability of markets and many other things. The
“Per Unit Price” was listed to help in identifying
programs in need of assistance and should not be
construed in any way as being critical. It is hoped that
by providing a tool to more easily identify programs
with revenue problems, assistance can be rendered
by municipal, county and state entities.
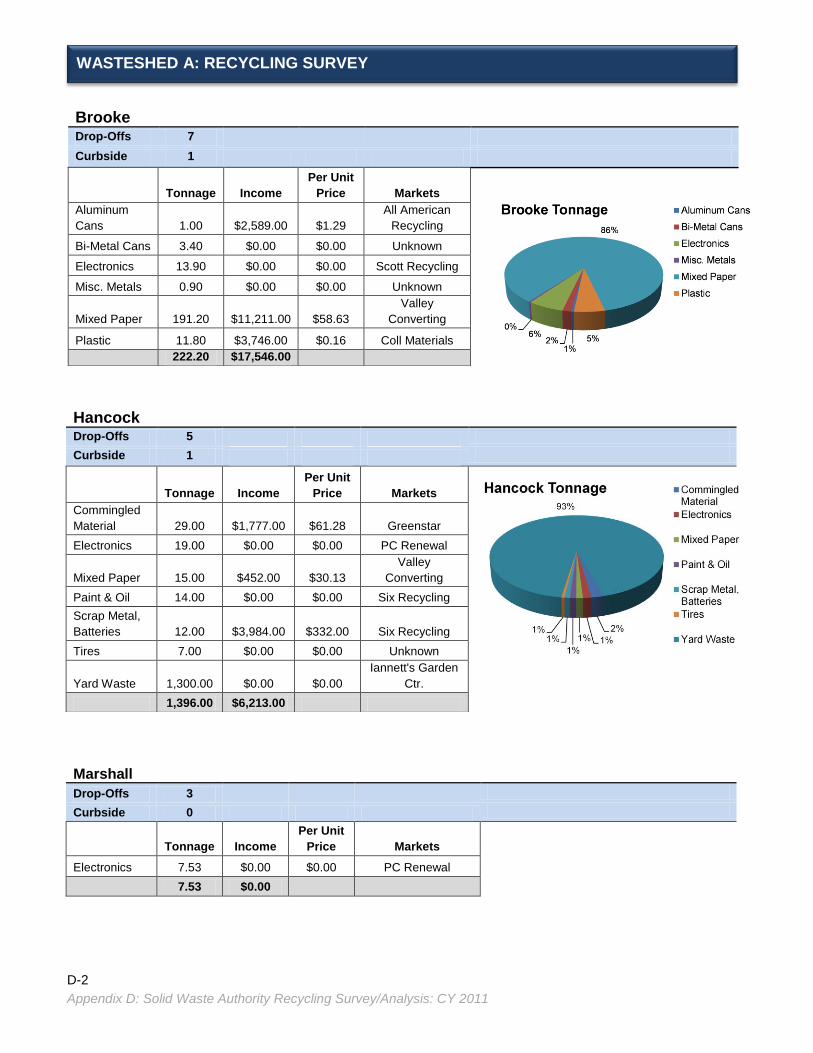
D-2
Appendix D: Solid Waste Authority Recycling Survey/Analysis: CY 2011
Marshall
Drop-Offs 3
Curbside 0
Tonnage Income
Per Unit
Price Markets
Electronics 7.53 $0.00 $0.00 PC Renewal
7.53 $0.00
Brooke
Drop-Offs 7
Curbside 1
Tonnage Income
Per Unit
Price
Markets
Aluminum
Cans 1.00 $2,589.00 $1.29
All American
Recycling
Bi-Metal Cans 3.40 $0.00 $0.00 Unknown
Electronics 13.90 $0.00 $0.00 Scott Recycling
Misc. Metals 0.90 $0.00 $0.00 Unknown
Mixed Paper 191.20 $11,211.00 $58.63
Valley
Converting
Plastic 11.80 $3,746.00 $0.16 Coll Materials
222.20 $17,546.00
Hancock
Drop-Offs 5
Curbside 1
Tonnage Income
Per Unit
Price
Markets
Commingled
Material 29.00 $1,777.00 $61.28 Greenstar
Electronics 19.00 $0.00 $0.00 PC Renewal
Mixed Paper 15.00 $452.00 $30.13
Valley
Converting
Paint & Oil 14.00 $0.00 $0.00 Six Recycling
Scrap Metal,
Batteries 12.00 $3,984.00 $332.00 Six Recycling
Tires 7.00 $0.00 $0.00 Unknown
Yard Waste 1,300.00 $0.00 $0.00
Iannett's Garden
Ctr.
1,396.00 $6,213.00
WASTESHED A: RECYCLING SURVEY

D-3
Appendix D: Solid Waste Authority Recycling Survey/Analysis: CY 2011
Tyler/Wetzel
Drop-Offs 7
Curbside 1
Tonnage Income
Per Unit
Price
Markets
Aluminum 5.90 $0.00 $0.00 Northern Mountain St.
Bi-Metal Cans 4.00 $1,910.00 $477.50 Northern Mountain St.
Mixed Paper 5.30 $834.00 $157.36 Unknown
Plastic 4.00 $578.00 $0.07 Pleasant SWA
White Goods 182.90 $0.00 $0.00 Nicholas Salvage
202.10 $3,322.00
Note: 2009 data.
Ohio
Drop-Offs 21
Curbside 1
Tonnage Income
Per Unit
Price
Markets
Cardboard 800.00 $0.00 $0.00 Various
Commingled
Material 100.00 $3,000.00 $30.00 Greenstar
Electronics 19.78 $0.00 $0.00 PC Renewal
Newspaper 450.00 $0.00 $0.00 Various
Office Paper 190.00 $0.00 $0.00 Various
1,559.78 $3,000.00
WASTESHED A: RECYCLING SURVEY (Continued)

D-4
Appendix D: Solid Waste Authority Recycling Survey/Analysis: CY 2011
Recycling Facilities Recycling Tonnage/Revenue
Drop-Offs 43 Total Recycled 3,387.61
Curbside 4 Total Recycling Income $30,081.00
Recycling Materials Collected in Wasteshed A: 2011
Tonnage Income
Bi-Metal Cans 7.40 $1,910.00
Glass 0.00 $0.00
Commingled Material 129.00 $4,777.00
Electronics 60.21 $0.00
Metals, Ferrous 195.80 $3,984.00
Metals, NonFerrous 6.90 $2,589.00
Other Waste 14.00 $0.00
Paper & Cardboard 1,651.50 $12,497.00
Plastics 15.80 $4,324.00
Tires 7.00 $0.00
Yard Waste 1,300.00 $0.00
Total 3,387.61 $30,081.00
*Aluminum Cans and Plastics priced per lb., all other materials priced per ton.
0% 0%
4% 2% 6% 0%
0%
49%
1% 0%
38%
Wasteshed A: Recyclable Materials Collected by Tonnage
Bi-Metal Cans
Glass
Commingled Material
Electronics
Metals, Ferrous
Metals, Nonferrous
Other Waste
Paper & Cardboard
Plastics
Tires
Yard Waste
WASTESHED A: RECYCLING ANALYSIS

D-5
Appendix D: Solid Waste Authority Recycling Survey/Analysis: CY 2011
2010 US Census Population and Waste Projections for One Month
Wasteshed A Population 158,086
Municipal Solid Waste Tonnage, One Month 10,651
Sensitivity Analysis: Monthly Recycling Tonnage Potential
Tons Per Month At:
Material Percent of
Waste Stream* 100% Recycled 50% Recycled 25% Recycled 10% Recycled
Paper 28.5% 3,036 1,518 759 304
Plastics 12.4% 1,321 660 330 132
Ferrous Metals 9.0% 959 479 240 96
Glass 4.6% 490 245 122 49
* Percentages were taken from 2010 EPA waste characterization study.
Sensitivity Analysis: Monthly Recycling Revenue Potential
Revenue Potential At:
Material Average WS
Price Per Ton 100% Recycled 50% Recycled 25% Recycled 10% Recycled
Paper $82.04 $249,073 $124,537 $62,268 $24,907
Yard Waste $0.00 $0 $0 $0 $0
Plastics $0.12 $317,040 $158,520 $79,260 $31,704
Ferrous Metals $404.75 $388,155 $194,078 $97,039 $38,816
Glass $0.00 $0 $0 $0 $0
Notes: Average WS Price Per Ton is the average price per ton of all materials of each identified type sold in the wasteshed by
the vendors listed and does not include instances where materials were collected and no revenue was earned. It is felt that this
represents the fair market value of materials under current conditions and does not reflect potential value in the case of future
improved markets or improved processing technology or processes. The Average Price Per ton of metals includes ferrous
metals only. For a look at regional average market prices of these materials, see Chapter 6 of this document.
WASTESHED A: RECYCLING ANALYSIS (Continued)

D-6
Appendix D: Solid Waste Authority Recycling Survey/Analysis: CY 2011
Barbour*
Drop-Offs 6
Curbside 0
Tonnage Income
Per Unit
Price Markets
Metals, Ferrous 5.00 $1,250.00 $250.00 RRHAMCO
Mixed, Paper 150.00 $5,000.00 $33.33
Georgia Pacific,
MD Waste Paper
Mixed, Plastic 10.00 $500.00 $0.03 Varies
165.00 $6,750.00
*2010 data.
Braxton*
Drop-Offs 2
Curbside 0
Tonnage Income
Per Unit
Price
Markets
Electronics 11.38 $0.00 $0.00 WV Cashin
Metals, Ferrous 75.99 $24,219.64 $318.72 WV Cashin
Mixed Paper 151.16 $3,216.99 $21.28 WV Cashin
238.53 $27,436.63
*Information from 2010.
Clay
Drop-Offs 0
Curbside 0
Doddridge
Drop-Offs 0
Curbside 0
Harrison
Drop-Offs 16
Curbside 9
Tonnage Income
Per Unit
Price Markets
Electronics 67.30 $0.00 $0.00 Unknown
67.30 $0.00
WASTESHED B: RECYCLING SURVEY

D-7
Appendix D: Solid Waste Authority Recycling Survey/Analysis: CY 2011
Lewis/Gilmer
Drop-Offs 11
Curbside 8
Marion
Drop-Offs 19
Curbside 1
Tonnage Income
Price
Per Unit
Markets
Aluminum Cans 4.13 $1,675.96 $0.20 Monongalia SWA
Cardboard 121.83 $4,422.63 $36.30 Monongalia SWA
Glass 51.00 $89.25 $1.75 Monongalia SWA
Newspaper 184.83 $5,675.41 $30.71 Monongalia SWA
Metals, Ferrous 26.01 $1,478.10 $56.83 Monongalia SWA
Plastic, PET 28.70 $3,417.43 $0.06 Monongalia SWA
Plastic, HDPE 47.50 $6,692.19 $0.07 Monongalia SWA
464.00 $23,450.97
Monongalia
Drop-Offs 24
Curbside 2
Tonnage Income
Price
Per Unit
Markets
Aluminum
Cans 33.94 $55,815.63 $0.82
WV Cashin, Northern
Mtn. State
Bi-Metal Cans 92.63 $24,513.15 $264.64
WV Cashin, Jacks
Recycling
Cardboard 2,669.46 $388,270.85 $145.45
Caraustar, Greenstar,
Ace Paper
Electronics 57.61 $0.00 $0.00 PC Renewal
Glass 453.80 $3,124.27 $6.88 Bradish Glass
Newspaper 127.79 $15,551.00 $121.69
Caraustar, Greenstar,
Ace Paper
Office Paper 1,277.86 $149,942.64 $117.34 Caraustar, Ace Paper
Plastic, PET 151.70 $73,914.70 $0.24
Caraustar, Park, BM
Polymers,
Chesapeake
Plastics, HDPE 81.40 $42,692.90 $0.26
Caraustar, Park, BM
Polymers,
Chesapeake
4,946.19 $753,825.14
WASTESHED B: RECYCLING SURVEY (Continued)

D-8
Appendix D: Solid Waste Authority Recycling Survey/Analysis: CY 2011
Preston
Drop-Offs 12
Curbside 2
Tonnage Income
Price Per
Unit Markets
Electronics 19.06 $0.0 $0.00 Unknown
19.06 $0.0
Randolph*
Drop-Offs 5
Curbside 0
Income
Price
Per Unit Markets
Aluminum Cans 0.86 $0.00 $0.00 Unknown
Cardboard 85.60 $0.00 $0.00 Unknown
Mixed Metals 1.00 $0.00 $0.00 Unknown
Plastics 3.80 $0.00 $0.00 Unknown
91.26 $0.00
*2009 data.
Taylor*
Drop-Offs 3
Curbside 2
Tonnage Income
Price
Per Unit
Markets
Aluminum Cans 18.00 $0.00 $0.00 Unknown
Cardboard 299.00 $0.00 $0.00 Unknown
Mixed Paper 80.00 $0.00 $0.00 Unknown
Office Paper 36.00 $0.00 $0.00 Unknown
Mixed Plastic 15.00 $0.00 $0.00 Unknown
White Goods 11.00 $0.00 $0.00 Unknown
459.00 $0.00
*Year FY 2010, tonnages collected and processed by Refuse Control.
WASTESHED B: RECYCLING SURVEY (Continued)

D-9
Appendix D: Solid Waste Authority Recycling Survey/Analysis: CY 2011
Tucker
Drop-Offs 3
Curbside 1
Tonnage Income
Price
Per Unit Markets
Metals, Ferrous 34.94 $5,071.00 $145.13 Allegany Scrap
Tires 36.96 $5,916.00 $160.06
Preston Tire &
Rubber
71.90 $10,987.00
Upshur
Drop-Offs 5
Curbside 1
Tonnage* Income
Price Per
Unit
Markets
Aluminum Cans 1.95 $0.00 $0.00 NCWVRC
Cardboard 263.30 $0.00 $0.00 NCWVRC
Electronics 1.90 $0.00 $0.00 Unknown
Newspaper 216.92 $0.00 $0.00 NCWVRC
Office Paper 41.55 $0.00 $0.00 NCWVRC
Mixed Plastic 14.50 $0.00 $0.00 NCWVRC
Mixed Metals 12.00 $0.00 $0.00 NCWVRC
Yard Waste 73.20 $0.00 $0.00 NCWVRC
625.32 $0.00
*Year 2010, tonnages collected and processed by the City of Buckhannon and marketed by NCWVRC.
WASTESHED B: RECYCLING SURVEY (Continued)

D-10
Appendix D: Solid Waste Authority Recycling Survey/Analysis: CY 2011
Recycling Facilities Recycling Tonnage/Revenue
Drop-Offs 106 Total Recycled 7,147.56
Curbside 26 Total Recycling Income $822,449.74
Recycling Materials Collected in Wasteshed B: 2011
Tonnage Income
Aluminum Cans 58.88 $57,491.59
Bi-Metal Cans 92.63 $24,513.15
Cardboard 3,439.19 $392,693.48
Glass 504.80 $3,213.52
Electronics 157.25 $0.00
Metals, Ferrous 141.94 $32,018.74
Paper, Newsprint 529.54 $21,226.41
Paper, Office 1,355.41 $149,942.64
Paper, Mixed 384.96 $8,216.99
Plastics, PET 180.40 $77,332.13
Plastics, HDPE 128.90 $49,385.09
Plastics, Mixed 39.50 $500.00
Tires 36.96 $5,916.00
White Goods 24.00 $0.00
Yard Waste 73.20 $0.00
Totals 7,147.56 $822,449.74
*Aluminum Cans and Plastics priced per lb., all other materials priced per ton.
1% 1%
48%
7%
2% 2%
7%
19%
5% 3% 2% 1% 1% 0%
1%
Wasteshed B: Recyclable Materials Collected by Tonnage
Aluminum Cans
Bi-Metal Cans
Cardboard
Glass
Electronics
Metals, Ferrous
Paper, Newsprint
Paper, Office
Paper, Mixed
Plastics, PET
Plastics, HDPE
Plastics, Mixed
Tires
White Goods
Yard Waste
WASTESHED B: RECYCLING ANALYSIS

D-11
Appendix D: Solid Waste Authority Recycling Survey/Analysis: CY 2011
2010 US Census Population and Waste Projections for One Month
Wasteshed B Population 406,686
Municipal Solid Waste Tonnage, One Month 27,400
Sensitivity Analysis: Monthly Recycling Tonnage Potential
Tons Per Month At:
Material Percent of
Waste Stream* 100% Recycled 50% Recycled 25% Recycled 10% Recycled
Paper 28.5% 7,809 3,905 1,952 781
Yard Waste 13.4% 3,672 1,836 918 367
Plastics 12.4% 3,398 1,699 849 340
Ferrous Metals 9.0% 2,466 1,233 617 247
Glass 4.6% 1,260 630 315 126
* Percentages were taken from 2010 EPA waste characterization study.
Sensitivity Analysis: Monthly Recycling Revenue Potential
Revenue Potential At:
Material Average WS
Price Per Ton 100% Recycled 50% Recycled 25% Recycled 10% Recycled
Paper $72.30 $564,591 $282,295 $141,148 $56,459
Yard Waste $0.00 $0 $0 $0 $0
Plastics $0.13 $883,480 $441,740 $220,870 $88,348
Ferrous Metals $207.06 $510,610 $255,305 $127,652 $51,061
Glass $4.32 $5,443 $2,722 $1,361 $544
Notes: Average WS Price Per Ton is the average price per ton of all materials of each identified type sold in the wasteshed by
the vendors listed and does not include instances where materials were collected and no revenue was earned. It is felt that this represents the fair market value of materials under current conditions and does not reflect potential value in the case of future improved markets or improved processing technology or processes. The Average Price Per ton of metals includes ferrous metals only. For a look at regional average market prices of these materials, see Chapter 6 of this document.
WASTESHED B: RECYCLING ANALYSIS (Continued)

D-12
Appendix D: Solid Waste Authority Recycling Survey/Analysis: CY 2011
Jackson
Drop-Offs 6
Curbside 0
Tonnage Income
Price Per
Unit
Markets
Aluminum Cans 1.03 $1,476.00 $0.72 Various Local
Bi-Metal Cans 3.45 $518.00 $150.14 Various Local
Cardboard 234.07 $36,175.00 $154.55
Fox Run,
Caraustar
Electronics 1.39 $0.00 $0.00 Scott Recycling
Glass 55.60 $678.00 $12.19 Strategic Materials
Mixed Paper 300.28 $42,128.00 $140.30 Caraustar
Mixed Plastic 16.87 $7,219.00 $0.21 CPR Plastics
Office Paper 18.84 $5,086.00 $269.96 Caraustar
Yard Waste 150.00 $0.00 $0.00 Local
781.53 $93,280.00
Pleasants
Drop-Offs 1
Curbside 4
Tonnage Income
Price Per
Unit Markets
Aluminum Cans 1.50 $2,000.00 $0.67 RJ Recycling
Cardboard 204.00 $15,000.00 $73.53
Ace Paper,
Caraustar
Electronics 25.30 $0.00 $0.00 Unknown
Glass 6.00 $0.00 $0.00 Unknown
Mixed Metal 10.00 $5,000.00 $500.00 RJ Recycling
Mixed Plastics 11.00 $2,600.00 $0.12
Gary Grossman,
Mondo
Newspaper 30.00 $2,700.00 $90.00
Ace Paper,
Caraustar
Office Paper 8.00 $1,600.00 $200.00
Ace Paper,
Caraustar
Textiles 10.00 $4,000.00 $400.00 Gary Grossman
305.80 $32,900.00
WASTESHED C: RECYCLING SURVEY

D-13
Appendix D: Solid Waste Authority Recycling Survey/Analysis: CY 2011
Ritchie
Drop-Offs 2
Curbside 0
Tonnage Income
Price Per
Unit
Markets
Aluminum Cans 7.64 $10,993.88 $0.72 JR Recycling
Cardboard 94.33 $13,483.45 $142.94 ACE Paper
Glass 77.19 $550.99 $7.14 Bradish Glass
Metals Ferrous 12.00 $2,339.92 $194.99 JR Recycling
Metals,
NonFerrous 470.00 $4,475.00 $9.52 JR Recycling
Mixed Paper 53.03 $4,324.03 $81.54 ACE Paper
Mixed Plastics 4.23 $712.80 $0.08 Mondo Polymers
Newspaper 8.33 $1,190.83 $142.96 ACE Paper
726.75 $38,070.90
Wirt
Drop-Offs 2
Curbside 0
Tonnage Income
Price Per
Unit Markets
Aluminum Cans 0.90 $0 $0.00 Unknown
Bi-Metal Cans 3.10 $0 $0.00 Unknown
Glass 16.20 $0 $0.00 Unknown
Mixed Paper 118.40 $0 $0.00 Unknown
Mixed Plastics 11.00 $0 $0.00 Unknown
Tires 25.70 $0 $0.00 Unknown
175.30 $0
Wood
Drop-Offs 16 Curbside 2
WASTESHED C: RECYCLING SURVEY (Continued)

D-14
Appendix D: Solid Waste Authority Recycling Survey/Analysis: CY 2011
Recycling Facilities Recycling Tonnage/Revenue
Drop-Offs 27 Total Recycled 1,989.38
Curbside 6 Total Recycling Income $164,250.90
Recycling Materials Collected in Wasteshed C: 2011
Tonnage Income
Aluminum Cans 11.07 $14,469.88
Bi-Metal Cans 6.55 $518.00
Cardboard 532.40 $64,658.45
Glass 154.99 $1,228.99
Electronics 26.69 $0.00
Metals, Ferrous 12.00 $2,339.92
Metals, NonFerrous 470.00 $4,475.00
Mixed Metal 10.00 $5,000.00
Paper, Newsprint 38.33 $3,890.83
Paper, Office 26.84 $6,686.00
Paper, Mixed 471.71 $46,452.03
Plastics, Mixed 43.10 $10,531.80
Textiles 10.00 $4,000.00
Tires 25.70 $0.00
Yard Waste 150.00 $0.00
Total 1,989.38 $164,250.90
*Aluminum Cans and Plastics priced per lb., all other materials priced per ton.
1% 0%
27%
8% 1% 1%
24%
0%
2% 1%
24% 2% 0% 1%
8%
Wasteshed C: Recyclable Materials Collected by Tonnage
Aluminum Cans
Bi-Metal Cans
Cardboard
Glass
Electronics
Metals, Ferrous
Metals, Nonferrous
Mixed Metal
Paper, Newsprint
Paper, Office
Paper, Mixed
Plastics, Mixed
Textiles
Tires
Yard Waste
WASTESHED C: RECYCLING ANALYSIS

D-15
Appendix D: Solid Waste Authority Recycling Survey/Analysis: CY 2011
2010 US Census Population and Waste Projections for One Month
Wasteshed C Population 139,938
Municipal Solid Waste Tonnage, One Month 9,428
Sensitivity Analysis: Monthly Recycling Tonnage Potential
Tons Per Month At:
Material Percent of
Waste Stream 100% Recycled 50% Recycled 25% Recycled 10% Recycled
Paper 28.5% 2,687 1,343 672 269
Yard Waste 13.4% 1,263 632 316 126
Plastics 12.4% 1,169 585 292 117
Ferrous Metals 9.0% 849 424 212 85
Glass 4.6% 434 217 108 43
* Percentages were taken from 2010 EPA waste characterization study.
Sensitivity Analysis: Monthly Recycling Revenue Potential
Revenue Potential At:
Material Average WS
Price Per Ton 100% Recycled 50% Recycled 25% Recycled 10% Recycled
Paper $143.97 $386,847 $193,424 $96,712 $38,685
Yard Waste $0.00 $0 $0 $0 $0
Plastics $0.14 $327,320 $163,660 $81,830 $32,732
Ferrous Metals $122.39 $103,909 $51,955 $25,977 $10,391
Glass $9.67 $4,197 $2,098 $1,049 $420
Notes: Average WS Price Per Ton is the average price per ton of all materials of each identified type sold in the wasteshed by
the vendors listed and does not include instances where materials were collected and no revenue was earned. It is felt that this represents the fair market value of materials under current conditions and does not reflect potential value in the case of future improved markets or improved processing technology or processes. The Average Price Per ton of metals includes ferrous metals only. For a look at regional average market prices of these materials, see Chapter 6 of this document.
WASTESHED C: RECYCLING ANALYSIS (Continued)

D-16
Appendix D: Solid Waste Authority Recycling Survey/Analysis: CY 2011
Berkeley
Drop-Offs 64
Curbside 3
Tonnage Income
Per Unit
Price
Markets
Aluminum Cans 16.70 $13,800.00 $0.41 CVR, Zuckerman's
Books 12.90 $0.00 $0.00
Planet Aide, Book
Lady
Electronics 159.40 $0.00 $0.00 Eco, Scott
Glass 268.90 $0.00 $0.00 Zuckerman's
Mixed Paper 1,187.10 $8,000.00 $6.74 Ox, CWP, SEP
Oil 5.20 $0.00 $0.00 Safety Kleen
Plastic #1-2 11.40 $2,100.00 $0.09 Southern Scrap
Plastic #3-7 5.00 $0.00 $0.00 Southern Scrap
Plastic Bags 8.70 $1,000.00 $0.06 Southern Scrap
Steel Cans 40.60 $8,900.00 $219.21 Zuckerman's
Textiles 99.30 $0.00 $0.00 Planet Aide
Wood 120.00 $0.00 $0.00 Tabb
Yard Waste 2,227.00 $12,400.00 $5.57 WMI, Tabb
4,162.20 $46,200.00
Jefferson
Drop-Offs 9
Curbside 1
Tonnage Income Per Unit
Price Markets
Commingled Material 1,000.00 $12,372.00 $12.37 WM, Conservit
Electronics 30.00 $0.00 $0.00 Unicor Recycling
1,030.00 $12,372.00
WASTESHED E: RECYCLING SURVEY

D-17
Appendix D: Solid Waste Authority Recycling Survey/Analysis: CY 2011
Morgan
Drop-Offs 4
Curbside 0
Tonnage Income Per Unit
Price Markets
Aluminum 4.00 $2,535.00 $0.32 Conservit
Bi-Metal Cans 17.57 $2,808.10 $159.82 Conservit
Cardboard 135.47 $3,797.12 $28.03 Southern Scrap
Electronics 24.05 $0.00 $0.00 PC Renewal
Glass 74.85 $0.00 $0.00 Southern Scrap
Mixed Paper 368.91 $7,178.40 $19.46 Southern Scrap,
MD Paper
Plastic, Mixed 26.84 $0.00 $0.00 Southern Scrap
651.69 $16,318.62
Region VIII
Drop-Offs 10
Curbside 0
Tonnage Income Per Unit
Price
Markets
Electronics 75.00 $0.00 $0.00 PC Renewal
Metals 200.00 $30,000.00 $150.00 Unknown
275.00 $30,000.00
WASTESHED E: RECYCLING SURVEY (Continued)

D-18
Appendix D: Solid Waste Authority Recycling Survey/Analysis: CY 2011
Recycling Facilities Recycling Tonnage/Revenue
Drop-Offs 87 Total Recycled 6,118.89
Curbside 4 Total Recycling Income $104,890.62
Recycling Materials Collected in Wasteshed E: 2011
Tonnage Income
Aluminum Cans 20.70 $16,335.00
Bi-Metal Cans 58.17 $11,708.10
Cardboard 135.47 $3,797.12
Commingled Material 1,000.00 $12,372.00
Glass 343.75 $0.00
Electronics 288.45 $0.00
Metals, Ferrous 200.00 $30,000.00
Other Waste 18.10 $0.00
Paper, Mixed 1,556.01 $15,178.40
Plastics, PET 11.40 $2,100.00
Plastics, HDPE 5.00 $0.00
Plastics, Mixed 35.54 $1,000.00
Textiles 99.30 $0.00
Wood 120.00 $0.00
Yard Waste 2,227.00 $12,400.00
Total 6,118.89 $104,890.62
*Aluminum Cans and Plastics priced per lb., all other materials priced per ton.
0%
1%
2%
16%
6% 5% 3% 0%
26%
0%
0% 1%
2% 2% 36%
Wasteshed E: Recyclable Material Collected by Tonnage Aluminum Cans
Bi-Metal Cans
Cardboard
Commingled Material
Glass
Electronics
Metals, Ferrous
Other Waste
Paper, Mixed
Plastics, PET
Plastics, HDPE
Plastics, Mixed
Textiles
Wood
Yard Waste
WASTESHED E: RECYCLING ANALYSIS

D-19
Appendix D: Solid Waste Authority Recycling Survey/Analysis: CY 2011
2010 US Census Population and Waste Projections for One Month
Wasteshed E Population 261,041
Municipal Solid Waste Tonnage, One Month 17,587
Sensitivity Analysis: Monthly Recycling Tonnage Potential
Tons Per Month At:
Material Percent of
Waste Stream 100% Recycled 50% Recycled 25% Recycled 10% Recycled
Paper 28.5% 5,012 2,506 1,253 501
Yard Waste 13.4% 2,357 1,178 589 236
Plastics 12.4% 2,181 1,090 545 218
Ferrous Metals 9.0% 1,583 791 396 158
Glass 4.6% 809 405 202 81
* Percentages were taken from 2010 EPA waste characterization study.
Sensitivity Analysis: Monthly Recycling Revenue Potential
Revenue Potential At:
Material Average WS
Price Per Ton 100% Recycled 50% Recycled 25% Recycled 10% Recycled
Paper $18.08 $90,617 $45,308 $22,654 $9,062
Yard Waste $5.57 $13,128 $6,564 $3,282 $1,313
Plastics $0.07 $305,340 $152,670 $76,335 $30,534
Ferrous Metals $154.91 $245,223 $122,611 $61,306 $24,522
Glass $0.00 $0 $0 $0 $0
Notes: Average WS Price Per Ton is the average price per ton of all materials of each identified type sold in the wasteshed by the vendors listed and does not include instances where materials were collected and no revenue was earned. It is felt that this represents the fair market value of materials under current conditions and does not reflect potential value in the case of future improved markets or improved processing technology or processes. The Average Price Per ton of metals includes ferrous metals only. For a look at regional average market prices of these materials, see Chapter 6 of this document.
WASTESHED E: RECYCLING ANALYSIS (Continued)

D-20
Appendix D: Solid Waste Authority Recycling Survey/Analysis: CY 2011
Nicholas
Drop-Offs 7
Curbside 0
Pocahontas
Drop-Offs 10
Curbside 0
Tonnage Income Price Per
Unit Markets
Bi-Metal Cans 3.35 $0.00 $0.00 Pocahontas Recycling
Cardboard 143.76 $0.00 $0.00 Pocahontas Recycling
Electronics 10.04 $0.00 $0.00 Scott Recycling
Mixed Paper 96.74 $0.00 $0.00 Pocahontas Recycling
Mixed Plastics 13.57 $0.00 $0.00 Pocahontas Recycling
Tires 65.14 $0.00 $0.00 Emanuel Tire
White Goods 19.11 $0.00 $0.00 Allegheny Disposal
351.71 $0.00
Webster
Drop-Offs 1
Curbside 0
Greenbrier
Drop-Offs 7
Curbside 4
Tonnage Income Price Per
Unit Markets
Aluminum Cans 99.00 $169,113.00 $0.85 WV Cashin
Cardboard 628.00 $101,246.00 $161.22 Georgia Pacific,
Fox Run
Electronics 126.00 $0.00 $0.00 Electronic
Recyclers, Inc.
Magazines 106.00 $13,241.00 $124.92 Caraustar, Fox
Run
Office Paper 128.00 $39,756.00 $310.59 Caraustar
Newspaper 215.00 $28,935.00 $134.58 Georgia Pacific,
Caraustar
Plastic 80.00 $43,433.00 $542.91 Georgia Pacific,
Caraustar
Mixed Metal 94.00 $166,347.00 $1,769.65 WV Cashin
Tires 19.00 $727.00 $38.26 WV Tire Disposal
White Goods 9.00 $344.00 $38.22 Boggs Scrap, SS
Belchers
1,504.00 $563,142.00
WASTESHED F: RECYCLING SURVEY

D-21
Appendix D: Solid Waste Authority Recycling Survey/Analysis: CY 2011
Recycling Facilities Recycling Tonnage/Revenue
Drop-Offs 1 Total Recycled 1,855.71
Curbside 0 Total Recycling Income $563,142.00
Recycling Materials Collected in Wasteshed F: 2011
Tonnage Income
Aluminum Cans 99.00 $169,113.00
Bi-Metal Cans 3.35 $0.00
Cardboard 771.76 $101,246.00
Electronics 136.04 $0.00
Magazines 106.00 $13,241.00
Paper, Newsprint 215.00 $28,935.00
Paper, Office 128.00 $39,756.00
Paper, Mixed 96.74 $0.00
Plastics, Mixed 93.57 $43,433.00
Scrap Metal 94.00 $166,347.00
Tires 84.14 $727.00
White Goods 28.11 $344.00
Total 1,855.71 $563,142.00
*Aluminum Cans and Plastics priced per lb., all other materials priced per ton.
5%
0%
42%
7%
6%
12% 7%
5%
5%
5%
5%
1%
Wasteshed F: Recyclabe Materials Collected by Tonnage
Aluminum Cans
Bi-Metal Cans
Cardboard
Electronics
Magazines
Paper, Newsprint
Paper, Office
Paper, Mixed
Plastics, Mixed
Scrap Metal
Tires
White Goods
WASTESHED F: RECYCLING ANALYSIS

D-22
Appendix D: Solid Waste Authority Recycling Survey/Analysis: CY 2011
2010 US Census Population and Waste Projections for One Month
Wasteshed F Population 79,586
Municipal Solid Waste Tonnage, One Month 5,362
Sensitivity Analysis: Monthly Recycling Potential
Tons Per Month At:
Material Percent of
Waste Stream 100% Recycled 50% Recycled 25% Recycled 10% Recycled
Paper 28.5% 1,528 764 382 153
Yard Waste 13.4% 719 359 180 72
Plastics 12.4% 665 332 166 66
Ferrous Metals 9.0% 483 241 121 48
Glass 4.6% 247 123 62 25
* Percentages were taken from 2010 EPA waste characterization study.
Sensitivity Analysis: Monthly Recycling Revenue Potential
Revenue Potential At:
Material Average WS
Price Per Ton 100% Recycled 50% Recycled 25% Recycled 10% Recycled
Paper $182.83 $279,364 $139,682 $69,841 $27,936
Yard Waste $0.00 $0 $0 $0 $0
Plastics $542.91 $361,035 $180,518 $90,259 $36,104
Ferrous Metals $38.22 $18,460 $9,230 $4,615 $1,846
Glass $0.00 $0 $0 $0 $0
Notes: Average WS Price Per Ton is the average price per ton of all materials of each identified type sold in the wasteshed by the vendors listed and does not include instances where materials were collected and no revenue was earned. It is felt that this represents the fair market value of materials under current conditions and does not reflect potential value in the case of future improved markets or improved processing technology or processes. The Average Price Per ton of metals includes ferrous metals only. For a look at regional average market prices of these materials, see Chapter 6 of this document.
WASTESHED F: RECYCLING ANALYSIS (Continued)

D-23
Appendix D: Solid Waste Authority Recycling Survey/Analysis: CY 2011
Fayette
Drop-Offs 3
Curbside 2
Tonnage Income Price Per
Unit Markets
Electronics 17.00 $0 $0 Unknown
17.00 $0
McDowell
Drop-Offs 3
Curbside 0
Tonnage Income Price Per
Unit Markets
Electronics 7.63 $0 $0 PC Renewal
7.63 $0
Mercer
Drop-Offs 15
Curbside 2
Tonnage Income Price
Per Unit
Markets
Aluminum Cans 5.70 $2,563.07 $0.22 Recycle WV
Cardboard 122.38 $8,792.02 $71.84 Greif
Electronics 45.96 $0.00 $0.00 Various
Mixed Paper 97.21 $8,451.71 $86.94 Caraustar
Mixed Plastics 25.80 $12,088.85 $0.23 Caraustar
Commingled Metals 72.82 $13,951.63 $191.59 Recycle WV
Yard Waste 200.00 $0.00 $0.00 Local
569.87 $45,847.28
Mingo
Drop-Offs 4
Curbside 0
WASTESHED G: RECYCLING SURVEY
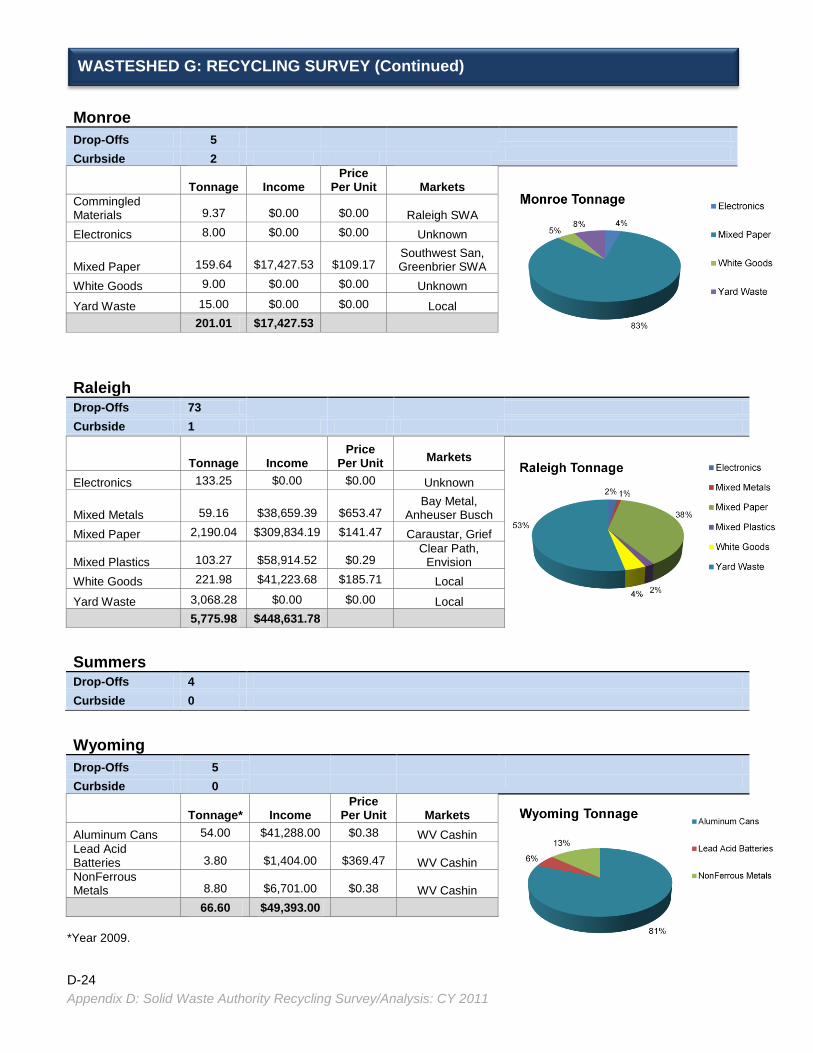
D-24
Appendix D: Solid Waste Authority Recycling Survey/Analysis: CY 2011
Monroe
Drop-Offs 5
Curbside 2
Tonnage Income Price
Per Unit Markets
Commingled Materials 9.37 $0.00 $0.00 Raleigh SWA
Electronics 8.00 $0.00 $0.00 Unknown
Mixed Paper 159.64 $17,427.53 $109.17 Southwest San, Greenbrier SWA
White Goods 9.00 $0.00 $0.00 Unknown
Yard Waste 15.00 $0.00 $0.00 Local
201.01 $17,427.53
Raleigh
Drop-Offs 73
Curbside 1
Tonnage Income Price
Per Unit
Markets
Electronics 133.25 $0.00 $0.00 Unknown
Mixed Metals 59.16 $38,659.39 $653.47 Bay Metal,
Anheuser Busch
Mixed Paper 2,190.04 $309,834.19 $141.47 Caraustar, Grief
Mixed Plastics 103.27 $58,914.52 $0.29 Clear Path,
Envision
White Goods 221.98 $41,223.68 $185.71 Local
Yard Waste 3,068.28 $0.00 $0.00 Local
5,775.98 $448,631.78
Summers
Drop-Offs 4
Curbside 0
*Year 2009.
Wyoming
Drop-Offs 5
Curbside 0
Tonnage* Income Price
Per Unit Markets
Aluminum Cans 54.00 $41,288.00 $0.38 WV Cashin
Lead Acid Batteries 3.80 $1,404.00 $369.47 WV Cashin
NonFerrous Metals 8.80 $6,701.00 $0.38 WV Cashin
66.60 $49,393.00
WASTESHED G: RECYCLING SURVEY (Continued)

D-25
Appendix D: Solid Waste Authority Recycling Survey/Analysis: CY 2011
Recycling Facilities Recycling Tonnage/Revenue
Drop-Offs 112 Total Recycled 6,638.09
Curbside 7 Total Recycling Income $561,299.59
Recycling Materials Collected in Wasteshed G: 2011
Tonnage Income
Aluminum Cans 59.70 $43,851.07
Cardboard 122.38 $8,792.02
Commingled Material 9.37 $0.00
Electronics 211.84 $0.00
Lead Acid Batteries 3.80 $1,404.00
Mixed Metals 140.78 $59,312.02
Paper, Mixed 2,446.89 $335,713.43
Plastics, Mixed 129.07 $71,003.37
White Goods 230.98 $41,223.68
Yard Waste 3,283.28 $0.00
Total 6,638.09 $561,299.59
*Aluminum Cans and Plastics priced per lb., all other materials priced per ton.
1%
2%
0%
3% 0%
2%
37%
2% 4%
49%
Wasteshed G: Recyclable Material Collected by Tonnage Aluminum Cans
Cardboard
Commingled Material
Electronics
Lead Acid Batteries
Mixed Metals
Paper, Mixed
Plastics, Mixed
White Goods
Yard Waste
WASTESHED G: RECYCLING ANALYSIS

D-26
Appendix D: Solid Waste Authority Recycling Survey/Analysis: CY 2011
2010 US Census Population and Waste Projections for One Month
Wasteshed G Population 287,339
Municipal Solid Waste Tonnage, One Month 19,359
Sensitivity Analysis: Monthly Recycling Tonnage Potential
Tons Per Month At:
Material Percent of
Waste Stream 100% Recycled 50% Recycled 25% Recycled 10% Recycled
Paper 28.5% 5,517 2,759 1,379 552
Yard Waste 13.4% 2,594 1,297 649 259
Plastics 12.4% 2,401 1,200 600 240
Ferrous Metals 9.0% 1,742 871 436 174
Glass 4.6% 891 445 223 89
* Percentages were taken from 2010 EPA waste characterization study.
Sensitivity Analysis: Monthly Recycling Revenue Potential
Revenue Potential At:
Material Average WS
Price Per Ton 100% Recycled 50% Recycled 25% Recycled 10% Recycled
Paper $102.36 $564,720.12 $282,360.06 $141,180.03 $56,472.01
Yard Waste $0.00 $0.00 $0.00 $0.00 $0.00
Plastics $0.26 $1,248,520.00 $624,260.00 $312,130.00 $124,852.00
Ferrous Metals $185.71 $323,506.82 $161,753.41 $80,876.71 $32,350.68
Glass $0.00 $0.00 $0.00 $0.00 $0.00
Notes: Average WS Price Per Ton is the average price per ton of all materials of each identified type sold in the wasteshed by
the vendors listed and does not include instances where materials were collected and no revenue was earned. It is felt that this represents the fair market value of materials under current conditions and does not reflect potential value in the case of future improved markets or improved processing technology or processes. The Average Price Per ton of metals includes ferrous metals only. For a look at regional average market prices of these materials, see Chapter 6 of this document
WASTESHED G: RECYCLING ANALYSIS (Continued)

D-27
Appendix D: Solid Waste Authority Recycling Survey/Analysis: CY 2011
Boone
Drop-Offs 5
Curbside 1
Tonnage Income Per Unit
Price Markets
Aluminum Cans 0.30 $339.00 $0.57 WV Cashin Recyclables
Cardboard 336.30 $22,514.00 $66.95 WV Cashin Recyclables
Bi-Metal Cans 6.30 $983.00 $156.03 WV Cashin Recyclables
Magazines 18.00 $1,674.00 $93.00 WV Cashin Recyclables
Mixed Paper 26.80 $2,394.00 $89.33 WV Cashin Recyclables
Newspaper 61.70 $3,007.00 $48.74 WV Cashin Recyclables
449.40 $30,911.00
Cabell
Drop-Offs 22
Curbside 1
Calhoun
Drop-Offs 1
Curbside 0
Tonnage Income Per Unit
Price Markets
Aluminum Cans 7.20 $10,143.00 $0.70 Ashley's
Recycling
Bi-Metal Cans 0.82 $82.00 $100.00 Ashley's
Recycling
Cardboard 8.60 $518.58 $60.30 Ashley's
Recycling
Electronics 2.97 $0.00 $0.00 Unknown
Lead Acid Batteries 3.30 $1,899.00 $575.45
Ashley's Recycling
Metals, Ferrous 3.20 $0.00 $0.00 Ashley's
Recycling
Mixed Paper 39.20 $3,155.91 $80.51 Caraustar
Mixed Plastic 0.30 $74.00 $0.12 Caraustar
NonFerrous Metals 5.20 $9,654.00 $1,856.54
Ashley's Recycling
70.79 $25,526.49
WASTESHED H: RECYCLING SURVEY

D-28
Appendix D: Solid Waste Authority Recycling Survey/Analysis: CY 2011
Kanawha
Drop-Offs 20
Curbside 8
Tonnage Income Per Unit
Price Markets
Aluminum Cans 18.99 $35,999.00 $0.95 Unknown
Bi-Metal Cans 40.56 $11,832.93 $291.74 Tube City, Rock
Tenn
Cardboard 3,364.01 $505,433.26 $150.25 Caraustar, For
Run
Electronics 250.46 $0.00 $0.00 Scott Recycling
Glass 121.09 $0.00 $0.00 Local
Mixed Metals 51.27 $7,727.70 $150.73 JR Recycling
Mixed Papers 1,830.05 $217,982.11 $119.11 Caraustar
Mixed Plastics 313.94 $81,822.32 $0.13 Blue Ridge,
Mondo
Office Paper 1,174.25 $253,143.10 $215.58 Royal Paper
Stock, Caraustar
7,164.62 $1,113,940.42
Lincoln
Drop-Offs 5
Curbside 0
Tonnage Income Per Unit
Price
Markets
Aluminum Cans 2.31 $0.00 $0.00 Rumpke
Recycling
Bi-Metal Cans 0.10 $0.00 $0.00 Rumpke
Recycling
Commingled Materials 40.26 $0.00 $0.00
Rumpke Recycling
Electronics 9.49 $0.00 $0.00 Unknown
Glass 0.20 $0.00 $0.00 Rumpke
Recycling
Yard Waste 798.50 $0.00 $0.00 Zeke Wood Farm
850.86 $0.00
Logan
Drop-Offs 7
Curbside 0
Tonnage Income Per Unit
Price Markets
Electronics 25.0 $0 $0 PC Renewal
25.00 $0
WASTESHED H: RECYCLING SURVEY (Continued)

D-29
Appendix D: Solid Waste Authority Recycling Survey/Analysis: CY 2011
Mason
Drop-Offs 5
Curbside 0
Tonnage Income Per Unit
Price
Markets
Aluminum Cans 0.56 $745.47 $0.67 WV Cashin Recyclables
Bi-Metal Cans 1.50 $252.48 $168.32 WV Cashin Recyclables
Cardboard 275.84 $21,286.87 $77.17 WV Cashin Recyclables
Mixed Paper 62.75 $3,631.73 $57.88 WV Cashin Recyclables
Mixed Metals 20.95 $4,041.08 $192.89 L & L Recycling
& Scrap
361.60 $29,957.63
Putnam
Drop-Offs 14
Curbside 2
Tonnage Income Per Unit
Price Markets
Electronics 40.00 $0.00 $0.00 Synergy, PC
Renewal
Mixed Metals 50.00 $2,500.00 $50.00 WV Cashin
Mixed Papers 800.00 $0.00 $0.00 WV Cashin
Tires 42.00 $0.00 $0.00 WV Tire Disposal
Yard Waste 400.00 $0.00 $0.00 Local
1,332.00 $2,500.00
Roane
Drop-Offs 4
Curbside 0
Wayne
Drop-Offs 7
Curbside 1
Tonnage Income Per Unit
Price
Markets
Aluminum 0.10 $129.55 $0.67 Taylor's Metals
Cardboard 79.00 $8,939.00 $113.15 Caraustar
Electronics 13.50 $0.00 $0.00 Scott Recycling
Mixed Metals 2.48 $465.60 $187.74 Taylor's Metals
Mixed Papers 41.30 $3,713.40 $89.91 Caraustar
Mixed Plastics 0.50 $0.00 $0.00 Rumpkee
136.88 $13,247.55
WASTESHED H: RECYCLING SURVEY (Continued)

D-30
Appendix D: Solid Waste Authority Recycling Survey/Analysis: CY 2011
Recycling Facilities Recycling Tonnage/Revenue
Drop-Offs 90 Total Recycled 10,391.15
Curbside 13 Total Recycling Income $1,216,083.09
Recycling Materials Collected in Wasteshed H: 2011
Tonnage Income
Aluminum Cans 29.46 $47,356.02
Bi-Metal Cans 49.28 $13,150.41
Cardboard 4,063.75 $558,691.71
Commingled Material 40.26 $0.00
Glass 121.29 $0.00
Electronics 341.42 $0.00
Magazines 18.00 $1,674.00
Lead Acid Batteries 3.30 $1,899.00
Metals, Ferrous 3.20 $0.00
Metals, NonFerrous 5.20 $9,654.00
Metals, Mixed 124.70 $14,734.38
Paper, Newsprint 61.70 $3,007.00
Paper, Office 1,174.25 $253,143.10
Paper, Mixed 2,800.10 $230,877.15
Plastics, Mixed 314.74 $81,896.32
Tires 42.00 $0.00
Yard Waste 1,198.50 $0.00
Total 10,391.15 $1,216,083.09
*Aluminum Cans and Plastics priced per lb., all other materials priced per ton.
0% 0%
39%
0% 1%
3%
0% 0%
0%
0%
1%
1%
11%
27%
3% 0% 12%
Wasteshed H: Recyclable Materials Collected by Tonnage
Aluminum Cans
Bi-Metal Cans
Cardboard
Commingled Material
Glass
Electronics
Magazines
Lead Acid Batteries
Metals, Ferrous
Metals, Nonferrous
Metals, Mixed
Paper, Newsprint
Paper, Office
Paper, Mixed
Plastics, Mixed
Tires
Yard Waste
WASTESHED H: RECYCLING ANALYSIS
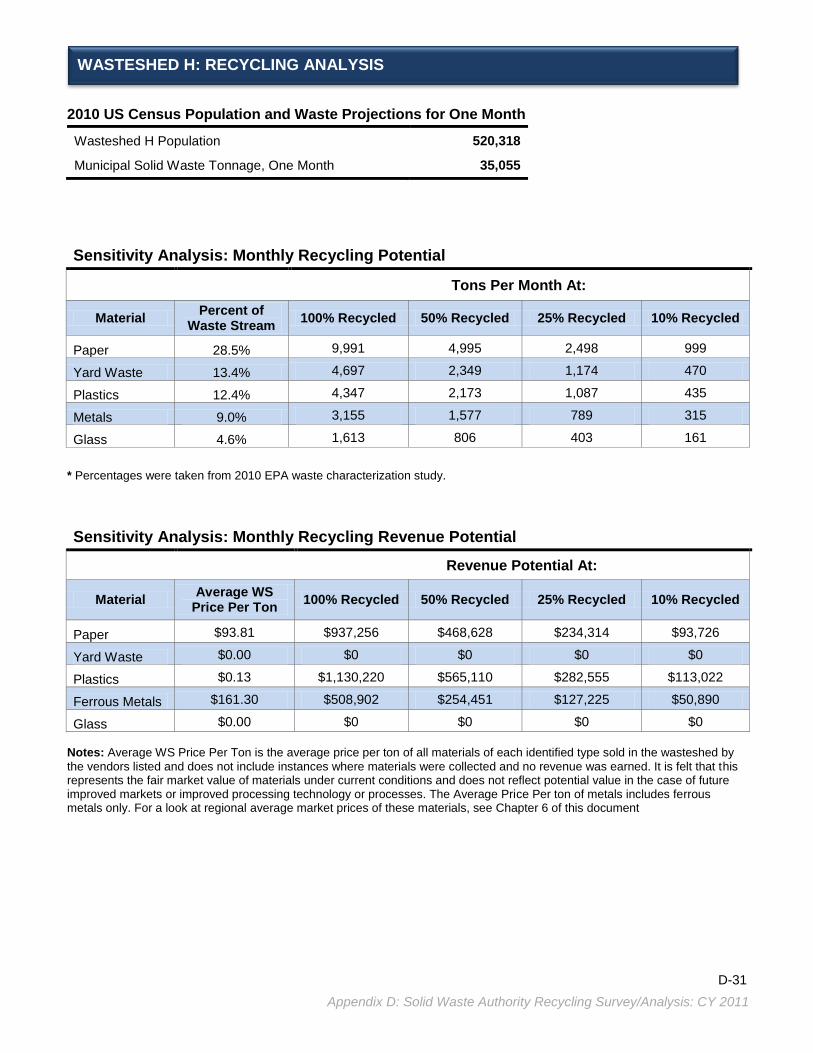
D-31
Appendix D: Solid Waste Authority Recycling Survey/Analysis: CY 2011
2010 US Census Population and Waste Projections for One Month
Wasteshed H Population 520,318
Municipal Solid Waste Tonnage, One Month 35,055
Sensitivity Analysis: Monthly Recycling Potential
Tons Per Month At:
Material Percent of
Waste Stream 100% Recycled 50% Recycled 25% Recycled 10% Recycled
Paper 28.5% 9,991 4,995 2,498 999
Yard Waste 13.4% 4,697 2,349 1,174 470
Plastics 12.4% 4,347 2,173 1,087 435
Metals 9.0% 3,155 1,577 789 315
Glass 4.6% 1,613 806 403 161
* Percentages were taken from 2010 EPA waste characterization study.
Sensitivity Analysis: Monthly Recycling Revenue Potential
Revenue Potential At:
Material Average WS
Price Per Ton 100% Recycled 50% Recycled 25% Recycled 10% Recycled
Paper $93.81 $937,256 $468,628 $234,314 $93,726
Yard Waste $0.00 $0 $0 $0 $0
Plastics $0.13 $1,130,220 $565,110 $282,555 $113,022
Ferrous Metals $161.30 $508,902 $254,451 $127,225 $50,890
Glass $0.00 $0 $0 $0 $0
Notes: Average WS Price Per Ton is the average price per ton of all materials of each identified type sold in the wasteshed by
the vendors listed and does not include instances where materials were collected and no revenue was earned. It is felt that this represents the fair market value of materials under current conditions and does not reflect potential value in the case of future improved markets or improved processing technology or processes. The Average Price Per ton of metals includes ferrous metals only. For a look at regional average market prices of these materials, see Chapter 6 of this document
WASTESHED H: RECYCLING ANALYSIS

D-32
Appendix D: Solid Waste Authority Recycling Survey/Analysis: CY 2011
Beckley, City of
Tons Revenue Markets
Commingled Material 327.30 $0 Raleigh County SWA
327.30 $0
Bluefield, City of
Tons Revenue Markets
Aluminum Cans 1.70 $0 Mercer County SWA
Bi-Metal Cans 6.70 $0 Mercer County SWA
Cardboard 92.70 $0 Mercer County SWA
Mixed Paper 25.30 $0 Mercer County SWA
Newspaper 25.30 $0 Mercer County SWA
Plastics, Pet 11.80 $0 Mercer County SWA
Plastics, HDPE 5.10 $0 Mercer County SWA
168.60 $0
Charleston, City of
Tons Revenue
Markets
Mixed Paper 989.40 $0.00 Kanawha SWA
Mixed Metals 115.00 $18,832.00 Allen’s Recycling
Mixed Plastics 115.30 $0.00 Kanawha SWA
Electronics 85.70 $0.00 Kanawha SWA
Tires 29.00 $0.00 WV Tire Disposal
Yard Waste 1,580.30 $4,982.00 Local
2,914.70 $23,814.00
Clarksburg, City of
Failed to Report
Fairmont, City of
Failed to Report
Huntington, City of
Failed to Report
Morgantown, City of
Tons Income Markets
Commingled Materials 73.70 $0 Monongalia SWA
73.70 $0
MANDATED MUNICIPALITY RECYCLING SURVEY

D-33
Appendix D: Solid Waste Authority Recycling Survey/Analysis: CY 2011
Martinsburg, City of
Tons Revenue Markets
Glass, Clear 9.34 $0 Southern Scrap
Glass, Amber 14.6 $0 Southern Scrap
Glass, Green 6.3 $0 Southern Scrap
Mixed Metals 11.3 $0 Southern Scrap
Newspaper 23.9 $0 Southern Scrap
Yard Waste 65.4 $0 Local
130.84 $0
Parkersburg, City of
Tons Revenue Markets
Aluminum Cans 15.43 $20,510.51 JR Recycling
Bi-Metal Cans 53.70 $11,009.50 JR Recycling
Glass, Clear 54.40 $249.28 Bradish Glass
Glass, Amber 40.80 $0.00 Bradish Glass
Glass, Green 32.20 $0.00 Bradish Glass
Mixed Paper 894.00 $111,563.02 Caraustar
Plastic, HDPE 57.40 $8,026.00 Mondo Polymer
Plastic, PET 79.60 $47,796.20 Caraustar
1,227.53 $199,154.51
South Charleston, City of
Tons Revenue Markets
Aluminum Cans 6.00 $0 Unknown
Bi-Metal Cans 26.00 $0 Unknown
Cardboard 10.00 $0 Unknown
Glass, Clear 12.00 $0 Unknown
Mixed Metals 10.00 $0 Unknown
Mixed Paper 32.00 $0 Unknown
Office Paper 26.00 $0 Unknown
Newspaper 102.00 $0 Unknown
Plastics, PET 40.00 $0 Unknown
264.00 $0
MANDATED MUNICIPALITY RECYCLING SURVEY (Continued)

D-34
Appendix D: Solid Waste Authority Recycling Survey/Analysis: CY 2011
St. Albans, City of
Tons Revenue Markets
Aluminum Cans 0.42 $0 Unknown
Bi-Metal Cans 19.69 $0 Unknown
Cardboard 5.35 $0 Unknown
Mixed Metals 6.26 $0 Unknown
Mixed Paper 290.97 $0 Unknown
Plastics, HDPE 9.85 $0 Unknown
Yard Waste 200.00 $0 Unknown
532.54 $0
Vienna, City of
Tons Revenue Markets
Mixed Metals Unknown Unknown Unknown
Mixed Paper Unknown Unknown Unknown
Mixed Plastics Unknown Unknown Unknown
Weirton, City of*
Tons Revenue
Markets
Cardboard 924.00 Unknown Unknown
Glass 1,620.00 Unknown Unknown
Mixed Metals 768.00 Unknown Unknown
Newspaper 960.00 Unknown Unknown
Yard Waste 800.00 Unknown Unknown
5,072.00
*Information from 2009
Wheeling, City of*
Tons Revenue Markets
Commingled Materials 550.00 Unknown JD Miller Company
550.00
*Information from 2009.
MANDATED MUNICIPALITY RECYCLING SURVEY (Continued)

D-35
Appendix D: Solid Waste Authority Recycling Survey/Analysis: CY 2011
Total Materials and Revenue
Total Recyclable Materials 11,261.21
Total Recycling Revenue $222,968.51
Materials Collected by Municipalities
Tons Revenue
Aluminum Cans 23.55 $20,510.51
Bi-Metal Cans 106.09 $11,009.50
Cardboard 1,032.05 $0.00
Commingled Materials 951.00 $0.00
Electronics 85.70 $0.00
Glass 1,789.64 $249.28
Mixed Metals 910.56 $18,832.00
Paper - Newspaper 1,111.20 $0.00
Paper - Office 26.00 $0.00
Mixed Paper 2,231.67 $111,563.02
Mixed Plastics 115.30 $0.00
Plastics HDPE 72.35 $8,026.00
Plastics PET 131.40 $47,796.20
Tires 29.00 $0.00
Yard Waste 2,645.70 $4,982.00
11,261.21 $222,968.51
0.0
500.0
1,000.0
1,500.0
2,000.0
2,500.0
3,000.0
Most Often Recycled Materials by Municipalities
To
ns R
ecy
cle
d
MANDATED MUNICIPALITY RECYCLING SUMMARY

D-36
Appendix D: Solid Waste Authority Recycling Survey/Analysis: CY 2011
SWA Recycling Data Per Wasteshed*
Drop-Offs Curbside Tonnage Income
Wasteshed A 43 4 3,387.61 $30,081.00
Wasteshed B 106 26 7,147.56 $822,449.74
Wasteshed C 27 6 1,989.38 $164,250.90
Wasteshed E 87 4 6,118.89 $104,890.62
Wasteshed F 25 4 1,855.71 $563,142.00
Wasteshed G 112 7 6,638.09 $561,299.59
Wasteshed H 90 13 10,391.15 $1,216,083.09
490 64 37,528.39 $3,462,196.94
*Drop-off recycling programs include school programs and single item collection centers such as facilities than just accept motor oil. This table includes all drop-off and curbside programs in the wasteshed. Recycling tonnage and income are collected by SWA recycling centers.
0
20
40
60
80
100
120
Wasteshed A Wasteshed B Wasteshed C Wastesged E Wasteshed F Wasteshed G Wasteshed H
Recycling Program Availability On a Per Wasteshed Basis
Drop-Offs Curbside
SOLID WASTE AUTHORITY 2011 RECYCLING SURVEY SUMMARY

D-37
Appendix D: Solid Waste Authority Recycling Survey/Analysis: CY 2011
Tonnages Collected by Solid Waste Authority Recycling Programs: 2011
WS A WS B WS C WS E WS F WS G WS H Totals
Paper, Mixed 1,651.50 384.96 471.71 1,556.01 96.74 2,446.89 2,800.10 9,407.91
Cardboard 0.00 3,439.19 532.40 135.47 771.76 122.38 4,063.75 9,064.95
Yard Waste 1,300.00 73.20 150.00 2,227.00 0.00 3,283.28 1,198.50 8,231.98
Paper, Office 0.00 1,355.41 26.84 0.00 128.00 0.00 1,174.25 2,684.50
Electronics 60.21 157.25 26.69 288.45 136.04 211.84 341.42 1,221.90
Commingled Material 129.00 0.00 0.00 1,000.00 0.00 9.37 40.26 1,178.63
Glass 0.00 504.80 154.99 343.75 0.00 0.00 121.29 1,124.83
Paper, Newsprint 0.00 529.54 38.33 0.00 215.00 0.00 61.70 844.57
Metals, Ferrous 195.80 141.94 12.00 200.00 0.00 140.78 3.20 693.72
Plastics, Mixed 15.80 39.50 43.10 35.54 94.00 129.07 314.74 671.75
Metals, NonFerrous 6.90 0.00 470.00 0.00 0.00 0.00 5.20 482.10
White Goods 0.00 24.00 0.00 0.00 28.11 230.98 0.00 283.09
Metals, Mixed 0.00 0.00 10.00 0.00 0.00 0.00 124.70 134.70
Bi-Metal Cans 7.40 92.63 6.55 58.17 3.35 0.00 49.28 217.38
Plastics, PET 0.00 180.40 0.00 11.40 0.00 0.00 0.00 191.80
Aluminum Cans 0.00 58.88 11.07 20.70 99.00 59.70 29.46 278.81
Tires 7.00 36.96 25.70 0.00 84.14 0.00 42.00 195.80
Magazines 0.00 0.00 0.00 0.00 106.00 0.00 18.00 124.00
Plastics, HDPE 0.00 128.90 0.00 5.00 0.00 0.00 0.00 133.90
Wood 0.00 0.00 0.00 120.00 0.00 0.00 0.00 120.00
Textiles 0.00 0.00 10.00 99.30 0.00 0.00 0.00 109.30
Scrap Metal 0.00 0.00 0.00 0.00 93.57 0.00 0.00 93.57
Other Waste 14.00 0.00 0.00 18.10 0.00 0.00 0.00 32.10
Lead Acid Batteries 0.00 0.00 0.00 0.00 0.00 3.80 3.30 7.10
3,387.61 7,147.56 1,989.38 6,118.89 1,855.71 6,638.09 10,391.15 37,528.39
0.0
2,000.0
4,000.0
6,000.0
8,000.0
10,000.0
Paper, Mixed Cardboard Yard Waste Paper, Office CommingledMaterial
Top Five Materials in Terms of Tonnage
SOLID WASTE AUTHORITY 2011 RECYCLING SURVEY SUMMARY (Continued)

D-38
Appendix D: Solid Waste Authority Recycling Survey/Analysis: CY 2011
Revenue Earned by Solid Waste Authority Recycling Programs: 2011
WS A WS B WS C WS E WS F WS G WS H Totals
Cardboard $0.00 $392,693.48 $64,658.45 $3,797.12 $101,246.00 $8,792.02 $558,691.71 $1,129,878.78
Paper, Mixed $12,497.00 $8,216.99 $46,452.03 $15,178.40 $0.00 $335,713.43 $230,877.15 $648,935.00
Paper, Office $0.00 $149,942.64 $6,686.00 $0.00 $39,756.00 $0.00 $253,143.10 $449,527.74
Aluminum Cans $0.00 $57,491.59 $14,469.88 $16,335.00 $169,113.00 $43,851.07 $47,356.02 $348,616.56
Metals, Mixed $0.00 $0.00 $5,000.00 $0.00 $166,347.00 $59,312.02 $14,734.38 $245,393.40
Plastics, Mixed $4,324.00 $500.00 $10,531.80 $1,000.00 $43,433.00 $71,003.37 $81,896.32 $212,688.49
Plastics, PET $0.00 $77,332.13 $0.00 $2,100.00 $0.00 $0.00 $0.00 $79,432.13
Metals, Ferrous $3,984.00 $32,018.74 $2,339.92 $30,000.00 $0.00 $0.00 $0.00 $68,342.66
Paper, Newsprint $0.00 $21,226.41 $3,890.83 $0.00 $28,935.00 $0.00 $3,007.00 $57,059.24
Bi-Metal Cans $1,910.00 $24,513.15 $518.00 $11,708.10 $0.00 $0.00 $13,150.41 $51,799.66
Plastics, HDPE $0.00 $49,385.09 $0.00 $0.00 $0.00 $0.00 $0.00 $49,385.09
White Goods $0.00 $0.00 $0.00 $0.00 $344.00 $41,223.68 $0.00 $41,567.68
Commingled Material
$4,777.00 $0.00 $0.00 $12,372.00 $0.00 $0.00 $0.00 $17,149.00
Metals, NonFerrous $2,589.00 $0.00 $4,475.00 $0.00 $0.00 $0.00 $9,654.00 $16,718.00
Magazines $0.00 $0.00 $0.00 $0.00 $13,241.00 $0.00 $1,674.00 $14,915.00
Yard Waste $0.00 $0.00 $0.00 $12,400.00 $0.00 $0.00 $0.00 $12,400.00
Tires $0.00 $5,916.00 $0.00 $0.00 $727.00 $0.00 $0.00 $6,643.00
Glass $0.00 $3,213.52 $1,228.99 $0.00 $0.00 $0.00 $0.00 $4,442.51
Textiles $0.00 $0.00 $4,000.00 $0.00 $0.00 $0.00 $0.00 $4,000.00
Lead Acid Batteries $0.00 $0.00 $0.00 $0.00 $0.00 $1,404.00 $1,899.00 $3,303.00
Electronics $0.00 $0.00 $0.00 $0.00 $0.00 $0.00 $0.00 $0.00
Other Waste $0.00 $0.00 $0.00 $0.00 $0.00 $0.00 $0.00 $0.00
Wood $0.00 $0.00 $0.00 $0.00 $0.00 $0.00 $0.00 $0.00
$30,081.00 $822,449.74 $164,250.90 $104,890.62 $563,142.00 $561,299.59 $1,216,083.09 $3,462,196.94
$0
$500,000
$1,000,000
$1,500,000
Cardboard Paper, Mixed Paper, Office AluminumCans
Plastics,Mixed
Top Five Materials Collected in Terms of Recycling Revenue
SOLID WASTE AUTHORITY 2011 RECYCLING SURVEY SUMMARY (Continued)

Appendix E
Recycle Infrastructure and Market Development in Other States

E-1
Appendix E: Recycle Infrastructure and Market Development in Other States
Appendix E: Recycle Infrastructure and Market Development in Other States
West Virginia: Recycle Market Development
Funding Sources Many of West Virginia’s environmental programs are financed through an $8.25 waste assessment fee collected at the landfills. Sixteen percent of this fee goes to the state’s recycling programs.
Recycling Incentives
The state, in accordance with WV Code §22C-4-30(e)(4), makes disposal-tax waivers available for commercial recyclers which dispose of 30%, or less, of total waste processed for recycling. Both of West Virginia’s recycling grant programs are competitive in nature requiring projects to impact a significant and measurable reduction in the municipal solid waste stream. Curbside recycling is available to approximately one third of the state’s population.
Recycling Programs
The Solid Waste Management Board’s (SWMB) Recycling, Market Development & Planning Section provides recycling, market development and other technical assistance to the 50 local solid waste authorities, businesses, government entities and others through grants, individual consulting, internet based marketing services, environmental training, and other programs. Local solid waste authorities are required to have an approved recycling plan on file with the SWMB. The Recycling, Market Development & Planning Section manages the West Virginia Materials Exchange, one of the state’s grant programs, and assists with special projects such as electronics recycling. The West Virginia Division of Energy publishes a state recycling directory, and provides financing and training applicable to recycling facilities.
Recycling Mandates
The state has mandated curbside recycling for cities with populations of over 10,000. Local solid waste authorities are required to keep an approved recycling plan on file with the Solid Waste Management Board. State agencies and instrumentalities of the state are encouraged to purchase recycled products. Senate Bill 746, mandating manufacturers of covered electronic devices, doing business in West Virginia, register with the WV DEP, became effective April 15, 2010. The goal of this law is to establish a registration process for manufacturers of covered electronic devices, to determine if they had adopted or implemented a take back/recycling program that is free to the public. Fees associated with registration are awarded to counties and municipalities for recycling or other programs that divert covered electronic devices from the waste stream. The bill also established penalties for noncompliance. The legislature followed up with a ban on the disposal of covered electronic devices in solid waste landfills, effective January 1, 2011.
Landfill Bans West Virginia bans yard waste, lead acid batteries, tires, and effective January 1, 2011, covered electronic devices.
Recycling Grants/Loans
West Virginia provides three grant programs; the Department of Environmental Protection’s Rehabilitation Environmental Action Plan (REAP) Recycling Assistance Grant Program, Covered Electronic Devices (CED) Grant Program, and the SWMB grant program. REAP grants are available to government entities, nonprofits, private sector businesses, and solid waste authorities. The CED grant program is funded through registration fees collected from manufacturers and are available to counties and municipalities for electronic recycling events and programs. SWMB grant program is available to local solid waste authorities only.
Recycling Budget West Virginia’s FY 2012 recycling grant programs distributed $1.85 million.
Recycling Goals West Virginia has no mandated recycling goals. It had a mandated waste diversion goal of 50% by 2010, which expired and has not been renewed. West Virginia has no penalties for not meeting its diversion goals.
Recycling Rate A study completed in the Spring of 2002 by the WV Recycling Measurement Committee, a group of both public and private sector individuals, indicated that 16% of the waste stream was being recycled at the time. This figure is deceptive due to lack of reporting requirements.
Recycling Reporting Requirements
West Virginia has no recycling reporting requirements for community recycling centers, commercial recyclers, materials processing centers, or scrap yards. West Virginia’s 50 local Solid Waste Authorities are required to submit a Recycling Plan to the Solid Waste Management Board, and to update that plan every 5 years. The state’s Covered Electronic Devices program requires manufacturers to file annual recycling reports with the Secretary of the Department of Environmental Protection and to post the information on the internet.

E-2 Appendix E: Recycle Infrastructure and Market Development in Other States
Kentucky: Recycle Market Development
Funding Sources
Kentucky assesses a $1.75 tipping fee on all landfill disposals (KRS 224.43-500). Fees are deposited into Kentucky PRIDE, a restricted fund used for orphan landfill remediation, illegal dump cleanups, recycling development and household hazardous waste collection grants. Counties have primary responsibility for solid waste management within their borders and authority to place a surcharge on property taxes to pay for waste management services. Most of the responsibility for recycling in Kentucky lies with local government.
Recycling Incentives Kentucky provides grant funding to government entities to develop and expand recycling. There is a 50% tax credit (KRS 141.390) available on the purchase of recycling equipment that exempts purchases from state and local sales and use tax that processes postconsumer waste and compost.
Recycling Programs
The DEP - Division of Waste Management operates a scrap paper and cardboard recycling program for all state government offices located in Frankfort/Franklin County (the capital) and averages over 1,500 tons per year. Some form of recycling program exists in most Kentucky counties ranging from convenience and drop-off centers to curbside single stream collection. The Recycling Assistance Section in the DWM provides technical assistance in designing and evaluating recycling programs and provides monthly market prices and trend information. The Kentucky Pollution Prevent Center at the University of Louisville provides waste audits for business and industry to encourage waste diversion and manages the Kentucky Industrial Materials Exchange.
Recycling Mandates
Kentucky has two state statues that require all state agencies and state supported institutions of higher learning to recycle paper and cardboard, and requires all public school districts to recycle paper and cardboard (KRS 224.10-650 and KRS 160.294). Most state colleges and universities have recycling programs that go beyond statutory requirements. The City of Vanceburg has an ordinance requiring mandatory recycling for its residents.
Landfill Bans Kentucky bans whole tire and lead acid battery disposal and has a waste tire remediation program.
Recycling Grants/Loans
Kentucky provides grants from the KY PRIDE Fund to government entities for the establishment and expansion of the recycling infrastructure across the state as well as Household Hazardous Waste collection events (KRS 224.43-505).
Recycling Budget The state released $3,919,361 for 2012 – 2013 Kentucky Pride Grants. This included $3,588,961 in Recycling Grants and $330,400 in Household Hazardous Waste Grants.
Recycling Goals Senate Bill 2, enacted in 1997, established a 25% waste reduction goal for the state. This goal was not met and was not reauthorized. In 2002, HB 174 and in 2007, SB 50 amended various parts of the state’s waste management statutes but did not include new waste reduction goals.
Recycling Rate Kentucky’s common household recyclables (aluminum, cardboard, steel, plastic, newspaper, glass and paper) recycling rate for 2011 was 28.8%.
Recycling Reporting It is required for counties to report in the Annual Solid Waste Update.
Maryland: Recycle Market Development
Funding Sources
State funding for recycling comes from the State’s General Fund and from the State Recycling Trust Fund. The Trust Fund is financed through electronic manufacturer registration fees, and telephone directory and newspaper publisher fines, as well as a $1 per mercury vehicle switch recovered by vehicle recyclers and scrap recyclers as partial compensation to the Department from manufacturers for the oversight of the Mercury Vehicle Switch Recovery Program. The used scrap tire fund is supported through an 80¢/tire fee paid on the purchase of new tires in Maryland. The counties have the authority from the State to place a surcharge on trash bills and/or a surcharge on tipping fees collected at the state’s landfills.

E-3 Appendix E: Recycle Infrastructure and Market Development in Other States
Maryland: Recycle Market Development
Recycling Incentives
State and local authorities can prohibit the issuance of building permits for all new construction for failure to reach mandated recycling rates. Additionally, telephone directory and newspaper publishers are subject to fines of $10/ton for each ton they are short of the tons required to reach the 40% recycled content mandate. Maryland counties and municipalities are eligible for State electronic recycling grants. The grants are funded through annual electronic manufacturer registration fees.
Recycling Programs
Local recycling programs, required as a result of the 1988 Maryland Recycling Act, are run by local government. The State of Maryland does not operate recycling programs. The Maryland Department of the Environment (MDE) assists Maryland State government agencies with their mandated recycling programs through the All StAR (All State Agencies Recycle) program. MDE operates the Maryland Scrap Tire Program which ensures the proper disposal (recycling) of scrap tires as well as providing oversight of the Maryland Recycling Trust Fund. The fund awards electronic recycling grants to local jurisdictions. The Maryland Department of the Environment (MDE) assists each county in developing an acceptable recycling plan through technical assistance to the local governments, coordinates the efforts of the State to facilitate the implementation of the recycling goals at the county level, reviews all recycling plans submitted as part of a county plan, and administers the Statewide Electronics Recycling Program.
Recycling Mandates
The 1988 Maryland Recycling Act (MRA) requires each jurisdiction to develop and implement recycling programs, and achieve a reduction of solid waste by recycling 20% for jurisdictions with populations greater than 150,000 or 15% for jurisdictions with populations less than 150,000. In no case is the recycling rate to be less than 10%. Additionally, the MRA requires State Government to reduce by recycling, the amount of the solid waste generated for disposal by at least 20%, or to an amount that is determined practical and economically feasible, but in no case may the amount to be recycled be less than 10%. Telephone directories and newsprint distributed in the State must use 40% recycled content paper. Additional legislation impacting recycling in Maryland includes requiring permits for private natural wood waste recycling facilities, requiring mercuric oxide battery manufacturers to be responsible for the collection, transportation and recycling or disposal of these batteries sold or offered for promotional purposes in the State, establishing a program or system for the collection, recycling, or disposal of each cell, rechargeable battery or rechargeable product sold in the State, prohibiting the sale of mercury thermometers and thermostats; and requiring manufacturers of computers and video display devices who sell or offer for sale their product in Maryland to register and pay a fee to MDE.
Landfill Bans
The State bans separately collected yard waste, tires, infectious waste, controlled hazardous waste, liquid waste, radioactive hazardous substances, automobiles, unflattened drums or tanks, animal carcasses from medical research activities or destruction of diseased animals, untreated septic or sewage waste and chemical or petroleum cleanup materials from landfills.
Recycling Grants/Loans
MDE periodically offers electronics recycling grants to counties, who have addressed methods for the separate collection and recycling of covered electronic devices in their recycling plans and to municipalities to implement local covered electronic device recycling programs, MDE pays for innovative scrap tire recycling projects operated through the Maryland Environmental Service.
Recycling Budget Maryland’s FY 2011 recycling budget was approximately $2.67 million. This amount is the state budget only and does not include local input.
Recycling Goals Maryland has a voluntary waste diversion goal of 40%. The waste diversion goal is comprised of a recycling percentage, plus a source reduction credit of up to 5%.

E-4 Appendix E: Recycle Infrastructure and Market Development in Other States
Maryland: Recycle Market Development
Recycling Rate Maryland’s 2010 MRA Waste Diversion Rate is 44.6%. It is comprised of a 41.0% recycling rate and a 3.6% source reduction credit.
Recycling Reporting Requirements
Maryland Counties are required to report by April 1st, annually, to MDE on their waste diversion activities for the previous calendar year. State government is required to report annually to MDE on their recycling programs. Newspaper publishers are required to report quarterly and annually on their use of recycled content newsprint. Telephone directory publishers are required to report annually on their use of recycled content directory stock. Maryland also has reporting requirements for electronics, tires and mercury switches.
North Carolina Recycle Market Development
Funding Sources North Carolina funds its recycling programs through their solid waste trust fund which receives funding from waste disposal fees on tires, a $2.00 Solid Waste Disposal Tax and white goods.
Recycling Incentives
A tax incentive for recycling and resource recovery facilities and equipment was adopted in 1976 and amended in 1991. Under this provision, recycling businesses may be entitled to special tax treatment for real and personal property tax, corporate state income tax and franchise tax on domestic and foreign corporations. They have an accelerated depreciation option for recycling equipment to encourage the purchase of new equipment and use a franchise exemption for recycling businesses.
Recycling Programs
The Recycling Business Assistance Center (RBAC) is a partnership of the North Carolina Department of Environment and Natural Resources, Division of Pollution Prevention and Environmental Assistance, and The Department of Commerce. RBAC provides recycling business development assistance, financing for recycling businesses, a directory of markets for recyclable materials, recycling markets assistance partnerships and various publications.
Recycling Mandates
Senate Bill 1492, passed in 2007, requires computer equipment (excludes TVs) manufacturers to develop and implement recycling plans as of January 2009. Manufacturers must fully cover the costs of processing discarded computer equipment received from discarded computer equipment collectors. In March of 2005, the North Carolina General Assembly passed a measure requiring holders of certain Alcoholic Beverage Commission permits to implement a program to separate, store, and recycle all beverage containers generated at their establishments. The law became effective January 1, 2008.
Landfill Bans
More than any state in the region, North Carolina uses landfill bans to stimulate the recycling sector. Statewide they ban aluminum cans, lead-acid batteries, used motor oil and filters, antifreeze, whole tires, white goods, wood pallets, plastic bottles, oil filters, beverage containers, oyster shells, and yard waste. Effective July 1, 2011, North Carolina also bans electronic waste and fluorescent lights and thermostats that contain mercury. In addition to statewide bans many of the state’s 100 counties have bans on certain recyclable materials such as newspaper, plastic, office paper, wood, steel and glass. Many localities ban identified types of recyclable materials from landfills but give clients the option of paying a surcharge to tipping fees if they wish to landfill rather than recycle.
Recycling Grants/Loans
Recycling grants are targeted at areas of recycling that administrators feel need attention. Eligible applicants include local government entities, manufacturing industries and service industries. Eligible uses of funds include startup financing, research and development, machinery and equipment and expansion financing. For the year 2010, Business Development grants issued - $700,000, community recycling grants - $750,000, abandoned mobile home recycling grants - $105,000 and curbside rollout cart grants - $548,000.

E-5 Appendix E: Recycle Infrastructure and Market Development in Other States
North Carolina Recycle Market Development
Budget The budget for recycling, including appropriations and the solid waste trust fund for FY 2010, was $4.2 million (note: this does not include funds from the tire and white goods taxes that go directly to the counties to help them manage those materials.)
Recycling Goals In 2008 North Carolina established a goal to recover 2 million tons of recyclable material by 2012.
Recycling Rate Recycling by Type - FY 2009 local government recovery by type for different programs include 43% for curbside collection, 33% for drop-off programs, 1% mixed waste, and 23% for other programs.
Recycling Reporting Requirements
Counties and localities are required to report solid waste and recycling activities within their areas to the state by the first day of December each year. Private firms must report by the first day of August each year.
Ohio: Recycle Market Development
Funding Sources
The Ohio Department of Natural Resources (ODNR), Division of Recycling & Litter Prevention is funded by a Construction & Demolition Debris (CDD) statewide fee enacted on July 1, 2005. The portion of the fee, which is dedicated to the division amounts to $0.60 per ton of CDD material disposed in Ohio facilities. In addition, the division receives $1 million dollars annually from the Ohio Environmental Protection Agency (OEPA) for the purpose of scrap tire market development. These funds originate from Ohio’s fee on the purchase of tires ($1.00 per tire at the point of sale) and are collected by OEPA.
Recycling Incentives Not Applicable.
Recycling Programs
ODNR manages Ohio’s grant programs including the Market Development Grant and Scrap Tire Grant. Additionally, the division provides grants (Community Development Grant) for the establishment and operation of community based recycling projects and litter control grants. Other services include technical guidance to state agencies and colleges/universities in the implementation of local recycling programs.
Recycling Mandates Not Applicable.
Landfill Bans Ohio bans scrap tires, lead acid batteries and yard waste.
Recycling Grants/Loans
ODNR offers Market Development Grants to Ohio cities with a population greater than 50,000, Ohio counties and Ohio solid waste management districts or authorities to implement recycling, litter collection and recycling market development projects. Businesses or non-profit organizations seeking market development funding must secure a sponsor to serve as the grant applicant. All agencies of the state are eligible to apply for Scrap Tire Grant funding. Market Development Grants funding is targeted at processors and manufacturers seeking to purchase equipment, which allows them to utilize recyclable materials collected in Ohio. The Scrap Tire Grant Program targets scrap tire processors, tire derived fuel facilities, rubberized mulch and crumb rubber operations, research and development firms and other entities for expenses related to the use of scrap tires or scrap tire material.
Budget Ohio’s FY 2012 market development, community development and scrap tire grant budget was about $4.5 million. Ohio also distributed $150,000 for its litter control grant program.

E-6 Appendix E: Recycle Infrastructure and Market Development in Other States
Ohio: Recycle Market Development
Recycling Goals
The 2001 OEPA statewide solid waste plan sets out the following goals: Ensure the availability of reduction, recycling and minimization alternatives for municipal solid
waste, also known as the “Access Goal.” Reduce and/or recycle at least 25 percent of the residential/commercial solid waste and 66 percent
of the industrial solid waste generated by each SWMD and 50 percent of all solid waste generated statewide by the year 2005.
Outreach and Education: provide informational and technical assistance on source reduction. Provide informational and technical assistance on recycling, reuse and composting opportunities.
Each Solid Waste Management District (SWMD) must provide a website. Establish strategies for scrap tires, yard waste, lead acid batteries and household hazardous
waste. Direct local solid waste management districts and authorities to evaluate the feasibility of
incorporating economic incentives into their source reduction and recycling programs. Measure Greenhouse Gas Reduction using the EPA Waste Reduction Model. Provide a market development strategy. Each SWMD has the option of developing a market
development strategy. Each SWMD shall report annually to the Ohio EPA regarding implementation of its solid waste
management plan.
Recycling Rate OEPA references Ohio’s overall recycling rate statewide in 2009 to be 26%. This recycling rate includes residential and commercial recycling activity within the state of Ohio.
Recycling Reporting Requirements
Ohio’s SWMDs shall report annually to the Ohio EPA regarding implementation of its solid waste management plan.
Pennsylvania: Recycle Market Development
Funding Sources Pennsylvania funds their programs with a $2 per ton landfill and resource recovery facility tipping fee. State funding for recycling program staff is from the General Fund.
Recycling Incentives As incentives to municipalities, Pennsylvania provides recycling performance grants based on quantity of materials recycled. They also believe the widespread availability of curbside recycling is an incentive to recycle. Over 900 communities provide curbside collection.
Recycling Programs
Pennsylvania Department of Environmental Protection efforts are directed toward electronics recycling, pharmaceutical collections, tire recycling, and household hazardous waste management. The DEP also oversees agreements with other state agencies to encourage the use of recycled materials into their daily operations.
Recycling Mandates Pennsylvania has mandated curbside recycling for all municipalities with populations of more than 10,000, or more than 5,000 that also have a population density of greater than 300-persons per square mile.
Recycling Grants/Loans
According to the PA’s budget, dated February 7, 2012, for FY 2013, the PA DEP made $38.3 million available for recycling programs in general, and allocated $30.2 million of that for grants. Of that amount, $12.2 million went for municipal Recycling Grants, $16 million for municipal recycling performance grants and $2 million for county planning grants.
Landfill Bans Lead acid batteries, whole tires and yard waste are banned.
Recycling Budget Pennsylvania’s FY 2013 recycling budget is $38.3 million, down from $46.7 in FY 2010 and $67.8 in FY 2008.

E-7 Appendix E: Recycle Infrastructure and Market Development in Other States
Pennsylvania: Recycle Market Development
Recycling Goals
A 1988 law, Act 101, required the state to recycle 25% of its municipal waste by January 1, 1997. The goal was met. Although no new legislation was passed, the governor announced a new voluntary goal in 1997 of a 35% recycling rate for municipal waste by 2005. The goal was exceeded in 2001. Pennsylvania has civil and other penalties for not meeting recycling goals. No new recycling goal has been established.
Recycling Rate Pennsylvania does not promote the use of a recycling rate.
Recycling Reporting Requirements
None.
Virginia: Recycle Market Development
Funding Sources
Virginia funds its recycling programs through various forms of business taxation. Each business owner pays a $10 “owner’s fee” type of litter control tax, and an additional $15 fee for each establishment the company owns. Carbonated soft drink wholesalers and distributors pay a litter tax, which is scaled to their gross receipts. They also have a beer and wine litter tax. Virginia counties have authority from the state to levee a consumer utility tax to cover the cost of solid waste management, which can be used for recycling.
Recycling Incentives Virginia makes income tax credits (10% of the purchase price) available to corporations, and individuals for the purchase of recycling equipment. They have a specific exemption for those that accept used motor oil. The state gives local governments the authority to exempt recycling businesses from property tax.
Recycling Mandates
Each town, city, and county is mandated to have a recycling program as part of a solid waste management plan on file with the DEQ. For CY 2006, all localities (counties, cities and towns or regional program units) are required to recycle at least 15% or 25% of their MSW. A new law effective July 1, 2006, established the two tiered recycling rate based upon population and/or unemployment levels (populations less than 100 persons per square mile or unemployment 50% or more above the statewide average.)
Recycling Programs
The Virginia Department of Business Assistance offers financing programs, workforce training programs, and consulting services to businesses operating in Virginia including those in the recycling industries.
Landfill Bans Virginia bans lead acid batteries, whole tires, and free liquids from landfills. Jurisdictions may ban CRTs if they have a program in place to otherwise manage the CRTs. A new law in 2010 will allow jurisdictions to ban mercury thermostats from the landfill if they have a program to otherwise manage the thermostats.
Recycling Grants/Loans
Virginia’s recycling grant programs distribute 95% of available funds to localities for litter prevention and recycling programs, and the remaining 5% is used for administrative expenses by the Virginia Department of Environment Quality (DEQ).
Recycling Budget For FY 2013, recycling and litter prevention related funding available for local grants and grant administration totaled $1,522,627.
Recycling Goals All localities (counties, cities and towns or regional program units) are required to recycle at least 15% or 25% of their MSW. There are possible civil and permitting penalties involved for those that do not meet the goals.
Recycling Rate For CY 2010, Virginia’s recycling rate was 40.5%.

E-8 Appendix E: Recycle Infrastructure and Market Development in Other States
Endnotes for Appendix E Kentucky: Fred Kirchhoff, Supervisor, Recycling and Marketing Assistance, KY Division of Waste Management. [email protected]. Maryland: Dave Mrgich [[email protected]], Chief, Recycling Unit, Maryland Department of the Environment, Baltimore, MD. Ohio: Chet Chaney, [email protected], Ohio Department of Natural Resources. Pennsylvania: Georgia Kagle, Chief, Recycling Markets Program, Pennsylvania Department of Environmental Protection, Harrisburg, PA. [email protected]. Virginia: Steve Coe, Manager, Office of Litter Prevention & Recycling, Virginia Department of Environmental Quality, Richmond, Virginia. [email protected]. North Carolina: Matt Ewadinger, North Carolina Recycling Business Assistance Center. [email protected].