ntc for dpr 1994 - roma tre universityhost.uniroma3.it/docenti/pietrobelli/publications/ntc for dpr...
TRANSCRIPT

Technological Capabilities at the National
Level: An International Comparison of
Manufacturing Export Performances
Carlo Pietrobelli
in Development Policy Review Vol.XII, N.2, 1994

2
1. INTRODUCTION 1
The tendency towards an increasing share of GDP arising from manufactured goods appears
to be a typical feature of the development process (Chenery et al., 1986, Chenery and Syrquin, 1975).
Comparative advantage (CA) changes over time in line with the transformation of production, and
leads to an increasing specialization in manufactured exports, gradually replacing primary resource-
based exports.2
However, reaching international competitiveness in manufacturing production
requires the acquisition of a number of production and selling capabilities. This is a demanding task
which needs time and effort, and does not arise automatically from production experience.
In this paper we argue that the inter-country differential in manufactured exports
performance may be explained as the expression of different levels of National Technological
Capability (NTC). Consistent and lasting manufactured export success cannot be achieved without an
underlying solid base of NTC. NTC development is built upon adequate micro and macro incentives
and lengthy and directed efforts and investments. This implies reaching static and dynamic efficiency
both at the firm and at the economy level. In turn this requires cost competitiveness and adequate
product quality with reference to "best practice" technical standards. Dynamic efficiency is
accompanied by increases in productivity, a gradual diversification in industrial technologies over
time, and a "deepening" of the nature of productive activities, with more complex skills and
technologies and an increasing content of local inputs and supporting services.
The aim of this paper is to attempt a comparative assessment of a sample of four
countries'manufactured export performance over the years 1966-86, comparing Chile with Colombia,
South Korea and Thailand to assess the impact of different policies on countries of roughly
comparable incomes and stages of development.
The plan of the paper is as follows. Section 2 presents the record of manufactured exports
in the last two decades for the sample countries, together with data on industrial performance. Section
3 tries to explain the differences in performance making use of the concept of NTC. Its existence and
determinant factors for the sample countries are briefly assessed in sequence in the following
sections. A final section draws the main conclusions and derives some policy implications.
2. MANUFACTURED EXPORT PERFORMANCE
A country's performance in exporting manufactures is a crucial indicator of its capability to
acquire dynamic CA. More generally, a positive manufacturing export performance can be taken as a
proxy for the country's overall industrial performance, and reflects the country's structural
transformation along expected lines (Chenery et al., 1986).
1 This article draws on chapter 5 of my unpublished D.Phil thesis at the University of Oxford. I wish to thank S.Lall and R.Thorp for their comments and advice. A preliminary version of this paper was presented to the EADI conference in Berlin, 15-18 September 1993. 2 Here we do not discuss the desirability of manufacturing and manufactured exports. It is worth noting, however, that the bulk of the
technological development and innovations is concentrated in the manufacturing sector (Fajnzylber, 1989), and that value added per unit of
national resource endowments is higher with manufactured exports than with unprocessed raw materials.

3
In this paper, we adopt a comparative perspective, with a sample made of four developing
countries: Chile, Colombia, the Republic of Korea (Korea), and Thailand. Colombia is probably the
Latin American country that is nearest to Chile in terms of size, structure and basic economic
characteristics, that makes a comparison interesting and instructive. Korea is an outstanding example
of what is commonly labelled as "successful outward oriented industrialization", with effective
industrial and trade policies. Finally, Thailand has recently emerged as a "new-comer" among the
East-Asian newly-industrializing countries (NICs),3 and is especially relevant for Chile as it has a
large natural resource base and has also promoted agricultural development.
There are clearly structural differences among these countries, but some interesting lessons
may still be learnt from a comparison. For example, the countries have remarkably different natural
resource endowments, with Chile and Korea at the opposite extremes. Yet the latter is being looked at
as an example of successful and sustained development strategy also by many other East-Asian LDCs
much better endowed with natural resources, such as Malaysia or Thailand.
Moreover, geographical location in the world economy is another source of differences:
being near a rapidly developing region may be advantageous on several grounds: demand deriving
from higher imports by neighbouring economies; transfer of technology, as learning from other
experiences becomes easier, and technology easily spills over and crosses boundaries; FDI flows as
industries relocate to lower wage areas; the surrounding ideological and cultural "climate".
Experience suggests that being in East Asia in the 1970s and 1980s has been advantageous for many
LDCs.
The four countries had remarkably different export structures at the beginning of the period
considered, reflecting different resource endowments. Korea, constrained by its poverty of natural
resources, was already "naturally" biased towards manufactured exports, while the others were
exporting natural resources and agricultural products.4 In the following two decades, in spite of the
different export performances, some clear patterns emerge (Table 1).5 From these data, one can
obtain evidence of two related but different dimensions of export performance: (i) the dynamics of
total exports and of some categories of exports; (ii) the movement in trade patterns that takes place at
different levels of aggregation, revealed by the relative share of each sub-group within each category
in various years. For both dimensions cross-country comparisons are relevant and suggestive of the
countries' performance and pattern of change.
3 Initially also Finland was part of the sample, because some of its structural characteristics, such as its fishing and forestry endowments, its
relative distance from many international markets, and its democratic and cooperative economic and political regime, make it interesting
from a Chilean perspective. However, a lag in GDP p.c. of at least 30 years, and many other socio-economic features makes it too different
to justify rigorous inter-temporal comparisons. For an interesting attempt in this direction see Blomström and Meller (eds.), 1991. 4 Following Chenery and Syrquin estimates, in 1964 only Thailand was a relatively "high" exporter, and Chile was relatively closer to the
external market and less specialized in manufactures than the "normal" country. Manufactured exports were 1.77% of GNP, with 6.52%
being the expected figure for a "normal" country in the sub-sample (Chenery and Syrquin, 1975, table S10). 5 "Manufactured exports" for all countries are defined as the ISIC 3 group, less 311-2 (food products) due to difficulties in disaggregating
the figures from the SITC classification, 353-4 (petroleum refineries and products), and 371-2 (iron and steel and non-ferrous metals) to
correct for the distortingly large weight of copper exports. It is necessary to remind that the elimination of 311-2 exports has the effect of
underestimating manufactured exports, especially from Chile. The Chilean Central Bank reports exports of industrial foodstuffs (ISIC
3110) for US$ (thousand) 28.7 in 1970, 101.8 in 1975, and 602.7 in 1986.

4
All these countries increased their total as well as manufactured exports, but at very
different speeds. The process of overall opening and internationalization is revealing: in 1966 Chile
had the largest presence in international markets in nominal terms, with US$ 875 m. (current), and
Korea the least, with only US$ 250 m.. Twenty years later, Korea was the largest exporter, with US$
34,714 m., Colombia and Chile were far behind (US$ 5,108 m. and 4,166 m. respectively), and
Thailand had improved remarkably, with US$ 8,787 m.
The differences are even greater for manufactured export, with Korea (and Thailand behind
it) showing much greater dynamism. Per capita figures are even more suggestive.
Table 1
SELECTED INDICATORS OF MANUFACTURED EXPORT PERFORMANCE, 1966-86
CHILE KOREA COLOMBIA THAILAND 1986 1975 1966 1986 1975 1966 1986 1975 1966 1986 1975 1966
TOTAL EXPORTS, X US$ 4,166 1,649 875 34,714 5,081 250 5,108 1,465 508 8,787 2,195 663
Index No. 476 188 100 13867 2030 100 1006 288 100 1325 331 100
1966=100
Manufactured Exports US$ 342 142 38 30,032 3,988 149 774 329 47 3,818 415 16
Index No. 905 376 100 20197 2682 100 1659 704 100 23512 2555 100
1966=100
Manuf.X as % of Tot.X % 8,2 8,6 4,3 86,5 78,5 59,4 15,2 22,4 9,2 43,5 18,9 2,4
Manuf. X per capita US$ 28 14 4 722 113 5 27 14 2 72 10 1
------------- Breakdown of Manufactured Exports by technology employed (1966=100) -----------------
High-technology- High AWG 523 287 100 81640 5897 100 986 479 100 82706 3750 100
intensive High SKR 596 259 100 52055 4086 100 1367 664 100 15436 1980 100
HighS&ENG 639 236 100 125705 8146 100 1571 848 100 84821 3806 100
Low-technology- Low AWG 3533 1585 100 11823 2256 100 2548 1036 100 30637 3102 100
intensive Low SKR 3357 1257 100 12373 2317 100 1958 934 100 25798 2908 100
LowS.&ENG 3311 817 100 11543 2155 100 1920 847 100 16452 1667 100
SOURCE: Elaboration from U.N. data.
DEFINITIONS: see the text. "Manufactures" = ISIC 3 less 311-2 (food products), 353-4 (petroleum ref. and products),
and 371-2 (iron and steel and non-ferrous metals).
As for the evolution in the countries' trade pattern over time, following Chenery and
Syrquin, 1975 and Chenery et al., 1986, one would expect a steady shift from primary to
manufactured exports, and from simpler to more complex manufactures as the process of structural
transformation of the economy continued.6 In Chile, the share of manufactured exports has risen
since 1966, but it has lagged after 1975. Colombia shows an even worse trend, while the two Asian
countries have steadily increased the weight of their manufactured exports over the total, with
Thailand faster in the second decade.
Manufactured exports have been further disaggregated according to the technology required
to produce them (appendix). Thus, different sub-groups have been identified following two criteria:
labour skill intensity and technological intensity, based on the fact that more complex technologies
require a more intense use of skilled workers, scientists and engineers, and stronger R&D efforts. The
6 This is in line with the "stages approach to CA".

5
Korean leap forward over these years is remarkable, especially in higher-skill, higher-R&D products.
Low-wage exports have been gradually replaced by exports with a higher technology content.
In contrast, in 1986 in Chile low R&D and low skill (however measured) exports accounted
for a larger share of manufactured exports than two decades before.
Manufactured export growth has been taken as a proxy for overall industrial performance.
The evidence is reinforced also looking at industrial development and performance indicators (T.2),
with the East-asians clearly outperforming the others.
Table 2 STRUCTURE AND PERFORMANCE OF THE SAMPLE ECONOMIES
INDICATORS OF INDUSTRIAL PERFORMANCE AVG. ANN. GROWTH MVA MVA MVA p.c. MVA growth countries: of Industry of Manuf. mill.US$ index num. US$ ann.avg. 65-80 80-87 65-80 80-87 1970 1986 1970 1986 1970 1986 65-80 80-87 CHILE 0,8 1,5 0,6 0,9 2092 5470 100 261 223,3 446,4 0,6 0,9
COLOMBIA 5,5 5,2 6,2 3,2 1155 5204 100 451 54,3 179,7 6,2 3,2
KOREA 16,5 10,8 18,7 10,6 1880 29457 100 1567 58,3 708,4 18,7 10,6
THAILAND 9,5 5,9 11,2 6,0 1048 8424 100 804 28,8 159,9 11,2 6,0
STRUCTURE OF PRODUCTION (% of GDP in current mill.$) GDP Agriculture Industry (Manuf.) Services 1965 1987 1965 1987 1965 1987 1965 1987 1965 1987 CHILE * 5940 18950 9 18 40 29 24 21 52 53 COLOMBIA 5570 31940 30 19 25 35 18 19 46 46 KOREA 3000 121310 38 11 25 43 18 30 37 46 THAILAND 4390 48200 35 16 23 35 14 24 45 49
STRUCTURE OF MANUFACTURING (% of MVA) MVA
(mill.curr.$) Food &
Agriculture Tex. & Clothing
Machinery & Transport
Chemicals Others
1970 1986 1970 1986 1970 1986 1970 1986 1970 1986 1970 1986 CHILE 2092 5470 17 27 12 7 11 4 5 8 55 55
COLOMBIA 1155 5204 31 34 20 14 8 8 11 13 29 31
KOREA 1880 29457 26 15 17 17 11 24 11 9 36 35
THAILAND 1048 8424 43 30 13 17 9 14 6 6 29 33
Definitions: ISIC categories 31 32
382-384 351-352 33+34+353-
58++385+390
Sources: W.B., 1989, except for Chile: IDB, 1989.
Note: "Industry" is defined as = mining + manufacturing + construction + electricity + water + gas.
* 1987 shares at constant 1977 prices.
3. THE THEORY AND SOME EVIDENCE ON NATIONAL TECHNOLOGICAL
CAPABILITY
3.1. Theory
After long and demanding research, part of the growth accounting literature, aiming at
explaining the sources of income growth, came to the conclusion that a non-negligible part of the
recorded income growth is not explained by factors in the production function, but by some residual
factor accounting for economies of scale, technological change, etc.. This unexplained residual (i.e.
"black box labelled technology) takes the burden of explanation.
Different attempts have been made, some of them recently, to compute total factor
productivity, and decompose the "black box" of technology into some smaller, well defined
components, more suitable to in-depth scrutiny.

6
One new branch of analysis includes the so-called "new growth theories", based on
endogenous technological change (Romer, 1986, 1990, Lucas, 1988, Grossman and Helpman, 1991),
and explain growth effects and not only level effects, like for the neoclassical model of growth. These
theories arise from dissatisfaction with the basic neo-classical model explanation of growth, and try
to improve upon it, by providing a richer structure, with realistic new attributes and capable of
dealing with a variety of new issues (Helpman, 1991, pg.41).
The other important branch of literature aiming at decomposing the "black box" of
technology, that is pursued much further in this paper, emphasizes the role of "Technological
Capability" (TC) at the firm-level to achieve static and dynamic efficiency and positive industrial
performance (Dahlman et al., 1987, Enos, 1991, Katz, 1987, Lall, 1990a and 1990b, Pack and
Westphal, 1986).
These two branches of literature have different perspectives but share some common
results. The former adopts a general equilibrium microeconomic perspective with identical agents,
whereas the latter looks at firm-level industrial competence to explain the process of growth and
explicitly considers inter-firm differences. Yet, they both conclude that investment in human capital
and in technological knowledge is a crucial condition for sustained economic growth.
Moreover, the literature on TC emphasizes different kinds of externalities and market
failures from the endogenous growth literature, that are especially frequent in LDCs (Chenery et al.,
1986, Stiglitz, 1989, 1991). The development process itself often creates the skills and the institutions
that are needed to remedy some costly failures. LDCs are generally characterized by missing,
fragmented and poorly functioning markets, and they often lack also the capabilities that are
necessary to remedy these market failures. Thus, the risk of government failure is also higher the
lower is the level of development.
In synthesis, there is a case for intervention to remedy market failures depending on three
things (and on their degree over time): the nature and the cost of these failures, the existence and
adequacy of market-based solutions, and the capability of the government to design and carry out
correct solutions.
The present approach focuses on the concept of TC to "decompose" the unexplained
residual ("black box") and explain industrial (and international) performance.
TC is the complex set of human skills and organizational structures required to efficiently
utilize a given technology and improve it over time. Together with entrepreneurial and managerial
capabilities, it is the sine qua non of efficient dynamic management of an industrial activity. It
implies not only the achievement of productive efficiency, but also a deeper understanding of the
technological process, its mastery, and the capability of adapting and improving upon it. TC
determines the success of adaptation to changing conditions in product and factor markets and also
productivity increases over time.
Like all skills, TC acquisition involves a process of learning. It involves a variety of
specialized capabilities, and is partly endogenous to the productive units, so that the effort that each
firm puts in creating such TC largely explains persisting differences. Moreover, there are a number of

7
reasons that may induce firms to underinvest in capability creation: very high risk-aversion and their
unawareness of the returns to such investments (Stiglitz, 1987), their uncertain appropriability (public
goods nature), imperfections in capital markets that are not perfectly forward-looking and do not
finance them (Stiglitz, 1989), and the possibility that the benefits of the investments in TC building
crucially depend on other firms' and institutions' behaviour and on their learning capacity
("technological externalities", Pack and Westphal, 1986).
Although TC is clearly a firm-level concept, it also has a macroeconomic dimension, and
differences in technological capability at a national level (NTC) contribute to explaining divergent
economic performances internationally.7
There are reasons to believe that NTC is not simply the sum of individual capabilities
developed independently. First of all, the special nature of technological knowledge (imperfect
appropriability of the returns from capability building investments, non-rivalry, its being largely
embodied in human capital, uncertainty over the actual effectiveness of its deployment...) creates
scope for powerful externalities, and the involuntary spill-over of positive effects from one agent to
the other.
Secondly, inter-firm and inter-industry linkages set up intentionally can help creating new
TCs by overcoming uncertainties, scale constraints, lack of external economies, and multiply the TCs
already in existence.
Thirdly, policies and institutions, that are taken as given by individual firms, vary and can
be useful policy tools at a national level, in order to enlarge the national endowments of educated
manpower and of widespread technological knowledge, as well as the physical and S&T
infrastructures.
What determines the acquisition of TC at the firm and at the national level? This process is
partly stochastic and partly depends on a host of factors. In an attempt to summarize, three building
blocks of NTC can be identified: incentives, capabilities and institutions. This grouping is useful to
separate the "demand" for capability acquisition, determined by the incentives framework, from the
"supply" of these capabilities, that itself depends on the skills, institutional and industrial structures.
Importantly, none of these factors operates in isolation. The interplay of the incentive
structure with the capabilities generated by investments in physical and human capital, and with the
institutions supporting the process of firm-level TC creation, is crucial.
Firstly, the "effort" dimension referred above is justified by the existence of adequate
incentives. Market prices sometimes do not produce correct incentives for investments in physical
capital or TCs. Such market failures occur because of externalities, "learning to learn", capital market
failures, risk and uncertainty (OED, 1992), and may require interventions.
Secondly, investment in capabilities to increase physical and human capital, create
specialized skills, improve the organization of production and marketing, including the establishment
7 See Porter, 1990, on the conditions that allow TCs to grow at the micro-level.

8
of an effective network of industrial suppliers, consultants and service firms, is also a crucial factor
for TC acquisition.
Thirdly, the institutional environment is equally important for this dynamic process of
learning and development of TCs. This has to define the legal framework where contracts take place,
as well as the system of property rights. Specific institutions that are especially interesting to us are
those related to the provision of training, education, and technical education in particular.
Technology infrastructures and policies are crucial in order to facilitate the creation of the necessary
network of information flows between firms and institutions supplying services like the setting of
technical standards, quality assurance, testing, information on markets, R&D, etc..8
At an empirical level, an additional difficulty derives from the fact that NTC as such is not
directly observable. Hence, the following methodology is used here: since NTC cannot be measured
directly, we may rather observe the presence/absence of some of the economic and non-economic
variables that recent research has shown to be most important for the creation and development of TC
at the national level. Thus, a proxy for the sample countries' level of NTC can be derived.
3.2. GENERAL CHARACTERISTICS OF THE SAMPLE COUNTRIES
All four countries are classified by the World Bank as "middle income economies" (World
Bank, 1990). In 1965 Chile and Colombia had a similar level of GDP, while Korea was still in a
process of slow recovery from the ruins of the Korean war of a decade before. By 1988 Korea was
leading the group, and at a distance (even discounting for the huge appreciation of the won in this
year), and Thailand had also overtaken the two Latin Americans. Higher rates of growth make
possible larger expenditures in infrastructure, administration, education, and may have contributed to
a rise in NTC, although the direction of causality may run both ways.
Industry is especially relevant to our present purposes as it provides the physical capital that
is essential to the development of NTC and to a positive industrial performance, and the bulk of
technological change takes place in manufacturing (Fajnzylber, 1989). All sample countries have
followed the "normal" pattern of structural transformation of rising manufacturing contribution to
GDP sketched by Chenery et al., 1986, except for Chile, where the share of agriculture in GDP has
doubled from 1965 to 1987 (mainly due to the booming fresh fruit sector) and industry and
manufacturing shares have fallen substantially (table 2).
Another characteristic of the "normal" pattern of industrialization is the gradual move away
from traditional, low value-added activities, and the increase in the share of capital goods in MVA
with the level of industrial development. All sample countries followed this pattern except for Chile,
that increased its share of food and agricultural MVA in GDP from 17% in 1970 to 27% in 1986
(Table 2). Colombia is a partial exception, and Thailand shows a diverging pattern, as it has increased
the contribution of textile and clothing, light and "simple" activities, to local MVA.
8 This is different from Enos' definition of institutions relevant for TC acquisition, as he emphasizes the function that institutions play in
pulling together individual skills, and instilling them with a "common purpose" (Enos, 1991).

9
Moreover, all countries have experienced a rise (or at least a stability) in the contribution of
capital goods to MVA, again with the notable exception of Chile. The share of machinery and
transport equipment usually grows with the level of industrial development. The impact of capital
goods is crucial to industrial TC. Mechanical engineering skills are regarded as the base of all TCs
(they are also less "localized" and sector specific) with electrical engineering skills coming later (De
Long and Summers, 1990, Rosenberg, 1986, Stewart, 1984). Korea is a special case in point, and the
data reflect the "big push" into heavy industry (shipbuilding, electronics, heavy engineering, transport
equipment) of the late '70s.
Table 3
SAMPLE COUNTRIES: SELECTED STATISTICS
years CHILE COLOMBIA KOREA THAILAND
Population (mill) 1988 12,8 31,7 42,0 54,5
Area (th.sq.Km.) 1988 757 1139 99 513
GNP p.c. (US$) 1988 1510 1180 3600 1000
GNP p.c.growth 1965-88 0,1 2,4 6,8 4,0
GDP (mill.$) 1965 5940 5910 3000 4390
(official exchange rates) 1988 22080 39070 171310 57950
GDP growth 1965-80 1,9 5,8 9,6 7,2
(avg.ann.rates) 1980-88 1,9 3,4 9,9 6,0
Life expectancy at birth 1988 72 68 70 65
Manufacturing V.A.(mill.$) 1986 5470 5204 29457 8424
(%GDP) 1987 21 18 30 24
Total Exports (mill.$) 1987 4166 5108 34714 8787
Exports/GDP (%) 1965 12,4 9,3 5,8 15,4
1986 25,0 14,8 35,3 21,1
Manufactured Exports p.c. $ 1966 4 2 5 1
1986 28 27 722 73
Manuf.X./Tot.X. (%) 1986 8,2 15,2 86,5 43,5
Volume Growth Man.X 1980-87 3,3 0,4 15,0 13,7
Sources: World Bank, 1989, and 1990; UNCTAD, 1988.
A preliminary conclusion would be that Korea achieved a deep transformation very rapidly,
and in a direction that enhanced the creation of NTC. Thailand is following the path set by Korea,
still with a lag, while Chile has been following a very different pattern. However, as far as the local
"depth" of industrial technology is concerned, Chile may have more local technology than Thailand,
which is still mainly at the stage of assembly (Dahlman and Brimble, 1990). Chile has a much longer
industrial tradition, and in 1970 the manufacturing sector was already larger and more complex than
Thailand (T.2). In the 1960s, agriculture still accounted for a much larger share of GNP in the latter
than in the former. Colombia has not changed substantially over these years.
An important feature of the sample countries is their macroeconomic efficiency during the
period under study. The indices of Total Factor Productivity (TFP), are supposed to show the
contribution of efficiency in the use of factor inputs to the growth of value-added (or gross output).

10
However, these indices rely on a number of critical assumptions, that make their interpretation
difficult (Tybout, 1991).9
The evidence on TFPswould suggest a very high macroeconomic efficiency of Korea during
all periods (Chenery et al., 1986, Dollar and Sokoloff, 1990), implying that Korea achieved high rates
of growth not only due to higher investment rates, but also to the efficient use of national resources.
The evidence for Colombia goes in the same direction during the late '60s-early '70s period, with a
marked decrease of macroeconomic efficiency afterwards (World Bank, 1989, Chenery et al., 1986).
Although low efficiency characterized Chile in the early ISI years (Chenery et al., 1986),
the more recent evidence is ambiguous. With all the major macroeconomic changes occurring in
Chile after 1973 (hyperinflation at the beginning, very high interest rates, recession in 1974-76,
exchange rate real appreciation after 1976) it is very hard to isolate the effects of each set of policies.
Industry-level analyses suggest very low productivity overall (Tybout, 1991, Tybout et al.,
1990), but the evidence from plant-level studies shows much better productivity performance and a
fall in protection rates with rising productivity (Tybout, 1991).
The discussion in section 5 suggested that the creation and the development of NTC is
determined by the interplay of incentives, capabilities and institutions. We now look at these groups
of factors in sequence.
Table 4 ESTIMATES OF OVERALL ECONOMY PRODUCTIVITY
(1) (2) (3)
Chenery et al., 1986, T.2.2 Value added
growth
TFP
growth
% of 1
explained
by TFP
CHILE 1950-60 3,50 0,85 24,3
1960-74 4,40 1,20 27,3
COLOMBIA 1950-60 4,60 0,95 20,7
1960-74 5,60 2,10 37,5
KOREA 1955-60 4,22 2,00 47,4
1960-73 9,70 4,10 42,3
Avg.DEV.C. 5,40 2,70 50,00
Avg.LDCs 6,30 2,00 31,70
World Bank, 1989, T.IV.1 (consistent with Syrquin, 1987). OUTPUT
growth
TFP
growth
% of (1)
expl.by TFP
COLOMBIA 1967-74 6,4 3,1 48,4
1974-86 5,5 1,0 18,2
1967-86 4,6 0,9 Tybout, 1991, T.1 INDUSTRY-LEVEL TFPgrowth CHILE 1979-86 -1,2 COLOMBIA 1977-87 -0,8 Tybout, 1991, T.3 PLANT-LEVEL,
Output (Y) growth decomposition (1) (2) (3) (4) (5)
OUTPUT
growth
Productivit
y growth
% of (1)
explained
by (2)
No. of
plants %
% of (1)
explaine
d by (4)
CHILE 1979-85 1,4 4,4 314,3 -4,9 -350,0
COLOMBIA 1977-87 4 4,8 120,0 -0,2 -5,0
Dollar and Sokoloff, 1990, T.4 INDUSTRY-LEVEL
9 Among the assumptions are: constant returns to scale, free adjustment of factors to maximize profits, competitive markets, use of
identical technologies across plants. "...Problems of measurement error, disequilibria, and aggregation bias can easily create the illusion of
trends and correlations that have no basis in the economic processes we hope to capture." (Tybout, 1991, pg.50)

11
Labour
Productivity
growth
TFP
growth
% of (1)
explained
by TFP
KOREA 1963-79 11,0 6,1 55,5
heavy industries 12,0 3,3 27,5
light industries 11,7 7,4 63,2
Note : TFP = Total Factor Productivity; No.plants = contribution of net entry of plants to P
3.2. INCENTIVES TO THE BUILDING OF NTC: INDUSTRIAL POLICIES AND
INTERNATIONAL TRADE POLICY ORIENTATION
At the national level, the incentives that are deemed most important to boost the creation of
NTC are those arising from external policy (trade strategy) and from internal policy (resource
mobilization and industrial policy). A further strong incentive may be given by the unfavourable
initial conditions for development, such as the limited natural resource endowments, the population
pressure, the scarcity of usable land.
There is widespread consensus that, ceteris paribus, outward orientation and competition,
both domestically and on international markets, provide more effective incentives for industrial
development than the opposite alternatives of inward oriented and strongly protectionist policies
(Balassa, 1989), but they may be potentially harmful to weak and incipient manufacturing sectors.
As far as the external market is concerned, the tendency has often been to consider the two
strategies of "outward orientation" (O-O) or "inward orientation" (I-O) as opposite and mutually
exclusive in more than simply trade policies, and extending the dichotomy to the role of the state.
Focusing on this dichotomy is misleading and draws attention away from the crucial issues at stake.
More specifically, export orientation does not imply laissez-faire and absence of intervention. On the
contrary, because of the failure of the markets of knowledge and information, especially frequent in
LDCs (Stiglitz, 1989), functional and selective interventions may have to go together with a
necessary competition policy.10
The market for information on export activity (foreign demand, product technology
characteristics, their variability) may fail, as well as the market for technology, that can be segmented
world-wide, lack transparency, prevent immediate and perfect transfer, thereby requiring lengthy,
purposefully planned and costly learning processes. Sometimes international capital markets also
suffer from important failures.11
3.2.1. Trade Policy
Effective Protection Rates (EPR) give a first approximation to the countries' trade
orientation, in spite of their aggregate nature and the different methodologies employed that make
comparisons risky.
10 "Functional" government intervention does not discriminate between activities, whereas "selective" intervention explicitly provides
support to selected activities. 11 If CA is dynamic and requires a costly learning process, myopic policies are not optimal for a LDC; thus, the imperfections of the
capital market may impose a serious impediment on LDCs'acquisition of CA (Stiglitz, 1989).

12
From Table 5 it appears that Chile was discriminating heavily in favour of its domestic
market in the '60s. After 1974 its trade policy provided strong macroeconomic incentives for
readjustments, but these were not constant over time.
Thus, confusing signals came from the exchange rate appreciation in 1979-82 (T.6) and the
sky-rocketing real interest rates in the same years. Unlike Korea, Chile's export-led strategy did not
imply any selective support, and was based only on liberalization and the elimination of the bias in
favour of domestic activities. In Korea, selective import protection coexisted with export support,
with high and differentiated EPRs. In Colombia the early liberalization experience slowed down after
1974, partly reducing the incentive of international competition and reinforcing administrative
controls on imports. Neither did the exchange rate always move in favour of exports: on the contrary,
it generally moved counter to the shifts in tariffs, subsidies and non-tariff barriers (Ocampo, 1991,
Garcia-Garcia, 1991, Chica, 1991). Thailand has not yet abandoned some of the important features of
protection and selectivity.
For a detailed observation of each country's experience is useful to go beyond these
indicators and assess their effectiveness in providing exporters with "equal footing" with foreign
competitors. This includes access to raw materials and intermediate inputs at world market prices,
short term-financing, access to investment licensing and financing (Rhee et al., 1990).
In Chile the 1973 military takeover reversed the ISI policy prevailing during the 1960s,12
and the neoclassical idea of homogeneous and uniform incentives to all economic activities shaped
most of the following economic policies. Market-based CA determined resource allocation, with a
decreasing and homogeneous rate of effective protection for all manufacturing sectors (Table 5).
Nominal tariffs were temporarily raised after the deep financial and industrial crisis of
1982-83, and specific support to selected exports (and exporters) was not granted until 1984-5, with
draw-back to non-traditional exporters, import tax returns, etc.13
The rationale for exchange rate management varied over time (T.6 and Pietrobelli, 1991),
with an anti-inflationary crawling-peg from the end of 1974, and a fixed rate in June 1979. This
policy produced a real appreciation until 1982 that badly damaged the external sector, suffering from
the strong competition of imported goods (Ffrench-Davis, 1983), and total and industrial exports
dropped heavily in those years. These conflicting signals confused and misled the exporters during
these years, and prevented new export-oriented investments for some time. They clearly hindered the
development of more complex manufactured exports. After the 1982 crisis, it took some time to
12 The ISI accorded non-competitive rents to large oligopolies developing through diversification of their activities rather than an increase
in the production scale (Muñoz, 1986). However, in those years the state also promoted a long term development of forestry and fruit
sectors, that will be crucial for the later export expansion (Cepal, 1986,) The state (through its industrial support corporation, CORFO) also
provided subsidized loans and technical advice in the context of the 1966 "National Fruit Development Plan". 13 An expression commonly used by the government officials at the time was:"...no hay que exportar impuestos ! (we do not have to export
taxes)." This idea took the form of compensations for taxes on imports of intermediate goods and services needed to produce exports, and
selective and temporary drawbacks to non-traditional exporters since the end of 1985. Note that already under the Frei government (1966-
70) a system of duty repayments with rates up to 30% of the export values had been operating (Law no.16528/1966), though often
ineffectively (Ffrench-Davis, 1973, pg.101).

13
regain the exporters' confidence.14 After 1982 the policy changed again, reintroducing a peg crawling
in line with inflation differentials, that has been maintained through the recent years, restoring the
government's credibility.
Some interesting institutional arrangements to ease the market functioning and remedy
market failures have been introduced only in the last few years, such as: (i) the creation of the
"National Commission for Foreign Trade" (1986); (ii) the higher selectivity of the Export Promotion
Board (PROCHILE) in providing information and support; (iii) the strengthening of institutions such
as Fundación Chile (Meissner, 1988, and Pietrobelli, 1993). In the manufacturing sector, the
examples of support to exporters given by institutions such as trading companies, producers'
associations and consortia have been scattered and limited in extent, and came mainly from private
sources.15
Table 5
EFFECTIVE RATES OF PROTECTION (%)
CHILE 1961 1967 1969 1974 1978 1979 1982 1984 1986
unweighted average 133 168 90 13
textiles 672 492 138 14 \
footwear & clothing 318 16 164 14 / approximately
foodstuffs 217 365 105 10 \ uniform13,0%
electrical machinery 92 449 72 13 /
non-el. machinery 73 76 72 13 \
transport equipment 68 271 n.a. n.a.
COLOMBIA -2 36 46 60,8 53,6
manufacturing 44 27 (industry) 80,2 59,3
transport equipment 610 215 40 78 58,2 53,7
primary (excl.coffee) 18 -14 19 20
machinery 28 40
consumer goods 47 84
KOREA
manufacturing -1,4 31,7 28,2
agriculture 18,5 57,1 74,3
machinery 44,2 44,2 31,3
transport equipment 163,5 326,6 123,9
food -18,2 -44,0 -48,4
THAILAND 30,0 29,7
all industries 87,2 18,6 70,2 51,9 51,2
processed food 205,9 -46,4 78,5 32,8 32,9
non-durable C.goods 57,4 134,6 212,4
durable C. goods 93,2 136,2 495,6
machinery 7,6 23,7 58,3 34,9 35,2
transport equipment 146,5 135,0 417,2
Sources: CHILE: De la Cuadra and Hachette, 1991, T.A1.1 (1975 for 1974).
COLOMBIA: 1967: Diaz Alejandro, 1976 (T.8.4); 1969: Balassa, 1982, 1975 (for 1974): W.B., 1983.1984
and 1986: W.B.,1987. In 1969 "manufacturing" stands for "simple manufacturing".
KOREA: World Bank, 1987, for 1968, 1978, 1982.
THAILAND: 1969 (for 1971), 1974 and 1978: World Bank, 1980; 1985 (for 1984) and 1988 (for 1986):
Dahlman and Brimble (1990).
Unlike Chile, Korea provides an example of an O-O development strategy with widespread
(and successful) functional and selective interventions directed to promote the international
14 This is confirmed by microeconomic evidence (chapter 6 in Pietrobelli, and Corbo and Sanchez, 1986). 15 The local subsidiary of a North-American trading company, started in 1986, effectively match-makes foreign buyers and local
manufacturing firms of furniture, food-stuffs, toys, garments and ceramics. Some specific support was also given by the Association of
Exporters of Manufactures (ASEXMA).

14
competitiveness of industries and firms (Amsden, 1989, Dahlman et al., 1987, Pack and Westphal,
1986, Rhee et al., 1984, Wade, 1991). Korea liberalized its foreign trade to some extent in 1964-5,
and apparently to a greater extent than Thailand, but it is by now accepted that selective and
extensive interventions have been a constant feature of its policies. Although average EPRs (T.8)
were not relatively high, domestic production has always been protected through import prohibitions
and bans, and the threat of imports actually never existed. In fact, the government still retains the
power to restrict the import of various commodities in accordance with about 37 special laws, even if
the commodities belong to the category of items to which "Automatic import approval" is granted
(Kim, 1991). The Korean government did not practice neutrality in its incentive policies, and
encouraged substantial industry-bias in favour of the promoted infant-industries (Pack and Westphal,
1986, pp.93-4). Yet, the positive spur of export competition coexisted with selective protection
measures, such that exporters faced consistent and predictable incentives.
This powerfully interacted with local industrial policies, that deliberately favoured the
creation of the large conglomerates (chaebol), capable of internalizing markets. It was believed that
static and dynamic economies of scale and of scope would be gained through larger size, and this
would foster the access to international markets.16
Table 6
REAL EFFECTIVE EXCHANGE
RATE INDICES years CHILE COLOMBIA KOREA THAILAND 1966 96,0 106,6
1967 91,0 105,9 99,1
1968 98,0 115,5 96,3
1969 106,0 117,7 95,7
1970 110,0 123,2 98,6 102,8
1971 91,0 128,9 104,1 98,1
1972 85,0 128,5 112,4 94,8
1973 40,6 122,9 130,6 96,1
1974 48,2 122,2 112,7 106,4
1975 62,2 128,7 111,5 102,4
1976 102,4 113,5 104,3 102,1
1977 95,3 107,3 105,5 99,1
1978 115,9 104,0 109,0 91,8
1979 115,9 100,9 97,2 93,5
1980 100,0 100,0 100,0 100,0
1981 84,5 96,0 97,0 104,6
1982 95,9 96,2 96,5 103,2
1983 114,3 93,5 103,3 105,9
1984 116,2 101,5 107,1 102,6
1985 146,2 116,2 113,5 89,8
1986 174,6 137,9 129,5 84,6
1987 206,5 141,0 130,1 79,5
1988 200,8 141,3
NOTE: The "real effective exchange rate" is defined as the weighted average of
nominal bilateral exchange rates deflated by an index of domestic to foreign
relative prices. Thus, they do not include the effect of export subsidies and
restricttions on imports. An increase means a real depreciation.
SOURCES: CHILE: Pietrobelli, 1991, and Tironi, 1978, from 1967 to 1972
(1968-69=100). COLOMBIA: W.B., 1984, and Banco de la Republica from
1982; KOREA: Park, 1989. THAILAND: Bhattacharya and Linn, 1988.
16 It is interesting to note how this policy was followed also by the Scandinavian countries, that favoured large enterprises, better equipped
to face international markets (Blomström and Meller, 1991, pg.10)

15
At the same time, a number of institutions were set up and operated to reinforce the export
development effort like high-level trade promotion meetings, industry and firm-level export targets,
close monitoring of firm-level export performance, awards and prizes for export achievements (Rhee
et al., 1984). The degree of selectivity was always very high, and specific export targets were set for
activities, firms, and even products. Because of the penalties attached, export targets were usually
overfulfilled.
Institutional support was offered by the official trade promotion board KOTRA (Korea
Trade Promotion Corporation), launched in 1962.17 KOTRA was initially weak, and it is not so
widely well regarded as similar organizations in Hong Kong or Taiwan (Keesing, 1988). Rather,
Korea, as well as Thailand, has relied heavily on its general trading companies, and to a lesser extent
on its traders and industry associations.18
In Thailand the need for generating fiscal revenues has often been an important constraint
on international trade policy design, and protection has never dropped below some not negligible
levels (Table 5), with high dispersion of protection rates, changing over time. Investment promotion
given by the Board of Investment (created in 1959) was geared toward consumer goods industries,
and ISI was encouraged throughout the 1960s mainly through import protection for consumer
durables and exemptions from import tariffs for some imported machinery and materials. Only with
the Third Development Plan (1972-76) the government began paying attention to manufactured
exports promotion through duty and tax exemptions, incentives to investments in export activities,
support to trading firms. Yet these did not cover the increases in import protection via high nominal
tariffs, discretionary quantitative restrictions and domestic content regulations, thus perpetuating the
anti-export bias in the trade regime (Dahlman and Brimble, 1990, World Bank, 1980). The exchange
rate was also not always favourable to exports, and was often unresponsive to the negative oil shocks.
However, such distortions have ranked lower than most developing country standards (Bhattacharya
and Linn, 1988).
In Colombia, the first important liberalization move was attempted in 1965 under severe
pressures from international donor agencies. Later, in march 1967, this move took a different form,
when the government refused to devalue, and adopted instead a crawling peg with stringent import
and foreign exchange controls (Ocampo, 1991). In addition, a stable export promotion policy was
introduced, with noteworthy institutional reforms that increased the credibility of the opening and the
confidence in the exchange rate scheme. The authorities were then able to compensate for the
liberalization and the abolition of quantity restraints with the devaluation of the exchange rate and the
increase in the relative price incentives for non-traditional exports.
17 It may be interesting to note that in 1987 Kotra had a preliminary budget of US$ 41 million, compared to ProChile's US$ 5 mill. in
1988. Yet, as a % of recorded total exports, the two countries were at similar levels. 18 Eight general trading companies, launched by the leading manufacturing conglomerates, together accounted for 50% of Korea's exports
in 1983 (Keesing, 1988).

16
International trade policy, like overall macroeconomic policy, has often been crucially
influenced by coffee exports and its international price. Thus the 1976 coffee boom, with the oil
discoveries in 1973-74, brought about a massive inflow of financial resources and a sharp revaluation
with it. It is debated in the Colombian literature whether this also induced rising investments in the
non-internationally tradable goods and in the financial sector, and a consequent need to intervene and
defend from "Dutch-disease" deindustrialization (Thorp, 1991). Today, it is still under discussion
whether the new liberalization measures and the more active implementation of the crawling peg after
1982 (World Bank, 1989) actually altered the inward-orientation of production incentives, as the
items that were liberalized were mostly non-competing inputs for locally manufactured goods.
Summarizing, Korea appears as the only successful and well-balanced blend of incentives
coming from international competition and functional and selective interventions to promote industry.
In Chile after the ISI period (until 1973) the only incentives in existence were those provided by the
rapid and thorough liberalization. Colombia and Thailand liberalized to a lesser extent than Chile,
and adopted policies that often responded to different aims and were not always stable and consistent.
3.2.2 Industrial policies
Industrial policies provide the other major source of macro-incentives to NTC creation.19
In Chile, the extent of state intervention in the economy decreased significantly in the first
years after 1973, and only after the 1981-2 productive and financial crisis did the state increase its
role in the economy, especially in the banking sector, when the Central bank intervened to rescue
many banks near to bankruptcy (Muñoz, 1986 pg.285). A traditional feature of the Chilean economy
has always been the segmented and oligopolistic structure of its markets, with few large enterprises
strongly controlling market production and investments, growing more through the diversification of
their activities than the increase in their production scale (Muñoz, 1986, pg.143). The industrial
sector was "...excessively diversified with inefficient and underutilized industrial plants .... kept afloat financially by subsidized inputs, particularly credit, and monopolistic pricing made possible by import restrictions" (World Bank, 1979, quoted by Meller,1991)
Widespread privatisation post-1973 further strengthened this feature. A handful of grupos
económicos acquired large ownership shares at bargain prices, mainly because of their access to
foreign credit, and raised inter and intra-industry concentration rates (Yotopoulos, 1989). By the end
of 1978, five economic conglomerates controlled 53% of total assets of Chile's 250 largest private
enterprises. Nine conglomerates, including those five, controlled 82% of the assets in the Chilean
banking system (Dahse, 1979, quoted by Foxley, 1982). This rising concentration of ownership of
industrial and financial assets was fostered by government policies in many ways (Foxley, 1982). 20
19 If completely free trade were realized, and transport costs were uniform across industries, domestic competition would cease to be an
independent incentive to NTC building investments. However, to the extent that some degree of protection remains, and transport costs
differ significantly, domestic competition is expected to be of autonomous policy significance for LDCs. 20 Differential access to foreign credit ensured large financial profits, the auction of state enterprises had an implicit subsidy equivalent to
30% of the firms'net worth, and relative prices (real wages net of social security and physical productivity, sale and export prices) moved in
a direction favourable to large productive enterprises.

17
The government created the conditions for the strengthening of the grupos without
providing them with incentives and regulatory mechanisms to deepen and upgrade their industrial
activities. Only the incentive of aggressive import competition was present, without support for the
restructuring (relearning) process and without schemes to direct the conglomerates to invest in TC
creation. In other words, the internalization of markets by grupos did not remedy market failures (as
in Korea), but may have exacerbated them.
Technology policy has been fragmented or lacking totally, with one exception of an
institution, set up as a result of the interaction between a US corporation and the Chilean government,
with the aim of transferring foreign advanced technology to the country (Fundación Chile).
Korea's experience of selective intervention is clearly at the opposite extreme from Chile.
The selectivity was sometimes so accentuated that in some years Korea adopted an explicit
discriminatory policy in favour of chaebol, considered more suitable to foster a successful learning to
export, introduce technological changes and increase the resilience to external conditions (Enos,
1986, Dervis and Petri, 1987). Moreover, FDI were restricted, and this also forced Korean chaebol to
invest in R&D and create local TC. The discriminatory policy mainly took the form of selective
credit allocation.21 What is particularly notable is the degree of effective competition among
conglomerates that was achieved in spite of, and together with, the host of measures implemented to
deter entry and favour concentration. The intense competition was mainly based on non-price factors,
with firms competing to get industrial licenses from the government, to get foreign technical licenses
on the best terms from international firms, to recruit best college students and experienced skilled
craftpersons, managers and engineers, to deliver good quality goods in the marketplace. Size and
performance have been critical in this competitive process (Amsden, 1989, pg.139). Thus, The large
Korean chaebol played a very different role from the Chilean grupo. A possible explanation may be
the different history of the grupos, originated from powerful family concentrations, and later
strengthened in the first years of the dictatorship. In those years, the groups that had enough liquidity
to react quickly to sharp and intermittent movements in relative prices (and special access to
economic information to predict those movements in years of structural changes) were favoured
(Foxley, 1982), regardless of other industrial, technological or strategic considerations. In contrast, in
Korea the large conglomerates (chaebol) were all new and selected on the basis of export
performance, and worked as agents of the government industrial policy.
The drive into export-oriented heavy and chemical industry through the development of
large conglomerates undertaken since 1973, also fostered technological development, because it
allowed economies of scale, cross-subsidization, internal technical labour markets and abundant
financial resources, all crucial to high technology products.
In general, government intervention aimed at driving Korean development in the direction
of market signals, by remedying market failures arising from externalities, missing capital markets
etc., fostering infant-industries. The economic rationale was to intervene selectively addressing
21 In the 1970s as much as 60% of total bank lending was subject to government control (Weiss, 1988).

18
market failures, in an environment of cooperation and harmony between the strategy of the large
chaebol and the government.22
In Colombia it has been estimated that industrial concentration increased over the period
1968-84, especially in the intermediate and capital goods industries. The anti-trust law, existing since
the 1950s, has hardly been applied, the state often directly acquired shares of large firms' equity, and
credit was often directed to large firms. Yet this was not justified as remedying market failures, nor
were interventions directed to protect the learning process (i.e. with their length varying according to
the complexity of the activity and to external conditions). This implied limited internal competition
and barriers to entry which, in turn, often resulted in losses in efficiency.
Since the 1930s Thailand adopted a strongly nationalistic industrial strategy. ISI was
undertaken through the direct involvement of state-owned enterprises in production under protection.
Only after 1958 did the government shift from a policy of direct participation in industrial
production to the encouragement of private sector participation, through, among other things, the
creation of the Board of Investment (1959). Moreover, a wide range of regulations and instruments to
control entry and exit have been in operation to shelter incumbent firms from competitive pressure
from domestic and foreign productions. This protected environment has not yet put significant
pressure on enterprises to increase their TCs, favouring the continuing domestic orientation of
companies (Dahlman and Brimble, 1990). Moreover, a large number of institutions for industrial and
technology development operate, but the unclear designation of responsibilities has resulted in
duplications and low effectiveness (Dahlman and Brimble, 1990, pg.9).23
However, with the Fifth and Sixth Development Plans (1982-86 and 1987-91) the
government recognized the inefficiencies deriving from high protection and import substituting
investments. It started putting more emphasis on restructuring existing industries, removing obstacles
to export, raising standards of quality in production and marketing, and improving industrial
technology. This led to a massive inflow of FDI from Japan, East Asian NICs and elsewhere, largely
in simple labour-intensive assembly operations. This export-oriented sector coexisted with the ISI
sector without upgrading the latter's TCs. However, the interlinkage between the ISI and export-
oriented sectors in Thailand has not been properly examined. Some elements of Korean style transfer
from one to the other may well be present.
22 However, the opposition of trade unions and minority groups (students) to this power was sometimes fierce, with protest spreading in
some years. 23 An explanation of the different performance and efficacy of industrial policies in East Asian and Latin American countries has been
proposed by Nagaoka (1990), who noted that industrial policy is often too endogenous with respect to industry behavior in Latin America.
This may be due to a number of factors (lobbying, government prior commitment to targeted industries, information asymmetries, dynamic
inconsistencies of the optimal policy), and may be costly and incentive-distorting. Domestic competition may effectively control for policy
endogeneity and, in other words, it would ensure higher independence to the government. Different levels of policy endogeneity would
explain the lower effectiveness of industrial policy in Chile and Colombia than in Korea. Yet, this looks doubtful, as it amounts to saying
that in the latter the government was more powerful, and especially more able to impose penalties to non-performers, poor exporters, than in
the former. But this view forgets the fact that the Chilean dictatorship had proved to be extremely capable do proposing and implementing a
liberalization reform since 1973: thus, the performance differential seems to be explained more by the strategy pursued than by the power
and ability to implement it and set the appropriate incentives and regulations for the individual agents to comply.

19
We can summarize by saying that in these years industrial policy was nearly absent and
always ineffective in Chile, with the large grupos that did not exploit the same opportunities to learn
and overcome market failures as the Korean chaebol did, while all forms of selective and institutional
support were lacking. Thus important dimensions of the NTC building incentives were missing.
Overall Korea appears to have set up the most stable and consistent set of incentives to the creation of
NTC.
3.3. CAPABILITIES: PHYSICAL AND HUMAN CAPITAL AND TECHNOLOGY EFFORTS
AND SOURCES
At the country level, capabilities may depend mainly on three dimensions: physical capital
and investment, human capital, and technology efforts. The three have to go together, and each is
insufficient on its own.
3.3.1 Physical Capital
In terms of our present interests, physical capital represents the necessary physical base for
the creation of NTC. Differences in the rates of growth of investment and shares of investment in
GNP can explain something of the divergence in economic performance, given equivalent capabilities
to use the investment goods (Table 7).
Table 7
INDICATORS OF PHYSICAL CAPITAL AND ITS EFFICIENCY
GDI growth rates ICOR countries: 65-
73 73-80 80-88 65-80 80-88 66-73 74-86 82-86 66-86
CHILE 14,3 17,3 17,5 0,5 -0,5 12,1 8,1 6,4 10,6
COLOMBIA 18,9 18,8 20,2 5,8 0,3 3,0 5,8 7,6 4,5
KOREA 23,9 31,2 30,3 15,9 10,5 2,8 5,0 5,1 4,4
THAILAND 24,3 26,9 25,6 8,0 5,0 4,3 5,0 7,3 4,7
Source: Author's calculations from World Bank, 1990.
Definitions: GDI (Gross domestic investment) = outlays for the addition to the fixed assets of the economy
+ net changes in inventories (as a % of GDP). ICOR = Incremental Capital Output Ratio.
Again Korea outperforms the others, and this difference continues well into the '80s. Chile
confirms the thesis of its "historically low" levels of investment, even by Latin American standards
(Ffrench-Davis, 1973).
However, in order to reveal the existence of NTC measures of investment need to be
considered together with the efficiency in their deployment. The incremental capital-output ratios
(ICOR) give a rough and imperfect indication of the economy's efficiency in employing investment to
rise the level of output. According to these measures, Chile has by far the lowest productivity of
capital (i.e. higher ICORs, T.7), and particularly so in the ISI period (1966-73). Over the last five
years, however, there are signs of improvements. The other three sample countries are at similar
values, but Korea looks more efficient.
This evidence suggests that Korea has a physical capital endowment and its efficiency
favourable to NTC deployment and its further creation. Thailand is following Korea's footsteps, but
its industrial base is still shallow and heavily relying on the off-shore assembly activities of foreign-

20
owned companies. Chile has fallen behind in the creation of a physical base for NTC. Important
opportunities for technological learning have been lost since the 60s', when the country could benefit
from an advantageous edge over the other sample countries, and industry provided a larger share of
GDP. Colombia is never the highest in the ranking, but is always at intermediate levels, and
especially so in the earlier years.
3.3.2 Human Capital
The human capital needed for industrialization can be created in several ways. Basic
primary education is important for all industries, but is probably more significant for low-technology,
small scale activities. The higher and the more advanced the education is, the more likely is its
relevance to more technically complex industries. Thus, higher levels of technical education, science
and engineering and vocational training are needed to cope with more complex and changing
technologies.
Moreover, formal education is only one possible way of acquiring the relevant capabilities
(Bell, 1984). The simple repetition of the same operation over time ("learning by doing" à la Arrow)
is only one route to learning; an effective learning has to be actively seized and is itself the result of
an explicit management decision.
All sample countries have very high enrollment rates in primary education (table 8) by now,
but differences are more marked in secondary and tertiary education. The enrollment in higher
education increased twelvefold during 1945-60 in Korea, under the simultaneous influence of a
deliberate government strategy to strengthen higher education, and of the Confucian values placing
great importance on education. Thailand has put a special emphasis on tertiary education.
However, these data do not say anything yet on the effectiveness of education on TC, that
depends on the technical orientation of education, and its length and quality. The extremely high
technical orientation of tertiary education as revealed by the UNESCO "scientific students' ratio" in
Chile looks promising for NTC.
The large size of the university population provides further evidence of the big push
forward by Korea in order to create a well-educated labour base. 2.6% of the population is registered
at university, twice as high as in Chile (1.09%) or Colombia (1.1%) Information on national students
and post-graduates in foreign universities would reinforce this conclusion.
It has been proved by now that intermediate technical skills play a crucial role for NTC.
Formal vocational education is a way to build up these skills, and a very important skill-creation takes
place at the firm-level, but data on this were not available. In Korea the government acknowledged
the relevance of such skills, and gave tax allowance for the training costs of the order of 5-6% of the
firms' budget (Lall, 1990a). In Chile, the training legislation provided full tax credit for training
expenditures of up to 1% of the wage bill, and played an important role in fostering significant firm-
level training (Corbo and Sanchez, 1986).24
24 Most of their sample firms declared that training was an important part of their strategy for improving efficiency (Corbo and Sanchez,
1986, pg.106).
21
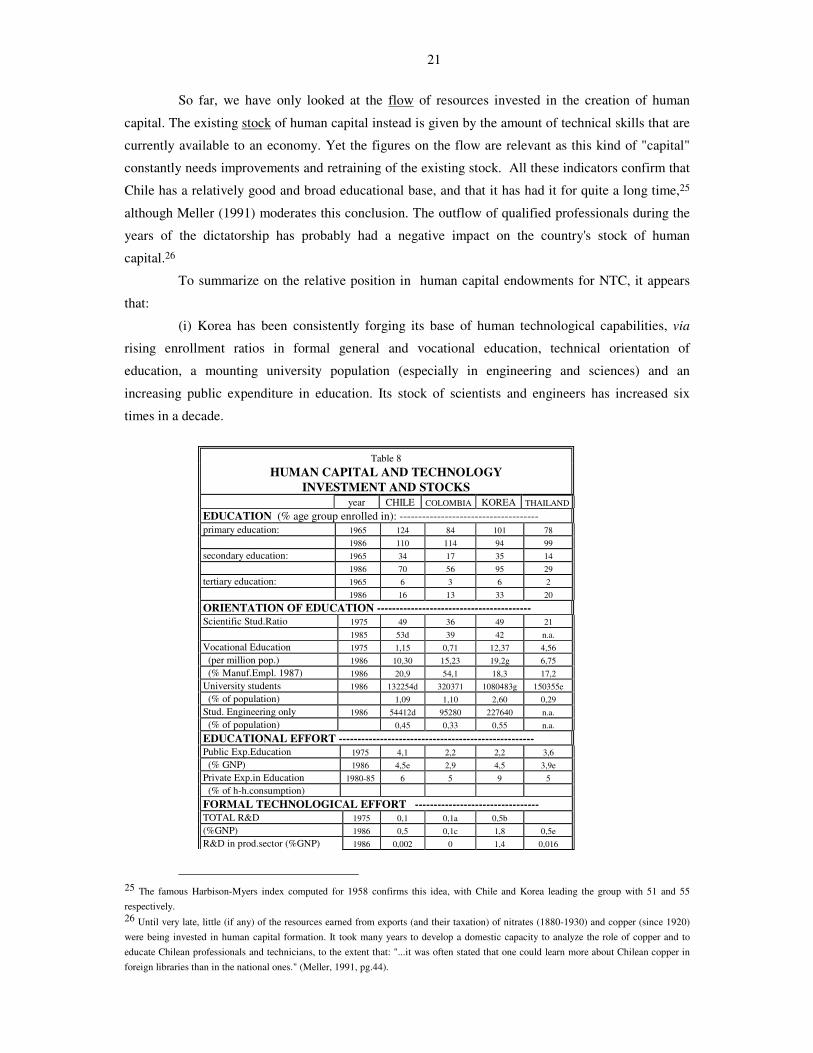
So far, we have only looked at the flow of resources invested in the creation of human
capital. The existing stock of human capital instead is given by the amount of technical skills that are
currently available to an economy. Yet the figures on the flow are relevant as this kind of "capital"
constantly needs improvements and retraining of the existing stock. All these indicators confirm that
Chile has a relatively good and broad educational base, and that it has had it for quite a long time,25
although Meller (1991) moderates this conclusion. The outflow of qualified professionals during the
years of the dictatorship has probably had a negative impact on the country's stock of human
capital.26
To summarize on the relative position in human capital endowments for NTC, it appears
that:
(i) Korea has been consistently forging its base of human technological capabilities, via
rising enrollment ratios in formal general and vocational education, technical orientation of
education, a mounting university population (especially in engineering and sciences) and an
increasing public expenditure in education. Its stock of scientists and engineers has increased six
times in a decade.
Table 8
HUMAN CAPITAL AND TECHNOLOGY
INVESTMENT AND STOCKS
year CHILE COLOMBIA KOREA THAILAND
EDUCATION (% age group enrolled in): ------------------------------------- primary education: 1965 124 84 101 78
1986 110 114 94 99
secondary education: 1965 34 17 35 14
1986 70 56 95 29
tertiary education: 1965 6 3 6 2
1986 16 13 33 20
ORIENTATION OF EDUCATION -----------------------------------------
Scientific Stud.Ratio 1975 49 36 49 21
1985 53d 39 42 n.a.
Vocational Education 1975 1,15 0,71 12,37 4,56
(per million pop.) 1986 10,30 15,23 19,2g 6,75
(% Manuf.Empl. 1987) 1986 20,9 54,1 18,3 17,2
University students 1986 132254d 320371 1080483g 150355e
(% of population) 1,09 1,10 2,60 0,29
Stud. Engineering only 1986 54412d 95280 227640 n.a.
(% of population) 0,45 0,33 0,55 n.a.
EDUCATIONAL EFFORT ----------------------------------------------------
Public Exp.Education 1975 4,1 2,2 2,2 3,6
(% GNP) 1986 4,5e 2,9 4,5 3,9e
Private Exp.in Education 1980-85 6 5 9 5
(% of h-h.consumption)
FORMAL TECHNOLOGICAL EFFORT ---------------------------------
TOTAL R&D 1975 0,1 0,1a 0,5b
(%GNP) 1986 0,5 0,1c 1,8 0,5e
R&D in prod.sector (%GNP) 1986 0,002 0 1,4 0,016
25 The famous Harbison-Myers index computed for 1958 confirms this idea, with Chile and Korea leading the group with 51 and 55
respectively. 26 Until very late, little (if any) of the resources earned from exports (and their taxation) of nitrates (1880-1930) and copper (since 1920)
were being invested in human capital formation. It took many years to develop a domestic capacity to analyze the role of copper and to
educate Chilean professionals and technicians, to the extent that: "...it was often stated that one could learn more about Chilean copper in
foreign libraries than in the national ones." (Meller, 1991, pg.44).

22
R&D financed by productive 1986 0,001 0 1,7 0,1
enterprises (%GNP 1985)
Scientists & Eng. in R&D 1975 575 50a 291 150
(per mill.population) 1985 422* 40c 1120f 150
Technicians in R&D 1975 28e 257
(per mill.population) 1984 38h 725f
Patents to nationals 1986 455e 169 2581 62
(% of tot.patents) (9,7) (8,3) (69,0) (49,6)
SOURCES: UNESCO "Statistical Digest", "Statistical Yearbook", var.issues; W.B., 1989; WIPO,
various issues; IAB, 1988.
NOTES: a 1971 b 1976 c 1982 d 1984 e 1985 f 1986 g 1987 * (S. & ENG. + Technicians)
DEFINITIONS:
SCIENTIFIC STUDENTS'RATIO = (students in natural science,maths and comp.sciences,medical and
health-related sciences,engineering,arch. and town planning,trade,crafts and industr.programmes
transport and communications, griculture,forestry & fish.programmes)/total third lev.studen
R&D ACTIVITIES = the branch of scientific and technological activities dealing with all systematic
creative work undertaken in order to increase the stock of knowledge and the use of this knowledge to
devise new applications. S.& ENG. = persons with scientific or technological training (usually at the
third level) who are engaged in professional work on R&D activities, administrators and other high-level
personnel who direct the execution of R&D activities. TECHNICIANS = persons engaged in that
capacity in R&D activities who have received vocational or techncal training.
(ii) Chile comes after Korea. Its general educational level is high for an LDC, and reflects a
technical orientation. Secondary and tertiary education enrollment rates have always been high. A
possible weakness lies in the few students in vocational schools, an important source of intermediate
technical skills.
(iii) Colombia and Thailand are generally behind the others in many respects. Colombia's
bias in favour of liberal arts might be a disadvantage. Thailand has experienced an impressive push
into tertiary education, in an attempt to fill a wide gap, but the fast industrial growth of the last few
years is requiring additional efforts to supply specialized (post-graduate level) science & technology
manpower.
3.3.3 Technological Efforts and Sources
The existence of skills by itself is not sufficient to explain NTC, and It has to be combined
with purposeful technological effort, as technology has some "tacit" elements that have to be acquired
by individual firms through individual evolutionary learning strategies (Nelson, 1987).
Following our simplified approach, technological efforts and technology sourcing are the
third fundamental dimension of the capabilities that, together with incentives and institutions,
determine NTC.
Two related aspects are relevant to this issue: the intensity and direction of local
technological efforts, and the country's strategy to acquire (and import) technology.
Measures of technological effort should take into account all the efforts of assimilating
technology, adapting it to local conditions, mastering production process and design, trouble-shooting
at the shop-floor level, experimenting new products and processes. Unfortunately, only very
aggregate measures of the efforts are available, such as the expenditure in formal R&D. This is more
important at higher levels of industrialization with high-tech, large scale industries. In these
industries, the role that R&D has in developing a firm's "learning" and "absorptive capacity", i.e.

23
ability to identify, assimilate, and exploit knowledge from the environment, and not only to "create
new knowledge", must not be underplayed (Cohen and Levinthal, 1989).
Among the sample countries, Korea stands out for its high expenditure in R&D as a
percentage of GNP (Table 8), higher than some OECD countries. Even higher percentages are being
targeted by this East-Asian NIC (5% of GNP by the year 2000). The government has functionally and
selectively intervened to foster particular research projects in specific industries, and set up
institutions playing a catalytic and demonstrating role in high-tech productions (Dahlman, 1990).27
By the measure of R&D expenditure in the productive sector and financed by productive
enterprises, the Korean lead is even greater, and the two Latin American countries perform
practically no significant R&D.
These data on local technological effort are intrinsically related to the country strategy to
import technology from abroad. This technology acquisition can take a formal or an informal form,
depending on whether it is paid for and subject to contract or simply transferred through observation,
publications, imitation, embodied in skilled people shifting from one country to the other, or flowing
from foreign buyers to developing countries' manufacturers. The three major forms of formal
technology transfer from abroad are: imports of capital goods, foreign licensing and foreign direct
investment. They vary in the extent of the local TC required.
Foreign direct investment (FDI) is the form of technology acquisition that requires the least
developed NTC, as technology comes in as a "package". Thus, FDI is the easiest form to import
foreign technology, but at the risk of not transferring capabilities, provoking excessive and permanent
foreign dependence.
The import of only capital equipment is at the opposite extreme, fully relying on local
engineers and technicians for its efficient utilization. The costs of lengthening the period of
inefficient deployment of the imported capital goods may be compensated by the permanent learning
acquired by local experts. Foreign licensing is an intermediate option.
Interesting patterns of importing foreign technology emerge from Table 9. Korea shows the
highest reliance on capital goods imports and the lowest on FDI, in an explicit attempt to reduce
foreign dependence, and develop local TC. Learning through reverse engineering often occurred.
Colombia shows the highest reliance on FDI as a source of technology. Together with Chile, it has
always favoured FDI to transfer foreign technologies.
Thailand has always had a relatively open policy towards FDI, and in the late 1980s it is
relying even more heavily on FDI from Japan and the first tier NICs, forced to move their production
overseas by the appreciation of their currencies. However, there is concern that the FDI is unbalanced
compared to the relative underdeveloped state of infrastructure (Dahlman and Brimble, 1990, pg.12).
Moreover, the R&D expenditures are low compared to those of the most dynamic Asian NICs at
times of comparable development (table 8).
27 For example, the Korea Institute of Electronics and Technology demonstrated that it was possible to produce semiconductors in the
country, and sparked many private enterprises (Dahlman, 1990, pg.21).

24
Table 9
FORMS OF TECHNOLOGY IMPORTS -------- IMPORTS OF CAPITAL GOODS ------------------
(mill.curr.US$) % of GDI % of MVA
1965 1975 1986 1965 1975 1986 1965 1975 1986
CHILE 203,4 501,4 1056,9 22,6 53,5 43,0 13,6 34,2 19,3
COLOMBIA 205,9 582,8 1165,2 20,1 26,2 20,2 22,2 24,6 22,4
KOREA 73,1 1909,3 10787,9 16,1 33,4 37,6 10,4 34,5 36,6
THAILAND 236,8 1140,7 2565,4 29,0 30,7 28,6 35,4 43,1 30,5
---------- NET FOREIGN DIRECT INVESTMENT FLOWS -------------
Annual Avg. (mill.curr.US$) % of GDI 1970-74 1975-79 1980-84 1985-87 1970-74 1975-79 1980-84 1985-87
CHILE -141,6 95,0 223,0 72,0 (-9,5) (4,5) (5,4) (2,6)
COLOMBIA 30,8 51,8 338,2 658,7 (1,7) (1,4) (4,6) (14,0)
KOREA 73,2 55,6 -1,4 314,3 (2,3) (0,4) (-0,0) (1,0)
THAILAND 83,2 61,8 284,0 201,5 (3,8) (1,2) (3,2) (2,4)
Source: IMF, 1987, World Bank, 1987, UNCTC 1986, ESCAP 1988. "Capital goods" = SITC 7000, "Machines
and Transport Equipment"
Summarizing, Korea's experience seems to show that low FDI may conduce to effective
NTC building, under certain conditions. It needs also access to advanced foreign capital equipment,
local effort in R&D, S&T infrastructures, institutional support and probably also large firms capable
of internalizing the externalities involved in the investments in NTC building and of overcoming the
widespread market failures. FDI as such may lower the "need" to learn higher levels of design and
development, and bring about a permanent reliance on foreign technology.
Chile has had access to foreign capital equipment, but appears to have exerted little local
technological effort, set up insufficient infrastructures (if any at all), provided no support for local TC
building. Such effort has been even smaller in the private productive sector. In this context, the
recent huge flows of FDI may be worrying if they are not supported by well directed efforts to
generate skills and capabilities locally, and progressively "indigenize" this source of technology.
4. CONCLUDING REMARKS AND POLICY IMPLICATIONS
The hypothesis of NTC as an important determinant of a country's long term manufactured
export performance finds some empirical support from our sample.
Korea shows a superior performance in terms of all the necessary dimensions for NTC, that
is incentives, capabilities and institutions. The blend of the incentives to compete on the international
market and the protection of the learning process has been remarkable, leading to the accumulation of
high and varied NTCs.
In Chile, some important elements of NTC were present during these years, and the main
element was a satisfactory stock of human capital. The incentives deriving from the international
trade orientation were more mixed.sometimes giving conflicting and misleading signals. This
prevented new export-oriented investments for some time, and hindered the development of
technologically complex exports. More importantly, the sudden exposure to international competition
reduced the incentives to upgrade the existing activities or to enter new complex industrial activities,
both of which required lengthy risky learning and "relearning". The resulting level of NTC has been

25
low, as the poor record of industrial growth and manufactured exports suggest. Well-directed
interventions to overcome market failures in building TC were absent. Expenditure on R&D stayed at
very low levels, and the good level of human capital allowed some technological upgrading to take
place, but this was constricted to sectors with natural CA (resource-based) and some government
support for capability enhancement.
In this respect, the Korean case provides a strong case for arguing that sustained industrial
development and successful industrial exporting need well-directed interventions. Industrial exports,
requiring longer learning, economies of scale, R&D efforts, cannot be successful without
"interventions" directed to make the working of the market mechanism possible, not to replace or
eliminate it.
In Thailand, competitive inducements to local enterprises from foreign and domestic
sources have continuously been low for many years, but the presence of the export-oriented sector
may have significant positive spillovers. Institutional support was well-conceived but inefficiently
applied and lacking coordination. However, the figures on the recent dynamism of manufactured
exports reveal a rising level of NTC, favoured by FDI and improving human capital.
In Colombia the physical base for NTC appears more solid but the human capital base is
more shallow than in Chile, with similar access to foreign technology. However, the competitive
inducements provided by the international trade policy have not always been consistent, and
industrial policies have been too fragmentary, with little competition counterbalancing the large
corporations' power to be successful.
One of the most interesting results of the above comparison has been to illuminate how
good education and favorable incentive structures are not enough to produce strong progress.
Competitive inducements to NTC creation have to be provided by the policies towards international
trade and domestic resources allocation, but taking into account the need for infant industry
protection. Investments in physical and human capital have to go together with technology efforts,
both of a formal (R&D and education) and informal (training, plant-level product and process
development) nature. The institutional framework for technology and exports has to remedy market
imperfections and failures, widespread everywhere and especially in LDCs. Future policies must take
the interplay among all these factors into account.
Within this general framework, some specific issues will need special emphasis. Thus, for
example, the potential for learning and internalizing missing markets that large conglomerates offer
should be explored, together with the design of the incentive mechanisms to induce the necessary
inter-firm competition. Furthermore, the degree and direction of protection accorded to specific
functions or activities should be assessed with the aim of protecting the learning (and relearning)
period required in that specific context. Finally, FDI and all the other forms of access to advanced
foreign technology offer a remarkable learning potential, but they should always be accompanied by a
continuous endogenous effort to develop local TCs, as the Korean case shows.
REFERENCES

26
AMSDEN A., 1989, Asia's Next Giant, South Korea and Late Industrialization, Oxford University Press, New-York. ARROW K., 1962, "The Economic Implications of Learning by Doing", Review of Economic Studies, 29, pp.155-73. BALASSA B., 1989, "Outward Orientation", in CHENERY H.B. and SRINIVASAN T.N. (eds.) Handbook of
Development Economics, vol.2, Amsterdam, North-Holland. BELL M.R., 1984, "'Learning' and the Accumulation of Industrial Technological Capacity in Developing Countries", in FRANSMAN M. and KING K., pp.187-209. BELL M. and PAVITT K., 1992, "Technological Capabilities and Industrialisation in Developing Countries", in World Bank Economic Review, Special Issue on The W.B. Annual Conference on Development Economics. BHATTACHARYA A. and LINN J.F., 1988, "Trade and industrial policies in the developing countries of East Asia", World Bank Discussion Papers no.27, august. CEPAL, 1986, El desarrollo frutícola y forestal en Chile y sus derivaciones sociales, Estudios e Informes de la CEPAL n.57, Santiago, Chile. CHENERY H.B., SYRQUIN M., 1975, Patterns of Development, 1950-1970, Oxford University Press, London. CHENERY H.B., ROBINSON S. and SYRQUIN M., 1986, Industrialisation and Growth, Oxford University Press, London. CHICA-AVELLA R., 1991, "A Crisis in the Conditions of Industrial Accumulation: The Stagnation of Colombian Manufacturing: 1974-82", unpublished D.Phil. dissertation, Cambridge University, U.K. COHEN W.M. and LEVINTHAL D.A., 1989, "Innovation and Learning: The Two Face of R&D", Economic
Journal, 99, pp.569-96. CORBO V. and SANCHEZ J., 1985 "Adjustments by Industrial firms in Chile during 1974-82" in CORBO V, and DE MELO J. (eds.) Scrambling for Survival, World Bank Working Paper, no.764. DAHLMAN C.J., 1990, "Electronics Development Strategy. The Role of Government", The World Bank
Industry and Energy Dept. Working Paper, Industry Series Paper, no.37, Washington D.C. DAHLMAN C.J., BRIMBLE P., 1990, "Technology Strategy and Policy for Industrial Competitiveness: a Case Study in Thailand", The World Bank, Industry and Energy Dept. Working Papers, Industry Series Paper no.24, Washington D.C.. DAHLMAN C.J., ROSS-LARSON B. and WESTPHAL L.E., 1987, "Managing Technological Development: Lessons from Newly Industrializing Countries", World Development, June, pp.759-75. DE LONG B. and SUMMERS L., 1991, "Equipment Investmentand Economic Growth", Quarterly Journal of
Economics, 104, May. DERVIS K. and PETRI P.A., 1987, "The Macroeconomics of Successful Development: What are the Lessons ?", in NBER Macroeconomics Annual, MIT Press. DOLLAR D. and SOKOLOFF K., 1990, "Patterns of Productivity Growth in South Korean Manufacturing Industries, 1963-79", Journal of Development Economics, 33:309-27. EDWARDS S. and COX EDWARDS A., 1987, Monetarism and Liberalization: the Chilean Experiment, Ballinger, Cambridge Ma. ENOS J., 1986, "Korean Industrial Policy", Prometheus, 4/2, December.

27
ENOS J., 1991, The Creation of Technological Capability in Developing Countries, Pinter Publishers for the ILO, London and New York. FAJNZYLBER F., 1989, Industrialización en América Latina: de la "caja negra" al casillero vacío, Cuaderno de
la CEPAL no.60, Santiago. FFRENCH-DAVIS R., 1987, "Política Comercial en Chile, 1973-86", mimeo CIEPLAN, Santiago, Chile. FOXLEY A., 1982, "Towards a Free Market Economy, Chile 1974-79", Journal of Development Economics, 10:3-29. GALVEZ J. and TYBOUT J., 1985, "Microeconomic Adjustment in Chile during 1977-81: The Importance of Being a Grupo", World Development No.13, pp.969-94. GATICA BARROS J., 1989, Deindustrialization in Chile, Westview Press, Boulder. GROSSMAN G.M. and HELPMAN E., 1991, Innovation and Growth, The MIT Press, Cambridge Ma. HARBYSON F.H. and MYERS C.S., 1964, Education, Manpower and Economic Growth, McGraw-Hill, New York. HELPMAN E., 1991, "Endogenous Macroeconomic Growth Theory", NBER Working Paper No.3869, October. KATZ J. (ed.), 1987, Technology Generation in Latin American Manufacturing Industries, Macmillan, London. KEESING D.B., 1966, "Labor Skills and Comparative Advantage", American Economic Review, 56. KEESING D.B., 1988, "The Four Successful Exceptions: Official Export Promotion and Support for Export Marketing in Hong-Kong, Singapore, Taiwan and the Republic of Korea", Trade Policy Division, Country
Economics Department, The World Bank, Washington D.C., May. KIM L., 1988, "Korea's Acquisition of Technological Capability for Internationalization: Macro and Micro Factors", paper presented at the Conference on "The Internationalization of Korean Firms", Seoul, Korea, 25-26 May. LALL S., 1987, Learning to Industrialize: The Acquisition of Technological Capability by India, Macmillan, London. LALL S., 1990a, Building Industrial Competitiveness: New Technologies and Capabilities in Developing
Countries, OECD Development Centre, Paris. LALL S., 1991, "Explaining Industrial Success in the Developing World", in BALASUBRAMANYAM V.N. and LALL S. (eds.), Current Issues in Development Economics, London: Macmillan. LALL S., 1992, "Technological Capabilities and Industrialization", World Development, 20:2. LEE C.H and NAYA S., 1988, "Trade in East Asian Development with Comparative Reference to Southeast Asian Experiences", Economic Development and Cultural Change, April, supplement. MEISSNER F., 1988, Technology Transfer in the Developing World: the Case of Chile Foundation, Praeger, New-York. MELLER P., 1991, "Chilean Economic Development, 1880-1990", in BLOMSTRÖM M. and MELLER P. (eds.), 1991, Diverging Paths. Comparing a Century of Scandinavian and Latin American Economic
Development, The Johns Hopkins University Press for the IDB, Washington D.C.. MIZALA A., 1984,"Liberalización financiera y quiebra de empresas industriales: Chile, 1977-82", Notas
Técnicas CIEPLAN no.67, January, Santiago.

28
MUÑOZ O., 1986, Chile y su industrialización: pasado, crisis y opciones, Ed. CIEPLAN, Santiago. NAGAOKA S., 1990, "Overcoming Policy Endogeneity", The World Bank, Industry and Energy Dept., Industry
Series Paper no.27, Washington D.C. NELSON R.R., 1987, "Innovation and Economic Development: Theoretical Retrospect and Prospect", in KATZ J. (ed.). NELSON R.R. and WINTER S.J., 1982, An Evolutionary Theory of Economic Change, Cambridge, Ma.: Harvard University Press. OCAMPO, J.A., 1991, "Trade Policy and Industry in Colombia, 1967-1991", paper presented at the WIDER
Conference on "Trade and Industrialization in LDCs", Paris, Aug.31-Sept.2. OECD, 1987, Structural Adjustment and Economic Performance, Paris: OECD. OED, 1992, World Bank Support for Industrialization in Korea, India, and Indonesia, Washington D.C.: The World Bank, Operations Evaluation Department. PACK H., 1989, "Industrialization and Trade" in CHENERY H.B. and SRINIVASAN T.N. (eds.) Handbook of
Development Economics, vol.2, Amsterdam, North-Holland. PACK H. AND WESTPHAL L.E., 1986, "Industrial Strategy and Technological Change: Theory versus Reality", Journal of Development Economics, 21:87-128. PETRI P.A., 1988, "Korea's Export Niche: Origins and Prospects", World Development, Vol.16, No.1, January. PIETROBELLI C., 1993, "El Proceso de Diversificación de Exportaciones en Chile", in Estudios e Informes de
la CEPAL No.84, Santiago, United Nations, 1993. PIETROBELLI C., 1991, "Real Effective Exchange Rates: Methodological Proposals for a Computable Index and an Application to Chile (1973-86)", Economia Internazionale, 2. PIETROBELLI C., 1993, "Local Technological Capability and Export Diversification in a Developing Country: The Case of Chile since 1974", unpublished D.Phil.thesis, University of Oxford.. PORTER M.E., 1991, The Competitive Advantage of Nations, London: Macmillan. RHEE Y.W., ROSS-LARSON B., PURSELL G., 1984, Korea's Competitive Edge: Managing Entry into World
Markets, The John Hopkins University Press for The World Bank, Washington D.C. ROMER P.M., 1986, "Increasing Returns and Long-Run Growth", Journal of Political Economy, 94:1002-37. ROMER P.M., 1990, "Endogenous Technological Change", Journal of Political Economy, 98. SCHUMPETER J., 1942, Capitalism, Socialism and Democracy, Harper, New York. STIGLITZ J.E., 1989, "Markets, Market Failures, and Development", American Economic Review, P&P. STIGLITZ J.E., 1991, "Government, Financial Markets, and Economic Development", NBER Working Paper No.3669, April. THORP R., 1991, Economic Management and Economic Development in Peru and Colombia, Macmillan in association with the OECD Development Centre, London. TYBOUT J., 1991, "Researching the Trade-Productivity Link: New Directions", The World Bank PRE Working
Paper WPS 638, Washington D.C.

29
TYBOUT J., DE MELO J., CORBO V., 1990, "The Effects of Trade Reforms on Scale and Technical Efficiency. New Evidence from Chile", The World Bank PRE Working Paper WPS 481, Washington D.C. WADE R., 1990, Governing the Market: Economic Theory and the Role of the Government in East Asian
Industrialization, Princeton University Press, Princeton. WEISS J., 1988, Industry in Developing Countries, Croom Helm, London. WORLD BANK, 1980, "Industrial Development Strategy in Thailand", World Bank Country Study, Washington D.C.. WORLD BANK, 1983, "Colombia. Manufacturing Sector Developments and Changes in Foreign Trade and Financial Policies, Vol.II". The World Bank, Washington D.C.. WORLD BANK, 1984, "Colombia. Economic development and policy under changing conditions", World Bank
Country Study, Washington D.C., February. WORLD BANK, 1987, "Colombia. Country Economic Memorandum", Report no.6626-CO, Washington D.C.. WORLD BANK, 1987, "Korea. Managing the Industrial Transition", World Bank Country Study, Washington D.C.. WORLD BANK, 1989, "Colombia. Country Economic Memorandum: Productivity Growth and Sustained Economic Development", Report no.7629-CO, Washington D.C.. YOTOPOULOS P.A., 1989, "The (Rip) Tide of Privatization: Lessons from Chile", World Development, vol.17, no.5 pp.683-702.

30
ABSTRACT
A large amount of research is showing that technological capabilities (TCs),
required to operate a technology efficiently and accomplish any process of
technological change, largely explain different productivity levels and industrial
performance at the firm-level (Enos, 1991, Lall,1992).
In this paper we extend the concept of technological capability to the national level,
and analyze its major determinants. The creation of TC depends on a number of
factors. They can be grouped in three subsets of factors: incentives, capabilities and
institutions. The interaction among them crucially affects the effectiveness of the
efforts to create TC.
We use this national technological capability (NTC) approach to assess the different
manufacturing export performance recorded in a small sample of developing
countries (Chile, Colombia, South Korea, Thailand). Different levels of NTC have
been detected by looking at how the policies affecting the creation and acquisition of
NTC have been carried out in the sample countries over the last two decades.
Different incentive systems, investments in capability building, institutional
structures and interventions have been observed. These factors remarkably
contribute to an explanation of the differential performance in exporting
manufactures.

31
APPENDIX
Methodology to Classify Exports According to Labour Skill and Technological Intensity Exports have been classified into two sub-groups from the ISIC data for the four sample countries. Sectoral data are taken from: Instituto Nacional de Estadisticas, Cuentas de producción nominales de
la industria manufacturera, Santiago, Chile, and from: U.S.National Science Foundation, National
Patterns of Science and Technology Resources, 1982, NSF 82-319 for the figures on R&D and S.&ENG.. 1. Labour Skills Intensity, using two different statistical indicators: average wage (AVGW, in current pesos) and "skill ratio" (SKR, non-operative/operative workers). Average wage: low < 400 intermediate 400 < x < 700 high > 700 Skill ratio: low < 0.25 intermediate 0.25 < x < 0.32 high > 0.32 2. Research & Development Intensity, using two different indicators: R&D expenditures on total sales (%, RD) and Scientists & Engineers employed in each sector's activity (%, SENG). R&D: low < 0.8 intermediate 0.25 < x < 3 high > 3 S&Eng.: low < 12 intermediate 12 > x > 35 high > 35