ntp technical report on t-butyl alcohol - national toxicology
TRANSCRIPT

National Toxicology Program Toxicity Report Series
Number 53
NTP Technical Report on Toxicity Studies of
t-Butyl Alcohol (CAS No. 75-65-0)
Administered by Inhalation to F344/N Rats and B6C3F1 Mice
Joel Mahler, D.V.M., Study Scientist National Toxicology Program
Post Office Box 12233 Research Triangle Park, NC 27709
NIH Publication 97-3942 July 1997
United States Department of Health and Human Services Public Health Service
National Institutes of Health

Note to the Reader
The National Toxicology Program (NTP) is made up of four charter agencies of the United States Department of Health and Human Services (DHHS):
• the National Cancer Institute (NCI) of the National Institutes of Health; • the National Institute of Environmental Health Sciences (NIEHS) of the National Institutes of Health; • the National Center for Toxicological Research (NCTR) of the Food and Drug Administration; and • the National Institute for Occupational Safety and Health (NIOSH) of the Centers for Disease Control.
In July 1981, the Carcinogenesis Bioassay Testing Program was transferred from NCI to NIEHS. NTP coordinates the relevant Public Health Service programs, staff, and resources that are concerned with basic and applied research and with biological assay development and validation.
NTP develops, evaluates, and disseminates scientific information about potentially toxic and hazardous chemicals. This knowledge is used for protecting the health of the American people and for the primary prevention of disease.
NTP designs and conducts studies to characterize and evaluate the toxicologic potential of selected chemicals in laboratory animals (usually two species, rats and mice). Chemicals selected for NTP toxicology studies are chosen primarily on the bases of human exposure, level of production, and chemical structure. The interpretive conclusions presented in this Toxicity Report are based only on the results of these NTP studies. Extrapolation of these results to other species and quantitative risk analyses for humans require wider analyses beyond the purview of these studies. Selection per se is not an indicator of a chemical's toxic potential.
The studies described in this toxicity study report were performed under the direction of NIEHS and were conducted in compliance with NTP laboratory health and safety requirements. These studies met or exceeded all applicable federal, state, and local health and safety regulations. Animal care and use were in accord and compliance with the Public Health Service Policy on Humane Care and Use of Animals.
Single copies of this report are available without charge, while supplies last, from the NTP Central Data Management (telephone number 919/541-3419).
NTP Central Data Management MD E1-02
NIEHS Post Office Box 12233
Research Triangle Park, NC 27709

National Toxicology Program Toxicity Report Series
Number 53
NTP Technical Report on Toxicity Studies of
t-Butyl Alcohol (CAS No. 75-65-0)
Administered by Inhalation to F344/N Rats and B6C3F1 Mice
Joel Mahler, D.V.M., Study Scientist National Toxicology Program
Post Office Box 12233 Research Triangle Park, NC 27709
United States Department of Health and Human Services Public Health Service
National Institutes of Health

2 t-Butyl Alcohol, NTP TOX 53
CONTRIBUTORS
This NTP report on the toxicity studies of t-butyl alcohol is based primarily on 18-day and 13-week studies that took place from August 1986 through June 1987.
National Toxicology Program Evaluated experiment, interpreted results, and reported findings
Joel Mahler, D.V.M., Study Scientist
John R. Bucher, Ph.D. Robert E. Chapin, Ph.D. Michael R. Elwell, D.V.M., Ph.D. Thomas J. Goehl, Ph.D. Joseph K. Haseman, Ph.D. Ghanta N. Rao, D.V.M., Ph.D. Gregory S. Travlos, D.V.M. Kristine L. Witt, M.S.
Oak Ridge Associated Universities
Battelle Columbus Laboratories Principal contributors
Arthur C. Peters, D.V.M., Principal Investigator
Patricia M. Athey Douglas K. Craig, Ph.D. Sondra L. Grumbein, D.V.M., Ph.D. Milton R. Hejtmancik, Ph.D.
NTP Pathology Review Evaluated slides and prepared pathology report
John Seely, D.V.M. PATHCO, Inc.
Michael R. Elwell, D.V.M., Ph.D. NIEHS
Experimental Pathology Laboratories, Inc. Provided pathology quality assessment
H. Roger Brown, D.V.M.
Environmental Health Research and Testing, Inc. Provided sperm morphology and vaginal cytology evaluation
Teresa Cocanougher, B.A. Dushant K. Gulati, Ph.D. Susan Russell, B.A.
Analytical Sciences, Inc. Provided statistical analyses
Richard Morris, M.S., Principal Investigator
Sarah R. Lloyd, M.S. Nicole G. Mintz, B.S.
Biotechnical Services, Inc. Provided toxicity report preparation
Susan R. Gunnels, M.A., Principal Investigator
Gloria Gordon, M.A. Lynn M. Harper, B.S. Michael L. Rainer, B.S. Waynette D. Sharp, B.A., B.S.

3 t-Butyl Alcohol, NTP TOX 53
PEER REVIEW
The draft report on the toxicity studies of t-butyl alcohol was evaluated by the reviewers listed below. These reviewers serve as independent scientists, not as representatives of any institution, company, or governmental agency. In this capacity, reviewers determine if the design and conditions of these NTP studies are appropriate and ensure that the toxicity study report presents the experimental results and conclusions fully and clearly.
James Bond, Ph.D. Gary P. Carlson, Ph.D. Chemical Industry Institute of Toxicology School of Health Sciences Research Triangle Park, NC Purdue University
West Lafayette, IN
4 t-Butyl Alcohol, NTP TOX 53
CONTENTS
ABSTRACT . . . . . . . . . . . . . . . . . . . . . . . . . . . . . . . . . . . . . . . . . . . . . . . . . . . . . . . . . . . . . . 5
INTRODUCTION . . . . . . . . . . . . . . . . . . . . . . . . . . . . . . . . . . . . . . . . . . . . . . . . . . . . . . . . . . . 9 Physical Properties, Production, Use, and Human Exposure . . . . . . . . . . . . . . . . . . . . . . . . . . . . 9 Absorption, Distribution, Metabolism, and Excretion . . . . . . . . . . . . . . . . . . . . . . . . . . . . . . . . . 10 Toxicity . . . . . . . . . . . . . . . . . . . . . . . . . . . . . . . . . . . . . . . . . . . . . . . . . . . . . . . . . . . . . . 12 Reproductive and Developmental Toxicity . . . . . . . . . . . . . . . . . . . . . . . . . . . . . . . . . . . . . . . . 14 Carcinogenicity . . . . . . . . . . . . . . . . . . . . . . . . . . . . . . . . . . . . . . . . . . . . . . . . . . . . . . . . . 15 Genetic Toxicity . . . . . . . . . . . . . . . . . . . . . . . . . . . . . . . . . . . . . . . . . . . . . . . . . . . . . . . . 16 Study Rationale and Design . . . . . . . . . . . . . . . . . . . . . . . . . . . . . . . . . . . . . . . . . . . . . . . . . 16
MATERIALS AND METHODS . . . . . . . . . . . . . . . . . . . . . . . . . . . . . . . . . . . . . . . . . . . . . . . . . . . 17 Procurement and Characterization of t-Butyl Alcohol . . . . . . . . . . . . . . . . . . . . . . . . . . . . . . . . . 17 Vapor Generation System . . . . . . . . . . . . . . . . . . . . . . . . . . . . . . . . . . . . . . . . . . . . . . . . . . 17 Concentration Monitoring . . . . . . . . . . . . . . . . . . . . . . . . . . . . . . . . . . . . . . . . . . . . . . . . . . 18 Chamber Characterization . . . . . . . . . . . . . . . . . . . . . . . . . . . . . . . . . . . . . . . . . . . . . . . . . . 18 Toxicity Study Designs . . . . . . . . . . . . . . . . . . . . . . . . . . . . . . . . . . . . . . . . . . . . . . . . . . . . 20 Statistical Methods . . . . . . . . . . . . . . . . . . . . . . . . . . . . . . . . . . . . . . . . . . . . . . . . . . . . . . . 27 Genetic Toxicity Studies . . . . . . . . . . . . . . . . . . . . . . . . . . . . . . . . . . . . . . . . . . . . . . . . . . . 27 Quality Assurance Methods . . . . . . . . . . . . . . . . . . . . . . . . . . . . . . . . . . . . . . . . . . . . . . . . . 31
RESULTS . . . . . . . . . . . . . . . . . . . . . . . . . . . . . . . . . . . . . . . . . . . . . . . . . . . . . . . . . . . . . . . 33 18-Day Inhalation Study in F344/N Rats . . . . . . . . . . . . . . . . . . . . . . . . . . . . . . . . . . . . . . . . . 33 13-Week Inhalation Study in F344/N Rats . . . . . . . . . . . . . . . . . . . . . . . . . . . . . . . . . . . . . . . . 35 18-Day Inhalation Study in B6C3F1 Mice . . . . . . . . . . . . . . . . . . . . . . . . . . . . . . . . . . . . . . . . 41 13-Week Inhalation Study in B6C3F1 Mice . . . . . . . . . . . . . . . . . . . . . . . . . . . . . . . . . . . . . . . 43 Genetic Toxicology . . . . . . . . . . . . . . . . . . . . . . . . . . . . . . . . . . . . . . . . . . . . . . . . . . . . . . . 46
DISCUSSION . . . . . . . . . . . . . . . . . . . . . . . . . . . . . . . . . . . . . . . . . . . . . . . . . . . . . . . . . . . . . 47
REFERENCES . . . . . . . . . . . . . . . . . . . . . . . . . . . . . . . . . . . . . . . . . . . . . . . . . . . . . . . . . . . . 49
APPENDIX A Organ Weights and Organ-Weight-to-Body-Weight Ratios . . . . . . . . . . . . . . . . . . A-1
APPENDIX B Hematology, Clinical Chemistry, and Urinalysis Results . . . . . . . . . . . . . . . . . . . B-1
APPENDIX C Reproductive Tissue Evaluations and Estrous Cycle Characterization . . . . . . . . . . C-1
APPENDIX D Genetic Toxicology . . . . . . . . . . . . . . . . . . . . . . . . . . . . . . . . . . . . . . . . . . . . . D-1
5
ABSTRACT
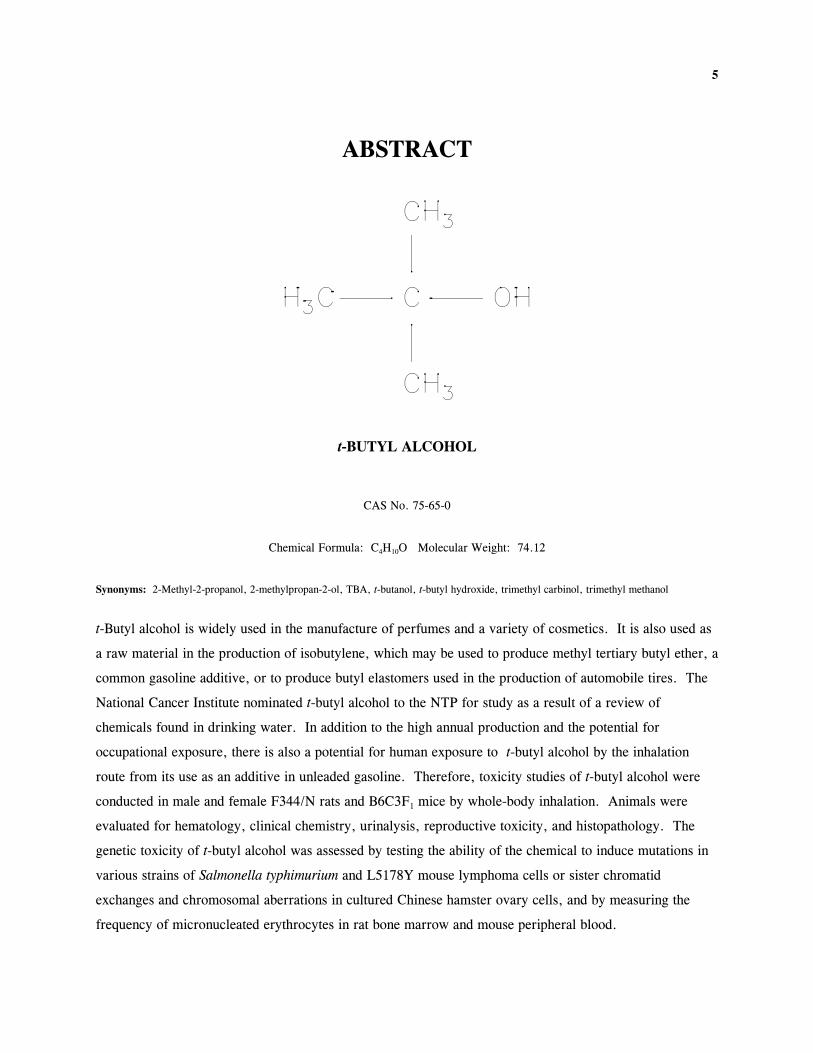
t-BUTYL ALCOHOL
CAS No. 75-65-0
Chemical Formula: C4H10O Molecular Weight: 74.12
Synonyms: 2-Methyl-2-propanol, 2-methylpropan-2-ol, TBA, t-butanol, t-butyl hydroxide, trimethyl carbinol, trimethyl methanol
t-Butyl alcohol is widely used in the manufacture of perfumes and a variety of cosmetics. It is also used as
a raw material in the production of isobutylene, which may be used to produce methyl tertiary butyl ether, a
common gasoline additive, or to produce butyl elastomers used in the production of automobile tires. The
National Cancer Institute nominated t-butyl alcohol to the NTP for study as a result of a review of
chemicals found in drinking water. In addition to the high annual production and the potential for
occupational exposure, there is also a potential for human exposure to t-butyl alcohol by the inhalation
route from its use as an additive in unleaded gasoline. Therefore, toxicity studies of t-butyl alcohol were
conducted in male and female F344/N rats and B6C3F1 mice by whole-body inhalation. Animals were
evaluated for hematology, clinical chemistry, urinalysis, reproductive toxicity, and histopathology. The
genetic toxicity of t-butyl alcohol was assessed by testing the ability of the chemical to induce mutations in
various strains of Salmonella typhimurium and L5178Y mouse lymphoma cells or sister chromatid
exchanges and chromosomal aberrations in cultured Chinese hamster ovary cells, and by measuring the
frequency of micronucleated erythrocytes in rat bone marrow and mouse peripheral blood.

6 t-Butyl Alcohol, NTP TOX 53
In the 18-day inhalation studies, groups of five male and five female rats and mice were exposed to
t-butyl alcohol by inhalation at concentrations of 450, 900, 1,750, 3,500, and 7,000 ppm for 6 hours per
day, 5 days per week, for 12 exposure days. All rats and mice exposed to 7,000 ppm were killed moribund
following a single 6-hour exposure. One 3,500 ppm male mouse died on day 3. Final mean body weights
of 3,500 ppm male and female rats were significantly lower than those of the controls. Final mean body
weights and body weight gains of all other exposed groups were similar to those of the controls. In animals
exposed to 3,500 ppm, the thymus weights of male and female rats and female mice were less than those of
the controls. The liver weights of male and female mice exposed to 3,500 ppm were greater than those of
the controls. No gross or microscopic lesions were present in rats or mice.
In the 13-week inhalation studies, groups of 10 male and 10 female rats and mice were exposed to t-butyl
alcohol at concentrations of 0, 135, 270, 540, 1,080, and 2,100 ppm for 6 hours per day, 5 days per week,
for 13 weeks. One 2,100 ppm and five 1,080 ppm male mice died before the end of the studies. The final
mean body weight of 2,100 ppm female mice and the mean body weight gains of 1,080 and 2,100 ppm
female mice were significantly lower than those of the controls. Clinical findings of toxicity in the
1,080 ppm male mice that died during the studies included rough coats and emaciated appearance,
hypoactivity, and prostration.
Minimal decreases in hematocrit values, hemoglobin concentrations, and erythrocyte counts occurred in the
1,080 and 2,100 ppm male rats at week 13. Hemoglobin concentrations and/or hematocrit values were also
minimally decreased in male rats in the lower exposure groups. At week 13, a minimal decrease in urine
pH occurred in the 1,080 ppm female and 2,100 ppm male and female rats. Neutrophilia occurred in the
2,100 ppm male mice. Organ weight differences in exposed rats included increased absolute and relative
kidney weights of 1,080 ppm males and 2,100 ppm males and females and increased relative liver weights
of 1,080 and 2,100 ppm females.
There were no treatment-related gross findings in male or female rats or mice; no microscopic lesions
occurred in female rats or male or female mice that survived to the end of the study. In male rats, there
was an exposure concentration-related increase in the severity of chronic nephropathy. Splenic lymphoid
depletion was present in male mice that died during the studies; this lesion was presumed to be secondary to
stress.
t-Butyl alcohol produced no adverse effects on reproductive parameters in male or female rats or mice.

7 t-Butyl Alcohol, NTP TOX 53
The results of all tests of t-butyl alcohol for induction of genetic damage in vitro and in vivo were negative.
In vitro, t-butyl alcohol was negative in Salmonella typhimurium and mouse lymphoma cell mutation tests,
and it did not induce sister chromatid exchanges or chromosomal aberrations in cultured Chinese hamster
ovary cells. These in vitro studies were conducted with and without metabolic activation (S9). In vivo, no
increase in the frequency of micronucleated erythrocytes was observed in peripheral blood samples from
mice administered t-butyl alcohol in drinking water for 13 weeks. Also, induction of micronucleated
erythrocytes was noted in bone marrow cells of rats administered t-butyl alcohol by intraperitoneal
injection.
In summary, inhalation exposure of rats and mice to t-butyl alcohol resulted in deaths following a single
7,000 ppm exposure and clinical findings of alcohol toxicity (hyper- and hypoactivity, ataxia) at
concentrations of 900 ppm and greater in rats and 1,750 ppm and greater in mice. In 13-week studies at
concentrations up to 2,100 ppm, only one death (that of a 2,100 ppm mouse) was attributed to chemical
exposure. The most notable evidence of toxicity at the end of 13 weeks was limited to males and consisted
of increased kidney weights, which correlated microscopically to increased severity of chronic nephropathy.
Reproductive parameters in male and female rats and mice were unaffected after 13 weeks of exposure, and
the results of all tests for genetic toxicity were negative.

8 t-Butyl Alcohol, NTP TOX 53

9
INTRODUCTION
t-BUTYL ALCOHOL
CAS No. 75-65-0
Chemical Formula: C4H10O Molecular Weight: 74.12
Synonyms: 2-Methyl-2-propanol, 2-methylpropan-2-ol, TBA, t-butanol, t-butyl hydroxide, trimethyl carbinol, trimethyl methanol
PHYSICAL PROPERTIES, PRODUCTION, USE, AND HUMAN EXPOSURE
t-Butyl alcohol is a colorless, volatile liquid with a camphor-like odor; it forms rhombic crystals at
temperatures below 25E C. It has a specific gravity of 0.783 and is soluble in water, alcohols, esters,
ethers, and aromatic and aliphatic hydrocarbons (Patty's Industrial Hygiene and Toxicology, 1982;
Hawley's Condensed Chemical Dictionary, 1987).
t-Butyl alcohol is used in perfumes and a variety of cosmetic products, in industrial cleaning compounds, in
aerosol sprays to remove household dust, in the production of butyl elastomers for automobile tires, and as
a raw material in the production of isobutylene, an intermediate in the production of the common gasoline
additive, methyl tertiary butyl ether (Sexton et al., 1986; Hawley's Condensed Chemical Dictionary, 1987;
CIR Expert Panel, 1989). t-Butyl alcohol is an ethanol denaturant, a dehydrating agent, and a solvent. In
1979, the U.S. Environmental Protection Agency granted a waiver to allow the use of t-butyl alcohol as a
gasoline octane booster (44 FR, 10530); however, this use is not widespread.

10 t-Butyl Alcohol, NTP TOX 53
t-Butyl alcohol can be an indirect food additive when used in the preparation and application of coatings for
paper and paperboard used in food containers (21 CFR, § 176.200) and as a surface lubricant for the
manufacture of metallic articles that contact food (21 CFR, § 178.3910). Due to the variety of uses of
t-butyl alcohol, potential routes of human exposure are topical, inhalation, and ingestion.
t-Butyl alcohol was identified in one of eight samples of mothers' milk obtained from women residing in
four different urban areas (Pellizzari et al., 1982). In addition, t-butyl alcohol has been found (but not
quantified) in the drinking water of at least one city out of five surveyed for volatile organics (Coleman
et al., 1976) and in water samples taken before, during, and after treatment at a New Orleans area
municipal water treatment facility (Dowty et al., 1975). The latter report also identified t-butyl alcohol in
water from a commercial deionizing-charcoal filtering unit.
United States production of t-butyl alcohol in 1991 was estimated at 2,990 billion pounds (Chemical
Economics Handbook, 1993). Based on a survey conducted by the National Institute for Occupational
Safety and Health (NIOSH) from 1981 to 1983, an estimated 171,419 workers are potentially exposed to
t-butyl alcohol in the workplace (NIOSH, 1990). The Occupational Safety and Health Administration has
established a permissible exposure limit of 100 ppm or 300 mg/m3 for t-butyl alcohol
(29 CFR, § 1910.1000).
ABSORPTION, DISTRIBUTION, METABOLISM, AND EXCRETION
Experimental Animals
While no published literature was found quantitating the absorption of t-butyl alcohol, several studies
suggest rapid absorption following oral exposure, inhalation exposure, or intraperitoneal injection.
Compared with the primary and secondary alcohols, tertiary alcohols are much more stable biologically and
are not readily metabolized. The possible routes of metabolism of tertiary alcohols are direct conjugation
of the hydroxyl group with glucuronic acid and oxidation of one or more of the alkyl substituents
(Williams, 1959). Early metabolism studies identified glucuronide conjugates of t-butyl alcohol in the urine
of rabbits; approximately 24% of a single 4 mmol/kg gavage dose was excreted as the glucuronide (Kamil
et al., 1953).
t-Butyl alcohol is not readily metabolized; it cannot form an aldehyde or ketone by dehydrogenation and is
not a substrate for alcohol dehydrogenase (Arslanian et al., 1971; Videla et al., 1982). However,
11 t-Butyl Alcohol, NTP TOX 53
in vitro studies showed that t-butyl alcohol serves as a substrate for rat liver microsomal mixed function
oxidase and is demethylated to yield small amounts of formaldehyde and acetone. The reaction pathway
appears to involve the interaction of t-butyl alcohol with hydroxyl radicals generated by the microsomes
from hydrogen peroxide (Cederbaum and Cohen, 1980; Cederbaum et al., 1983). Baker et al. (1982) also
found small, highly variable amounts of acetone in the urine and expired air of rats following intraperitoneal
injection of 0.75 to 2 g/kg t-butyl alcohol, indicating a minimal amount of oxidative metabolism. A
separate experiment by these investigators using labeled compound suggested that t-butyl alcohol was not
the sole source of acetone, but may have stimulated production from other sources. Significant increases in
blood concentrations of acetone have been reported following 1 to 2 g/kg intraperitoneal doses of t-butyl
alcohol in rats (Yojay et al., 1982).
In male Sprague-Dawley rats administered t-butyl alcohol orally or by intraperitoneal injection, liver
microsomal enzyme activity was increased threefold 18 hours after the last dose (quantity not specified)
(Bechtel and Cornish, 1972). The oral route appeared more effective in eliciting this response, and liver
weights were not significantly elevated.
After 5 days of inhalation exposure to 500 ppm t-butyl alcohol, male Sprague-Dawley rats had a 36%
increase in microsomal cytochrome P450 in the kidneys; liver and lung P450 values were unaffected. After
3 days of inhalation exposure to 2,000 ppm, rats had significantly elevated hepatic P450 (28%); kidney P450
was not affected, and lung P450 was slightly decreased. These results may indicate that a longer duration of
exposure is required before enzyme induction can be observed in the kidney, whereas exposure
concentration may be more important for induction in the liver (Aarstad et al., 1985).
Four male Wistar rats were given a single oral dose of 2.54 g/kg t-butyl alcohol. Six hours after
administration, hepatic glutathione concentration was slightly lower and lipoperoxidation (indicated by diene
conjugate formation) was slightly greater than those of the controls (Videla et al., 1982). Thurman et al.
(1980) did not detect oxidation of t-butyl alcohol in perfused rat liver, based on changes in oxygen uptake
or alterations in the levels of reducing cofactors.
t-Butyl alcohol is eliminated slowly from the blood of rats. Following intraperitoneal injection of 2 g/kg in
female Sprague-Dawley rats, t-butyl alcohol essentially was not metabolized, as indicated by the nearly
constant blood concentrations over a 12-hour period (Thurman and Pathman, 1975). In further
investigations (Thurman et al., 1980), female Sprague-Dawley rats were pretreated with t-butyl alcohol in
saline (5.7% w/v) by gavage every 8 hours for 1 or 2.5 days and then were given sufficient t-butyl alcohol

12 t-Butyl Alcohol, NTP TOX 53
to elevate their blood concentrations to between 125 and 150 mg/100 mL. Eighteen hours were required to
eliminate t-butyl alcohol completely from the blood of rats pretreated for 2.5 days, and 26 hours were
required following pretreatment for 1 day. The rate of elimination of 1.2 g t-butyl alcohol/kg body weight
was 0.7 mmol/kg per hour and was identical for both pretreated groups. t-Butyl alcohol was eliminated
from the rat only 6% to 7% as fast as ethanol, which is consistent with the hypothesis that t-butyl alcohol is
eliminated very slowly, possibly by glucuronidation. In Sprague-Dawley rats, the high serum concentration
(9 mmol/L) of t-butyl alcohol 6 hours after inhalation of 2,000 ppm was regarded as a possible reflection of
the limited metabolism of the compound (Aarstad et al., 1985).
t-Butyl alcohol is also eliminated slowly from the blood of mice. Single intraperitoneal doses of
8.1 mmol/kg administered to nine male Swiss-Webster mice were eliminated from the blood in 8 to 9 hours
(McComb and Goldstein, 1979). The same mice then inhaled t-butyl alcohol for 3 days at a concentration
sufficient to maintain a mean blood level of 8 mmol/L, and t-butyl alcohol was not detected in the blood
3 hours after the mice were removed from the vapor chamber. A single intraperitoneal dose of 8.1 mmol
t-butyl alcohol/kg body weight was then administered (to an unspecified number of mice) 4 hours after the
end of the 3-day inhalation period; no t-butyl alcohol was detected in the blood 3 hours later. The
increased rate of elimination of t-butyl alcohol in animals previously exposed may be due to an increased
conjugation. These results in mice are in contrast to the findings reported by Thurman et al. (1980)
following pretreatment in rats.
Humans
No information related to the absorption, distribution, metabolism, or excretion of t-butyl alcohol in
humans has been reported in the literature.
TOXICITY
Experimental Animals
The oral LD50 of t-butyl alcohol has been reported as 3.5 g/kg in rats and mice (Schaffarzick and Brown,
1952; NIOSH, 1970) and 3.6 g/kg in rabbits (Munch, 1972); 441 mg/kg is the reported LD50 for mice by
intraperitoneal injection (Maickel and McFadden, 1979). The primary acute effects in animals are signs of
alcoholic intoxication and hepatotoxicity.
13 t-Butyl Alcohol, NTP TOX 53
Tertiary alcohols are metabolized slowly and incompletely, so their toxic effects are especially persistent.
Most of the tertiary alcohols are central nervous system depressants. The sedative-intoxicant and
withdrawal effects of t-butyl alcohol are nearly identical to those of ethanol (LeBlanc and Kalant, 1975;
Bellin and Edmonds, 1976; Snell and Harris, 1980). t-Butyl alcohol is four to five times more potent than
ethanol in producing physical dependence in rats and mice (McComb and Goldstein, 1979; Wood and
Laverty, 1979; Thurman et al., 1980), and severe withdrawal reactions including anorexia, self-mutilation,
and death have occurred (Grant and Samson, 1981). The higher potency of t-butyl alcohol in producing
dependence is probably related to its slower clearance from the body.
A dose of 25 mmol t-butyl alcohol/kg body weight administered in water by gavage to female Wistar rats
resulted in an accumulation of triacylglycerols in the liver, accompanied by an early increase in palmitate
uptake into triacylglycerols and a delayed enhancement of free fatty acid concentrations in the blood
(Beaugé et al., 1981). There were no significant changes in hepatic or blood phospholipid concentrations at
2, 5, or 20 hours or in the 4-hour lactate/pyruvate ratio.
In a study of five butyl alcohols (method not given), t-butyl alcohol was found to have only a slight
inhibitory effect on rat liver mitochondrial respiration and phosphorylation (Thore and Baltscheffsky,
1965). t-Butyl alcohol was intraperitoneally administered in a 25% aqueous solution to male Sprague-
Dawley rats 18 hours prior to giving carbon tetrachloride or measuring glutathione concentrations. Serum
glutamate-pyruvate transaminase concentrations were used to evaluate carbon tetrachloride induced
hepatotoxicity.
t-Butyl alcohol was found to potentiate hepatotoxicity due to carbon tetrachloride by a mechanism that did
not alter hepatic glutathione concentrations or cause a loss of body weight (Harris and Anders, 1980).
Thirteen-week studies of t-butyl alcohol in drinking water were conducted by the NTP in conjunction with
2-year carcinogenicity studies (Lindamood et al., 1992; NTP, 1995). Male and female F344/N rats and
B6C3F1 mice were exposed to 0, 2.5, 5, 10, 20, or 40 mg/mL. Chemical effects in both species included
mortality, lower final mean body weights, and transitional epithelial hyperplasia and inflammation of the
urinary bladder at higher exposure levels. In exposed rats, increases in kidney weights were associated
microscopically with nephropathy in males and females and tubular hyaline droplet accumulation and
mineralization in males. Also in male rats, urinary bladder inflammation and hyperplasia associated with
crystalluria and bladder calculi were treatment effects.

14 t-Butyl Alcohol, NTP TOX 53
Humans
In some patients, t-butyl alcohol is a mild skin irritant. When the individual components of a sunscreen
preparation were patch-tested on a patient with an allergic contact dermatitis, t-butyl alcohol was
determined to be the cause (Edwards and Edwards, 1982). No other adverse effects of t-butyl alcohol in
humans have been reported in the literature.
REPRODUCTIVE AND DEVELOPMENTAL TOXICITY
Experimental Animals
In a comparative study in Swiss-Webster mice on the postnatal developmental effects of prenatal
administration of t-butyl alcohol or ethanol, a liquid diet containing either 0.5%, 0.75%, or 1.0% t-butyl
alcohol or 3.6% ethanol was fed to pregnant mice from gestation days 6 to 20. The t-butyl alcohol diet
resulted in dose-related reductions in the number of litters, litter size, and pup birth weights and an increase
in the number of stillborn pups. Testing of the pups indicated that t-butyl alcohol was approximately five
times more potent than ethanol in producing a developmental delay in postnatal physiological and
psychomotor performance (Daniel and Evans, 1982).
In another comparative study on the induction of microcephaly in neonatal Long-Evans rats, t-butyl alcohol
or ethanol was administered in the milk formula by cannulation on postnatal days 4 through 7 (Grant and
Samson, 1982). Mean daily doses of t-butyl alcohol were 0.60, 1.44, 2.16, or 2.69 g/kg body weight and
were of equal anesthetic value to the ethanol doses, calculated by membrane-to-buffer partition coefficients.
Following the 4-day alcohol exposure, all animals were given a plain milk formula by cannulation until
day 18. Microcephaly was present to a similar degree in both alcohol-treated groups but not in the
controls. It was suggested that the general impairment of brain growth could be due to the membrane
solubilizing properties of both alcohols.
In vitro studies showed that ethanol reduced the fertilizing capacity of mouse spermatozoa at concentrations
commonly observed after ethanol ingestion by man or experimental animals (100 to 400 mg/100 mL). At
similar concentrations, t-butyl alcohol had no effect on fertilization (Anderson et al., 1982).
Pregnant mice of the CBA/J and C57ABL/6J strains were given t-butyl alcohol (10.5 mmol/kg) or an
equivalent volume of tap water by gavage every 12 hours from gestation day 6 through day 18
(Faulkner et al., 1989). On day 18, there were significantly more resorptions per litter in the mice
receiving t-butyl alcohol than in the controls, but there was no interstrain difference. Blood concentration
15 t-Butyl Alcohol, NTP TOX 53
profiles in the C57ABL/6J mice showed that the treatment regimen produced t-butyl alcohol concentrations
in blood equivalent to teratogenic ethanol treatment. However, body weights of the survivors were not
affected, and no significant abnormalities occurred in either strain of animals receiving t-butyl alcohol.
In a teratology assessment of t-butyl alcohol, 1-butanol, and 2-butanol, pregnant Sprague-Dawley rats were
exposed by inhalation to 0, 2,000, 3,500, or 5,000 ppm t-butyl alcohol for 7 hours per day on gestation
days 1 through 19 (Nelson et al., 1989). Dams were sacrificed on day 20, and fetuses were examined for
skeletal abnormalities or visceral defects. No dose-related reduction in fetal weight occurred with any of
the butanol isomers, and concentrations 50 times the current permissible exposure limit (100 ppm) did not
produce teratogenic effects. In further investigations by Nelson et al. (1991), pregnant Sprague-Dawley
rats were exposed to 2,000 or 4,000 ppm t-butyl alcohol by inhalation for 7 hours per day on gestation days
1 through 19; males were similarly exposed for 6 weeks and were mated to unexposed females. The higher
concentration of t-butyl alcohol was maternally toxic, causing reduced feed intake and weight gain.
However, the few behavioral or neurochemical effects noted in the offspring on tests conducted through
90 days of age were not considered biologically significant.
In castrated rats, t-butyl alcohol was found to be four times as potent as ethanol in decreasing plasma
concentrations of luteinizing hormone, which regulates testosterone production (Chapin et al., 1980).
Humans
No information on the reproductive and developmental toxicity of t-butyl alcohol in humans has been
reported in the literature.
CARCINOGENICITY
Experimental Animals
Two-year studies of t-butyl alcohol in drinking water have been conducted in F344/N rats and B6C3F1 mice
by the NTP (1995). In rats, incidences of renal tubule hyperplasia and adenoma were increased in exposed
males; in addition, the severity of nephropathy and the incidence and severity of renal transitional cell
hyperplasia were also increased in exposed males. Incidences of thyroid gland follicular cell hyperplasia
and adenoma were increased in exposed male and female mice.
Humans
No information on the carcinogenicity of t-butyl alcohol in humans was found in the literature.

16 t-Butyl Alcohol, NTP TOX 53
GENETIC TOXICITY
The published genotoxicity data for t-butyl alcohol are from two studies, both of which are presented in
Appendix D of this report. Results showed no induction of mutations by t-butyl alcohol in any of four
strains of Salmonella typhimurium (Zeiger et al., 1987) or in L5178Y mouse lymphoma cells (McGregor
et al., 1988). Both studies were performed with and without S9.
STUDY RATIONALE AND DESIGN
The National Cancer Institute nominated t-butyl alcohol for study as a result of a review of chemicals found
in drinking water and because of its large annual production and potential for human exposure. Inhalation
and drinking water were chosen as the routes of exposure for the toxicity and carcinogenicity evaluations
because of concerns regarding possible exposure to t-butyl alcohol from gasoline fumes and groundwater
contamination. Toxicology and carcinogenesis studies with the drinking water route have been reported
(NTP, 1995). Endpoints evaluated in the inhalation studies included histopathology and clinical pathology
in F344/N rats and B6C3F1 mice. The effect of t-butyl alcohol on reproduction was assessed by evaluation
of testicular and epididymal spermatozoal parameters and determination of the length of the estrous cycle in
animals in the 13-week inhalation studies. In addition, the genetic toxicology of t-butyl alcohol was studied
in in vitro assays for mutation induction in Salmonella typhimurium and L5178Y mouse lymphoma cells, for
sister chromatid exchanges and chromosomal aberrations in cultured Chinese hamster ovary cells, for
induction of micronuclei in bone marrow cells of rats administered t-butyl alcohol by intraperitoneal
injection, and for increased frequency of micronuclei in peripheral erythrocytes of mice exposed to t-butyl
alcohol during the 13-week drinking water studies.

17
MATERIALS AND METHODS
PROCUREMENT AND CHARACTERIZATION OF t-BUTYL ALCOHOL
t-Butyl alcohol (CAS Number 75-65-0) was obtained in three lots from FBC Chemical Corporation
(Lancaster, NY). Lot UN-1120 was used throughout the 18-day studies and for part of the 13-week studies.
Lots F020487 and 070981 were used for the remainder of the 13-week studies. Identity, purity, and
stability analyses were conducted by the analytical chemistry laboratory, Midwest Research Institute
(Kansas City, MO). All lots of the chemical, a clear colorless liquid, were identified as t-butyl alcohol by
infrared, ultraviolet-visible, and nuclear magnetic resonance spectroscopy. All spectra were consistent with
those expected for the structure, and the infrared and nuclear magnetic resonance spectra were consistent
with the literature spectra of t-butyl alcohol (Aldrich, 1983; Sadtler Standard Spectra). Elemental analyses
for carbon and hydrogen were in agreement with the theoretical values for t-butyl alcohol. Karl Fischer
water analyses indicated 0.015% ± 0.003% water for lot UN-1120, 0.032% ± 0.002% water for lot
F020487,
and 0.24% ± 0.01% water for lot 070981. Gas chromatography of lots UN-1120 and F020487 using two
systems indicated one major peak and one impurity with a peak area greater than or equal to 0.1% relative
to the major peak. Gas chromatography of lot 070981 using two systems indicated two impurities with a
combined peak area of 0.291% relative to the major peak. The overall purity of each lot was determined to
be greater than 99%.
An accelerated stability study performed by the analytical chemistry laboratory using gas chromatography
indicated that t-butyl alcohol was stable as the bulk chemical for 2 weeks when stored protected from light
at temperatures up to 60E C. To ensure stability, the bulk chemical was stored at room temperature in
amber glass bottles with Teflon®-lined lids. During the 13-week studies, stability was monitored by gas
chromatography; no degradation of the bulk chemical was detected.
VAPOR GENERATION SYSTEM
Liquid t-butyl alcohol was delivered by a positive displacement metering pump to a slightly heated Sonimist
Ultrasonic Spray Nozzle nebulizer (Heat Systems-Ultrasonics, Inc., Farmingdale, NY). Liquid droplets
0.1 to 50 µm in diameter were discharged from the nebulizer into a plenum chamber and were evaporated
in a stream of filtered, compressed air pumped through the chamber at 50 psig. All tubing, lines, and
connectors were of stainless steel or Teflon® and were slightly heated to prevent solidification of the

18 t-Butyl Alcohol, NTP TOX 53
t-butyl alcohol. The vapor was drawn into a common distribution manifold and either passed undiluted into
the highest exposure chamber or was diluted with filtered room air by means of calibrated dilution flow
meters to achieve the desired lower concentrations for the other chambers. The flow rate through the
chamber was controlled by calibrated orifice flowmeters located in the exhaust line immediately
downstream of the chamber. The following parameters were recorded three times daily: the pressure
differential between each exposure chamber and the room, the chamber temperature and relative humidity,
and the flow through each of the calibrated dilution flowmeters. The H-2000 exposure chambers (Hazelton
Systems, Inc., Aberdeen, MD) had a 2 m3 volume.
CONCENTRATION MONITORING
t-Butyl alcohol vapor concentrations were measured by a infrared analyzer with absorbance at two different
wavelengths. A wavelength of 3,326 µm was used to monitor the three lowest exposure chambers in the
18-day studies and the two lowest in the 13-week studies. A wavelength of 8,598 µm was used to monitor
the two highest exposure chambers in the 18-day studies and the three highest in the 13-week studies.
Vapor concentration was measured hourly during exposure periods by means of a movable probe which
sequentially sampled 12 points within each chamber to ensure vapor concentration homogeneity.
CHAMBER CHARACTERIZATION
Vapor Concentration
Vapor concentration in each chamber was demonstrated to be uniform and stable. Target concentrations
and average concentration measurements recorded during the studies are summarized in Table 1. Target
chamber concentrations during the 18-day studies were 0, 450, 900, 1,750, 3,500, and 7,000 ppm. A
correction factor of 1.2 was applied to the recorded vapor concentrations for the 13-week studies due to a
discrepancy in the method of use of the infrared analyzer noted during the course of the 13-week studies.
Due to this correction, nominal chamber concentrations of t-butyl alcohol during the 13-week studies were
0, 135, 270, 540, 1,080, and 2,100 ppm.
Concentration Buildup and Decay
During the 18-day and 13-week studies, buildup and decay rates for chamber concentrations were
monitored with the Miran-80 infrared analyzer. Values were collected at 60-second intervals and plotted by
computer. The time following the start of exposure required for the t-butyl alcohol concentration to reach
90% of the final stable concentration level was identified as the T90 for chamber wash-in, and the time
following the termination of vapor generation required for the aerosol concentration to decay to 10% of the

19 t-Butyl Alcohol, NTP TOX 53
stable concentration level was identified as the T10 for chamber wash-out. The measured mean T90 wash-in
value of 9 minutes was in agreement with the theoretical value of 9.2 minutes; a T90 of 10 minutes was used
during the 18-day and 13-week studies.
TABLE 1 Summary of Chamber Concentrations in the 18-Day and 13-Week Inhalation Studies of t-Butyl Alcohol in F344/N Rats and B6C3F1 Mice
aTarget Concentration n Average Concentrationb
(ppm) (ppm)
Rats
18-Day Study 450 72 457 ± 15
7,000 6,989 ± 46
900 72 910 ± 16 1,750 72 1,750 ± 23 3,500 72 3,523 ± 64
6c
13-Week Study 113 66 134 ± 5 225 66 272 ± 9 450 66 542 ± 15 900 66 1,080 ± 25
1,750 66 2,101 ± 44
Mice
18-Day Study 450 72 457 ± 15
7,000 7,024 ± 170
900 72 910 ± 16 1,750 72 1,751 ± 23 3,500 72 3,524 ± 61
6c
13-Week Study 113 66 134 ± 5 225 66 272 ± 9 450 66 542 ± 15 900 66 1,080 ± 25
1,750 66 2,101 ± 44
a For the 18-day studies, n=total number of readings. For the 13-week studies, n=number of days for which mean concentrations were determined.
b Mean ± standard deviation All rats and mice died or were killed moribund after 1 day of exposure; therefore, no readings were taken during the remainder of the
18-day studies.
c

20 t-Butyl Alcohol, NTP TOX 53
Stability Studies
In order to identify possible degradation products caused by vaporization, cold trap samples were collected
from the highest and lowest concentration chambers during the last hour of a 6-hour exposure period.
These samples were analyzed by gas chromatography-mass spectrometry. This analysis was done with and
without animals in the chambers. No degradation products were detected at concentrations equal to or
greater than 1% of the t-butyl alcohol concentrations during the 18-day and 13-week studies. In addition,
each exposure chamber, the control chamber, and the room air were monitored with an aerosol monitor
(APS-33, TSI, Minneapolis, MN) both prior to and during the studies to detect any particulate material that
might arise during any part of the generation process. No significant particulate material was detected.
TOXICITY STUDY DESIGNS
Core Studies
F344/N rats and B6C3F1 mice used in the 18-day and 13-week studies were obtained from Taconic
Laboratory and Animal Services (Germantown, NY). On receipt, the rats and mice were approximately
4 weeks old. Animals were quarantined for 10 days (rats) or 11 days (mice) for the 18-day studies and
13 days for the 13-week studies and were 6 or 7 weeks old when the studies began. Before the beginning
of the studies, two male and two female rats and three male and two female mice from the 18-day studies
and five male and five female rats and mice from the 13-week studies were randomly selected for parasite
evaluation and gross observation for disease. Blood samples for determination of antibody titers to rodent
viruses and bacteria were collected from three male and two female rats and mice at three time points
during the 18-day studies and from five male and five female rats and mice at the end of the quarantine
period for the 13-week studies. Blood samples were also collected from five male and five female control
rats and mice at the end of the 13-week studies; the results indicated no positive antibody titers (Boorman
et al., 1986; Rao et al., 1989a,b). Additional details concerning the study design are listed in Table 2.
In the 18-day studies, groups of five male and five female rats and mice were exposed to t-butyl alcohol by
whole body inhalation to target concentrations of 0, 400, 900, 1,750, 3,500, and 7,000 ppm for 6 hours
plus T90 per day, 5 days per week (excluding weekends and a holiday), for 12 exposure days in an 18-day
period. Based on mortality and decreased body weights of animals exposed to target concentrations of
3,500 and 7,000 ppm, exposure levels selected for the 13-week studies were 0, 113, 225, 450, 900, and
1,750 ppm. Groups of 10 male and 10 female rats and mice were exposed for 6 hours plus T90 per day,
5 days per week (excluding weekends and a holiday), for 13 weeks, with at least 2 consecutive exposure

21 t-Butyl Alcohol, NTP TOX 53
days before sacrifice. Actual concentrations of t-butyl alcohol generated during the 13-week study were
135, 270, 540,1,080, and 2,100 ppm.
For all studies, rats and mice were housed individually. City water (Columbus, OH) was available
ad libitum. NIH-07 Open Formula Diet (Zeigler Brothers, Inc., Gardners, PA) in pellet form was available
ad libitum except during exposure periods and urine collection periods (rats). For the 18-day studies,
clinical findings were recorded twice daily (before and after exposure), and animals were weighed 5 days
before exposures began, on day 8, and at the end of the studies. For the 13-week studies, clinical findings
were recorded weekly and the animals were weighed 6 days before exposures began, weekly thereafter, and
at the end of the studies. Details of the study design and animal maintenance are summarized in Table 2.
Complete necropsies were performed on all animals. In the 18-day studies, the brain, heart, right kidney,
liver, lung, right testis, and thymus were weighed. Organs and tissues were examined for gross lesions and
were fixed and preserved in 10% neutral buffered formalin. Tissues to be examined microscopically were
trimmed, embedded in paraffin, sectioned to a thickness of 4 to 6 µm, and stained with hematoxylin and
eosin. In the 18-day studies, complete histopathologic examinations were performed on all rats and mice in
the 0, 3,500, and 7,000 ppm groups, and gross lesions were examined in rats and mice from all exposure
groups. In the 13-week studies, the brain, right epididymis, heart, right kidney, liver, lung, right testis,
and thymus were weighed, and tissues to be examined microscopically were similarly fixed, processed,
sectioned, and stained. Complete histopathologic examinations were performed on all rats and mice in the
0 and 2,100 ppm groups, and gross lesions were examined in rats and mice from all exposure groups. In
addition, the kidneys of all male rats were also examined. Table 2 lists the tissues and organs examined.
Upon completion of the laboratory pathologist's histologic evaluation, the slides, paraffin blocks, and
residual wet tissues were sent to the NTP Archives for inventory, slide/block match, and wet tissue audit.
The slides, individual animal data records, and pathology tables were sent to an independent pathology
laboratory where quality assessment was performed. Results were reviewed and evaluated by the NTP
Pathology Working Group (PWG); the final diagnoses represent a consensus of contractor pathologists and
the PWG. Details of these review procedures have been described by Maronpot and Boorman (1982) and
Boorman et al. (1985).

22 t-Butyl Alcohol, NTP TOX 53
Supplemental Evaluations
Clinical Pathology Studies
During the 13-week studies, blood samples were collected from rats twice, on day 22 and at the end of the
study, for hematology and clinical chemistry and from mice at the end of the study for hematology. Blood
was taken from the retroorbital sinus of rats and mice anesthetized with a mixture of carbon dioxide and
oxygen.
Samples for hematology determinations were collected in tubes containing sodium EDTA and analyzed with
an Ortho ELT-8 Laser Hematology Counter (Ortho Instruments, Westwood, MA). Blood smears were
stained with a Brecher's stain and counter stained with a modified Romanowsky stain. One hundred white
cells were identified for differential leukocyte counts and the number of reticulocytes per 1,000 erythrocytes
was counted on the same smear. Samples for clinical chemistry evaluations were collected in tubes without
anticoagulant. They were allowed to clot, were centrifuged, and the serum was removed and analyzed with
a Hitachi Automatic Chemistry Analyzer (Boehringer Mannheim, Indianapolis, IN).
Urine samples were collected from all rats for a 12-hour period twice during the 13-week study, on day 21
and during week 13. The rats were placed in individual metabolism cages for overnight urine collection.
Food was withheld during the collection periods, although water was available ad libitum. Urine samples
were collected in test tubes immersed in ice. The specific gravities of samples were determined using a
refractometer (American Optical, Buffalo, NY). Urine samples were centrifuged for 5 minutes at
2000 rpm, the sediment was resuspended in 500 µL of the supernatant, and the suspension was spread on a
slide and examined microscopically. Clinical pathology parameters evaluated in the 13-week studies are
listed in Table 2.
Sperm Morphology and Vaginal Cytology Evaluations
At the end of the 13-week studies, sperm morphology and vaginal cytology evaluations were performed on
10 male and 10 female rats and mice exposed to 0, 540, 1,080, or 2,100 ppm according to methods outlined
in the NTP's Sperm Motility Vaginal Cytology Evaluation protocol (NTP, 1984). For 7 consecutive days
prior to sacrifice, the vaginal vaults of 10 female rats and mice per exposure group were lavaged, and the
aspirated lavage fluid and cells were stained with Toluidine Blue. Relative numbers of leukocytes,
nucleated epithelial cells, and large squamous epithelial cells were determined and used to ascertain estrous
cycle stage (i.e., diestrus, proestrus, estrus, or metestrus).

23 t-Butyl Alcohol, NTP TOX 53
Sperm motility was evaluated at necropsy in the following manner. The right testis and epididymis of
10 male rats and mice were weighed. The tail of the epididymis (cauda epididymis) was then removed from
the epididymal body (corpus epididymis) and weighed. Test yolk (rats) or modified Tyrode's buffer (mice)
was applied to slides, and a small incision was made at the distal border of the cauda epididymis. The
sperm effluxing from the incision were dispersed in the buffer on the slides, and the numbers of motile and
nonmotile spermatozoa were counted for five microscopic fields per slide by two independent observers.
Following completion of sperm motility estimates, each cauda epididymis was placed in phosphate-buffered
saline solution. Caudae were finely minced and the tissue was incubated and then heat fixed at 65E C.
Sperm density was determined microscopically with the aid of a hemocytometer and slides were prepared
and stained with eosin for evaluation of sperm morphology.

24 t-Butyl Alcohol, NTP TOX 53
TABLE 2 Experimental Design and Materials and Methods in the 18-Day and 13-Week Inhalation Studies of t-Butyl Alcohol
18-Day Studies 13-Week Studies
EXPERIMENTAL DESIGN
Study Laboratory Battelle Columbus Laboratories, Columbus, OH
Size of Study Groups 5 males and 5 females
Exposure Concentrations/Duration Exposure concentrations: 0, 450, 900, 1,750, 3,500, and 7,000 ppm Duration: 6 hours plus T90 per day, 5 days per week (excluding one holiday) for 12 days
Date of First Exposure Rats: 18 August 1986 Mice: 19 August 1986
Date of Last Exposure Rats: 3 September 1986 Mice: 4 September 1986
Necropsy Dates Rats: 4 September 1986 Mice: 5 September 1986
Type and Frequency of Observation Animals were observed twice daily, 7 days per week for mortality/morbidity. Body weights were recorded prior to the first exposure, on day 8, and at the end of the studies. Clinical observations were recorded twice daily.
Necropsy Complete necropsies were performed on all animals and the brain, heart, right kidney, liver, lung, right testis, and thymus were weighed.
Battelle Columbus Laboratories, Columbus, OH
10 males and 10 females
Exposure concentrations: 0, 136, 270, 540, 1,080, and 2,100 ppm Duration: 6 hours plus T90 per day, 5 days per week (excluding one holiday) for 13 weeks
Rats: 25-26 February 1987 Mice: 4-5 March 1987
Rats: 27 or 28 May 1987 Mice: 3 or 4 June 1987
Rats: 28 or 29 May 1987 Mice: 4 or 5 June 1987
Animals were observed twice daily, 7 days per week for mortality/morbidity. Body weights were recorded prior to the first exposure, weekly thereafter, and at the end of the studies. Clinical observations were recorded weekly.
Complete necropsies were performed on all animals and the brain, heart, right kidney, liver, lung, right testis, and thymus were weighed.

25 t-Butyl Alcohol, NTP TOX 53
TABLE 2 Experimental Design and Materials and Methods in the 18-Day and 13-Week Inhalation Studies of t-Butyl Alcohol (continued)
18-Day Studies 13-Week Studies
EXPERIMENTAL DESIGN (continued)
Histopathologic Examinations Complete histopathologic examinations were performed on all animals in the 0, 3,500, and 7,000 ppm groups. Tissues examined microscopically included: adrenal gland, bone and marrow, brain (three sections), clitoral gland (rats), esophagus, gallbladder (mice), heart, large intestine (cecum, colon, rectum), kidney, larynx, liver, lung, lymph nodes (bronchial, mandibular, mediastinal, and mesenteric), mammary gland, nose, ovary, pancreas, parathyroid gland, pituitary gland, preputial gland (rats), prostate gland, salivary gland, skin, small intestine (duodenum, jejunum, ileum), spleen, stomach (forestomach and glandular), testis (with epididymis and seminal vesicle), thymus, thyroid gland, trachea, urinary bladder, and uterus. Gross lesions were examined microscopically in all exposure groups.
Supplemental Evaluations None
Complete histopathologic examinations were performed on all animals in the 0 and 2,100 ppm groups. Tissues examined microscopically were the same as for the 18-day studies, with the addition of the clitoral and preputial glands of mice. Gross lesions were examined microscopically in all exposure groups. In addition, the kidneys of all groups of male rats were examined.
Clinical pathology studies: Blood was collected from the retroorbital sinus of all rats on day 22 and at the end of the studies for hematology and clinical chemistry, and from all mice at the end of the studies for hematology. Urine was collected from rats on day 21 and at the end of the study. Hematology parameters evaluated included hematocrit, hemoglobin concentration, erythrocyte count, reticulocyte count, nucleated erythrocyte count, mean cell volume, mean cell hemoglobin, mean cell hemoglobin concentration, platelet count, and leukocyte count and differential. Clinical chemistry parameters evaluated in rats included alanine aminotransferase, alkaline phosphatase, sorbitol dehydrogenase, (-glutamyltransferase, and bile salts. Urinalysis parameters evaluated in rats included urine volume, specific gravity, pH, and microscopic examination of sediment.
Sperm morphology/vaginal cytology evaluations: Evaluations were performed on rats and mice in the 0, 540, 1,080, and 2,100 ppm groups. Male rats and mice were evaluated for necropsy body weights, reproductive tissue weights (right cauda, right epididymis, and right testis) and epididymal spermatozoal data (sperm density, morphology, and motility). Female rats and mice were evaluated for necropsy body weight, relative frequency of estrous stages, and estrous cycle length.

26 t-Butyl Alcohol, NTP TOX 53
TABLE 2 Experimental Design and Materials and Methods in the 18-Day and 13-Week Inhalation Studies of t-Butyl Alcohol (continued)
18-Day Studies 13-Week Studies
ANIMALS AND ANIMAL MAINTENANCE
Strain and Species F344/N rats B6C3F1 mice
Animal Source Taconic Laboratory and Animal Services, Germantown, NY
Time Held Before Study Rats: 10 days Mice: 11 days
Age When Study Began 6 weeks
Age When Killed 9 weeks
Method of Animal Distribution Animals were distributed randomly into groups of approximately equal initial mean body weight.
Diet NIH-07 open formula pellet diet (Zeigler Brothers, Inc., Gardners, PA), available ad libitum, except during exposure periods; changed weekly.
Chamber Environment Rats and mice were housed in individual cages in the exposure chambers for all studies. The temperature was maintained at 23.6E to 27.9E C and relative humidity at 47% to 76%, with 13-17 air changes per hour and 12 hours of fluorescent light per day.
F344/N rats B6C3F1 mice
Taconic Laboratory and Animal Services, Germantown, NY
13 days
7 weeks
20 weeks
Same as 18-day studies
NIH-07 Open Formula pellet diet (Zeigler Brothers, Inc., Gardners, PA), available ad libitum, except during exposure and urine collection periods; changed weekly.
Rats and mice were housed in individual cages. The temperature was maintained at 21E to 27.5E C and relative humidity at 28% to 76%, with 13-17 air changes per hour and 12 hours of fluorescent light per day.

27 t-Butyl Alcohol, NTP TOX 53
STATISTICAL METHODS
Analysis of Continuous Variables
Two approaches were employed to assess the significance of pairwise comparisons between exposed and
control groups in the analysis of continuous variables. Organ and body weight data, which are
approximately normally distributed, were analyzed using the parametric multiple comparisons procedures of
Williams (1971, 1972) or Dunnett (1955). Clinical chemistry, hematology, spermatid, and epididymal
spermatozoal data, which typically have skewed distributions, were analyzed using the nonparametric
multiple comparisons methods of Shirley (1977) or Dunn (1964). Jonckheere's test (Jonckheere, 1954) was
used to assess the significance of dose-response trends and to determine whether a trend-sensitive test
(Williams, Shirley) was more appropriate for pairwise comparisons than a test capable of detecting
departures from monotonic dose response (Dunnett, Dunn). If the P-value from Jonckheere's test was
greater than or equal to 0.10, Dunn's or Dunnett's test was used rather than Shirley's or Williams' test.
The outlier test of Dixon and Massey (1951) was employed to detect extreme values. No value selected by
the outlier test was eliminated unless it was at least twice the next largest value or at most half of the next
smallest value. The extreme values chosen by the statistical test were subject to approval by NTP
personnel. In addition, values indicated by the laboratory report as being inadequate due to technical
problems were eliminated from the analysis.
Analysis of Vaginal Cytology Data
Because the data are proportions (the proportion of the observation period that an animal was in a given
estrous stage), an arcsine transformation was used to bring the data into closer conformance with normality
assumptions. Treatment effects were investigated by applying a multivariate analysis of variance
(Morrison, 1976) to the transformed data to test for the simultaneous equality of measurements across
exposure levels.
GENETIC TOXICITY STUDIES
Salmonella typhimurium Mutagenicity Test Protocol
Testing was performed as reported by Zeiger et al. (1987). t-Butyl alcohol was sent to the laboratory as a
coded aliquot from Radian Corporation (Austin, TX). It was incubated with the Salmonella typhimurium
tester strains TA98, TA100, TA1535, and TA1537 either in buffer or S9 mix (metabolic activation enzymes
and cofactors from Aroclor 1254-induced male Sprague-Dawley rat or Syrian hamster liver) for 20 minutes
at 37E C. Top agar supplemented with l-histidine and d-biotin was added, and the contents of the tubes

28 t-Butyl Alcohol, NTP TOX 53
were mixed and poured onto the surfaces of minimal glucose agar plates. Histidine-independent mutant
colonies arising on these plates were counted following incubation for 2 days at 37E C.
Each trial consisted of triplicate plates of concurrent positive and negative controls and at least five doses of
t-butyl alcohol. In the absence of toxicity, 10,000 µg/plate was selected as the high dose. All assays were
repeated.
In this assay, a positive response is defined as a reproducible, dose-related increase in histidine-independent
(revertant) colonies in any one strain/activation combination. An equivocal response is defined as an
increase in revertants that is not dose related, not reproducible, or not of sufficient magnitude to support a
determination of mutagenicity. A negative response is obtained when no increase in revertant colonies is
observed following chemical treatment. There is no minimum percentage or fold increase required for a
chemical to be judged positive or weakly positive.
Mouse Lymphoma Mutagenicity Test Protocol
The experimental protocol is presented in detail by McGregor et al. (1988). t-Butyl alcohol was supplied as
a coded aliquot by Radian Corporation. The high dose of t-butyl alcohol was limited to 5,000 µg/mL.
L5178Y mouse lymphoma cells were maintained at 37E C as suspension cultures in Fischer's medium
supplemented with l-glutamine, sodium pyruvate, pluronic F68, antibiotics, and heat-inactivated horse
serum; normal cycling time was approximately 10 hours. To reduce the number of spontaneously occurring
trifluorothymidine-resistant cells, subcultures were exposed to medium containing THMG (thymidine,
hypoxanthine, methotrexate, and glycine) for 1 day, to medium containing THG for 1 day, and to normal
medium for 3 to 5 days. For cloning, the horse serum content was increased and Noble agar was added.
All treatment concentrations within an experiment, including concurrent positive and solvent controls, were
replicated. Treated cultures contained 6 × 10⁶ cells in 10 mL medium. This volume included the S9
fraction in those experiments performed with metabolic activation. All cells were incubated with t-butyl
alcohol for 4 hours, at which time the medium plus t-butyl alcohol was removed and the cells were
resuspended in fresh medium and incubated for an additional 2 days to express the mutant phenotype. Cell
density was monitored so that log phase growth was maintained. After the 48-hour expression period,
cells were plated in medium and soft agar supplemented with trifluorothymidine (TFT) for selection of
TFT-resistant (TK)/)) cells; cells were plated in nonselective medium and soft agar to determine cloning
efficiency. Plates were incubated at 37E C in 5% CO2 for 10 to 12 days. The test was initially performed

29 t-Butyl Alcohol, NTP TOX 53
without S9. Because a clearly positive response was not obtained, the test was repeated using freshly
prepared S9 from the livers of Aroclor 1254-induced or non-induced male F344/N rats.
Minimum criteria for accepting an experiment as valid and a detailed description of the statistical analysis
and data evaluation are presented in Caspary et al. (1988). All data were evaluated statistically for trend
and peak responses. Both responses had to be significant (P#0.05) for t-butyl alcohol to be considered
positive, i.e., capable of inducing TFT resistance. A single significant response led to a "questionable"
conclusion, and the absence of both a trend and peak response resulted in a "negative" call.
Chinese Hamster Ovary Cell Cytogenetics Protocols
Testing was performed as reported by Galloway et al. (1987). t-Butyl alcohol was sent to the laboratory as
a coded aliquot by Radian Corporation. It was tested in cultured Chinese hamster ovary (CHO) cells for
induction of sister chromatid exchanges (SCEs) and chromosomal aberrations (Abs), both in the presence
and absence of Aroclor 1254-induced male Sprague-Dawley rat liver S9 and cofactor mix. Cultures were
handled under gold lights to prevent photolysis of bromodeoxyuridine-substituted DNA. Each test consisted
of concurrent solvent and positive controls and of at least four doses of t-butyl alcohol; 5,000 µg/mL was
selected as the high dose. A single flask per dose was used, and tests yielding equivocal or positive results
were repeated.
In the SCE test without S9, CHO cells were incubated for 26 hours with t-butyl alcohol in supplemented
McCoy's 5A medium. Bromodeoxyuridine (BrdU) was added 2 hours after culture initiation. After
26 hours, the medium containing t-butyl alcohol was removed and replaced with fresh medium plus BrdU
and Colcemid, and incubation was continued for 2 hours. Cells were then harvested by mitotic shake-off,
fixed, and stained with Hoechst 33258 and Giemsa. In the SCE test with S9, cells were incubated with
t-butyl alcohol, serum-free medium, and S9 for 2 hours. The medium was then removed and replaced with
medium containing serum and BrdU and no t-butyl alcohol, and incubation proceeded for an additional
26 hours, with Colcemid present for the final 2 hours. Harvesting and staining were the same as for cells
treated without S9. All slides were scored blind and those from a single test were read by the same person.
Fifty second-division metaphase cells were scored for frequency of SCEs per cell from each dose level.
In the Abs test without S9, cells were incubated in McCoy's 5A medium with t-butyl alcohol for 9 to
9.5 hours; Colcemid was added and incubation continued for 2 hours. The cells were then harvested by
mitotic shake-off, fixed, and stained with Giemsa. For the Abs test with S9, cells were treated with
t-butyl alcohol and S9 for 2 hours, after which the treatment medium was removed and the cells were

30 t-Butyl Alcohol, NTP TOX 53
incubated for 9.5 to 10 hours in fresh medium, with Colcemid present for the final 2 hours. Cells were
harvested in the same manner as for the treatment without S9.
Cells were selected for scoring on the basis of good morphology and completeness of karyotype
(21 ± 2 chromosomes). All slides were scored blind and those from a single test were read by the same
person. One hundred first-division metaphase cells were scored at each dose level. Classes of aberrations
included simple (breaks and terminal deletions), complex (rearrangements and translocations), and other
(pulverized cells, despiralized chromosomes, and cells containing 10 or more aberrations).
For the SCE data, statistical analyses were conducted on the slopes of the dose-response curves and the
individual dose points (Galloway et al., 1987). An SCE frequency 20% above the concurrent solvent
control value was chosen as a statistically conservative positive response. The probability of this level of
difference occurring by chance at one dose point is less than 0.01; the probability for such a chance
occurrence at two dose points is less than 0.001. An increase of 20% or greater at any single dose was
considered weak evidence of activity; increases at two or more doses resulted in a determination that the
trial was positive. A statistically significant trend (P#0.05) in the absence of any responses reaching 20%
above background led to a call of equivocal.
Chromosomal aberration data are presented as percentage of cells with aberrations. To arrive at a statistical
call for a trial, analyses were conducted on both the dose response curve and individual dose points. For a
single trial, a statistically significant (P#0.05) difference for one dose point and a significant trend
(P#0.015) were considered weak evidence for a positive response; significant differences for two or more
doses indicated the trial was positive. A positive trend test in the absence of a statistically significant
increase at any one dose resulted in an equivocal call (Galloway et al., 1987). Ultimately, calls were based
on a consideration of the statistical analyses as well as the biological information available to the reviewers.
Rat Bone Marrow Micronucleus Test Protocol
Preliminary range-finding studies were performed. Factors affecting dose selection included chemical
solubility and toxicity and the extent of cell cycle delay induced by t-butyl alcohol exposure. Male F344/N
rats were injected intraperitoneally (three times at 24-hour intervals) with t-butyl alcohol dissolved in
phosphate-buffered saline; the total dosing volume was 0.4 mL. Solvent control animals were injected with
0.4 mL of phosphate-buffered saline only. The positive control animals received cyclophosphamide. The
rats were killed 24 hours after the third injection, and blood smears were prepared from bone marrow cells

31 t-Butyl Alcohol, NTP TOX 53
obtained from the femurs. Air-dried smears were fixed and stained; 2,000 polychromatic erythrocytes were
scored for the frequency of micronucleated cells in each of five animals per dose group.
The results were tabulated as the mean of the pooled results from all animals within a treatment group plus
or minus the standard error of the mean. The frequency of micronucleated cells among polychromatic
erythrocytes was analyzed by a statistical software package that tested for increasing trend over dose groups
with a one-tailed Cochran-Armitage trend test, followed by pairwise comparisons between each dosed group
and the control group (Margolin et al., 1990). In the presence of excess binomial variation, as detected by
a binomial dispersion test, the binomial variance of the Cochran-Armitage test was adjusted upward in
proportion to the excess variation. In the micronucleus test, an individual trial is considered positive if the
trend test P value is less than or equal to 0.025 or if the P value for any single dose group is less than or
equal to 0.025 divided by the number of dose groups. A final call of positive micronucleus induction is
preferably based on reproducibly positive trials (as noted above). Results of the 13-week studies were
accepted without repeat tests, because additional test data could not be obtained. Ultimately, the final call is
determined by the scientific staff after considering the results of statistical analyses, the reproducibility of
any effects observed, and the magnitude of those effects.
Mouse Peripheral Blood Micronucleus Test Protocol
A detailed discussion of this assay can be found in MacGregor et al. (1990). Peripheral blood samples
were obtained from male and female B6C3F1 mice at the end of the 13-week drinking water study of
t-butyl alcohol. Smears were immediately prepared and fixed in absolute methanol, stained with a
chromatin-specific fluorescent dye mixture of Hoechst 33258/pyronin Y (MacGregor et al., 1983), and
coded. Slides were scanned at 630× or 1,000× magnification using a semi-automated image analysis
system to determine the frequency of micronuclei in 10,000 normochromatic erythrocytes (NCEs) in up to
10 animals per dose group. Data were analyzed by the methods used for the bone marrow micronucleus
test.
QUALITY ASSURANCE METHODS
The animal studies of t-butyl alcohol were performed in compliance with United States FDA Good
Laboratory Practices regulations (21 CFR, Part 58). The Quality Assurance Unit of Battelle Columbus
Laboratories performed audits and inspections of protocols, procedures, data, and reports throughout the
course of the studies.

32 t-Butyl Alcohol, NTP TOX 53

33
RESULTS
18-DAY INHALATION STUDY IN F344/N RATS
All males and females exposed to 7,000 ppm died on day 2. All other rats survived to the end of the study
(Table 3). Final mean body weights and mean body weight gains of 3,500 ppm males and females were
significantly lower than those of the controls at the end of the 18-day study; males and females exposed to
3,500 ppm weighed 14% and 13% less than the controls, respectively.
TABLE 3 Survival and Body Weights of F344/N Rats in the 18-Day Inhalation Study of t-Butyl Alcohol
Exposure Mean Body Weightb (g) Final Weight Concentration Survivala Initial Final Change Relative to Controls
(ppm) (%)
Male
0 5/5 90 ± 3 196 ± 5 105 ± 5 450 5/5 91 ± 3 196 ± 4 105 ± 2 100 900 5/5 90 ± 3 204 ± 6 114 ± 4 104
1,750 5/5 91 ± 3 197 ± 5 105 ± 3 100 3,500 5/5 91 ± 3 168 ± 3** 77 ± 2** 86 7,000 0/5c 90 ± 2 — — —
Female
0 5/5 87 ± 1 143 ± 2 56 ± 1 450 5/5 88 ± 1 145 ± 2 58 ± 2 102 900 5/5 88 ± 2 146 ± 4 58 ± 3 102
1,750 5/5 88 ± 1 142 ± 2 54 ± 2 99 3,500 5/5 87 ± 2 125 ± 2** 37 ± 3** 87 7,000 0/5c 88 ± 2 — — —
** Significantly different (P#0.01) from the control group by Williams' or Dunnett's test a Number of animals surviving at 18 days/number initially in group.b Weights and weight changes are given as mean ± standard error. No data were calculated for groups with 100% mortality.
Killed moribund on day 2. c

34 t-Butyl Alcohol, NTP TOX 53
All male and female rats in the 7,000 ppm group were moribund immediately following the first exposure
to t-butyl alcohol and were therefore killed just before the second exposure was to begin. Clinical findings
of toxicity in surviving males and females included ataxia, hyperactivity, and hypoactivity at exposure
concentrations of 900 ppm and higher.
In 3,500 ppm males and females, thymus weights were decreased relative to those of the controls
(Table A1). Other statistically significant organ weight differences were considered related to lower final
mean body weights (in animals exposed to 3,500 ppm) or were considered random and unrelated to t-butyl
alcohol exposure.
There were no treatment-related gross or microscopic findings in rats that died early or in those that
survived to the end of the study.

35
c
t-Butyl Alcohol, NTP TOX 53
13-WEEK INHALATION STUDY IN F344/N RATS
All rats survived to the end of the study, with the exception of one 135 ppm male accidentally killed during
blood collection on day 22. Final mean body weights and body weight gains of all exposed groups of
animals were similar to those of the controls (Table 4 and Figure 1).
TABLE 4 Survival and Body Weights of F344/N Rats in the 13-Week Inhalation Study of t-Butyl Alcohol
Exposure Concentration
(ppm) Survivala Initial
Mean Body Weightb (g) Final Change
Final Weight Relative to Controls
(%)
Male
0 135 270 540
1,080 2,100
10/10 9/10c
10/10 10/10 10/10 10/10
131 ± 2 131 ± 3 127 ± 3 126 ± 2 129 ± 2 127 ± 2
321 ± 7 319 ± 6 316 ± 7 327 ± 8 332 ± 5 328 ± 7
190 ± 6 189 ± 4 189 ± 7 201 ± 6 202 ± 5 201 ± 6
100 99
102 103 102
Female
0 135 270 540
1,080 2,100
10/10 10/10 10/10 10/10 10/10 10/10
109 ± 2 109 ± 2 113 ± 5 113 ± 2 111 ± 2 108 ± 2
203 ± 3 192 ± 4 201 ± 4 204 ± 2 203 ± 3 197 ± 3
93 ± 2 84 ± 4 88 ± 4 92 ± 2 93 ± 2 89 ± 2
95 99
101 100 97
a Number of animals surviving at 13 weeks/number initially in groupb Weights and weight changes are given as mean ± standard error. Subsequent calculations are based on animals surviving to the end of
the study. Differences from the control group were not significant by Dunnett's test. Week of death: 4 (accidental death)
Exposure-related clinical signs in 2,100 ppm females were emaciation and hypoactivity, noted at one
observation period only. All other clinical findings occurred sporadically and were not considered related
to chemical administration.


37 t-Butyl Alcohol, NTP TOX 53
The hematology, clinical chemistry, and urinalysis data for rats in the 13-week inhalation study of
t-butyl alcohol are listed in Tables 5, B1, B2, and B3. At week 13, a minimal anemia, evidenced by a
minimal decrease in hematocrit values, hemoglobin concentrations, and erythrocyte counts, occurred in the
1,080 and 2,100 ppm male rats. Hemoglobin concentrations and/or hematocrit values also were minimally
decreased in male rats in the 135, 270, and 540 ppm groups. Red blood cell variables were not decreased
in the female rats. The mean cell volume, mean cell hemoglobin concentration, and reticulocyte and
nucleated erythrocyte counts were not altered, indicating the anemia was normocytic, normochromic,
TABLE 5 Selected Clinical Pathology Data for F344/N Rats in the 13-Week Inhalation Study of t-Butyl Alcohola
0 ppm 135 ppm 270 ppm 540 ppm 1,080 ppm 2,100 ppm
Male n 10 9 10 10 10 10
Hematology
Hematocrit (%) Day 22 50.2 ± 0.5 Week 13 51.7 ± 0.5
Hemoglobin (g/dL) Day 22 15.9 ± 0.1 Week 13 15.9 ± 0.2
Erythrocytes (106/µL) Day 22 8.86 ± 0.09 Week 13 9.62 ± 0.10
50.5 ± 0.5 50.3 ± 0.4
15.9 ± 0.1 15.4 ± 0.1*
8.89 ± 0.09 9.41 ± 0.07
50.1 ± 0.4 50.2 ± 0.4*
15.8 ± 0.1 15.4 ± 0.1*
8.81 ± 0.07 9.39 ± 0.07
49.7 ± 0.4 50.8 ± 0.5
15.8 ± 0.1 15.6 ± 0.1*
8.68 ± 0.08 9.47 ± 0.11
49.4 ± 0.4 49.2 ± 0.6**
15.6 ± 0.1 15.0 ± 0.2**
8.72 ± 0.08 9.19 ± 0.12**
49.7 ± 0.5 49.3 ± 0.5**
16.0 ± 0.2 15.1 ± 0.2**
8.73 ± 0.10 9.14 ± 0.09**
Clinical Chemistry
Alkaline phosphatase (IU/L) Day 22 1,245 ± 22 Week 13 531 ± 15
1,311 ± 67 504 ± 14
1,182 ± 21 536 ± 17
1,156 ± 22* 490 ± 12
1,086 ± 17** 474 ± 12*
1,074 ± 17** 483 ± 10*
Urinalysis
pH Day 21 Week 13
6.77 ± 0.04 6.55 ± 0.03
6.69 ± 0.06b
6.51 ± 0.04 6.68 ± 0.03 6.56 ± 0.04
6.55 ± 0.03** 6.56 ± 0.06
6.50 ± 0.03** 6.48 ± 0.03
6.42 ± 0.03** 6.34 ± 0.03**
Female n 10 10 10 10 10 10
Urinalysis
pH Day 21 Week 13
6.74 ± 0.05 6.55 ± 0.04
6.73 ± 0.04 6.60 ± 0.04
6.64 ± 0.05 6.42 ± 0.05
6.60 ± 0.06c
6.40 ± 0.05 6.52 ± 0.04** 6.28 ± 0.05**
6.46 ± 0.03**6.29 ± 0.10**
* Significantly different (P#0.05) from the control group by Dunn's or Shirley's test ** P#0.01 a b
Mean ± standard error. Statistical tests were performed on unrounded data. n=10
c n=9

38 t-Butyl Alcohol, NTP TOX 53
and nonresponsive. A minimal to mild decrease in alkaline phosphatase activity occurred in the 540, 1,080,
and 2,100 ppm male rats on day 22 and in the 1,080 and 2,100 ppm males at week 13. At week 13, a
minimal decrease in urine pH occurred in the 2,100 ppm males and 1,080 and 2,100 ppm females. Other
changes in clinical pathology variables were minimal and were not considered to be related to chemical
exposure.
The absolute and relative right kidney weights of 1,080 and 2,100 ppm males were significantly greater
than those of the controls (Tables 6 and A2). The relative right kidney weight of 2,100 ppm females and
relative liver weights of 1,080 and 2,100 ppm females were significantly greater than those of the controls.
Other statistically significant differences in organ weights of males were random and were not considered
related to chemical administration.
TABLE 6 Selected Organ Weights and Organ-Weight-to-Body-Weight Ratios for F344/N Rats in the 13-Week Inhalation Study of t-Butyl Alcohola
0 ppm 135 ppm 270 ppm 540 ppm 1,080 ppm 2,100 ppm
Male n 10 9 10 10 10 10
Necropsy body wt 329 ± 8 327 ± 7 325 ± 8 332 ± 8 339 ± 5 331 ± 7
R. Kidney Absolute 1.206 ± 0.026 1.213 ± 0.032 1.180 ± 0.025 1.248 ± 0.035 1.341 ± 0.017** 1.324 ± 0.028** Relative 3.68 ± 0.08 3.71 ± 0.04 3.64 ± 0.04 3.76 ± 0.06 3.96 ± 0.05** 4.00 ± 0.05**
Liver Absolute 13.273 ± 0.447 12.200 ± 0.324 13.005 ± 0.546 13.364 ± 0.615 14.571 ± 0.401 13.987 ± 0.329 Relative 40.37 ± 0.99 37.31 ± 0.45 39.93 ± 1.12 40.12 ± 1.05 43.11 ± 1.34 42.22 ± 0.66
Female n 10 10 10 10 10 10
Necropsy body wt 204 ± 3 196 ± 4 204 ± 4 206 ± 3 204 ± 4 195 ± 3
R. Kidney Absolute 0.817 ± 0.043 0.782 ± 0.020 0.821 ± 0.019 0.853 ± 0.014 0.831 ± 0.017 0.849 ± 0.012 Relative 4.00 ± 0.15 3.98 ± 0.06 4.03 ± 0.05 4.14 ± 0.04 4.09 ± 0.06 4.35 ± 0.03**
Liver Absolute 7.008 ± 0.139 6.977 ± 0.245 7.035 ± 0.158 7.210 ± 0.188 7.628 ± 0.253 7.295 ± 0.215 Relative 34.45 ± 0.49 35.49 ± 0.87 34.57 ± 0.65 35.03 ± 0.86 37.47 ± 1.04* 37.31 ± 0.73*
* Significantly different (P#0.05) from the control group by Williams' or Dunnett's test ** P#0.01 a Organ weights (absolute weights) and body weights are given in grams; organ-weight-to-body-weight ratios (relative weights) are given
as mg organ weight/g body weight (mean ± standard error).

39
c
t-Butyl Alcohol, NTP TOX 53
There were no treatment-related gross necropsy observations in exposed male or female rats and no
microscopic findings in female rats. In male rats, an exposure-related increase in the severity of chronic
nephropathy relative to the controls occurred in all exposed groups (Table 7). In control male rats, chronic
nephropathy was a minimal lesion occurring in most animals and consisting of 1 to 3 scattered foci of
regenerative tubules per kidney section. Regenerative foci were characterized by tubules with cytoplasmic
basophilia, increased nuclear/cytoplasmic ratio, and occasionally thickened basement membranes and
intraluminal protein casts. In exposed groups, the severity of nephropathy was increased as evidenced by
an increased number of foci per section.
Sections of kidneys from male rats in the 0, 1,080, and 2,100 ppm groups (four per group) were stained by
the Mallory-Heidenhain method for the presence of tubular hyaline droplet accumulation. There was no
difference between control and exposed animals in the number, size, or shape of renal tubule hyaline
droplets.
TABLE 7 Incidence and Severity of Chronic Nephropathy in Male F344/N Rats in the 13-Week Inhalation Study of t-Butyl Alcohol
0 ppm 135 ppm 270 ppm 540 ppm 1,080 ppm 2,100 ppm
Kidney
Nephropathy
Severity
10a
9b
1.0c
10
8
1.4
10
9
1.4
10
10
1.6
10
10
1.9
10
10
2.0
a Number of animals with tissue examined microscopically
b Number of animals with lesion Average severity of lesions in affected rats: 1 = minimal, 2 = mild
There were no significant differences in reproductive tissue parameters or estrous cycle characterization
between exposed and control groups (Table C1).

40
c
t-Butyl Alcohol, NTP TOX 53
18-DAY INHALATION STUDY IN B6C3F1 MICE
All 7,000 ppm males and females died on day 2 and one male exposed to 3,500 ppm died on day 3
(Table 8). All other mice survived to the end of the study. Final mean body weights and body weight gains
of exposed groups of mice were similar to those of the controls (Table 8).
TABLE 8 Survival and Body Weights of B6C3F1 Mice in the 18-Day Inhalation Study of t-Butyl Alcohol
Exposure Concentration
(ppm) Survivala Initial
Mean Body Weightb (g)Final Change
Final WeightRelative to Controls
(%)
Male
0 450 900
1,750 3,500 7,000
5/5 5/5 5/5 5/5 4/5c
0/5d
20.8 ± 0.3 21.0 ± 0.4 20.9 ± 0.3 21.0 ± 0.3 20.9 ± 0.3 20.8 ± 0.4
25.8 ± 0.5 26.6 ± 0.7 25.7 ± 0.6 26.6 ± 1.1 26.1 ± 0.6
—
5.0 ± 0.6 5.6 ± 0.8 4.9 ± 0.8 5.6 ± 0.9 5.3 ± 0.6
—
103 100 103 101 —
Female
0 450 900
1,750 3,500 7,000
5/5 5/5 5/5 5/5 5/5 0/5d
18.4 ± 0.4 18.3 ± 0.4 18.2 ± 0.4 18.3 ± 0.4 18.2 ± 0.3 18.5 ± 0.4
22.8 ± 0.4 21.9 ± 0.5 22.3 ± 0.3 22.6 ± 0.5 23.5 ± 0.5
—
4.3 ± 0.4 3.6 ± 0.5 4.1 ± 0.3 4.3 ± 0.7 5.3 ± 0.3
—
96 98 99 103 —
a Number of animals surviving at 18 days/number initially in group.b Weights and weight changes are given as mean ± standard error. Subsequent calculations are based on animals surviving to the end of
the study. No data were calculated for groups with 100% mortality. Differences from the control group were not significant by Dunnett's test. Day of death: 3
d Killed moribund on day 2.
All male and female mice in the 7,000 ppm groups were moribund immediately following the first exposure
to t-butyl alcohol and were therefore killed just before the second exposure was to begin. In 3,500 ppm
males and females, animals were prostrate following the first exposure through day 3 of the study.
Thereafter, clinical signs in these groups were observed predominantly post-exposure and included
hypoactivity, ataxia, and rapid respiration. Hypoactivity, hyperactivity, ataxia, and urogenital wetness also
occurred at lower incidences in mice exposed to 1,750 ppm.
The relative liver weight of 3,500 ppm males and absolute and relative liver weights of 3,500 ppm females
were significantly greater than those of the controls, and the absolute and relative thymus weights of

41 t-Butyl Alcohol, NTP TOX 53
3,500 ppm females were significantly lower than those of the controls (Table A3). Other statistically
significant differences in organ weights of males were considered random and not related to chemical
administration. There were no treatment-related gross findings or microscopic lesions present in mice that
survived to the end of the study or in early deaths.

42 t-Butyl Alcohol, NTP TOX 53
13-WEEK INHALATION STUDY IN B6C3F1 MICE
Five males exposed to 1,080 ppm died during weeks 3 and 4 (Table 9). These deaths occurred in animals
in adjacent cages and were thought to be due to a water or feed availability problem. Feed and water
consumption data were not available to confirm this. The death of one 2,100 ppm male during week 7 was
attributed to t-butyl alcohol exposure. The remaining mice survived to the end of the study. The initial
mean body weight of 270 ppm males was significantly greater than that of the controls, but the mean body
weight gain of this exposure group was significantly lower than that of the controls. The mean body weight
gains of 1,080 and 2,100 ppm females and the final mean body weight of 2,100 ppm females were
significantly lower than those of the controls. At the end of the 13-week study, females exposed to
2,100 ppm weighed 8% less than the controls (Table 9 and Figure 2).
TABLE 9 Survival and Body Weights of B6C3F1 Mice in the 13-Week Inhalation Study of t-Butyl Alcohol
Exposure Concentration
(ppm) Survivala Initial
Mean Body Weightb (g) Final Change
Final WeightRelative to Controls
(%)
Male
0 135 270 540
1,080 2,100
10/10 10/10 10/10 10/10 5/10c
9/10d
23.2 ± 0.4 22.1 ± 0.5 25.2 ± 0.3** 22.1 ± 0.6 23.4 ± 0.4 24.4 ± 0.3
32.8 ± 0.8 34.0 ± 1.0 32.2 ± 0.7 32.9 ± 0.6 31.6 ± 0.6 32.7 ± 0.6
9.6 ± 0.6 12.0 ± 0.8* 7.0 ± 0.4**
10.8 ± 0.4 8.7 ± 0.8 8.4 ± 0.4
104 98 100 96
100
Female
0 135 270 540
1,080 2,100
10/10 10/10 10/10 10/10 10/10 10/10
18.5 ± 0.2 18.8 ± 0.3 18.7 ± 0.3 19.0 ± 0.3 18.7 ± 0.3 18.4 ± 0.2
28.2 ± 0.6 29.0 ± 0.6 27.2 ± 0.6 29.1 ± 0.9 26.6 ± 0.4 25.8 ± 0.5**
9.7 ± 0.5 10.2 ± 0.4 8.5 ± 0.5
10.2 ± 0.8 7.9 ± 0.2* 7.4 ± 0.4**
103 97 103 94 92
* Significantly different (P#0.05) from the control group by Williams' or Dunnett's test ** P#0.01 a Number of animals surviving at 13 weeks/number initially in groupb Weights and weight changes are given as mean ± standard error. Subsequent calculations are based on animals surviving to the end of
the study. Week of death: 3, 3, 3, 4, 4
d Week of death: 7
c


44 t-Butyl Alcohol, NTP TOX 53
Clinical findings occurred sporadically and were not considered related to chemical administration.
The hematology data for mice in the 13-week inhalation study of t-butyl alcohol are listed in Table B4. At
week 13, there was a marked increase in the segmented neutrophil count of 2,100 ppm male mice. Other
changes in hematology variables were minimal, did not demonstrate a treatment relationship, and were not
considered to be related to chemical exposure.
The relative liver weights of 1,080 and 2,100 ppm females were significantly greater than that of the
controls. Other statistically significant organ weight differences in the 2,100 ppm females were considered
to be related to the lower final mean body weights in this group (Table A4).
There were no treatment-related gross or microscopic observations in mice that survived to the end of the
study. No lesions corresponding to the increased liver weights were found. No lesions to account for early
deaths were present.
No significant differences occurred in the reproductive endpoints of exposed males (weight of testis,
epididymis, and cauda; sperm motility, count, and morphology) or females (estrous cycle length or
percentage of time spent in the various estrous stages) exposed to 540, 1,080, or 2,100 ppm t-butyl alcohol
(Table C2).

45 t-Butyl Alcohol, NTP TOX 53
GENETIC TOXICOLOGY
t-Butyl alcohol (100 to 10,000 Fg/plate) did not induce mutations in Salmonella typhimurium strain TA98,
TA100, TA1535, or TA1537 with or without induced rat or hamster liver S9 (Zeiger et al., 1987;
Table D1). Results of a mouse lymphoma cell mutation test were also considered to be negative, although a
small increase in mutant colonies was observed in a single trial at the highest dose tested (5,000 Fg/mL) in
the absence of S9 (McGregor et al., 1988; Table D2). McGregor et al. (1988) presented an additional trial
conducted without S9 that showed no increase in mutant colonies at any of the doses tested; that trial is not
included in Table D2 because it did not meet quality control standards for the assay. The two trials
conducted with S9 are clearly negative. In cytogenetic tests with cultured Chinese hamster ovary cells,
t-butyl alcohol at doses up to 5,000 Fg/mL did not induce sister chromatid exchanges (Table D3) or
chromosomal aberrations (Table D4), with or without S9. In the sister chromatid exchange test without S9,
a weakly positive result was obtained in the first trial but it was not reproduced in the second trial. Neither
trial conducted with S9 showed an increase in sister chromatid exchanges and the results of this test were
considered negative. No cytotoxic effects were noted in the cultured Chinese hamster ovary cell
experiments, with one exception. In the chromosomal aberrations test, the dose of 5,000 Fg/mL in the
second trial performed with S9 produced toxicity severe enough to allow only 13 cells to be analyzed for
aberrations, rather than the usual 100 cells per dose point.
In vivo, no induction of micronuclei in polychromatic erythrocytes was observed in bone marrow cells of
male rats receiving intraperitoneal injections of t-butyl alcohol (Table D5). No increase in the frequency of
micronucleated normochromatic erythrocytes was observed in male or female mice administered t-butyl
alcohol in drinking water for 13 weeks (Table D6). In addition, no effect on the percentage of
polychromatic erythrocytes in the total erythrocyte population was noted, an indication that t-butyl alcohol
was not toxic to bone marrow cells.

46 t-Butyl Alcohol, NTP TOX 53

47
DISCUSSION
t-Butyl alcohol is widely used in cosmetics and in cleaning compounds and as a raw material in the
production of the common gasoline additive methyl tertiary butyl ether. t-Butyl alcohol is also a major
metabolite of methyl tertiary butyl ether. The National Cancer Institute nominated t-butyl alcohol for
toxicity and carcinogenicity studies as a result of a review of chemicals found in drinking water. It was
selected for study because of its large annual production and the potential for human exposure. Both
inhalation and drinking water routes of administration were tested.
Similar to alcohols in general, the acute toxicity of t-butyl alcohol is related to alcohol intoxication and
central nervous system depression. In the present 18-day studies, hypoactivity, ataxia, and prostration were
observed in both rats and mice, and mortality occurred in both species at an exposure concentration of
7,000 ppm. The same clinical findings and mortality occurred at the highest exposure concentration
(40 mg/mL) in the 13-week drinking water studies of t-butyl alcohol (NTP, 1995). Due to mortality at
7,000 ppm and decreased body weights or clinical signs of intoxication at 3,500 ppm, the highest exposure
concentration selected for the 13-week studies was 1,700 ppm. During the course of the 13-week studies, a
discrepancy between the target concentrations and actual concentrations generated was noted, such that the
highest exposure concentration during these studies was 2,100 ppm.
Effects of t-butyl alcohol exposure on clinical pathology parameters in rats were of minimal severity and
were limited to the 1,080 and 2,100 groups. A nonregenerative anemia and decreased serum alkaline
phosphatase activity in exposed males could not be related to histopathologic or other toxicologic changes.
In male mice, a marked increase in the number of segmented neutrophils was present in the 2,100 ppm
group, consistent with an inflammatory process. There were, however, no gross or microscopic lesions to
account for the neutrophilia.
Histopathologic treatment-related effects in the 13-week inhalation studies of t-butyl alcohol were limited to
the kidney of male rats. Increases in kidney weight at the higher exposure concentrations corresponded
microscopically to enhanced severity of chronic nephropathy. Chronic nephropathy is a common
spontaneous lesion in male rats and frequently is exacerbated by chemical treatment. In the drinking water
study of t-butyl alcohol, exacerbation of chronic nephropathy in male rats was also a treatment effect seen at

48 t-Butyl Alcohol, NTP TOX 53
13 weeks (NTP, 1995). However, in that study the enhanced nephropathy was also associated with
accumulation of renal tubule hyaline droplets (presumably " 2u-globulin), unlike the current study, in which
special stains revealed no increase in protein droplets. The absence of protein accumulation in the present
inhalation study, in spite of its presence in the previous drinking water study, is likely an exposure effect.
For example, perchloroethylene administered at high doses by gavage has been shown to cause marked
accumulation of hyaline droplets in rats. Inhalation exposure to this chemical at a concentration of 400 ppm
does not induce this response, while protein accumulation occurs at a concentration of 1,000 ppm,
suggesting that 400 ppm is below the threshold concentration required to induce this response (Green et al.,
1990). Increased severity of nephropathy in male rats can be a secondary effect of hyaline droplet
accumulation and protein overload of tubule cells. The occurrence of exacerbated nephropathy in the
present study, in which there was no confounding protein accumulation in the tubules, suggests that the
mechanism of kidney cytotoxicity may be a direct effect of t-butyl alcohol and not limited to increased
accumulation of protein. This would be further supported by the finding that slightly enhanced nephropathy
also occurred in female rats of the drinking water study of t-butyl alcohol; this effect was likewise not
complicated by protein overload of the tubule cells.
Chronic exposure to t-butyl alcohol in drinking water resulted in the occurrence of renal tubule neoplasms
in male rats (NTP, 1995). Because the doses used in the 2-year study included those which caused hyaline
droplet nephropathy in the 13-week drinking water study, the proposed mechanism of tumorigenesis under
these conditions was cytotoxicity due to protein accumulation, leading to a sustained increase in renal cell
proliferation and promotion of spontaneously initiated cells. However, a relationship between chemically
enhanced chronic nephropathy, such as was seen in the current inhalation study, and the eventual
development of renal tumors is less clear than that between hyaline droplet toxicity and renal
carcinogenesis. Therefore, a prediction of the potential carcinogenic effect of t-butyl alcohol by the
inhalation route based on comparison to the drinking water study is not warranted.
In the 13-week drinking water studies, the urinary bladder was also a target organ in rats and exhibited
transitional cell hyperplasia and inflammation of the bladder mucosa (NTP, 1995). As discussed above for
hyaline droplet nephropathy, it is likely that an exposure concentration sufficient to induce a similar bladder
effect in the present inhalation study was precluded by other adverse effects. The urinary bladder and
thyroid gland were found to be target organs in the 13-week and 2-year drinking water studies in mice.
However, there was no pathologic or other evidence of toxicity in mice in the inhalation studies. No
reproductive toxicity related to t-butyl alcohol inhalation exposure was evident in rats or mice.

49
REFERENCES
Aarstad, K., Zahlsen, K., and Nilsen, O.G. (1985). Inhalation of butanols: Changes in the cytochrome
P-450 enzyme system. Arch. Toxicol. (Suppl. 8), 418-421.
The Aldrich Library of NMR Spectra (1983). 2nd ed. (C.J. Pouchert, Ed.), Vol. 1, p. 117D. Aldrich
Chemical Company, Milwaukee, WI.
Anderson, R.A., Jr., Reddy, J.M., Joyce, C., Willis, B.R., Van der Ven, H., and Zaneveld, L.J.D.
(1982). Inhibition of mouse sperm capacitation by ethanol. Biol. Reprod. 27, 833-840.
Arslanian, M.J., Pascoe, E., and Reinhold, J.G. (1971). Rat liver alcohol dehydrogenase. Purification
and properties. Biochem. J. 125, 1039-1047.
Baker, R.C., Sorensen, S.M., and Deitrich, R.A. (1982). The in vivo metabolism of tertiary butanol by
adult rats. Alcohol. Clin. Exp. Res. 6, 247-251.
Beaugé, K.P., Clément, M., Nordmann, J., and Nordmann, R. (1981). Liver lipid disposal following
t-butanol administration to rats. Chem. Biol. Interact. 38, 45-51.
Bechtel, D.H., and Cornish, H.H. (1972). Effect of the butyl alcohols on liver microsomal enzymes.
Toxicol. Appl. Pharmacol. 22, 298-299. (Abstr.)
Bellin, S.I., and Edmonds, H.L., Jr. (1976). The use of tert-butanol in alcohol dependence studies.
Proc. West. Pharmacol. Soc. 19, 351-354.
Boorman, G.A., Montgomery, C.A., Jr., Eustis, S.L., Wolfe, M.J., McConnell, E.E., and Hardisty, J.F.
(1985). Quality assurance in pathology for rodent carcinogenicity studies. In Handbook of Carcinogen
Testing (H.A. Milman and E.K. Weisburger, Eds.), pp. 345-357. Noyes Publications, Park Ridge, NJ.

50 t-Butyl Alcohol, NTP TOX 53
Boorman, G.A., Hickman, R.L., Davis, G.W., Rhodes, L.S., White, N.W., Griffin, T.A., Mayo, J., and
Hamm, T.E., Jr. (1986). Serological titers to murine viruses in 90-day and 2-year studies. In
Complications of Viral and Mycoplasmal Infections in Rodents to Toxicology Research and Testing
(T.E. Hamm, Jr., Ed.), pp. 11-23. Hemisphere Publishing Corp., Washington, DC.
Caspary, W.J., Lee, Y.J., Poulton, S., Myhr, B.C., Mitchell, A.D., and Rudd, C.J. (1988). Evaluation
of the L5178Y mouse lymphoma cell mutagenesis assay: Quality-control guidelines and response
categories. Environ. Mol. Mutagen. 12 (Suppl. 13), 19-36.
Cederbaum, A.I., and Cohen, G. (1980). Oxidative demethylation of t-butyl alcohol by rat liver
microsomes. Biochem. Biophys. Res. Commun. 97, 730-736.
Cederbaum, A.I., Qureshi, A., and Cohen, G. (1983). Production of fomaldehyde and acetone by
hydroxyl-radical generating systems during the metabolism of tertiary butyl alcohol. Biochem. Pharmacol.
32, 3517-3524.
Chapin, R.E., Breese, G.R., and Mueller, R.A. (1980). Possible mechanisms of reduction of plasma
luteinizing hormone by ethanol. J. Pharmacol. Exp. Ther. 212, 6-10.
Chemical Economics Handbook (1993). Gasoline Octane Improvers. SRI International, Menlo Park, CA.
December 1993 online update.
Code of Federal Regulations (CFR) 21, Part 58. Good Laboratory Practice for Nonclinical Laboratory
Studies.
Code of Federal Regulations (CFR) 21, § 176.200.
Code of Federal Regulations (CFR) 21, § 178.3910.
Code of Federal Regulations (CFR) 29, § 1910.1000.

51 t-Butyl Alcohol, NTP TOX 53
Coleman, W.E., Lingg, R.D., Melton, R.G., and Kopfler, F.C. (1976). The occurrence of volatile
organics in five drinking water supplies using gas chromatography/mass spectrometry. In Identification
and Analysis of Organic Pollutants in Water (L.H. Keith, Ed.), pp. 305-327. Ann Arbor Science
Publishers, Ann Arbor, MI.
Cosmetic Ingredient Review (CIR) Expert Panel (1989). Final report on the safety assessment of t-butyl
alcohol. J. Am. Coll. Toxicol. 8, 627-641.
Daniel, M.A., and Evans, M.A. (1982). Quantitative comparison of maternal ethanol and maternal tertiary
butanol diet on postnatal development. J. Pharmacol. Exp. Ther. 222, 294-300.
Dixon, W.J., and Massey, F.J., Jr. (1951). Introduction to Statistical Analysis, 1st ed., pp. 145-147.
McGraw-Hill Book Company, New York.
Dowty, B.J., Carlisle, D.R., and Laseter, J.L. (1975). New Orleans drinking water sources tested by gas
chromatography-mass spectrometry. Occurrence and origin of aromatics and halogenated aliphatic
hydrocarbons. Environ. Sci. Technol. 9, 762-765.
Dunn, O.J. (1964). Multiple comparisons using rank sums. Technometrics 6, 241-252.
Dunnett, C.W. (1955). A multiple comparison procedure for comparing several treatments with a control.
J. Am. Stat. Assoc. 50, 1096-1121.
Edwards, E.K., Jr., and Edwards, E.K. (1982). Allergic reaction to tertiary butyl alcohol in a sunscreen.
Cutis 29, 476-478.
Faulkner, T.P., Wiechart, J.D., Hartman, D.M., and Hussain, A.S. (1989). The effects of prenatal
tertiary butanol administration in CBA/J and C57BL/6J mice. Life Sci. 45, 1989-1995.
Federal Register (1979). 44, 10,530.

52 t-Butyl Alcohol, NTP TOX 53
Galloway, S.M., Armstrong, M.J., Reuben, C., Colman, S., Brown, B., Cannon, C., Bloom, A.D.,
Nakamura, F., Ahmed, M., Duk, S., Rimpo, J., Margolin, B.H., Resnick, M.A., Anderson, B., and
Zeiger, E. (1987). Chromosome aberrations and sister chromatid exchanges in Chinese hamster ovary
cells: Evaluations of 108 chemicals. Environ. Mol. Mutagen. 10 (Suppl. 10), 1-175.
Grant, K.A., and Samson, H.H. (1981). Development of physical dependence on t-butonol in mice: An
examination using schedule-induced drinking. Pharmacol. Biochem. Behav. 14, 633-637.
Grant, K.A., and Samson, H.H. (1982). Ethanol and tertiary butanol induced microcephaly in the neonatal
rat: Comparison of brain growth parameters. Neurobehav. Toxicol. Teratol. 4, 315-321.
Green, T., Odum, J., Nash, J.A., and Foster, J.R. (1990). Perchloroethylene-induced rat kidney tumors:
An investigation of the mechanisms involved and their relevance to humans. Toxicol. Appl. Pharmacol.
103, 77-89.
Harris, R.N., and Anders, M.W. (1980). Effect of fasting, diethyl maleate, and alcohols on carbon
tetrachloride-induced hepatotoxicity. Toxicol. Appl. Pharmacol. 56, 191-198.
Hawley's Condensed Chemical Dictionary (1987). 11th ed. (N.I. Sax and R.J. Lewis, Jr., Eds.), p. 182.
Van Nostrand Reinhold, New York.
Jonckheere, A.R. (1954). A distribution-free k-sample test against ordered alternatives. Biometrika 41,
133-145.
Kamil, I.A., Smith, J.N., and Williams, R.T. (1953). The metabolism of aliphatic alcohols. The
glucuronic acid conjugation of acyclic aliphatic alcohols. J. Biochem. 53, 129-136.
LeBlanc, A.E., and Kalant, H. (1975). Ethanol-induced cross tolerance to several homologous alcohols in
the rat. Toxicol. Appl. Pharmacol. 32, 123-128.
Lindamood, C., III, Farnell, D.R., Giles, H.D., Prejean, J.D., Collins, J.J., Takahashi, K., and
Maronpot, R.R. (1992). Subchronic toxicity studies of t-butyl alcohol in rats and mice. Fundam. Appl.
Toxicol. 19, 91-100.

53 t-Butyl Alcohol, NTP TOX 53
McComb, J.A., and Goldstein, D.B. (1979). Quantitative comparison of physical dependence on tertiary
butanol and ethanol in mice: Correlation with lipid solubility. J. Pharmacol. Exp. Ther. 208, 113-117.
McGregor, D.B., Brown, A., Cattanach, P., Edwards, I., McBride, D., and Caspary, W.J. (1988).
Responses of the L5178Y tk+/tk- mouse lymphoma cell forward mutation assay. II: 18 coded chemicals.
Environ. Mol. Mutagen. 11, 91-118.
MacGregor, J.T., Wehr, C.M., and Langlois, R.G. (1983). A simple fluorescent staining procedure for
micronuclei and RNA in erythrocytes using Hoechst 33258 and pyronin Y. Mutat. Res. 120, 269-275.
MacGregor, J.T., Wehr, C.M., Henika, P.R., and Shelby, M.D. (1990). The in vivo erythrocyte
micronucleus test: Measurement at steady state increases assay efficiency and permits integration with
toxicity studies. Fundam. Appl. Toxicol. 14, 513-522.
Maickel, R.P., and McFadden, D.P. (1979). Acute toxicology of butyl nitrites and butyl alcohols. Res.
Commun. Chem. Pathol. Pharmacol. 26, 75-83.
Margolin, B.H., Risko, K.J., Frome, E.L., and Tice, R.R. (1990). A general purpose statistical analysis
program for micronucleus assay data. Appendix 2: Micronucleus data management and analysis version
1.4a. Integrated Laboratory Systems, Research Triangle Park, NC.
Maronpot, R.R., and Boorman, G.A. (1982). Interpretation of rodent hepatocellular proliferative
alterations and hepatocellular tumors in chemical safety assessment. Toxicol. Pathol. 10, 71-80.
Morrison, D.F. (1976). Multivariate Statistical Methods, 2nd ed., pp. 170-179. McGraw-Hill Book
Company, New York.
Munch, J.C. (1972). Aliphatic alcohols and alkyl esters: Narcotic and lethal potencies to tadpoles and to
rabbits. Ind. Med. 41, 31-33.

54 t-Butyl Alcohol, NTP TOX 53
National Institute for Occupational Safety and Health (NIOSH) (1970). Registry of Toxic Effects of
Chemical Substances, p. 202. Maintained on the National Library of Medicine’s Toxicology Data Network
(TOXNET), available through the Medlars System. U.S. Department of Health and Human Services,
Public Health Service, National Institutes of Health, Bethesda, MD.
National Institute for Occupational Safety and Health (NIOSH) (1990). National Occupational Exposure
Survey (1981-1983), unpublished provisional data as of July 1, 1990. NIOSH, Cincinnati, OH.
National Toxicology Program (NTP) (1984). Technical Protocol for Sperm Morphology and Vaginal
Cytology Evaluations in Toxicity Testing for Rats and Mice, 10/31/82 version (updated October 1984).
Research Triangle Park, NC.
National Toxicology Program (NTP) (1995). Toxicology and Carcinogenesis Studies of t-Butyl Alcohol
(CAS No. 75-65-0) in F344/N Rats and B6C3F1 Mice (Drinking Water Studies). Technical Report Series
No. 436. NIH Publication No. 95-3167. U.S. Department of Health and Human Services, Public Health
Service, National Institutes of Health, Research Triangle Park, NC.
Nelson, B.K., Brightwell, W.S., Khan., A., Burg, J.R., and Goad, P.T. (1989). Lack of selective
developmental toxicity of three butanol isomers administered by inhalation to rats. Fundam. Appl. Toxicol.
12, 469-479.
Nelson, B.K., Brightwell, W.S., Khan, A., Shaw, P.B., Krieg, E.F., Jr., and Massari, V.J. (1991).
Behavioral teratology investigation of tertiary-butanol administered by inhalation to rats.
Pharmacopsychoecologia 4, 1-7.
Patty's Industrial Hygiene and Toxicology (1982). 3rd ed. (G.D. Clayton and F.E. Clayton, Eds.),
Vol. 2C, pp. 4585-4588. John Wiley and Sons, New York.
Pellizzari, E.D., Hartwell, T.D., Harris, B.S.H., III, Waddell, R.D., Whitaker, D.A., and Erickson,
M.D. (1982). Purgeable organic compounds in mother's milk. Bull. Environ. Contam. Toxicol. 28,
322-328.
Rao, G.N., Haseman, J.K., and Edmondson, J. (1989a). Influence of viral infections on body weight,
survival, and tumor prevalence in Fischer 344/NCr rats on two-year studies. Lab. Anim. Sci. 39, 389-393.

55 t-Butyl Alcohol, NTP TOX 53
Rao, G.N., Piegorsch, W.W., Crawford, D.D., Edmondson, J., and Haseman, J.K. (1989b). Influence of
viral infections on body weight, survival, and tumor prevalence of B6C3F1 (C57BL/6N × C3H/HeN) mice
in carcinogenicity studies. Fundam. Appl. Toxicol. 13, 156-164.
Sadtler Standard Spectra. IR No. 2; NMR No. 10198M. Sadtler Research Laboratories, Philadelphia.
Schaffarzick, R.W., and Brown, B.J. (1952). The anticonvulsant activity and toxicity of methylparafynol
(Dormison®) and some other alcohols. Science 116, 663-665.
Sexton, K., Webber, L.M., and Hayward, S.B. (1986). Characterization of particle composition, organic
vapor constituents, and mutagenicity of indoor air pollutant emissions. Environ. Int. 12, 351-362.
Shirley, E. (1977). A non-parametric equivalent of Williams' test for contrasting increasing dose levels of
a treatment. Biometrics 33, 386-389.
Snell, D., and Harris, R.A. (1980). Impairment of avoidance behavior following short-term ingestion of
ethanol, tertiary-butanol, or pentobarbital in mice. Psychopharmacology 69, 53-57.
Thore, A., and Baltscheffsky, H. (1965). Inhibitory effects of lower aliphatic alcohols on electron transport
phosphorylation systems. 2. Secondary, tertiary, and di-alcohols. Acta Chem. Scand. 19, 1600-1606.
Thurman, R.G., and Pathman, D.E. (1975). Withdrawal symptoms from ethanol: Evidence against the
involvement of acetaldehyde. In The Role of Acetaldehyde in the Actions of Ethanol. (K.O. Lindros and
C.J.P. Eriksson, Eds.), Vol. 23, pp. 217-231. The Finnish Foundation for Alcohol Studies, Helsinki.
Thurman, R.G., Winn, K., and Urquhart, B. (1980). Rat brain cyclic AMP levels and withdrawal
behavior following treatment with t-butanol. Adv. Exp. Med. Biol. 126, 271-281.
Videla, L.A., Fernández, V., de Marinis, A., Fernández, N., and Valenzuela, A. (1982). Liver
lipoperoxidative pressure and glutathione status following acetaldehyde and aliphatic alcohols pretreatments
in the rat. Biochem. Biophys. Res. Commun. 104, 965-970.

56 t-Butyl Alcohol, NTP TOX 53
Williams, D.A. (1971). A test for differences between treatment means when several dose levels are
compared with a zero dose control. Biometrics 27, 103-117.
Williams, D.A. (1972). The comparison of several dose levels with a zero dose control. Biometrics 28,
519-531.
Williams, R.T. (1959). Detoxication Mechanisms. The Metabolism and Detoxication of Drugs, Toxic
Substances and Other Organic Compounds, 2nd ed., pp. 67-68. John Wiley and Sons, New York.
Wood, J.M., and Laverty, R. (1979). Physical dependence following prolonged ethanol or t-butanol
administration to rats. Pharmacol. Biochem. Behav. 10, 113-119.
Yojay, L., Yojay, R., and Mardones, J. (1982). Acetone blood levels after t-butanol administration in rats.
IRCS Med. Sci. 10, 215.
Zeiger, E., Anderson, B., Haworth, S., Lawlor, T., Mortelmans, K., and Speck, W. (1987). Salmonella
mutagenicity tests: III. Results from the testing of 255 chemicals. Environ. Mutagen. 9 (Suppl. 9), 1-110.

A-1
APPENDIX A ORGAN WEIGHTS
AND ORGAN-WEIGHT-TO-BODY-WEIGHT RATIOS
TABLE A1 Organ Weights and Organ-Weight-to-Body-Weight Ratios for F344/N Rats in the 18-Day Inhalation Study of t-Butyl Alcohol . . . . . . . . . . . . . . . . . . . . . . . . . . . . . . A-2
TABLE A2 Organ Weights and Organ-Weight-to-Body-Weight Ratios for F344/N Rats in the 13-Week Inhalation Study of t-Butyl Alcohol . . . . . . . . . . . . . . . . . . . . . . . . . . . . . A-4
TABLE A3 Organ Weights and Organ-Weight-to-Body-Weight Ratios for B6C3F1 Mice in the 18-Day Inhalation Study of t-Butyl Alcohol . . . . . . . . . . . . . . . . . . . . . . . . . . . . . . A-6
TABLE A4 Organ Weights and Organ-Weight-to-Body-Weight Ratios for B6C3F1 Mice in the 13-Week Inhalation Study of t-Butyl Alcohol . . . . . . . . . . . . . . . . . . . . . . . . . . . . . A-8

A-2 t-Butyl Alcohol, NTP TOX 53
TABLE A1 Organ Weights and Organ-Weight-to-Body-Weight Ratios for F344/N Rats in the 18-Day Inhalation Study of t-Butyl Alcohola
0 ppm 450 ppm 900 ppm 1,750 ppm 3,500 ppm
Male
n 5 5 5 5 5
Necropsy body wt 196 ± 5 196 ± 4 204 ± 6 197 ± 5 168 ± 3**
Brain Absolute 1.751 ± 0.012 1.724 ± 0.019 1.764 ± 0.023 1.699 ± 0.058 1.650 ± 0.025 Relative 8.97 ± 0.23 8.81 ± 0.21 8.68 ± 0.21 8.67 ± 0.35 9.84 ± 0.21
Heart Absolute 0.725 ± 0.020 0.777 ± 0.029 0.775 ± 0.024 0.768 ± 0.022 0.682 ± 0.041 Relative 3.72 ± 0.15 3.97 ± 0.13 3.82 ± 0.21 3.92 ± 0.12 4.06 ± 0.24
R. Kidney Absolute 0.819 ± 0.023 0.858 ± 0.023 0.911 ± 0.017* 0.884 ± 0.028 0.745 ± 0.026 Relative 4.19 ± 0.08 4.38 ± 0.12 4.48 ± 0.04 4.50 ± 0.06 4.43 ± 0.13
Liver Absolute 10.662 ± 0.262 11.240 ± 0.701 12.881 ± 0.539* 12.030 ± 0.383 9.619 ± 0.664 Relative 54.60 ± 1.37 57.29 ± 3.15 63.17 ± 1.27 61.23 ± 1.22 57.24 ± 3.69
Lung Absolute 1.144 ± 0.084 1.142 ± 0.054 1.329 ± 0.069 1.093 ± 0.056 1.095 ± 0.056 Relative 5.84 ± 0.34 5.83 ± 0.29 6.58 ± 0.52 5.60 ± 0.38 6.51 ± 0.29
R. Testis Absolute 1.144 ± 0.028 1.137 ± 0.013 1.163 ± 0.035 1.148 ± 0.034 1.115 ± 0.038 Relative 5.86 ± 0.21 5.80 ± 0.07 5.71 ± 0.11 5.84 ± 0.08 6.63 ± 0.11**
Thymus Absolute 0.482 ± 0.028 0.421 ± 0.031 0.466 ± 0.043 0.419 ± 0.026 0.312 ± 0.042** Relative 2.47 ± 0.16 2.15 ± 0.17 2.28 ± 0.18 2.14 ± 0.13 1.87 ± 0.26

A-3 Organ Weight Analysis
TABLE A1 Organ Weights and Organ-Weight-to-Body-Weight Ratios for F344/N Rats in the 18-Day Inhalation Study of t-Butyl Alcohol (continued)
0 ppm 450 ppm 900 ppm 1,750 ppm 3,500 ppm
Female
n 5 5 5 5 5
Necropsy body wt 143 ± 2 145 ± 2 146 ± 4 142 ± 2 125 ± 2**
Brain Absolute 1.680 ± 0.029 1.675 ± 0.021 1.662 ± 0.021 1.625 ± 0.011 1.568 ± 0.027** Relative 11.76 ± 0.19 11.53 ± 0.13 11.40 ± 0.29 11.50 ± 0.21 12.58 ± 0.10*
Heart Absolute 0.578 ± 0.028 0.587 ± 0.014 0.604 ± 0.021 0.539 ± 0.012 0.531 ± 0.043 Relative 4.04 ± 0.18 4.04 ± 0.13 4.14 ± 0.10 3.81 ± 0.12 4.24 ± 0.28
R. Kidney Absolute 0.592 ± 0.010 0.636 ± 0.012 0.632 ± 0.018 0.614 ± 0.017 0.573 ± 0.015 Relative 4.14 ± 0.05 4.38 ± 0.04 4.32 ± 0.07 4.35 ± 0.14 4.59 ± 0.05**
Liver Absolute 6.848 ± 0.342 6.752 ± 0.125 7.070 ± 0.302 6.472 ± 0.284 5.723 ± 0.329* Relative 47.88 ± 2.14 46.49 ± 0.50 48.33 ± 1.22 45.82 ± 2.29 45.80 ± 1.93
Lung Absolute 0.935 ± 0.046 0.905 ± 0.063 1.013 ± 0.037 0.947 ± 0.029 0.858 ± 0.032 Relative 6.53 ± 0.24 6.22 ± 0.37 6.93 ± 0.20 6.70 ± 0.20 6.88 ± 0.22
Thymus Absolute 0.376 ± 0.026 0.392 ± 0.013 0.391 ± 0.015 0.327 ± 0.012 0.256 ± 0.020** Relative 2.62 ± 0.17 2.70 ± 0.08 2.68 ± 0.07 2.31 ± 0.09 2.05 ± 0.16**
* Significantly different (P#0.05) from the control group by Williams' or Dunnett's test ** P#0.01 a Organ weights (absolute weights) and body weights are given in grams; organ-weight-to-body-weight ratios (relative weights) are given as mg
organ weight/g body weight (mean ± standard error). No organ weights or organ-weight-to-body-weight ratios were calculated for animals receiving 8,400 ppm due to 100% mortality in this group.

A-4 t-Butyl Alcohol, NTP TOX 53
TABLE A2 Organ Weights and Organ-Weight-to-Body-Weight Ratios for F344/N Rats in the 13-Week Inhalation Study of t-Butyl Alcohola
0 ppm 135 ppm 270 ppm 540 ppm 1,080 ppm 2,100 ppm
Male
n 10 9 10 10 10 10
Necropsy body wt 329 ± 8 327 ± 7 325 ± 8 332 ± 8 339 ± 5 331 ± 7
Brain Absolute 1.932 ± 0.018 1.901 ± 0.017 1.896 ± 0.016 1.904 ± 0.011 1.871 ± 0.016* 1.892 ± 0.018 Relative 5.90 ± 0.12 5.83 ± 0.10 5.86 ± 0.11 5.76 ± 0.12 5.53 ± 0.08 5.72 ± 0.09
R. Epididymis Absolute 0.442 ± 0.004 0.487 ± 0.011* 0.475 ± 0.012 0.443 ± 0.008 0.445 ± 0.011 0.458 ± 0.009 Relative 1.35 ± 0.03 1.49 ± 0.05* 1.46 ± 0.03 1.34 ± 0.03 1.32 ± 0.03 1.39 ± 0.04
Heart Absolute 0.972 ± 0.019 0.941 ± 0.022 0.953 ± 0.028 0.955 ± 0.027 0.967 ± 0.011 1.012 ± 0.030 Relative 2.96 ± 0.04 2.88 ± 0.04 2.93 ± 0.05 2.88 ± 0.06 2.86 ± 0.04 3.05 ± 0.07
R. Kidney Absolute 1.206 ± 0.026 1.213 ± 0.032 1.180 ± 0.025 1.248 ± 0.035 1.341 ± 0.017** 1.324 ± 0.028** Relative 3.68 ± 0.08 3.71 ± 0.04 3.64 ± 0.04 3.76 ± 0.06 3.96 ± 0.05** 4.00 ± 0.05**
Liver Absolute 13.273 ± 0.447 12.200 ± 0.324 13.005 ± 0.546 13.364 ± 0.615 14.571 ± 0.401 13.987 ± 0.329 Relative 40.37 ± 0.99 37.31 ± 0.45 39.93 ± 1.12 40.12 ± 1.05 43.11 ± 1.34 42.22 ± 0.66
Lung Absolute 1.743 ± 0.066 1.755 ± 0.029 1.743 ± 0.063 1.690 ± 0.057 1.851 ± 0.054 1.793 ± 0.064 Relative 5.31 ± 0.16 5.39 ± 0.12 5.37 ± 0.16 5.11 ± 0.19 5.47 ± 0.17 5.43 ± 0.21
R. Testis Absolute 1.465 ± 0.025 1.396 ± 0.017 1.363 ± 0.024* 1.446 ± 0.019 1.412 ± 0.030 1.464 ± 0.025 Relative 4.47 ± 0.09 4.28 ± 0.08 4.21 ± 0.07 4.37 ± 0.07 4.18 ± 0.11* 4.42 ± 0.04
Thymus Absolute 0.313 ± 0.024 0.317 ± 0.013 0.327 ± 0.011 0.335 ± 0.018b 0.320 ± 0.012 0.296 ± 0.012 Relative 0.95 ± 0.05 0.97 ± 0.05 1.01 ± 0.03 1.00 ± 0.04b 0.94 ± 0.02 0.89 ± 0.03

A-5 Organ Weight Analysis
TABLE A2 Organ Weights and Organ-Weight-to-Body-Weight Ratios for F344/N Rats in the 13-Week Inhalation Study of t-Butyl Alcohol (continued)
0 ppm 135 ppm 270 ppm 540 ppm 1,080 ppm 2,100 ppm
Female
n 10 10 10 10 10 10
Necropsy body wt 204 ± 3 196 ± 4 204 ± 4 206 ± 3 204 ± 4 195 ± 3
Brain Absolute 1.829 ± 0.018 1.786 ± 0.019 1.821 ± 0.016 1.831 ± 0.016 1.836 ± 0.021 1.768 ± 0.018 Relative 9.00 ± 0.10 9.11 ± 0.11 8.97 ± 0.18 8.90 ± 0.11 9.04 ± 0.19 9.06 ± 0.10
Heart Absolute 0.702 ± 0.017 0.678 ± 0.022 0.706 ± 0.011 0.734 ± 0.019 0.721 ± 0.011 0.698 ± 0.019 Relative 3.45 ± 0.06 3.45 ± 0.07 3.47 ± 0.05 3.57 ± 0.10 3.55 ± 0.06 3.57 ± 0.07
R. Kidney Absolute 0.817 ± 0.043 0.782 ± 0.020 0.821 ± 0.019 0.853 ± 0.014 0.831 ± 0.017 0.849 ± 0.012 Relative 4.00 ± 0.15 3.98 ± 0.06 4.03 ± 0.05 4.14 ± 0.04 4.09 ± 0.06 4.35 ± 0.03**
Liver Absolute 7.008 ± 0.139 6.977 ± 0.245 7.035 ± 0.158 7.210 ± 0.188 7.628 ± 0.253 7.295 ± 0.215 Relative 34.45 ± 0.49 35.49 ± 0.87 34.57 ± 0.65 35.03 ± 0.86 37.47 ± 1.04* 37.31 ± 0.73*
Lung Absolute 1.331 ± 0.045 1.315 ± 0.063 1.349 ± 0.051 1.397 ± 0.053 1.404 ± 0.023 1.358 ± 0.062 Relative 6.55 ± 0.22 6.69 ± 0.28 6.61 ± 0.18 6.79 ± 0.24 6.92 ± 0.16 6.95 ± 0.30
Thymus Absolute 0.272 ± 0.012 0.271 ± 0.010 0.269 ± 0.010 0.277 ± 0.012 0.253 ± 0.011 0.264 ± 0.007 Relative 1.34 ± 0.06 1.38 ± 0.04 1.32 ± 0.05 1.34 ± 0.05 1.24 ± 0.06 1.35 ± 0.03
* Significantly different (P#0.05) from the control group by Williams' or Dunnett's test ** P#0.01 a Organ weights (absolute weights) and body weights are given in grams; organ-weight-to-body-weight ratios (relative weights) are given as mg
organ weight/g body weight (mean ± standard error).b n=9

A-6 t-Butyl Alcohol, NTP TOX 53
TABLE A3 Organ Weights and Organ-Weight-to-Body-Weight Ratios for B6C3F1 Mice in the 18-Day Inhalation Study of t-Butyl Alcohola
0 ppm 450 ppm 900 ppm 1,750 ppm 3,500 ppm
Male
n 5 5 5 5 4
Necropsy body wt 25.8 ± 0.5 26.6 ± 0.7 25.7 ± 0.6 26.6 ± 1.1 26.1 ± 0.6
Brain Absolute 0.446 ± 0.004 0.450 ± 0.008 0.455 ± 0.007 0.449 ± 0.006 0.424 ± 0.004 Relative 17.27 ± 0.35 16.93 ± 0.32 17.70 ± 0.47 16.99 ± 0.72 16.27 ± 0.45
Heart Absolute 0.139 ± 0.005 0.140 ± 0.007 0.131 ± 0.004 0.134 ± 0.007 0.134 ± 0.005 Relative 5.38 ± 0.18 5.25 ± 0.14 5.07 ± 0.09 5.03 ± 0.19 5.14 ± 0.17
R. Kidney Absolute 0.256 ± 0.013 0.265 ± 0.011 0.244 ± 0.007 0.260 ± 0.007 0.233 ± 0.002 Relative 9.87 ± 0.33 9.98 ± 0.47 9.51 ± 0.33 9.82 ± 0.43 8.95 ± 0.19
Liver Absolute 1.600 ± 0.057 1.669 ± 0.074 1.568 ± 0.064 1.754 ± 0.105 1.852 ± 0.057 Relative 61.88 ± 1.59 62.62 ± 1.66 60.87 ± 1.48 65.69 ± 1.55 70.87 ± 1.17**
Lung Absolute 0.239 ± 0.017 0.202 ± 0.008 0.212 ± 0.008 0.203 ± 0.012 0.199 ± 0.011 Relative 9.25 ± 0.69 7.57 ± 0.24* 8.21 ± 0.20 7.65 ± 0.39* 7.63 ± 0.37
R. Testis Absolute 0.101 ± 0.003 0.101 ± 0.005 0.103 ± 0.003 0.098 ± 0.002 0.097 ± 0.002 Relative 3.91 ± 0.11 3.81 ± 0.25 3.99 ± 0.10 3.72 ± 0.18 3.73 ± 0.12
Thymus Absolute 0.057 ± 0.007 0.056 ± 0.002 0.058 ± 0.001 0.065 ± 0.007 0.041 ± 0.004 Relative 2.21 ± 0.29 2.09 ± 0.09 2.26 ± 0.03 2.42 ± 0.19 1.58 ± 0.19

A-7 Organ Weight Analysis
TABLE A3 Organ Weights and Organ-Weight-to-Body-Weight Ratios for B6C3F1 Mice in the 18-Day Inhalation Study of t-Butyl Alcohol (continued)
0 ppm 450 ppm 900 ppm 1,750 ppm 3,500 ppm
Female
n 5 5 5 5 5
Necropsy body wt 22.8 ± 0.4 21.9 ± 0.5 22.3 ± 0.3 22.6 ± 0.5 23.5 ± 0.5
Brain Absolute 0.448 ± 0.015 0.454 ± 0.007 0.445 ± 0.011 0.458 ± 0.010 0.455 ± 0.014 Relative 19.68 ± 0.56 20.74 ± 0.42 19.95 ± 0.55 20.23 ± 0.25 19.45 ± 0.94
Heart Absolute 0.117 ± 0.002 0.117 ± 0.005 0.118 ± 0.003 0.123 ± 0.004 0.118 ± 0.002 Relative 5.16 ± 0.06 5.33 ± 0.10 5.29 ± 0.15 5.44 ± 0.13 5.03 ± 0.07
R. Kidney Absolute 0.177 ± 0.009 0.170 ± 0.008 0.169 ± 0.004 0.174 ± 0.004 0.178 ± 0.008 Relative 7.77 ± 0.35 7.76 ± 0.22 7.57 ± 0.16 7.67 ± 0.15 7.57 ± 0.21
Liver Absolute 1.368 ± 0.053 1.265 ± 0.069 1.393 ± 0.055 1.466 ± 0.055 1.754 ± 0.073** Relative 60.06 ± 2.20 57.56 ± 1.87 62.33 ± 1.94 64.65 ± 1.26 74.56 ± 1.85**
Lung Absolute 0.180 ± 0.006 0.193 ± 0.011 0.191 ± 0.012 0.175 ± 0.010 0.182 ± 0.008 Relative 7.91 ± 0.38 8.78 ± 0.32 8.55 ± 0.46 7.71 ± 0.41 7.74 ± 0.32
Thymus Absolute 0.072 ± 0.004 0.069 ± 0.004 0.065 ± 0.001 0.075 ± 0.005 0.053 ± 0.004** Relative 3.17 ± 0.20 3.17 ± 0.18 2.92 ± 0.06 3.30 ± 0.21 2.26 ± 0.19**
* Significantly different (P#0.05) from the control group by Williams' or Dunnett's test ** P#0.01 a Organ weights (absolute weights) and body weights are given in grams; organ-weight-to-body-weight ratios (relative weights) are given as mg
organ weight/g body weight (mean ± standard error). No organ weights or organ-weight-to-body-weight ratios were calculated for animals receiving 8,400 ppm due to 100% mortality in this group.

A-8 t-Butyl Alcohol, NTP TOX 53
TABLE A4 Organ Weights and Organ-Weight-to-Body-Weight Ratios for B6C3F1 Mice in the 13-Week Inhalation Study of t-Butyl Alcohola
0 ppm 135 ppm 270 ppm 540 ppm 1,080 ppm 2,100 ppm
Male
n 10 10 10 10 5 9
Necropsy body wt 34.9 ± 1.2 34.4 ± 1.1 33.3 ± 0.6 35.3 ± 0.7 32.6 ± 0.6 34.1 ± 0.8
Brain Absolute 0.444 ± 0.004 0.458 ± 0.007 0.460 ± 0.005 0.457 ± 0.006 0.442 ± 0.009 0.464 ± 0.006 Relative 12.86 ± 0.41 13.45 ± 0.44 13.84 ± 0.24 13.02 ± 0.36 13.59 ± 0.28 13.68 ± 0.42
R. Epididymis Absolute 0.043 ± 0.002 0.054 ± 0.005* 0.053 ± 0.003* 0.044 ± 0.001 0.044 ± 0.001 0.048 ± 0.002 Relative 1.25 ± 0.06 1.58 ± 0.13* 1.60 ± 0.09** 1.25 ± 0.03 1.35 ± 0.04 1.40 ± 0.05
Heart Absolute 0.169 ± 0.005 0.196 ± 0.013 0.197 ± 0.011 0.184 ± 0.005 0.165 ± 0.006 0.177 ± 0.008 Relative 4.87 ± 0.11 5.72 ± 0.33 5.96 ± 0.40* 5.22 ± 0.15 5.08 ± 0.21 5.18 ± 0.19
R. Kidney Absolute 0.315 ± 0.010 0.295 ± 0.009 0.311 ± 0.007 0.329 ± 0.007 0.285 ± 0.007 0.326 ± 0.011 Relative 9.06 ± 0.15 8.66 ± 0.32 9.34 ± 0.19 9.34 ± 0.25 8.78 ± 0.32 9.59 ± 0.29
Liver Absolute 1.673 ± 0.054 1.654 ± 0.071 1.739 ± 0.034 1.784 ± 0.046 1.543 ± 0.036 1.757 ± 0.047 Relative 48.24 ± 1.54 48.08 ± 1.13 52.40 ± 1.49 50.69 ± 1.36 47.47 ± 1.46 51.52 ± 0.71
Lung Absolute 0.259 ± 0.009 0.328 ± 0.019** 0.322 ± 0.008* 0.301 ± 0.017 0.305 ± 0.021 0.265 ± 0.012 Relative 7.51 ± 0.33 9.62 ± 0.60** 9.70 ± 0.34** 8.56 ± 0.51 9.37 ± 0.70 7.77 ± 0.33
R. Testis Absolute 0.117 ± 0.004 0.119 ± 0.002 0.114 ± 0.001 0.118 ± 0.003 0.114 ± 0.004 0.126 ± 0.004 Relative 3.39 ± 0.10 3.49 ± 0.09 3.43 ± 0.06 3.34 ± 0.06 3.52 ± 0.15 3.69 ± 0.10
Thymus Absolute 0.051 ± 0.003 0.052 ± 0.004 0.047 ± 0.004 0.052 ± 0.002 0.047 ± 0.006 0.044 ± 0.004 Relative 1.44 ± 0.07 1.50 ± 0.08 1.41 ± 0.11 1.46 ± 0.06 1.45 ± 0.16 1.31 ± 0.16

A-9 Organ Weight Analysis
TABLE A4 Organ Weights and Organ-Weight-to-Body-Weight Ratios for B6C3F1 Mice in the 13-Week Inhalation Study of t-Butyl Alcohol (continued)
0 ppm 135 ppm 270 ppm 540 ppm 1,080 ppm 2,100 ppm
Female
n 10 10 10 10 10 10
Necropsy body wt 29.7 ± 0.6 31.1 ± 0.9 28.6 ± 0.8 30.8 ± 1.0 27.9 ± 0.5 26.8 ± 0.7*
Brain Absolute 0.469 ± 0.006 0.467 ± 0.005 0.465 ± 0.006 0.456 ± 0.004 0.458 ± 0.006 0.477 ± 0.005 Relative 15.83 ± 0.27 15.11 ± 0.48 16.37 ± 0.41 14.94 ± 0.46 16.53 ± 0.45 17.93 ± 0.61**
Heart Absolute 0.136 ± 0.005 0.140 ± 0.005 0.139 ± 0.003 0.139 ± 0.004 0.135 ± 0.003 0.136 ± 0.004 Relative 4.60 ± 0.15 4.51 ± 0.15 4.92 ± 0.20 4.53 ± 0.15 4.86 ± 0.14 5.09 ± 0.19
R. Kidney Absolute 0.202 ± 0.005 0.205 ± 0.005 0.213 ± 0.014 0.205 ± 0.004 0.203 ± 0.004 0.209 ± 0.002 Relative 6.82 ± 0.13 6.60 ± 0.19 7.46 ± 0.42 6.68 ± 0.15 7.32 ± 0.17 7.85 ± 0.22**
Liver Absolute 1.403 ± 0.039 1.421 ± 0.040 1.415 ± 0.036 1.469 ± 0.055 1.438 ± 0.028 1.522 ± 0.048 Relative 47.33 ± 1.31 45.67 ± 0.63 49.71 ± 1.14 47.75 ± 1.17 51.75 ± 1.35* 57.08 ± 2.15**
Lung Absolute 0.292 ± 0.013 0.272 ± 0.010 0.271 ± 0.014 0.281 ± 0.012 0.271 ± 0.008 0.279 ± 0.015 Relative 9.85 ± 0.41 8.77 ± 0.32 9.52 ± 0.42 9.16 ± 0.41 9.76 ± 0.30 10.54 ± 0.84
Thymus Absolute 0.063 ± 0.002 0.057 ± 0.003 0.058 ± 0.003 0.057 ± 0.003 0.055 ± 0.002 0.060 ± 0.004 Relative 2.13 ± 0.06 1.83 ± 0.08 2.04 ± 0.08 1.87 ± 0.10 1.97 ± 0.08 2.28 ± 0.19
* Significantly different (P#0.05) from the control group by Williams' or Dunnett's test ** P#0.01 a Organ weights (absolute weights) and body weights are given in grams; organ-weight-to-body-weight ratios (relative weights) are given as mg
organ weight/g body weight (mean ± standard error).

A-10 t-Butyl Alcohol, NTP TOX 53

B-1
APPENDIX B HEMATOLOGY, CLINICAL CHEMISTRY,
AND URINALYSIS RESULTS
TABLE B1
TABLE B2
TABLE B3
TABLE B4
Hematology Data for F344/N Rats in the 13-Week Inhalation Study of t-Butyl Alcohol . . . . . . . . . . . . . . . . . . . . . . . . . . . . . . . . . . . . . . . . . . . . . . . Clinical Chemistry Data for F344/N Rats in the 13-Week Inhalation Study of t-Butyl Alcohol . . . . . . . . . . . . . . . . . . . . . . . . . . . . . . . . . . . . . . . . . . . . . . . Urinalysis Data for F344/N Rats in the 13-Week Inhalation Study of t-Butyl Alcohol . . . . . . . . . . . . . . . . . . . . . . . . . . . . . . . . . . . . . . . . . . . . . . . Hematology Data for B6C3F1 Mice in the 13-Week Inhalation Study of t-Butyl Alcohol . . . . . . . . . . . . . . . . . . . . . . . . . . . . . . . . . . . . . . . . . . . . . . .
B-2
B-4
B-5
B-6

B-2 t-Butyl Alcohol, NTP TOX 53
TABLE B1 Hematology Data for F344/N Rats in the 13-Week Inhalation Study of t-Butyl Alcohola
0 ppm 135 ppm 270 ppm 540 ppm 1,080 ppm 2,100 ppm
Male
n 10 9 10 10 10 10
Hematocrit (%) Day 22 50.2 ± 0.5 50.5 ± 0.5 50.1 ± 0.4 49.7 ± 0.4 49.4 ± 0.4 49.7 ± 0.5 Week 13 51.7 ± 0.5 50.3 ± 0.4 50.2 ± 0.4* 50.8 ± 0.5 49.2 ± 0.6** 49.3 ± 0.5**
Hemoglobin (g/dL) Day 22 15.9 ± 0.1 15.9 ± 0.1 15.8 ± 0.1 15.8 ± 0.1 15.6 ± 0.1 16.0 ± 0.2 Week 13 15.9 ± 0.2 15.4 ± 0.1* 15.4 ± 0.1* 15.6 ± 0.1* 15.0 ± 0.2** 15.1 ± 0.2**
Erythrocytes (106/µL) Day 22 8.86 ± 0.09 8.89 ± 0.09 8.81 ± 0.07 8.68 ± 0.08 8.72 ± 0.08 8.73 ± 0.10 Week 13 9.62 ± 0.10 9.41 ± 0.07 9.39 ± 0.07 9.47 ± 0.11 9.19 ± 0.12** 9.14 ± 0.09**
Reticulocytes (106/µL) Day 22 0.22 ± 0.02 0.20 ± 0.02 0.23 ± 0.01 0.20 ± 0.02 0.18 ± 0.02 0.18 ± 0.01 Week 13 0.12 ± 0.01 0.12 ± 0.01 0.11 ± 0.01 0.12 ± 0.02 0.12 ± 0.01 0.12 ± 0.01
Nucleated erythrocytes (103/µL) Day 22 0.01 ± 0.01 0.00 ± 0.00 0.00 ± 0.00 0.00 ± 0.00 0.00 ± 0.00 0.00 ± 0.00 Week 13 0.03 ± 0.01 0.02 ± 0.01 0.03 ± 0.02 0.03 ± 0.02 0.03 ± 0.02 0.05 ± 0.02
Mean cell volume (fL) Day 22 56.8 ± 0.1 57.0 ± 0.2 56.7 ± 0.3 57.3 ± 0.3 56.8 ± 0.3 56.9 ± 0.2 Week 13 53.8 ± 0.3 53.4 ± 0.2 53.5 ± 0.2 53.4 ± 0.2 53.4 ± 0.2 54.0 ± 0.2
Mean cell hemoglobin (pg) Day 22 18.0 ± 0.1 17.9 ± 0.1 17.9 ± 0.1 18.2 ± 0.1 17.9 ± 0.1 18.3 ± 0.1 Week 13 16.5 ± 0.1 16.3 ± 0.1 16.4 ± 0.1 16.4 ± 0.1 16.3 ± 0.1 16.5 ± 0.1
Mean cell hemoglobin concentration (g/dL) Day 22 31.7 ± 0.1 31.4 ± 0.2 31.5 ± 0.2 31.8 ± 0.1 31.6 ± 0.2 32.1 ± 0.1 Week 13 30.7 ± 0.1 30.6 ± 0.2 30.6 ± 0.1 30.7 ± 0.1 30.5 ± 0.2 30.6 ± 0.2
Platelets (103/µL) Day 22 594.0 ± 20.8 606.9 ± 9.7 638.7 ± 12.3 635.9 ± 10.7 657.4 ± 12.0* 613.7 ± 16.9 Week 13 570.0 ± 20.3 543.8 ± 15.2 532.4 ± 8.0 554.8 ± 22.2 580.3 ± 13.3 594.6 ± 33.0
Leukocytes (103/µL) Day 22 7.71 ± 0.36 7.48 ± 0.58 7.64 ± 0.53 6.90 ± 0.61 7.57 ± 0.26 6.71 ± 0.41 Week 13 8.40 ± 0.39 7.87 ± 0.68 7.22 ± 0.28 7.78 ± 0.45 8.75 ± 0.25 8.01 ± 0.58
Segmented neutrophils (103/µL) Day 22 0.52 ± 0.04 0.57 ± 0.08 0.45 ± 0.05 0.69 ± 0.08 0.63 ± 0.07 0.66 ± 0.07 Week 13 1.55 ± 0.15 1.20 ± 0.15 1.09 ± 0.08 1.30 ± 0.17 1.44 ± 0.12 1.83 ± 0.40
Lymphocytes (103/µL) Day 22 7.14 ± 0.35 6.87 ± 0.52 7.16 ± 0.52 6.20 ± 0.54 6.92 ± 0.23 6.00 ± 0.39 Week 13 6.78 ± 0.39 6.50 ± 0.56 6.05 ± 0.23 6.41 ± 0.40 7.19 ± 0.21 6.07 ± 0.41
Monocytes (103/µL) Day 22 0.01 ± 0.01 0.00 ± 0.00 0.00 ± 0.00 0.01 ± 0.01 0.00 ± 0.00 0.00 ± 0.00 Week 13 0.02 ± 0.01 0.03 ± 0.01 0.04 ± 0.02 0.01 ± 0.01 0.01 ± 0.01 0.03 ± 0.01
Eosinophils (103/µL) Day 22 0.04 ± 0.02 0.04 ± 0.02 0.02 ± 0.01 0.00 ± 0.00 0.02 ± 0.01 0.05 ± 0.02 Week 13 0.05 ± 0.03 0.13 ± 0.02* 0.04 ± 0.02 0.06 ± 0.02 0.10 ± 0.03 0.08 ± 0.03

B-3 Hematology, Clinical Chemistry, and Urinalysis Results
TABLE B1 Hematology Data for F344/N Rats in the 13-Week Inhalation Study of t-Butyl Alcohol (continued)
0 ppm 135 ppm 270 ppm 540 ppm 1,080 ppm 2,100 ppm
Female
n Day 22 10 10 10 10 10 10 Week 13 10 10 10 10 9 10
Hematocrit (%) Day 22 51.0 ± 0.5 50.2 ± 0.4 50.8 ± 0.4 50.0 ± 0.6 50.3 ± 0.4 49.9 ± 0.4 Week 13 50.3 ± 0.5 50.9 ± 0.5 50.3 ± 0.4 50.3 ± 0.3 50.7 ± 0.6 50.2 ± 0.4
Hemoglobin (g/dL) Day 22 16.0 ± 0.1 15.9 ± 0.1 16.0 ± 0.1 15.9 ± 0.2 16.0 ± 0.1 16.0 ± 0.2 Week 13 15.4 ± 0.2 15.5 ± 0.2 15.6 ± 0.2 15.5 ± 0.0 15.6 ± 0.2 15.4 ± 0.2
Erythrocytes (106/µL) Day 22 8.76 ± 0.09 8.74 ± 0.09 8.74 ± 0.09 8.65 ± 0.13 8.71 ± 0.09 8.70 ± 0.09 Week 13 8.71 ± 0.07 8.88 ± 0.10 8.79 ± 0.08 8.76 ± 0.05 8.85 ± 0.10 8.75 ± 0.07
Reticulocytes (106/µL) Day 22 0.16 ± 0.01 0.12 ± 0.01 0.10 ± 0.01* 0.11 ± 0.01 0.12 ± 0.01 0.12 ± 0.01 Week 13 0.13 ± 0.01 0.11 ± 0.01 0.10 ± 0.01 0.12 ± 0.01 0.11 ± 0.01 0.12 ± 0.02
Nucleated erythrocytes (103/µL) Day 22 0.00 ± 0.00 0.00 ± 0.00 0.00 ± 0.00 0.00 ± 0.00 0.00 ± 0.00 0.00 ± 0.00 Week 13 0.02 ± 0.01 0.06 ± 0.02 0.04 ± 0.02 0.07 ± 0.02 0.04 ± 0.01 0.05 ± 0.02
Mean cell volume (fL) Day 22 58.3 ± 0.3 57.5 ± 0.2 58.1 ± 0.3 57.7 ± 0.3 57.6 ± 0.3 57.2 ± 0.4 Week 13 57.7 ± 0.2 57.3 ± 0.3 57.3 ± 0.2 57.4 ± 0.2 57.4 ± 0.2 57.5 ± 0.3
Mean cell hemoglobin (pg) Day 22 18.2 ± 0.2 18.2 ± 0.1 18.4 ± 0.1 18.4 ± 0.1 18.3 ± 0.1 18.4 ± 0.1 Week 13 17.7 ± 0.1 17.5 ± 0.1 17.7 ± 0.1 17.6 ± 0.1 17.6 ± 0.1 17.6 ± 0.1
Mean cell hemoglobin concentration (g/dL) Day 22 31.3 ± 0.2 31.7 ± 0.2 31.5 ± 0.1 31.7 ± 0.1 31.7 ± 0.1* 32.1 ± 0.1** Week 13 30.7 ± 0.2 30.5 ± 0.1 30.9 ± 0.1 30.7 ± 0.2 30.7 ± 0.1 30.6 ± 0.2
Platelets (103/µL) Day 22 605.4 ± 14.7 589.4 ± 16.2 597.3 ± 9.9 607.1 ± 14.3 584.9 ± 28.3 577.3 ± 27.1 Week 13 579.8 ± 17.0 532.7 ± 31.3 541.3 ± 11.8 535.5 ± 20.4 575.8 ± 19.1 583.3 ± 16.6
Leukocytes (103/µL) Day 22 6.75 ± 0.36 6.32 ± 0.34 6.61 ± 0.53 6.53 ± 0.64 5.89 ± 0.42 6.06 ± 0.38 Week 13 6.66 ± 0.39 6.35 ± 0.51 7.41 ± 0.50 6.99 ± 0.55 6.69 ± 0.28 5.37 ± 0.45
Segmented neutrophils (103/µL) Day 22 0.73 ± 0.11 0.72 ± 0.09 0.67 ± 0.07 0.55 ± 0.08 0.67 ± 0.11 0.73 ± 0.07 Week 13 0.95 ± 0.08 0.99 ± 0.11 1.31 ± 0.14 1.21 ± 0.10 1.39 ± 0.25 1.16 ± 0.15
Lymphocytes (103/µL) Day 22 5.96 ± 0.29 5.55 ± 0.32 5.87 ± 0.53 5.91 ± 0.62 5.17 ± 0.34 5.29 ± 0.35 Week 13 5.57 ± 0.32 5.31 ± 0.42 6.02 ± 0.42 5.69 ± 0.48 5.12 ± 0.18 4.15 ± 0.37
Monocytes (103/µL) Day 22 0.01 ± 0.01 0.00 ± 0.00 0.00 ± 0.00 0.00 ± 0.00 0.01 ± 0.01 0.01 ± 0.01 Week 13 0.04 ± 0.02 0.01 ± 0.01 0.00 ± 0.00* 0.01 ± 0.01 0.04 ± 0.02 0.00 ± 0.00
Eosinophils (103/µL) Day 22 0.05 ± 0.02 0.05 ± 0.02 0.08 ± 0.02 0.08 ± 0.01 0.05 ± 0.01 0.03 ± 0.01 Week 13 0.09 ± 0.02 0.04 ± 0.01 0.08 ± 0.02 0.08 ± 0.02 0.14 ± 0.04 0.06 ± 0.02
* Significantly different (P#0.05) from the control group by Dunn's or Shirley's test ** P#0.01 a Mean ± standard error. Statistical tests were performed on unrounded data.
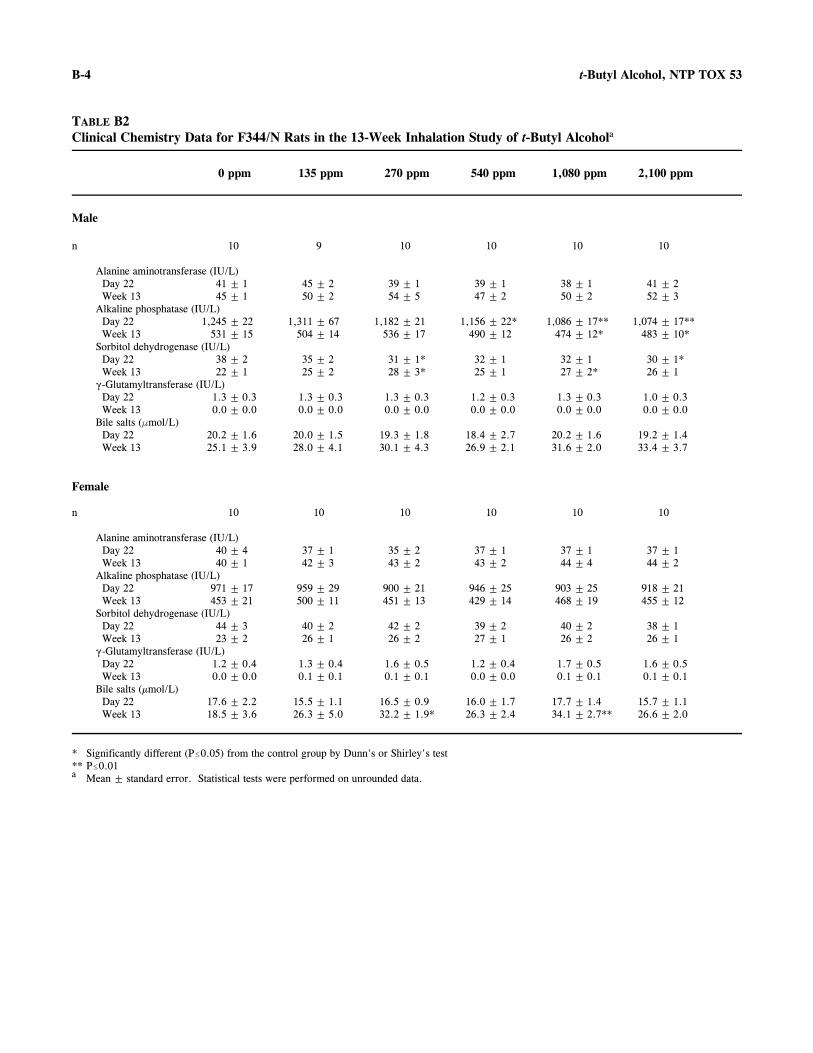
B-4 t-Butyl Alcohol, NTP TOX 53
TABLE B2 Clinical Chemistry Data for F344/N Rats in the 13-Week Inhalation Study of t-Butyl Alcohola
0 ppm 135 ppm 270 ppm 540 ppm 1,080 ppm 2,100 ppm
Male
n 10 9 10 10 10 10
Alanine aminotransferase (IU/L) Day 22 41 ± 1 45 ± 2 39 ± 1 39 ± 1 38 ± 1 41 ± 2 Week 13 45 ± 1 50 ± 2 54 ± 5 47 ± 2 50 ± 2 52 ± 3
Alkaline phosphatase (IU/L) Day 22 1,245 ± 22 1,311 ± 67 1,182 ± 21 1,156 ± 22* 1,086 ± 17** 1,074 ± 17** Week 13 531 ± 15 504 ± 14 536 ± 17 490 ± 12 474 ± 12* 483 ± 10*
Sorbitol dehydrogenase (IU/L) Day 22 38 ± 2 35 ± 2 31 ± 1* 32 ± 1 32 ± 1 30 ± 1* Week 13 22 ± 1 25 ± 2 28 ± 3* 25 ± 1 27 ± 2* 26 ± 1
(-Glutamyltransferase (IU/L) Day 22 1.3 ± 0.3 1.3 ± 0.3 1.3 ± 0.3 1.2 ± 0.3 1.3 ± 0.3 1.0 ± 0.3 Week 13 0.0 ± 0.0 0.0 ± 0.0 0.0 ± 0.0 0.0 ± 0.0 0.0 ± 0.0 0.0 ± 0.0
Bile salts (Fmol/L) Day 22 20.2 ± 1.6 20.0 ± 1.5 19.3 ± 1.8 18.4 ± 2.7 20.2 ± 1.6 19.2 ± 1.4 Week 13 25.1 ± 3.9 28.0 ± 4.1 30.1 ± 4.3 26.9 ± 2.1 31.6 ± 2.0 33.4 ± 3.7
Female
n 10 10 10 10 10 10
Alanine aminotransferase (IU/L) Day 22 40 ± 4 37 ± 1 35 ± 2 37 ± 1 37 ± 1 37 ± 1 Week 13 40 ± 1 42 ± 3 43 ± 2 43 ± 2 44 ± 4 44 ± 2
Alkaline phosphatase (IU/L) Day 22 971 ± 17 959 ± 29 900 ± 21 946 ± 25 903 ± 25 918 ± 21 Week 13 453 ± 21 500 ± 11 451 ± 13 429 ± 14 468 ± 19 455 ± 12
Sorbitol dehydrogenase (IU/L) Day 22 44 ± 3 40 ± 2 42 ± 2 39 ± 2 40 ± 2 38 ± 1 Week 13 23 ± 2 26 ± 1 26 ± 2 27 ± 1 26 ± 2 26 ± 1
(-Glutamyltransferase (IU/L) Day 22 1.2 ± 0.4 1.3 ± 0.4 1.6 ± 0.5 1.2 ± 0.4 1.7 ± 0.5 1.6 ± 0.5 Week 13 0.0 ± 0.0 0.1 ± 0.1 0.1 ± 0.1 0.0 ± 0.0 0.1 ± 0.1 0.1 ± 0.1
Bile salts (µmol/L) Day 22 17.6 ± 2.2 15.5 ± 1.1 16.5 ± 0.9 16.0 ± 1.7 17.7 ± 1.4 15.7 ± 1.1 Week 13 18.5 ± 3.6 26.3 ± 5.0 32.2 ± 1.9* 26.3 ± 2.4 34.1 ± 2.7** 26.6 ± 2.0
* Significantly different (P#0.05) from the control group by Dunn's or Shirley's test ** P#0.01 a Mean ± standard error. Statistical tests were performed on unrounded data.

B-5 Hematology, Clinical Chemistry, and Urinalysis Results
TABLE B3 Urinalysis Data for F344/N Rats in the 13-Week Inhalation Study of t-Butyl Alcohola
0 ppm 135 ppm 270 ppm 540 ppm 1,080 ppm 2,100 ppm
n 10 10 10 10 10 10
Male
Volume (mL/12 hours) Day 21 Week 13
16.6 ± 1.5 7.2 ± 1.1
17.9 ± 2.0 6.7 ± 0.9b
17.0 ± 2.3 6.9 ± 1.3
16.2 ± 2.5 6.8 ± 1.0
17.0 ± 2.1 8.4 ± 1.6
22.0 ± 1.98.1 ± 1.0
Specific gravity Day 21 Week 13
1.009 ± 0.001 1.024 ± 0.003
1.009 ± 0.001 1.021 ± 0.002b
1.011 ± 0.002 1.023 ± 0.004
1.011 ± 0.002 1.021 ± 0.002
1.013 ± 0.003 1.022 ± 0.003
1.009 ± 0.001 1.022 ± 0.001
pH Day 21 Week 13
6.77 ± 0.04 6.55 ± 0.03
6.69 ± 0.06 6.51 ± 0.04b
6.68 ± 0.03 6.56 ± 0.04
6.55 ± 0.03** 6.56 ± 0.06
6.50 ± 0.03** 6.48 ± 0.03
6.42 ± 0.03** 6.34 ± 0.03**
Female
Volume (mL/12 hours) Day 21 13.5 ± 1.6 13.6 ± 1.7 9.5 ± 0.9 13.9 ± 2.9b 17.3 ± 1.5 16.7 ± 1.5 Week 13 5.2 ± 1.3 6.5 ± 1.8 4.9 ± 0.8 6.6 ± 2.5 5.5 ± 1.1 7.3 ± 2.3
Specific gravity Day 21 1.007 ± 0.001 1.009 ± 0.001 1.010 ± 0.001 1.009 ± 0.001b 1.007 ± 0.001 1.008 ± 0.001 Week 13 1.019 ± 0.003 1.018 ± 0.003 1.019 ± 0.002 1.022 ± 0.003 1.020 ± 0.003 1.019 ± 0.003
pH Day 21 6.74 ± 0.05 6.73 ± 0.04 6.64 ± 0.05 6.60 ± 0.06b 6.52 ± 0.04** 6.46 ± 0.03** Week 13 6.55 ± 0.04 6.60 ± 0.04 6.42 ± 0.05 6.40 ± 0.05 6.28 ± 0.05** 6.29 ± 0.10**
** Significantly different (P#0.01) from the control group by Dunn's or Shirley's test a Mean ± standard error. Statistical tests were performed on unrounded data.b n=9
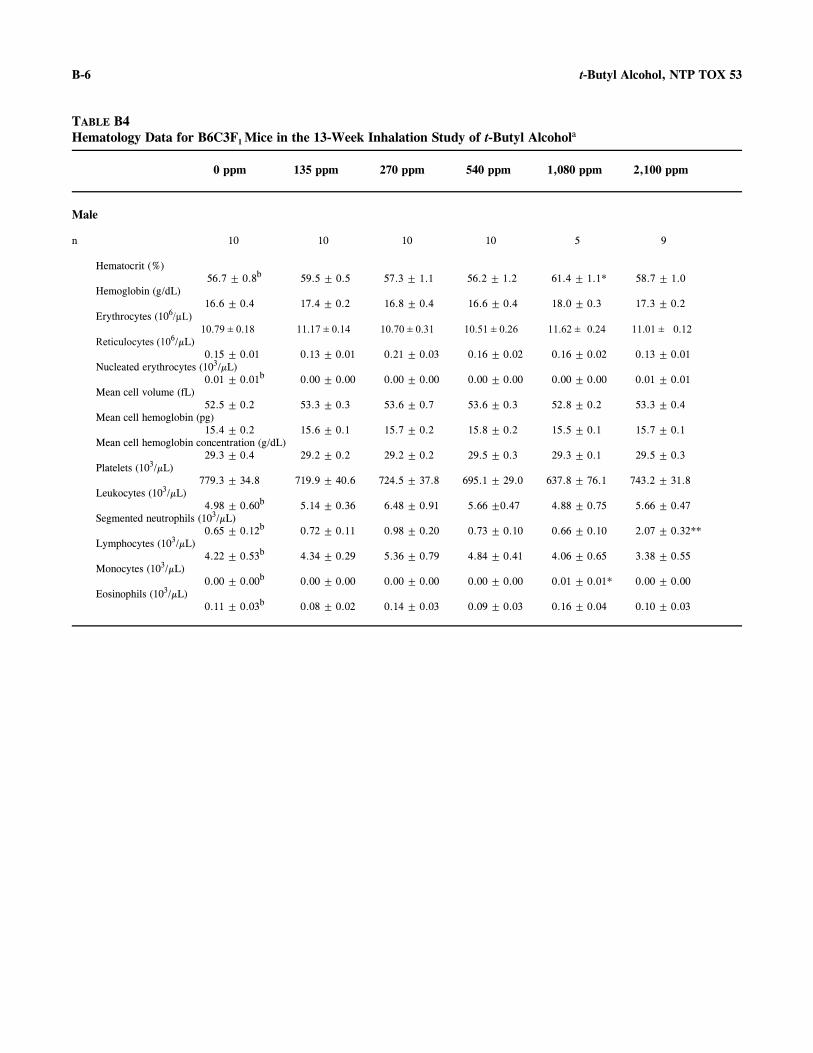
B-6 t-Butyl Alcohol, NTP TOX 53
TABLE B4 Hematology Data for B6C3F1 Mice in the 13-Week Inhalation Study of t-Butyl Alcohola
0 ppm 135 ppm 270 ppm 540 ppm 1,080 ppm 2,100 ppm
Male
n 10 10 10 10 5 9
Hematocrit (%) 56.7 ± 0.8b 59.5 ± 0.5 57.3 ± 1.1 56.2 ± 1.2 61.4 ± 1.1* 58.7 ± 1.0
Hemoglobin (g/dL) 16.6 ± 0.4 17.4 ± 0.2 16.8 ± 0.4 16.6 ± 0.4 18.0 ± 0.3 17.3 ± 0.2
Erythrocytes (106/±L) 10.79 Ø 0.18 11.17 Ø 0.14 10.70 Ø 0.31 10.51 Ø 0.26 11.62 Ø 0.24 11.01 Ø 0.12
Reticulocytes (106/µL) 0.15 ± 0.01 0.13 ± 0.01 0.21 ± 0.03 0.16 ± 0.02 0.16 ± 0.02 0.13 ± 0.01
Nucleated erythrocytes (103/µL) 0.01 ± 0.01b 0.00 ± 0.00 0.00 ± 0.00 0.00 ± 0.00 0.00 ± 0.00 0.01 ± 0.01
Mean cell volume (fL) 52.5 ± 0.2 53.3 ± 0.3 53.6 ± 0.7 53.6 ± 0.3 52.8 ± 0.2 53.3 ± 0.4
Mean cell hemoglobin (pg) 15.4 ± 0.2 15.6 ± 0.1 15.7 ± 0.2 15.8 ± 0.2 15.5 ± 0.1 15.7 ± 0.1
Mean cell hemoglobin concentration (g/dL) 29.3 ± 0.4 29.2 ± 0.2 29.2 ± 0.2 29.5 ± 0.3 29.3 ± 0.1 29.5 ± 0.3
Platelets (103/µL) 779.3 ± 34.8 719.9 ± 40.6 724.5 ± 37.8 695.1 ± 29.0 637.8 ± 76.1 743.2 ± 31.8
Leukocytes (103/µL) 4.98 ± 0.60b 5.14 ± 0.36 6.48 ± 0.91 5.66 ±0.47 4.88 ± 0.75 5.66 ± 0.47
Segmented neutrophils (103/µL) 0.65 ± 0.12b 0.72 ± 0.11 0.98 ± 0.20 0.73 ± 0.10 0.66 ± 0.10 2.07 ± 0.32**
Lymphocytes (103/µL) 4.22 ± 0.53b 4.34 ± 0.29 5.36 ± 0.79 4.84 ± 0.41 4.06 ± 0.65 3.38 ± 0.55
Monocytes (103/µL) 0.00 ± 0.00b 0.00 ± 0.00 0.00 ± 0.00 0.00 ± 0.00 0.01 ± 0.01* 0.00 ± 0.00
Eosinophils (103/µL) 0.11 ± 0.03b 0.08 ± 0.02 0.14 ± 0.03 0.09 ± 0.03 0.16 ± 0.04 0.10 ± 0.03

B-7
c
Hematology, Clinical Chemistry, and Urinalysis Results
TABLE B4 Hematology Data for B6C3F1 Mice in the 13-Week Inhalation Study of t-Butyl Alcohol (continued)
0 ppm 135 ppm 270 ppm 540 ppm 1,080 ppm 2,100 ppm
Female
n 10 10 10 9 10 10
Hematocrit (%) 57.6 ± 0.8 59.2 ± 0.4 58.1 ± 0.7 58.4 ± 0.6 59.4 ± 0.3 59.9 ± 0.8
Hemoglobin (g/dL) 16.7 ± 0.3 17.2 ± 0.2 16.8 ± 0.2 17.1 ± 0.2 17.3 ± 0.2 17.5 ± 0.2
Erythrocytes (106/µL) 10.79 ± 0.17 11.04 ± 0.10 10.91 ± 0.14 10.98 ± 0.10 11.11 ± 0.08 11.12 ± 0.10
Reticulocytes (106/µL) 0.16 ± 0.02 0.13 ± 0.02 0.16 ± 0.01 0.14 ± 0.01 0.12 ± 0.01 0.14 ± 0.01
Nucleated erythrocytes (103/µL) 0.00 ± 0.00 0.01 ± 0.01 0.00 ± 0.00 0.00 ± 0.00 0.00 ± 0.00 0.00 ± 0.00
Mean cell volume (fL) 53.5 ± 0.2 53.7 ± 0.4 53.2 ± 0.4 53.1 ± 0.3 53.7 ± 0.3 53.9 ± 0.4
Mean cell hemoglobin (pg) 15.5 ± 0.1 15.6 ± 0.1 15.4 ± 0.1 15.5 ± 0.1 15.5 ± 0.1 15.7 ± 0.1
Mean cell hemoglobin concentration (g/dL) 29.1 ± 0.2 29.0 ± 0.3 28.9 ± 0.2 29.2 ± 0.2 29.1 ± 0.3 29.2 ± 0.2
Platelets (103/µL) 640.5 ± 26.5 606.9 ± 30.6 634.4 ± 28.6 615.7 ± 47.1 596.4 ± 19.3 586.0 ± 33.4
Leukocytes (103/µL) 3.55 ± 0.49 4.52 ± 0.32 4.10 ± 0.26 4.00 ± 0.32 4.01 ± 0.21 4.68 ± 0.28
Segmented neutrophils (103/µL) 0.47 ± 0.10 0.54 ± 0.08 0.43 ± 0.07 0.47 ± 0.05 0.46 ± 0.05 0.66 ± 0.05
Lymphocytes (103/µL) 3.06 ± 0.40 3.91 ± 0.27 3.62 ± 0.27 3.43 ± 0.29 3.46 ± 0.18 3.94 ± 0.26
Monocytes (103/µL) 0.00 ± 0.00 0.00 ± 0.00 0.00 ± 0.00 0.00 ± 0.00c 0.00 ± 0.00 0.00 ± 0.00
Eosinophils (103/µL) 0.03 ± 0.01 0.08 ± 0.03 0.05 ± 0.02 0.10 ± 0.02 0.09 ± 0.03 0.08 ± 0.03
* Significantly different (P#0.05) from the control group by Dunn's or Shirley's test ** P#0.01 a Mean ± standard error. Statistical tests were performed on unrounded data.b n=9
n=10

B-8 t-Butyl Alcohol, NTP TOX 53

C-1
APPENDIX C REPRODUCTIVE TISSUE EVALUATIONS
AND ESTROUS CYCLE CHARACTERIZATION
TABLE C1
TABLE C2
Summary of Reproductive Tissue Evaluations and Estrous Cycle Characterization for F344/N Rats in the 13-Week Inhalation Study of t-Butyl Alcohol . . . . . . . . . . . . . . . . Summary of Reproductive Tissue Evaluations and Estrous Cycle Characterization for B6C3F1 Mice in the 13-Week Inhalation Study of t-Butyl Alcohol . . . . . . . . . . . . . . . .
C-2
C-3

C-2 t-Butyl Alcohol, NTP TOX 53
TABLE C1 Summary of Reproductive Tissue Evaluations and Estrous Cycle Characterization for F344/N Rats in the 13-Week Inhalation Study of t-Butyl Alcohola
0 ppm 540 ppm 1,080 ppm 2,100 ppm
Male
n 10 10 10 10
Weights (g) Necropsy body weight 329 ± 8 332 ± 8 339 ± 5 331 ± 7 Right cauda epididymis 0.163 ± 0.004 0.167 ± 0.004 0.171 ± 0.006 0.171 ± 0.004 Right epididymis 0.442 ± 0.004 0.443 ± 0.008 0.445 ± 0.011 0.458 ± 0.009 Right testis 1.47 ± 0.03 1.45 ± 0.02 1.41 ± 0.03 1.46 ± 0.03
Epididymal spermatozoal measurements Motility (%) 66.38 ± 1.53 65.70 ± 1.69 66.01 ± 2.16 67.76 ± 2.80 Abnormality (%) 1.020 ± 0.128 1.140 ± 0.280 0.940 ± 0.146 1.160 ± 0.129 Concentration (106/g cauda epididymal tissue) 534 ± 29 479 ± 34 530 ± 22 540 ± 34
Female
n 10 10 10 10
Necropsy body weight (g) 204 ± 3 206 ± 3 204 ± 4 195 ± 3 Estrous cycle length (days) 4.80 ± 0.13 4.60 ± 0.16 4.90 ± 0.18 5.00 ± 0.15 Estrous stages (% of cycle)
Diestrus 40.0 38.6 42.9 38.6 Proestrus 20.0 14.3 14.3 20.0 Estrus 22.9 24.3 22.9 21.4 Metestrus 15.7 20.0 17.1 20.0 Uncertain diagnoses 1.4 2.9 2.9 0.0
a All data except the estrous stages are presented as mean ± standard error; differences from the control group are not significant by Dunnett's test (body weights only) or Dunn's test. By multivariate analysis of variance, exposed groups do not differ significantly from the controls in the
relative length of time spent in the estrous stages.
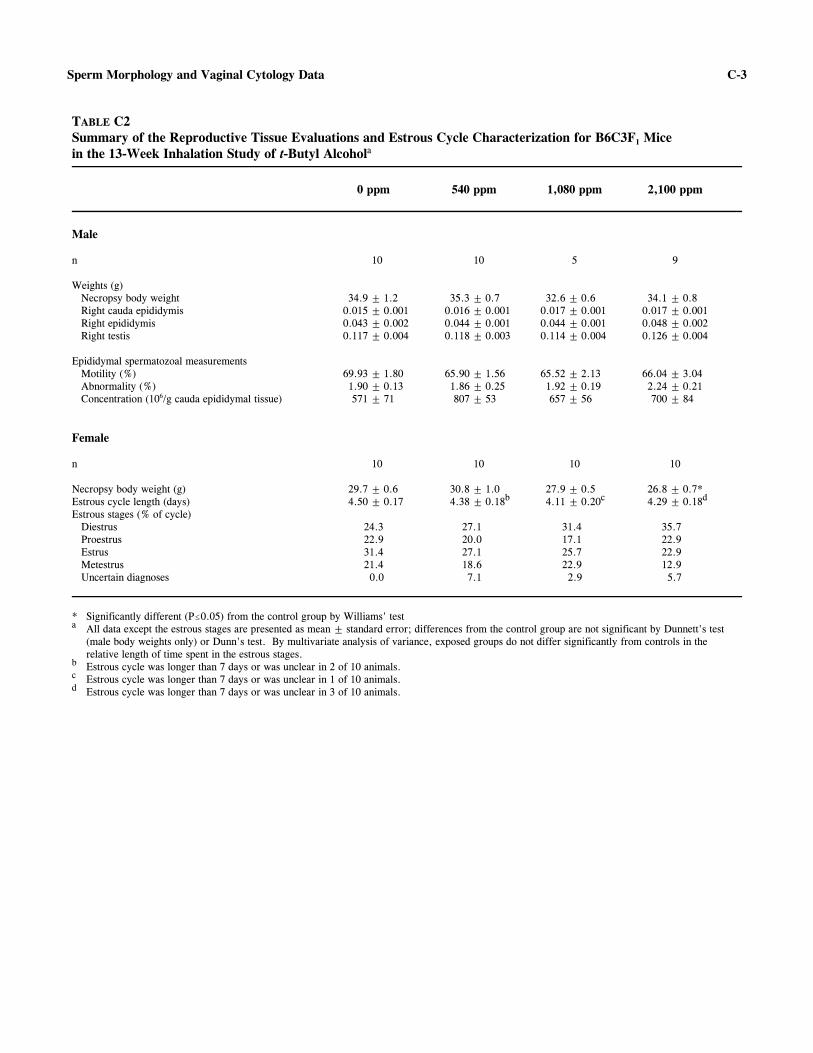
C-3
c
Sperm Morphology and Vaginal Cytology Data
TABLE C2 Summary of the Reproductive Tissue Evaluations and Estrous Cycle Characterization for B6C3F1 Mice in the 13-Week Inhalation Study of t-Butyl Alcohola
0 ppm 540 ppm 1,080 ppm 2,100 ppm
Male
n 10 10 5 9
Weights (g) Necropsy body weight 34.9 ± 1.2 35.3 ± 0.7 32.6 ± 0.6 34.1 ± 0.8 Right cauda epididymis 0.015 ± 0.001 0.016 ± 0.001 0.017 ± 0.001 0.017 ± 0.001 Right epididymis 0.043 ± 0.002 0.044 ± 0.001 0.044 ± 0.001 0.048 ± 0.002 Right testis 0.117 ± 0.004 0.118 ± 0.003 0.114 ± 0.004 0.126 ± 0.004
Epididymal spermatozoal measurements Motility (%) 69.93 ± 1.80 65.90 ± 1.56 65.52 ± 2.13 66.04 ± 3.04 Abnormality (%) 1.90 ± 0.13 1.86 ± 0.25 1.92 ± 0.19 2.24 ± 0.21 Concentration (106/g cauda epididymal tissue) 571 ± 71 807 ± 53 657 ± 56 700 ± 84
Female
n 10 10 10 10
Necropsy body weight (g) 29.7 ± 0.6 30.8 ± 1.0 27.9 ± 0.5 26.8 ± 0.7* Estrous cycle length (days) 4.50 ± 0.17 4.38 ± 0.18b 4.11 ± 0.20c 4.29 ± 0.18d
Estrous stages (% of cycle) Diestrus 24.3 27.1 31.4 35.7 Proestrus 22.9 20.0 17.1 22.9 Estrus 31.4 27.1 25.7 22.9 Metestrus 21.4 18.6 22.9 12.9 Uncertain diagnoses 0.0 7.1 2.9 5.7
* Significantly different (P#0.05) from the control group by Williams' test a All data except the estrous stages are presented as mean ± standard error; differences from the control group are not significant by Dunnett's test
(male body weights only) or Dunn's test. By multivariate analysis of variance, exposed groups do not differ significantly from controls in the relative length of time spent in the estrous stages.
b Estrous cycle was longer than 7 days or was unclear in 2 of 10 animals. Estrous cycle was longer than 7 days or was unclear in 1 of 10 animals.
d Estrous cycle was longer than 7 days or was unclear in 3 of 10 animals.

C-4 t-Butyl Alcohol, NTP TOX 53
D-1
APPENDIX D GENETIC TOXICOLOGY
TABLE D1 TABLE D2
TABLE D3
TABLE D4
TABLE D5
TABLE D6
Mutagenicity of t-Butyl Alcohol in Salmonella typhimurium . . . . . . . . . . . . . . . . . . . . . . . Induction of Trifluorothymidine Resistance in L5178Y Mouse Lymphoma Cells by t-Butyl Alcohol . . . . . . . . . . . . . . . . . . . . . . . . . . . . . . . . . . . . . . . . . . . . . . . . . . . Induction of Sister Chromatid Exchanges in Chinese Hamster Ovary Cells by t-Butyl Alcohol . . . . . . . . . . . . . . . . . . . . . . . . . . . . . . . . . . . . . . . . . . . . . . . . . . . Induction of Chromosomal Aberrations in Chinese Hamster Ovary Cells by t-Butyl Alcohol . . . . . . . . . . . . . . . . . . . . . . . . . . . . . . . . . . . . . . . . . . . . . . . . . . . Induction of Micronuclei in Polychromatic Bone Marrow Cells of Male Rats Treated with t-Butyl Alcohol by Intraperitoneal Injection . . . . . . . . . . . . . . . . . . . . . . . . . Frequency of Micronuclei in Peripheral Blood Erythrocytes of Mice Following Treatment with t-Butyl Alcohol in Drinking Water for 13 Weeks . . . . . . . . . . . .
D-2
D-3
D-5
D-7
D-8
D-9

D-2 t-Butyl Alcohol, NTP TOX 53
TABLE D1 Mutagenicity of t-Butyl Alcohol in Salmonella typhimuriuma
Strain Dose (µg/plate) Trial 1
-S9 Trial 2
Revertants/plateb
+10% hamster S9 Trial 1 Trial 2
+10% rat S9 Trial 1 Trial 2
TA100
Trial summary Positive controlc
0 100 333
1,000 3,333
10,000
121 ± 2.2 97 ± 13.9 98 ± 9.1 92 ± 9.0
110 ± 4.7 99 ± 9.0
Negative 585 ± 40.5
70 ± 6.2 69 ± 7.5 75 ± 2.9 92 ± 13.0 90 ± 6.9 86 ± 4.1
Negative 495 ± 18.9
136 ± 5.2 125 ± 15.0 113 ± 1.2 122 ± 8.7 116 ± 12.3 114 ± 3.8
Negative 1,915 ± 139.3
98 ± 3.4 83 ± 1.7 85 ± 4.5 85 ± 3.8 86 ± 4.9 75 ± 1.7
Negative 2,124 ± 40.9
133 ± 5.9 109 ± 8.1 134 ± 8.5 117 ± 4.9 114 ± 11.8 118 ± 8.1
Negative 1,001 ± 112.9
83 ± 2.2 85 ± 8.0 91 ± 3.5 84 ± 5.2 78 ± 4.3 82 ± 4.8
Negative 1,372 ± 67.7
TA1535
Trial summary Positive control
0 100 333
1,000 3,333
10,000
5 ± 0.3 6 ± 0.3 4 ± 0.9 4 ± 0.7 4 ± 0.9 6 ± 1.0
Negative 623 ± 19.8
5 ± 0.9 8 ± 0.9 8 ± 0.9 6 ± 1.2 8 ± 1.0 9 ± 1.5
Negative 526 ± 84.8
7 ± 1.5 8 ± 0.9 6 ± 0.7 4 ± 0.9 7 ± 2.3 9 ± 1.5
Negative 160 ± 11.1
8 ± 2.1 9 ± 1.5
10 ± 1.7 11 ± 2.9 13 ± 3.2 13 ± 1.7
Negative 86 ± 6.2
7 ± 1.3 9 ± 0.3 6 ± 1.8 8 ± 0.9 6 ± 1.3 8 ± 0.3
Negative 51 ± 0.7
7 ± 3.5 11 ± 1.2 11 ± 2.6 7 ± 0.6
10 ± 0.9 11 ± 2.0
Negative 90 ± 10.7
TA1537
Trial summary Positive control
0 100 333
1,000 3,333
10,000
3 ± 0.7 2 ± 1.9 3 ± 0.7 3 ± 1.2 2 ± 2.3 1 ± 0.9
Negative 247 ± 99.6
4 ± 1.2 7 ± 1.3 6 ± 1.8 6 ± 2.0 8 ± 0.6 6 ± 2.0
Negative 101 ± 40.4
8 ± 0.9 6 ± 2.0 5 ± 1.3 5 ± 0.3 5 ± 1.8 5 ± 2.0
Negative 38 ± 3.0
7 ± 0.6 7 ± 0.6 8 ± 1.2
10 ± 0.0 9 ± 4.4 6 ± 2.0
Negative 39 ± 3.5
11 ± 1.5 5 ± 1.3 4 ± 0.6 4 ± 1.3 4 ± 0.7 7 ± 0.6
Negative 73 ± 11.8
6 ± 2.5 6 ± 2.6 9 ± 3.2 7 ± 0.6
10 ± 1.5 10 ± 0.9
Negative 108 ± 11.9
TA98
Trial summary Positive control
0 100 333
1,000 3,333
10,000
13 ± 2.5 12 ± 1.5 17 ± 1.9 9 ± 2.6
15 ± 5.8 10 ± 1.3
Negative 234 ± 36.7
13 ± 3.2 9 ± 2.3 8 ± 2.3
18 ± 3.7 10 ± 0.6 8 ± 0.6
Negative 102 ± 7.9
18 ± 3.8 19 ± 2.9 17 ± 3.5 14 ± 0.9 18 ± 0.7 17 ± 1.0
Negative 1,442 ± 86.7
18 ± 3.0 17 ± 4.4 12 ± 1.9 12 ± 1.7 15 ± 1.9 15 ± 2.3
Negative 1,528 ± 84.1
20 ± 0.3 16 ± 2.4 15 ± 1.5 21 ± 2.6 17 ± 1.5 18 ± 3.0
Negative 836 ± 161.8
20 ± 1.2 14 ± 0.3 15 ± 0.6 14 ± 2.9 13 ± 2.0 9 ± 1.3
Negative 590 ± 70.0
a The study was performed at Case Western Reserve University. The detailed protocol and these data are presented in Zeiger et al. (1987).b Revertants are presented as mean ± standard error from three plates.
The positive controls in the absence of metabolic activation were sodium azide (TA1535 and TA100), 9-aminoacridine (TA1537), and 4-nitro-o-phenylenediamine (TA98). The positive control for metabolic activation with all strains was 2-aminoanthracene.
c

D-3 Genetic Toxicology
TABLE D2 Induction of Trifluorothymidine Resistance in L5178Y Mouse Lymphoma Cells by t-Butyl Alcohola
Compound Concentration (µg/mL)
Cloning Efficiency
(%)
Relative Total Growth
(%)
Mutant Count
Mutant Fractionb
Average Mutant
Fractionc
-S9 Medium 62
60 67 54
100 96
111 93
144 160 207 157
78 90
103 98 92
Methyl methanesulfonate 15 20 23
22 25
369 337
605 499 552*
t-Butyl alcohol 1,000 55 62
112 91
153 185
93 100 96
2,000 41 53
87 98
160 198
130 124 127
3,000 62 55
81 90
257 191
139 115 127
4,000 50 51
78 78
191 243
126 158 142
5,000 58 52
75 71
275 227
157 146 152*
+S9 Trial 1
Medium 71 80 73
101 108 91
110 135 87
52 56 40 49
Methylcholanthrene 2.5 50 51
41 38
506 480
335 317 326*
t-Butyl alcohol 1,000 95 66
106 92
122 95
43 48 45
2,000 77 92
101 108
96 124
42 45 43
3,000 74 82
92 99
83 110
37 45 41
4,000 71 115 110 52
5,000 81 84
102 118
100 97
41 39 40

D-4
c
t-Butyl Alcohol, NTP TOX 53
TABLE D2 Induction of Trifluorothymidine Resistance in L5178Y Mouse Lymphoma Cells by t-Butyl Alcohol (continued)
Compound Concentration (µg/mL)
Cloning Efficiency
(%)
Relative Total Growth
(%)
Mutant Count
Mutant Fraction
Average Mutant Fraction
+S9 (continued) Trial 2
Medium 103 93 70 92
105 104 95 96
67 34 37 52
22 12 18 19 18
Methylcholanthrene 2.5 77 67
33 38
531 461
231 231 231*
t-Butyl alcohol 2,000 62 80
105 94
61 44
33 18 26
3,000 78 71
90 90
45 69
19 33 26
4,000 79 80
95 90
33 47
14 20 17
5,000 97 70
101 88
69 58
24 28 26
* Significant positive response (P#0.05) a Study performed at Inveresk Research International. The experimental protocol and these data are presented in McGregor et al. (1988). All doses
were tested in triplicate; the average of the three tests is presented in the table.b Mutant fraction (frequency) is a ratio of the mutant count to the cloning efficiency, divided by 3 (to arrive at MF/106 cells treated); MF = mutant
fraction. Mean from three replicate plates of approximately 106 cells each

D-5 Genetic Toxicology
TABLE D3 Induction of Sister Chromatid Exchanges in Chinese Hamster Ovary Cells by t-Butyl Alcohola
Compound Dose
µg/mL Total Cells
No. of Chromo-
somes No. of SCEs
SCEs/ Chromo-
some SCEs/ Cell
Hrs in BrdU
Relative Change of SCEs/
Chromosomeb
(%)
-S9 Trial 1 Summary: Weakly positive
Medium 50 1,039 419 0.40 8.4 26.0
Mitomycin-C 0.001 0.010
50 10
1,039 209
661 556
0.63 2.66
13.2 55.6
26.0 26.0
57.76 559.68
t-Butyl alcohol 160 500
1,600 5,000
50 50 50 50
1,045 1,047 1,046 1,049
444 457 486 509
0.42 0.43 0.46 0.48
8.9 9.1 9.7
10.2
26.0 26.0 26.0 26.0
5.36 8.24
15.21 20.32*
P<0.001c
Trial 2 Summary: Negative
Medium 50 1,040 430 0.41 8.6 26.0
Mitomycin-C 0.001 0.010
50 10
1,048 210
1,287 674
1.22 3.20
25.7 67.4
26.0 26.0
197.02 676.26
t-Butyl alcohol 2,000 3,000 4,000 5,000
50 50 50 50
1,037 1,039 1,046 1,040
437 433 478 453
0.42 0.41 0.45 0.43
8.7 8.7 9.6 9.1
26.0 26.0 26.0 26.0
1.92 0.79
10.52 5.35
P=0.104
+S9 Trial 1 Summary: Negative
Medium 50 1,035 474 0.45 9.5 26.0
Cyclophosphamide 0.3 2.0
50 10
1,041 210
606 322
0.58 1.53
12.1 32.2
26.0 26.0
27.11 234.81
t-Butyl alcohol 160 500
1,600 5,000
50 50 50 50
1,037 1,048 1,040 1,047
459 438 452 400
0.44 0.41 0.43 0.38
9.2 8.8 9.0 8.0
26.0 26.0 26.0 26.0
!3.35 !8.74 !5.10
!16.58
P=0.994

D-6
c
t-Butyl Alcohol, NTP TOX 53
TABLE D3 Induction of Sister Chromatid Exchanges in Chinese Hamster Ovary Cells by t-Butyl Alcohol (continued)
Compound Dose
µg/mL Total Cells
No. of Chromo-
somes No. of SCEs
SCEs/ Chromo-
some SCEs/ Cell
Hrs in BrdU
Relative Change of SCEs/
Chromosome (%)
+S9 (continued) Trial 2 Summary: Negative
Medium 50 1,038 469 0.45 9.4 26.0
Cyclophosphamide 0.3 2.0
50 10
1,044 210
622 319
0.59 1.51
12.4 31.9
26.0 26.0
31.86 236.20
t-Butyl alcohol 2,000 3,000 4,000 5,000
50 50 50 50
1,047 1,043 1,042 1,037
505 454 448 482
0.48 0.43 0.42 0.46
10.1 9.1 9.0 9.6
26.0 26.0 26.0 26.0
6.75 !3.66 !4.85
2.87
P=0.715
* Positive ($20% increase over solvent control) a Study performed at Environmental Health Research and Testing, Inc. The detailed protocol is presented by Galloway et al. (1987).
SCE = sister chromatid exchange; BrdU = bromodeoxyuridine.b SCEs/chromosome in treated cells versus SCEs/chromosome in solvent control cells
Significance of SCEs/chromosome tested by linear regression trend test vs. log of the dose

D-7 Genetic Toxicology
TABLE D4 Induction of Chromosomal Aberrations in Chinese Hamster Ovary Cells by t-Butyl Alcohola
-S9 +S9 Dose Total No. of Abs/ Cells with Dose Total No. of Abs/ Cells with
(µg/mL) Cells Abs Cell Abs (%) (µg/mL) Cells Abs Cell Abs (%)
Trial 1 - Harvest time: 11.0 hours Trial 1 - Harvest time: 11.5 hours Summary: Negative Summary: Equivocal
Medium Medium 100 3 0.03 3.0 100 0 0.00 0.0
Mitomycin-C Cyclophosphamide 0.25 100 42 0.42 32.0 15 100 20 0.20 19.0 1.00 50 27 0.54 28.0 50 100 61 0.61 42.0
t-Butyl alcohol t-Butyl Alcohol 160 100 3 0.03 3.0 160 100 4 0.04 4.0 500 100 4 0.04 4.0 500 100 1 0.01 1.0
1,600 100 1 0.01 1.0 1,600 100 3 0.03 3.0 5,000 100 3 0.03 3.0 5,000 100 6 0.06 6.0*
P=0.651b P=0.017
Trial 2 - Harvest time: 11.5 hours Trial 2 - Harvest time: 12.0 hours Summary: Negative Summary: Negative
Medium Medium 100 1 0.01 1.0 100 1 0.01 1.0
Mitomycin-C Cyclophosphamide 0.25 100 22 0.22 20.0 15 100 23 0.23 19.0 1.00 50 17 0.34 26.0 50 50 61 1.22 70.0
t-Butyl alcohol t-Butyl alcohol 1,600 100 5 0.05 5.0 1,600 100 4 0.04 4.0 3,000 100 3 0.03 3.0 3,000 100 2 0.02 2.0 4,000 100 0 0.00 0.0 4,000 100 2 0.02 2.0 5,000 100 5 0.05 5.0 5,000 13c 1 0.08 8.0
P=0.360 P=0.334
* Positive (P#0.05) a Study performed at Environmental Health Research and Testing, Inc. The detailed protocol is presented in Galloway et al. (1987).
Abs = aberrations. b Significance of percent cells with aberrations tested by the linear regression trend test vs. log of the dose c Due to severe toxicity, only 13 cells were scored at this concentration.

D-8
c
t-Butyl Alcohol, NTP TOX 53
TABLE D5 Induction of Micronuclei in Polychromatic Bone Marrow Cells of Male Rats Treated with t-Butyl Alcohol by Intraperitoneal Injectiona
Dose Number of Rats Micronucleated PCEs/1,000 PCEs
Phosphate-Buffered Salineb
0 5 1.70 ± 0.49
Cyclophosphamidec
25 5 29.20 ± 3.76
t-Butyl Alcohol 39.060 78.125
156.25 312.5 625
1,250d
5 4
5 0
1.00 ± 0.35 1.00 ± 0.42 1.20 ± 0.41 0.90 ± 0.29 1.80 ± 0.25
P=0.222e
a Study performed at Integrated Laboratory Systems, Inc. PCE = polychromatic erythrocyte.b Solvent control
Positive control d All animals died at this dose level e Significance tested by a one-tailed trend test
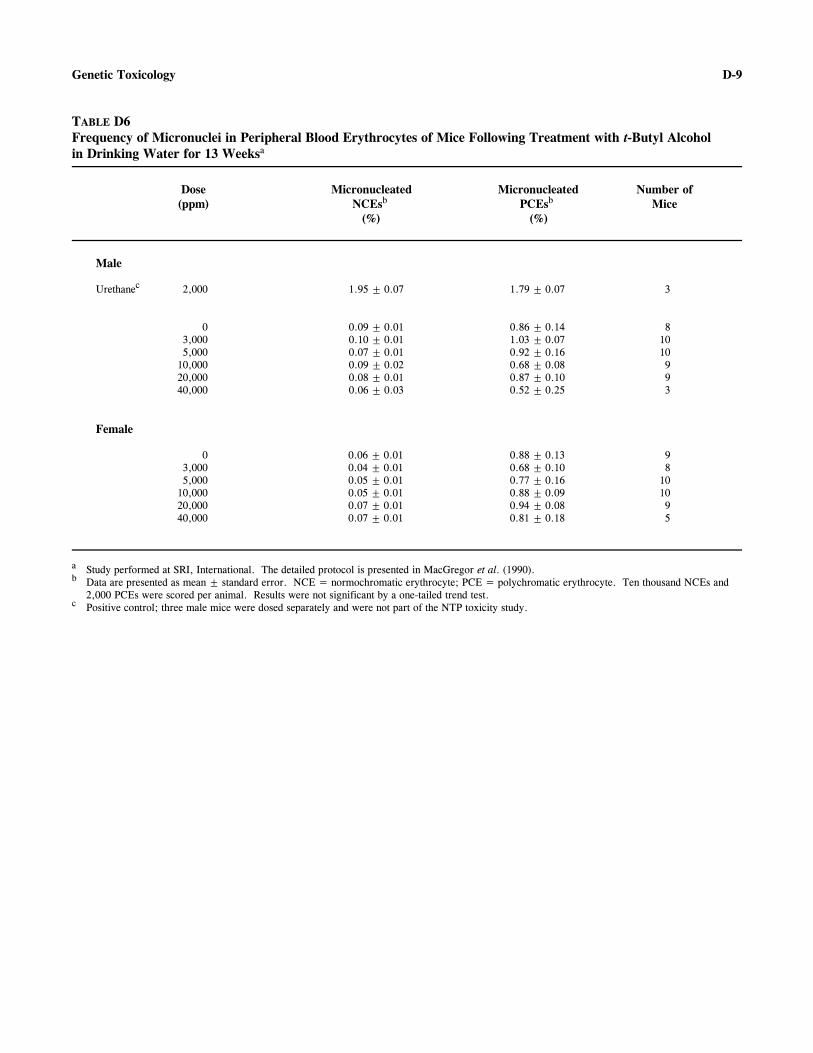
D-9
c
Genetic Toxicology
TABLE D6 Frequency of Micronuclei in Peripheral Blood Erythrocytes of Mice Following Treatment with t-Butyl Alcohol in Drinking Water for 13 Weeksa
Dose Micronucleated Micronucleated Number of (ppm) NCEsb PCEsb Mice
(%) (%)
Male
Urethanec 2,000 1.95 ± 0.07 1.79 ± 0.07 3
0 0.09 ± 0.01 0.86 ± 0.14 8 3,000 0.10 ± 0.01 1.03 ± 0.07 10 5,000 0.07 ± 0.01 0.92 ± 0.16 10
10,000 0.09 ± 0.02 0.68 ± 0.08 9 20,000 0.08 ± 0.01 0.87 ± 0.10 9 40,000 0.06 ± 0.03 0.52 ± 0.25 3
Female
0 0.06 ± 0.01 0.88 ± 0.13 9 3,000 0.04 ± 0.01 0.68 ± 0.10 8 5,000 0.05 ± 0.01 0.77 ± 0.16 10
10,000 0.05 ± 0.01 0.88 ± 0.09 10 20,000 0.07 ± 0.01 0.94 ± 0.08 9 40,000 0.07 ± 0.01 0.81 ± 0.18 5
a Study performed at SRI, International. The detailed protocol is presented in MacGregor et al. (1990).b Data are presented as mean ± standard error. NCE = normochromatic erythrocyte; PCE = polychromatic erythrocyte. Ten thousand NCEs and
2,000 PCEs were scored per animal. Results were not significant by a one-tailed trend test. Positive control; three male mice were dosed separately and were not part of the NTP toxicity study.

D-10 t-Butyl Alcohol, NTP TOX 53