ntroduction to compendium and other products and ...ecastats.uneca.org/acsweb/portals/0/economic...
TRANSCRIPT

ACS/ESNA
African Centre for Statistics, UNECA
Workshop on Capacity Building in Environment Statistics: the Framework for the Development of
Environment Statistics (FDES 2013)
Nairobi, Kenya
4-8 September 2017
INTRODUCTION TO COMPENDIUM AND OTHER
PRODUCTS AND MECHANISMS FOR
DISSEMINATION

Economic Commission for Africa
www.uneca.org
Outline of the Presentation
A. Preparation of environment statistics
B. Publication programme
C. Report/compendium
D. Dissemination

A. PREPARATION OF ENVIRONMENT STATISTICS

Economic Commission for Africa
www.uneca.org
Preparation of Environment statistics
Data collection
Database building
Report preparation
Dissemination – publication calendar, dispatch, data portal, etc
….

Economic Commission for Africa
www.uneca.org
Preparation of Environment statistics
Data collection
Database building
Report preparation
Dissemination – publication calendar, dispatch, data portal, etc
….

Economic Commission for Africa
www.uneca.org
Preparation of Environment statistics
Data collection
Database building
Report preparation
Dissemination – publication calendar, dispatch, data portal, etc
….
Data collection can be done through simple spreadsheet tables, or via
questionnaires
Surface mail, email or online: even real time – the choice is yours

Economic Commission for Africa
www.uneca.org
Preparation of Environment statistics
Environment statistics, need to be well
understood
The preparation depends on the
understanding of the topics;.
E.g. land cover may need maps.
Air quality may need colour codes
Tables and charts
Texts can be used to explain the
figures etc

Economic Commission for Africa
www.uneca.org
Preparation of Environment statistics
Data collection
Database building
Report preparation
Dissemination – publication calendar, dispatch, data portal, etc
….
Contents
Main environment indicators, 2005, 2013 and 2014
COMPONENT 1 : ENVIRONMENTAL CONDITIONS AND QUALITY
Table 1.1 - Main islets by geographical district and area, 2014
Table 1.2 - Mean temperature, 2005 - 2014
Table 1.3 - Mean maximum temperature, 2005 - 2014
Table 1.4 - Mean minimum temperature, 2005 - 2014
Table 1.5 - Mean annual rainfall by region, 2005 - 2014
Table 1.6 - Mean monthly rainfall by region, 2014
Table 1.7 - Monthly (24-hourly maximum) rainfall by station, 2005 - 2014
Table 1.7 (cont'd) - Monthly (24-hourly maximum) rainfall by station, 2005 - 2015
Table 1.8 - Monthly mean relative humidity (%) with extremes, 2014
Table 1.9 - Mean monthly and extreme values of mean sea level atmospheric pressure at Plaisance aeronautical station, 2005 - 2014
Table 1.10 - Monthly mean wind speed and highest gusts at Plaisance station, 2005 - 2014
Table 1.11 - Monthly total hours of sunshine by region and station, 2005 - 2014
Table 1.11 (cont'd)- Monthly total hours of sunshine by region and station, 2005 - 2015
Table 1.12 - Gross storage capacity and characteristics of reservoirs and major lakes
Table 1.13 - Percentage water level by month and reservoir, 2013 - 2014
Table 1.14 - Number of mangroves planted and area covered, 2011 - 2014
Table 1.15 - Fauna population, Republic of Mauritius, 2014
Environment
Chart/Data Chart Title
Avg Temperature Annual mean temperature - difference from 1961-1990 average
Greenhouse Gas (SP) Greenhouse gas emissions, taking acount of emissions and removals and global warming potential
Greenhouse Gas Footprint (SP) Greenhouse gas footprint (gha/capita)
Particulate Matter Particulate matter (PM10) annnual average concentrations (µg/m3)
Ground Level Ozone Concentration Number of days exceeding 100μg/m3 (maximum 8-hour mean)
Air Pollution Index of Scottish air pollutant emissions
River Water Length of poor and seriously polluted rivers in Scotland
Coastal Bathing Percentage Compliance with quality standards for coastal bathing waters
SDA Statutory Designated Area
Outdoor Visits (SP) Percentage of adults making one or more visits to the outdoors per week
Protected Nature Sites (SP) Percentage of protected nature sites found to be in favourable condition.
Recycle Percentage Households surveyed who recycled item in last month
Household Waste (SP) Waste produced by households in Scotland
BAP Species Status of BAP Species
BAP Habitat Status of BAP Habitat
Status of Wild Bird Populations (SP) Changes in abundance of wintering waterbirds, terrestrial breeding birds and breeding seabirds

Economic Commission for Africa
www.uneca.org
Component 1: Environmental Conditions and Quality
Sub-component 1.1: Physical Conditions
Topic Statistics and Related Information Category
of
Measurem
ent Potential Aggregations and Scales
Methodologic
al Guidance(Bold Text - Core Set/Tier 1; Regular Text - Tier 2;
Italicized Text - Tier 3)
Topic
1.1.1:
Atmospher
e, climate
and
weather
a. Temperature ▪ National
▪ Sub-national
▪ World
Meteorologic
al
Organization
(WMO)
▪
Intergovernm
ental Panel
on Climate
Change
(IPCC)
▪ National
Oceanic and
Atmospheric
Administratio
n (NOAA)/
National
Aeronautics
and Space
Administratio
n (NASA)
1. Monthly average Degrees
2. Minimum monthly average Degrees
3. Maximum monthly average Degrees
b. Precipitation (also in 2.6.1.a)
1. Annual average Height
2. Long-term annual average Height
3. Monthly average Height
4. Minimum monthly value Height
5. Maximum monthly value Height
c. Relative humidity
1. Minimum monthly value Number
2. Maximum monthly value Number
d. Pressure ▪ National
▪ Sub-national
▪ By station1. Minimum monthly value Pressure
unit
2. Maximum monthly value Pressure
unit
e. Wind speed ▪ National
▪ Sub-national1. Minimum monthly value Speed
2. Maximum monthly value Speed
f. Solar radiation ▪ National
▪ Sub-national1. Average daily value Area,
Energy
unit
2. Average monthly value Area,
Energy
unit
Preparation of Environment statistics Database building
….

Economic Commission for Africa
www.uneca.org
Preparation of Environment statistics
Database building
FieldsSN Region FDES
Code
Descripti
on
2000 2001 2002 2003 2004 2005 2006 2007
1 Z 111a1 Monthly
average
temperat
ure
20 21 20 20 20 20 20 20
2 Y 111a2 Minimum
monthly
average
tempeara
ture
18 14 18 18 18 18 18 18
3 Z 111a3
4 111a4
5 111a5 Row
Labels
Sum of
2000
Sum of
2001
Sum of
2002
Sum of
2003
6 111a6 Minimu
m
monthl
y
average
tempea
rature
18 14 18 18
7 1117 Monthly
average
temper
ature
20 21 20 20
8 111A8 Grand
Total
38 35 38 38
9 111A9
10 111A10
Field
Generated Pivot
TABLE

Economic Commission for Africa
www.uneca.org
Preparation of Environment statistics
Presentations of tables and charts can be made in
excel
Maps on GIS software
QGIS (Free)
ArcGIS (Commercial)
Special softwares can also be used
E.g. Flow charts and diagram Edraw (Free)
LaTex

Economic Commission for Africa
www.uneca.org
Preparation of Environment statistics
Presentations of tables and charts can be made in excel
Table 1.6 - Mean monthly rainfall 1 by region, 2014
Region
Month
West North South East Centre Whole Island
Mean
(mm)
Long
Term
Mean
(1981-
2010)
% of
Long
Term
Mean
Mean
(mm)
Long
Term
Mean
(1981-
2010)
% of
Long
Term
Mean
Mean
(mm)
Long
Term
Mean
(1981-
2010)
% of
Long
Term
Mean
Mean
(mm)
Long
Term
Mean
(1981-
2010)
% of
Long
Term
Mean
Mean
(mm)
Long
Term
Mean
(1981-
2010)
% of
Long
Term
Mean
Mean
(mm)
Long
Term
Mean
(1981-
2010)
% of
Long
Term
Mean
January 306 186 165 242 177 137 513 306 168 524 309 170 510 333 153 419 263 159
February 101 219 46 127 245 52 237 393 60 250 427 59 203 446 46 184 348 53
March 96 138 70 175 190 92 333 326 102 376 338 111 355 315 113 270 263 103
April 90 85 106 165 137 120 371 279 133 294 280 105 292 268 109 247 212 117
May 26 40 65 103 89 116 146 197 74 151 207 73 192 196 98 127 148 86
June 2 25 10 19 63 30 94 153 62 88 143 61 96 141 68 61 107 57
July 10 23 41 23 71 33 153 181 84 188 164 114 247 173 143 126 125 101
August 51 17 301 58 59 97 121 153 79 173 138 125 178 151 118 116 106 110
Septembe
r 11 27 40 22 57 39 64 136 47 74 130 57 95 124 76 54 96 56
October 11 22 51 50 42 119 90 107 84 92 101 91 74 107 69 64 77 84
November 13 30 43 49 45 109 134 114 117 107 107 100 130 92 141 89 78 114
December 189 100 189 230 119 193 351 227 155 442 224 197 462 222 208 336 180 187
Year 906 912 99 1,264 1,294 98 2,607 2,572 101 2,758 2,568 107 2,833 2,568 110 2,094 2,003 105 Source: Mauritius Meteorological Services 1 Average of 23 stations for different regions

Economic Commission for Africa
www.uneca.org
Preparation of Environment statistics
Presentations of tables and charts can be made in
excel

Economic Commission for Africa
www.uneca.org
Preparation of Environment statistics
Presentations of tables and charts can be made in
excel
0
5
10
15
20
25
30
35
40
45
1997 1999 2001 2003 2005 2007 2009 2011 2013 2015
An
nu
al
ave
rag
e c
on
ce
trati
on
s (
ug
/m3
)
Year
Particulate matter (PM10) annnual average concentrations (µg/m3): 1997-2015
Aberdeen ErrolPlaceDundee MainsLoanEdinburgh St.LeonardsGlasgow Centre
2004 AQS objective
2010 AQS objective

Economic Commission for Africa
www.uneca.org
Preparation of Environment statistics
Maps on GIS
software
QGIS

Economic Commission for Africa
www.uneca.org
Preparation of Environment statistics
Maps on GIS software
QGIS

Economic Commission for Africa
www.uneca.org
Preparation of Environment statistics
Maps on GIS software
QGIS Output

Economic Commission for Africa
www.uneca.org
Preparation of Environment statistics
Presentations of tables and charts can be made in
excel
Maps on GIS software and some analysis
R Software
R Studio
Map Demo

Economic Commission for Africa
www.uneca.org
Preparation of Environment statistics
Special softwares can also be used
E.g. Flow charts and diagram Edraw (Free)

Economic Commission for Africa
www.uneca.org
Preparation of Environment statistics
Special softwares can also be used
LaTex - Overleaf Demo

B. PUBLICATION PROGRAMME

Economic Commission for Africa
www.uneca.org
B. Publication programme

Economic Commission for Africa
www.uneca.org
B. Publication programme

Economic Commission for Africa
www.uneca.org
B. Publication programme
C. REPORT/COMPENDIUM

Economic Commission for Africa
www.uneca.org
C. Report/compendium
Many countries have already tested the FDES 2013.
Also using the steps shown previously, they have made impressive progress in two years, with almost all of them now publishing a compendium of environment statistics.

Economic Commission for Africa
www.uneca.org
C. Report/compendium
Many countries
have already
tested the FDES
2013.

Economic Commission for Africa
www.uneca.org
C. Report/compendium Contents example
Preamble 2
Acknowledgement 2
List of tables 3
List of figures 4
INTRODUCTION 5
ENVIRONMENTAL CONDITIONS AND QUALITY
Land cover, ecosystems and biodiversity 7
Geological and geographical information – land
8
Forests 8
Protected areas 11
Biodiversity 13

Economic Commission for Africa
www.uneca.org
C. Report/compendium Contents example
ENVIRONMENTAL RESOURCES AND THEIR USE 15
Water resources 16
Precipitation 16
Rainfall index 17
Abstraction, use and returns of water – water availability
18
Production, trade and consumption of energy 19
RESIDUALS
Emissions to air 21
Emissions of greenhouse gases 22
Consumption of Ozone Depleting Substances 25
NATURAL EXTREME EVENTS AND DISASTERS 26
Occurrences of natural extreme events and disasters 27
Occurrences of selected types of natural disasters 31
HUMAN SETTLEMENTS AND ENVIRONMENTAL HEALTH 33
Human settlements – urban and rural population 34
Access to selected basic services 35
Environmental concerns specific to settlements – infrastructure
36

Economic Commission for Africa
www.uneca.org
C. Report/compendium
Country example
Mauritius (link found in
slide show view)
Botswana
Suriname
Compendium Of Environment
Statistics Nepal 2015
Madagascar

D. DISSEMINATION
Economic Commission for Africa
www.uneca.org
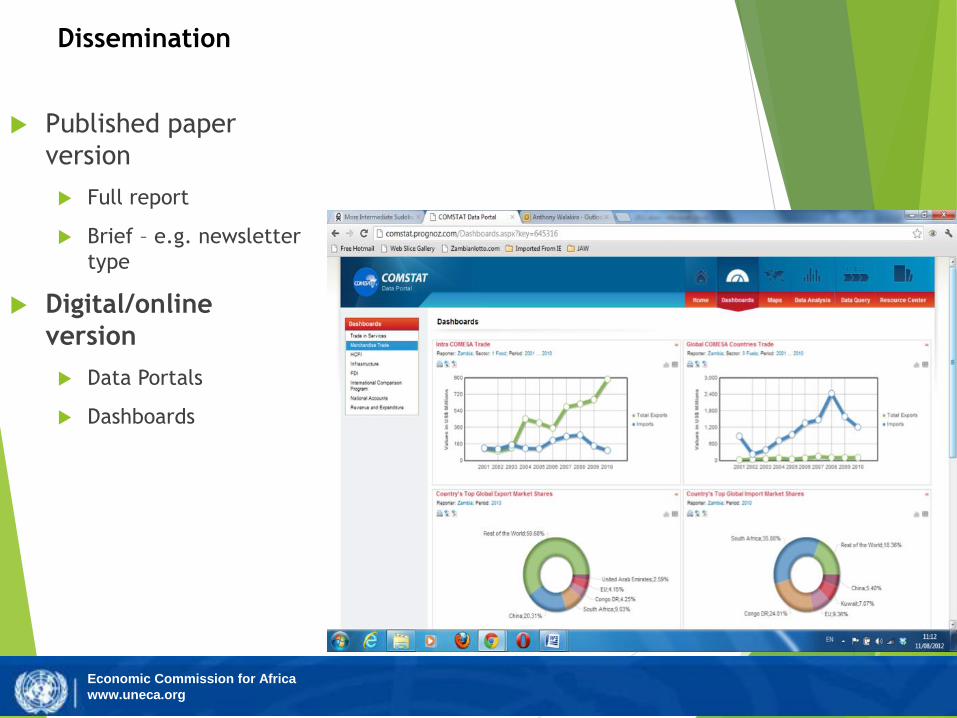
Dissemination
Published paper
version
Full report
Brief – e.g. newsletter
type
Digital/online
version
Data Portals
Dashboards

Economic Commission for Africa
www.uneca.org
Useful Tools
GIS
QGIS
R
R Studio
Report
LaTex
Online - Overleaf
MiKTeX

THANKS / MERCI