nuclear magnetic resonance characterization of indonesian ... · pdf file136 life: the...
TRANSCRIPT
136 Life: The Excitement of Biology 1 (3)
Nuclear Magnetic Resonance Characterization of
Indonesian Amber 1
Joseph B. Lambert2, Allison J. Levy2, Jorge A. Santiago-Blay3, and Yuyang Wu4
Abstract: Amber from four major Indonesian islands (Sumatra, Sulawesi, Borneo, New Guinea),
Malaysian Borneo, and from the Papua New Guinea island of Vanatinai (a total of 19 samples) has been examined by solid state carbon-13 and solution proton nuclear magnetic resonance (NMR)
spectroscopy. All samples but one had common NMR fingerprints by all spectral tests,
characteristic of NMR Group B ambers. The single exception, called green copal, had NMR fingerprints very similar to a commercial sample of dammar, the name given to many modern
exudates from Dipterocarpaceae trees in the region. There was a clear familial resemblance for the
dammar and green copal samples with all the spectra from many samples of modern dipterocarp exudates, with the trend of greater spectral complexity in going from amber to copal/dammar and
modern exudates. These spectral comparisons provide further evidence that dipterocarp forests
provided the resins that matured into copal and eventually amber after the passage of millions of years.
Key Words: amber, Borneo, copal, Dipterocarpaceae, fossilized resin, Indonesia, NMR, nuclear magnetic resonance spectroscopy
Unlike other gemstones, amber is a plant product, which is found
worldwide and was formed by fossilization of resins exuded from certain
ancient trees (Anderson and Crelling 1995; Fraquet 1987; Grimaldi 2003;
Langenheim 2003; Mills and White 1994; Poinar and Poinar 1994). The process
is incomplete when the time span is only a few thousand to a million years, and
such fossilized resin is called copal. Only when fully fossilized after more than
a million years is the material properly called amber. We use this term
generally, although it originally was associated with material from the Baltic Sea
region. Continued changes occur in deeper time, the overall geological process
being called maturation (Lambert et al. 2008). Amber is common from the
Miocene to the Cretaceous periods (5 to 150 Ma) and is known from the Jurassic
and Triassic periods (up to 250 Ma).
Although scientific examination of amber goes back to the nineteenth
century, Beck’s use of infrared spectroscopy on bulk samples of amber was the
1 Submitted on July 26, 2013. Accepted on August 19, 2013. Final revisions received on September
3, 2013. 2 Department of Chemistry, Trinity University, One Trinity Place, San Antonio, Texas 78212-1200
USA. E-mail: [email protected] 3 Department of Paleobiology, National Museum of Natural History, Washington, District of
Columbia 20560 USA. E-mail: [email protected] 4 Department of Chemistry, Northwestern University, 2145 Sheridan Road, Evanston, Illinois,
60208-3113 USA. E-mail: [email protected]
DOI: 10.9784/LEB1(3)Lambert.02
Electronically available on September 25, 2013. Mailed in October12, 2013.
Life: The Excitement of Biology 1 (3) 137
first effective approach (Beck 1986). Today, nuclear magnetic resonance
(NMR) spectroscopy (Lambert and Frye 1982) and pyrolysis gas
chromatography with mass spectrometry (GC/MS) (Anderson and Winans 1991)
provide the best approaches to amber characterization. Both methods have
distinguished several distinct categories of amber, differing primarily in the
botanical nature of the ancient tree source (Lambert et al. 2008). Whereas NMR
Group A (MS Class Ib) amber came from gymnosperms (conifers), NMR Group
B (MS Class II) amber came from angiosperms (flowering plants). These two
classes of amber occur worldwide. The conifer class occurs across North
America, Greenland, Western Europe, Southwest Asia, China, Siberia,
Southeast Asia, Australia, and New Zealand. The angiosperm class has limited
sources in the United States (so far, only in the states of Arkansas and North
Carolina), South Asia (the Indian states of Kerala and Meghalaya), Indonesia,
Papua New Guinea, and southern Australia. A distinct angiosperm category,
termed NMR Group D or MS Class Ic, occurs in Mesoamerica, the Caribbean,
South America, Africa, and possibly Yemen. Whereas Group B ambers are
thought to derive from the family Dipterocarpaceae, Group D ambers are from
the Fabaceae (legumes). The precise conifer source of Group A ambers is still
uncertain.
Even though Group B amber occurs worldwide, such materials tend to be
much less common than those of Group A. Of the samples studied by carbon-13
(13
C) NMR spectroscopy, a single sample has been examined from Papua New
Guinea (NMR sample 139 in our overall numbering system, referred to as
sample 20 in the original study, Lambert et al. 1993). It came from Sudest
Island, now known as Vanatinai, some 220 miles southeast of the main island of
New Guinea. Two Australian samples (called 26 and 32 in the same study, but
now overall 145 and 151, Lambert et al. 1993) came from Cape Patterson and
from the Wonthoggi Coal Mine (Upper Cretaceous), both in the state of Victoria
in southeastern Australia. An Indian sample (374), extracted from the Warkalli
formation (upper Tertiary), near Nileshwar on the Kerala (southwestern) coast
of India proved to be Group B (Lambert et al. 2012), as did a sample (1011)
from the opposite end of India, the northeastern state of Meghalaya near the
town of Cherrapunji (Sohra), north of Bangladesh. We have examined three
samples (109, 110, 170) from Malvern, Arkansas (USA), associated with the
Claiborne Formation (Lower Middle Eocene, minimum age 50 Ma), all
identified as Group B (Lambert et al. 1990). Amber from North Carolina (USA)
exhibits a dichotomy in that closely associated materials may be either Group A
or Group B, only distinguishable by NMR or MS methods. We have examined
16 alleged ambers from North Carolina, of which two proved not to be amber
(one was a modern pinacean resin and another contained no observable carbon).
Of the remaining 14, four (253, 1259, 1261, and 1479) proved to be Group B, all
from Beaufort Co. and associated with phosphate mines. The stratigraphic level
has been identified as the Pungo River Formation from the Lower Miocene.
138 Life: The Excitement of Biology 1 (3)
Group A ambers also come from Beaufort Co., as well as from other NC
counties. Geological times for Group B ambers thus range from about 20 to 100
Ma.
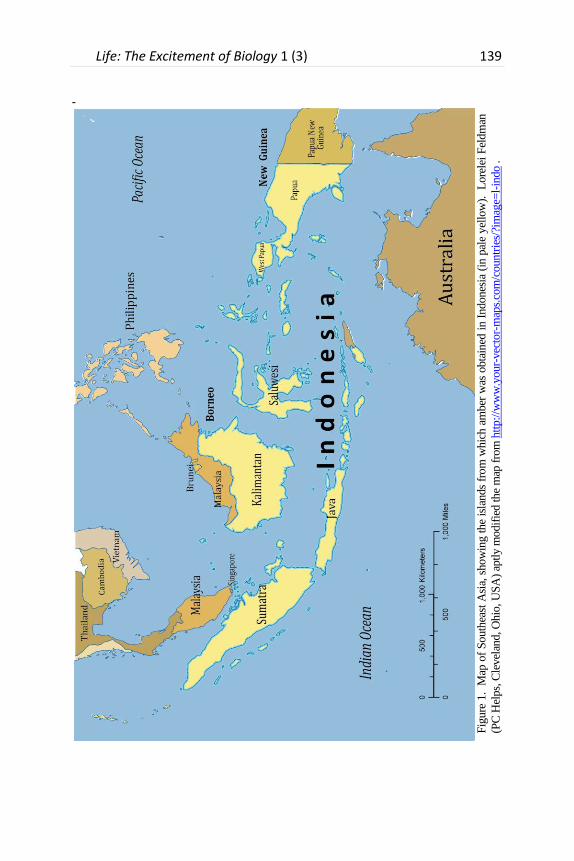
Indonesia comprises most of the island mass that lies roughly on a diagonal
from Australia to the Southeast Asian mainland. Indonesia is composed of more
than 18,000 islands, of which some 900 are inhabited. The main islands (from
west to east) are Sumatra, Java, the southern portion of Borneo known as
Kalimantan, Sulawesi, and two provinces on the western side of the island of
New Guinea, formerly called Irian Jaya (Figure 1). Some of the islands are
shared by other countries, including Brunei and two Malaysian states on the
north side of Borneo, Papua New Guinea on the eastern half of New Guinea, and
East Timor. The Indonesian archipelago is a rich source of both amber and its
presumed botanical precursor, often called dammar gum or resin. The fossilized
resins are mined from coal and lignite beds dating usually to the Early Miocene
(20-23 Ma) and found in numerous locations, including the Talang Akar
formation in South Sumatra, the Jampang formation in West Java, West
Kalimantan, Sulawesi, and West Papua. Although many Indonesian ambers
have the classic colors of European and American amber (yellow to brown),
very lightly colored materials are common, tending towards exotic and rare
colors such as blue.
We previously have analyzed three samples from this region, as well as the
already mentioned sample from Vanatinai, Papua New Guinea. A sample from
the Harvard University Farlow Herbarium (Economic Botany General
Collection) (NMR number 972) was listed as Borneo copal (country not
specified). The 13
C NMR spectrum of this material, however, does not resemble
any class of amber. It more closely resembles a modern resin from a conifer
from the family Araucariaceae. We also analyzed samples referred to only as
amber from Malaysian Borneo (157) and amber from Sarawak (167), supplied
by George O. Poinar Jr. These materials proved to be Group B ambers.
Indonesian ambers also have been studied with MS methods. Brackman et
al. (1984) examined what they called “fossil resin from Miocene coal” from the
Bukit Asam region of Sumatra. They reported that the material was formed
from sesqui- and triterpenes from trees of the Dipterocarpaceae, the original
terpenes having polymerized to resins with molecular weights up to 300,000.
Van Aarssen et al. (1990) reported that fossil resin from Brunei on Borneo
exhibited similarities to modern dammar (resin from dipterocarps). They found
that the low molecular weight (soluble) fraction contained sesqui- and
triterpenes other than the bicadinanes. The high molecular weight (insoluble)
fraction was a polymer based on the sesquiterpene cadinene. The exact nature
of the polymers, however, has been elusive. Stout (1995), using MS methods,
concluded that the polymers from fossil resins from Borneo were not based on
polycadinanes common in dammars. Similar results were obtained by Anderson
and Muntean (2000). They interpreted their results as being inconsistent with a
Life: The Excitement of Biology 1 (3) 139
-
Fig
ure
1. M
ap o
f S
outh
east
Asi
a, s
how
ing t
he
isla
nds
from
whic
h a
mber
was
obta
ined
in I
ndones
ia (
in p
ale
yel
low
).
Lore
lei
Fel
dm
an
(PC
Hel
ps,
Cle
vel
and, O
hio
, U
SA
) ap
tly m
odif
ied the
map
fro
m h
ttp:/
/ww
w.y
our-
vec
tor-
map
s.co
m/c
ountr
ies/
?im
age=
l-in
do .
140 Life: The Excitement of Biology 1 (3)
polycadinene structure for the polymer, although they did not propose an
alternative. By solution-phase proton (1H) NMR experiments, they confirmed
that the primary alkene present in the fossilized materials was the same as that in
modern dammar, supporting the theory that the botanical precursors to the
fossilized materials came from the Dipterocarpaceae. Their fossilized sample
was from the Merit Pila Coal Mine from the Malaysian state of Sarawak on
Borneo.
Modern exudates from this region often are called dammar (or damar) gum
or resin. The term gum is inappropriate in a technical context, as it normally
refers to an exudate composed entirely of polycarbohydrates (Nussinovich
2010), whereas exudatic resins are composed of terpenes (Langenheim 2003).
Indeed, dammar from trees of the Dipterocarpaceae, particularly the genera
Shorea and Hopea, are composed of triterpenes such as dammarane, oleanane,
and oleanonic acid. Dammar includes, in addition to these low molecular
weight molecules, a high molecular weight (polymeric) component.
We report herein the first comprehensive study of amber from the
Indonesian archipelago (including countries that share islands) by NMR
spectroscopy. For analysis of the material in bulk, we use solid state 13
C NMR
spectroscopy. In addition, we examine the same, highly soluble materials in
solution by 1H NMR spectroscopy. The two methods provide complementary,
independent, phenomenological profiles of the materials. In contrast to GC/MS,
with which efforts are made to identify individual molecules out of a host of
constituents, NMR spectroscopy provides molecular fingerprints either of the
bulk or of the soluble portion. We have obtained 19 samples from the islands of
Sumatra, Sulawesi, Borneo, New Guinea, and Vanatinai to make comparisons
not previously possible, as earlier studies have focused on just a few samples.
Methods Table 1 lists the samples that comprise this study, including their sources. Four
types of spectra were taken for each sample. (1) Solid state 13
C spectra with normal
decoupling. Under these conditions, all protons are decoupled from the 13
C nuclei.
(2) Solid state 13
C spectra with dipolar dephasing (also called interrupted
decoupling). An extra 1H delay prevents most protons from being decoupled from
13C, so that their resonances become broadened to the point of disappearance.
Resonances remain primarily from carbons with no attached protons (quaternary
carbons and carbonyl carbons other than aldehydes). Some rapidly moving carbons
also produce surviving resonances. (3)The one-dimensional (1D) solution 1H
spectrum. (4) The two-dimensional (2D) solution spectrum known as COSY (for
COrrelation SpectroscopY), in which the peaks derive from coupling between two
protons. Both x and y coordinates are the normal 1H chemical shifts. An observed
peak then represents coupling between protons resonating at the two coordinates (x,
y) of the peak. Detailed interpretation of resonance positions or cross peaks is not
needed, as these spectra are used as fingerprints of the materials. Our suite of
experiments thus provides four different fingerprints for each sample.

Life: The Excitement of Biology 1 (3) 141
Table 1. Sources of Indonesian ambers and related materials
Sample
Number Source Provider Color
139 Sudest Island
(Vanatinai), Papua New
Guinea
George O. Poinar Jr. golden brown
167 Sumatra, Indonesia George O. Poinar Jr. golden brown
1418 Kuala Tungkal, Jambi,
Central Sumatra,
Indonesia
Mohammad Iskandar
bin Marzuki
light yellowish
brown
1419 Kuala Tungkal, Jambi,
Central Sumatra,
Indonesia
Mohammad Iskandar
bin Marzuki
light yellowish
brown
1420 Padang, West Sumatra,
Indonesia
Mohammad Iskandar
bin Marzuki
brownish yellow
1423 Lampung, South
Sumatra, Indonesia
Mohammad Iskandar
bin Marzuki
dark yellow with
bluish tinge
1424 Lampung, South
Sumatra, Indonesia
Mohammad Iskandar
bin Marzuki
clear with greenish
tinge
1425 Lampung, South
Sumatra, Indonesia
Mohammad Iskandar
bin Marzuki
dark yellowish
brown
1437 Lampung, South
Sumatra, Indonesia
Teruhisa Ueno,
Fukuoka, Japan
yellow with darker
regions
1421 Kendari, Southwest
Sulawesi, Indonesia
Mohammad Iskandar
bin Marzuki
yellowish brown
1513 Sulawesi, Indonesia Galactic Stone and
Ironworks
reddish brown
1422 Manokwari, West Papua
(Irian Jaya), Indonesia
Mohammad Iskandar
bin Marzuki
light yellowish
brown
1414 West Kalimatan
(Borneo), Indonesia
Mohammad Iskandar
bin Marzuki
dark orangish red
1415 West Kalimatan
(Borneo), Indonesia
Mohammad Iskandar
bin Marzuki
opaque gray to tan
1416 Sintang, West Kalimatan
(Borneo), Indonesia
Mohammad Iskandar
bin Marzuki
yellowish brown
1417 Sintang, West Kalimatan
(Borneo), Indonesia
Mohammad Iskandar
bin Marzuki
light yellowish
brown
1453 Samandra, Kalimantan
(Borneo), Indonesia
A. Brown brownish orange
157 Borneo, Malaysia George O. Poinar Jr. light yellow
1506 Merit Pila, Sarawak,
Borneo, Malaysia
Galactic Stone and
Ironworks
dirty yellow
270 commercial dammar
(modern)
George O. Poinar Jr. light yellow
789 Shorea hopeifolia (Heim)
Sym. (modern)
New York Botanical
Garden; Jorge A.
Santiago-Blay
reddish yellow
142 Life: The Excitement of Biology 1 (3)
Materials first were ground into a fine powder. For solid state 13
C spectra, a
minimum of 50 mg was required and a full load was 160 mg. Typically at least
100 mg was loaded into a Varian 5-mm, general-purpose Zirconia rotor sealed
with Vespel caps. For solution state 1H spectra, approximately 55 mg of
powdered amber was transferred to a small, glass vial, and about 1 mL of
deuterated chloroform-d was added to each vial. The supernatant was pipetted
out and transferred to a 5-mm NMR tube.
Solid state 13
C NMR data were recorded on a 400 MHz Varian NMR
System with a 5-mm T3 PENCIL probe. The magic angle spinning (MAS) rate
was set to 5000 Hz. The cross polarization (CP) pulse sequence was used for
normal proton decoupling. For interrupted decoupling (dipolar dephasing), a
50-μs delay was applied in the 1H channel just before the 180° pulse in the
13C
channel. We used adamantane to optimize the Hartmann-Hahn matching
conditions for normal CP experiments and to adjust the observation pulse and
the delay time for dipolar dephasing. A typical parameter set was as follows:
spectrum frequency 100.544 MHz, spectral width 50 kHz, pulse width 3.4 μs for
the 90° pulse for both 1H and
13C nuclei, delay time 5 s, contact time 2 ms,
acquisition time 20.5 ms, and scan number 256. Solid state 13
C spectra were
referenced to an external adamantane peak at δ 38.3 and were converted to
tetramethylsilane at δ 0.0.
Proton spectra were obtained on a Varian Inova-500 NMR spectrometer at
room temperature without spinning. Typical one-dimensional parameters were
as follows: spectral width 6009.6 Hz, pulse width 45 or 60°, delay time 1.0 s,
acquisition time 2.726 s, and scan number 64. Spectra were referenced in
CDCl3 to TMS. Typical two-dimensional parameters without pulsed field
gradients were as follows: spectral width 6009.6 Hz, pulse width 90°, delay
time 1.0 s, scan number 1, and increment number 128.
Discussion
Figure 2 illustrates typical solid state 13
C spectra of the Indonesian ambers.
This particular piece (no. 1418) was found in Kuala Tungkal, Jambi, Central
Sumatra. Its light coloring was dominated by yellows and browns, but the
clearest, inner portion had only a bluish tinge. The inner and outer portions
were not separated. The saturated (alkane) portion of the 13
C spectra with full
decoupling (lower spectrum) is dominated by five strong peaks in the saturated
region at δ 16, 22, 26, 37, and 48. These peaks come from methyl, methylene,
and methine carbons that are attached to other carbons rather than to
heteroatoms (oxygen, nitrogen). The only other significant resonances are the
two broad peaks in the alkene region at δ 126 and 135 (CH==CH). Peaks in the
vicinity of δ 80 and 180 are spinning sidebands of the alkenic peaks. With
dipolar dephasing (upper spectrum), three saturated peaks (δ 16, 22, and 37) and
one weak alkenic peak survive. This three-peak saturated pattern is particularly

Life: The Excitement of Biology 1 (3) 143
Figure 2. The solid state 13C spectrum of amber from Kuala Tungkal, Jambi, Central
Sumatra, Indonesia (sample no. 1418) with normal decoupling (lower) and with dipolar
dephasing (upper).
diagnostic for Group B ambers. Amber from Groups A and D give very
different patterns (Lambert et al. 2008).
The 13
C spectra are devoid of resonances in the carbonyl region (δ 160-
220), so that aldehydes, ketones, esters, and carboxylic acids are absent or below
the detectable threshold. Resonances in the alkenic region are limited to peaks
between δ 120 and 140. These positions are characteristic of disubstituted
double bonds (—HC==CH—), as found along straight chains or within rings.
Terminal-chain and unsubstituted-exocyclic alkenes (==CH2) resonate at δ ca.
110 and fully substituted double bonds (>C==) at δ ca. 150, regions that are
empty in the spectra.
The 1D solution 1H proton spectrum is equally distinctive (Figure 3). In
this illustration from the same amber from Central Sumatra (no. 1418), the sharp
peak at δ 0.0 is the standard, tetramethylsilane (Me4Si), and the sharp peak at δ
7.3 is from the CHCl3 impurity in the deuterated solvent, CDCl3. There are two
dominant peaks in the saturated region at δ 0.8 and 0.9. Additional peaks from
saturated protons occur from δ 1.0 to 2.2 in a pattern this is repeated by almost
all Group B ambers (Lambert et al. 2012). In addition, there are two alkenic
peaks at δ 5.3 and 5.5 and very weak aromatic peaks in the vicinity of δ 7.0.
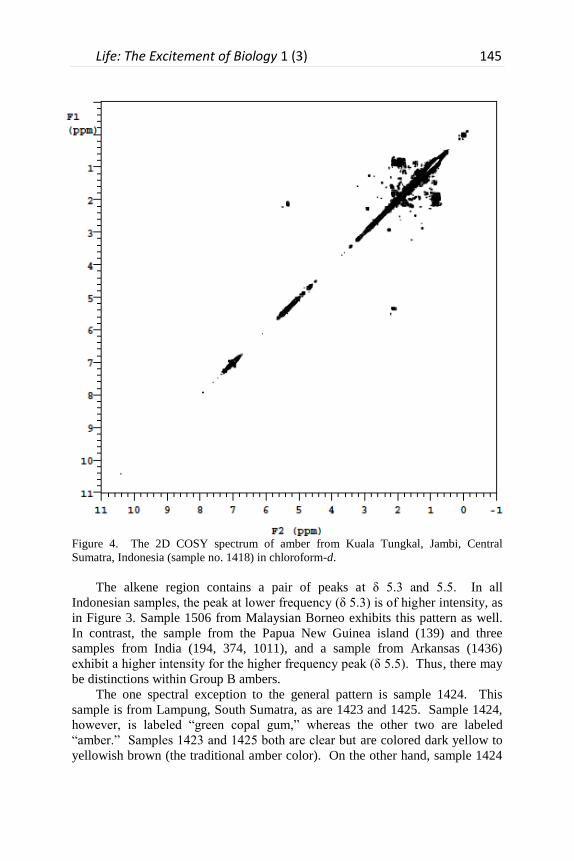
The carbon and proton spectra generally match in functionality. In the 2D CO-
SY spectrum (Figure 4 for the same amber, no. 1418) there is a mass of cross
peaks representing coupling between pairs of saturated protons (δ 1-3) that is of
no particular use. The only significant cross peak is found at (2.2, 5.4) and

144 Life: The Excitement of Biology 1 (3)
Figure 3. The 1D 1H spectrum of amber from Kuala Tungkal, Jambi, Central Sumatra,
Indonesia (sample no. 1418) in chloroform-d.
represents coupling between saturated and alkenic protons, as in an allylic
fragment, CH—CH==CH. Three other cross peaks often found in Group B
ambers (Lambert et al. 2008) are present in many samples in this study but are
weak.
These carbon and proton patterns are repeated most harmoniously
throughout almost all the amber samples from Indonesia, Malaysian Borneo, and
Papua New Guinea, irrespective of source island or color. It is apparent that the
causes of color in these ambers are not based on organic functionality but more
likely on the physical structure (Nassau 1983). Not only are the spectra
independent of color, but the spectra do not support extended aromatic or
unsaturated systems, which must provide the electronic transitions that are the
molecular basis of color. The saturated regions of these spectra closely parallel
those previously observed in Type B ambers from Arkansas, North Carolina,
Australia, and India, favoring a rather specific botanical source (Lambert et al.
2012).
Life: The Excitement of Biology 1 (3) 145
Figure 4. The 2D COSY spectrum of amber from Kuala Tungkal, Jambi, Central
Sumatra, Indonesia (sample no. 1418) in chloroform-d.
The alkene region contains a pair of peaks at δ 5.3 and 5.5. In all
Indonesian samples, the peak at lower frequency (δ 5.3) is of higher intensity, as
in Figure 3. Sample 1506 from Malaysian Borneo exhibits this pattern as well.
In contrast, the sample from the Papua New Guinea island (139) and three
samples from India (194, 374, 1011), and a sample from Arkansas (1436)
exhibit a higher intensity for the higher frequency peak (δ 5.5). Thus, there may
be distinctions within Group B ambers.
The one spectral exception to the general pattern is sample 1424. This
sample is from Lampung, South Sumatra, as are 1423 and 1425. Sample 1424,
however, is labeled “green copal gum,” whereas the other two are labeled
“amber.” Samples 1423 and 1425 both are clear but are colored dark yellow to
yellowish brown (the traditional amber color). On the other hand, sample 1424
146 Life: The Excitement of Biology 1 (3)
is clear with a greenish tint. The term “green amber” sometimes is used to mean
“young amber,” synonymous with copal or immature fossil resin. Commercial
amber with an opaque green color is likely to have been dyed artificially. This
material (1424), however, is truly a green amber in color as well as lack of
maturity. Like other copals from America and Africa that we have studied
(Lambert et al. 2002), sample 1424 is quite soft and highly soluble in organic
solvents. In his notes on the sample, Iskandar states that the supplier claimed
that the “copal is extremely rare, soft like kauri gum, not easy to polish.”
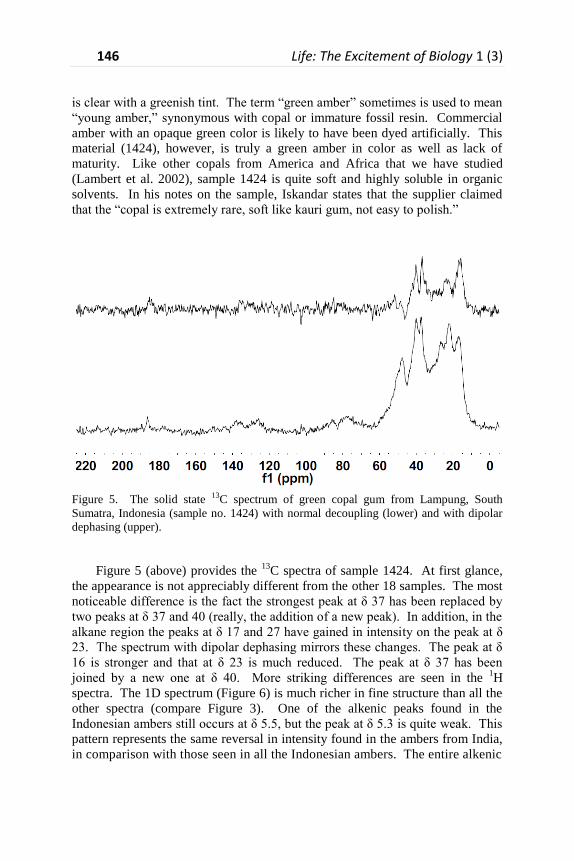
Figure 5. The solid state 13C spectrum of green copal gum from Lampung, South
Sumatra, Indonesia (sample no. 1424) with normal decoupling (lower) and with dipolar
dephasing (upper).
Figure 5 (above) provides the 13
C spectra of sample 1424. At first glance,
the appearance is not appreciably different from the other 18 samples. The most
noticeable difference is the fact the strongest peak at δ 37 has been replaced by
two peaks at δ 37 and 40 (really, the addition of a new peak). In addition, in the
alkane region the peaks at δ 17 and 27 have gained in intensity on the peak at δ
23. The spectrum with dipolar dephasing mirrors these changes. The peak at δ
16 is stronger and that at δ 23 is much reduced. The peak at δ 37 has been
joined by a new one at δ 40. More striking differences are seen in the 1H
spectra. The 1D spectrum (Figure 6) is much richer in fine structure than all the
other spectra (compare Figure 3). One of the alkenic peaks found in the
Indonesian ambers still occurs at δ 5.5, but the peak at δ 5.3 is quite weak. This
pattern represents the same reversal in intensity found in the ambers from India,
in comparison with those seen in all the Indonesian ambers. The entire alkenic
Life: The Excitement of Biology 1 (3) 147
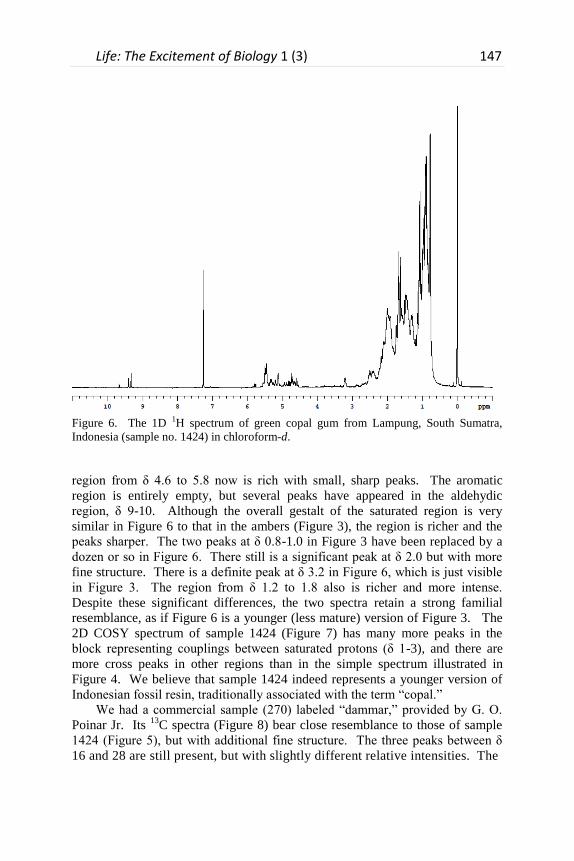
Figure 6. The 1D 1H spectrum of green copal gum from Lampung, South Sumatra,
Indonesia (sample no. 1424) in chloroform-d.
region from δ 4.6 to 5.8 now is rich with small, sharp peaks. The aromatic
region is entirely empty, but several peaks have appeared in the aldehydic
region, δ 9-10. Although the overall gestalt of the saturated region is very
similar in Figure 6 to that in the ambers (Figure 3), the region is richer and the
peaks sharper. The two peaks at δ 0.8-1.0 in Figure 3 have been replaced by a
dozen or so in Figure 6. There still is a significant peak at δ 2.0 but with more
fine structure. There is a definite peak at δ 3.2 in Figure 6, which is just visible
in Figure 3. The region from δ 1.2 to 1.8 also is richer and more intense.
Despite these significant differences, the two spectra retain a strong familial
resemblance, as if Figure 6 is a younger (less mature) version of Figure 3. The
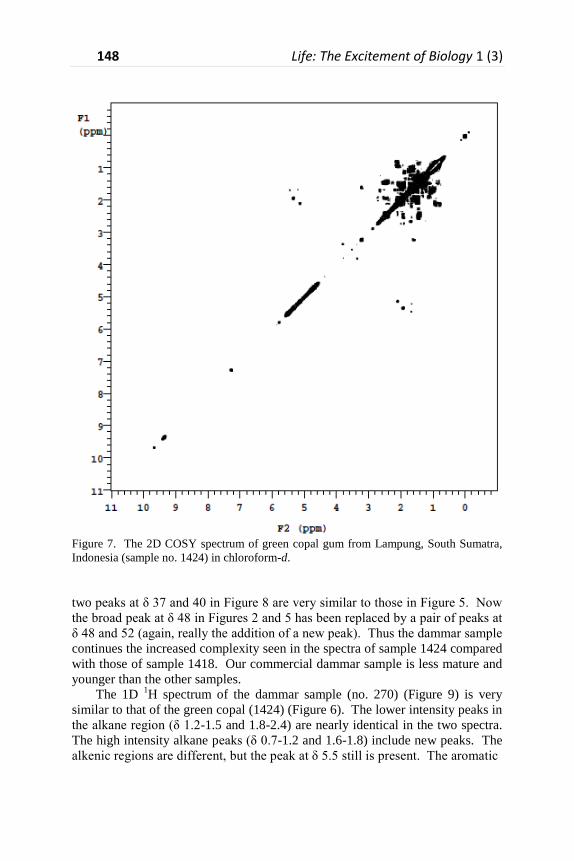
2D COSY spectrum of sample 1424 (Figure 7) has many more peaks in the
block representing couplings between saturated protons (δ 1-3), and there are
more cross peaks in other regions than in the simple spectrum illustrated in
Figure 4. We believe that sample 1424 indeed represents a younger version of
Indonesian fossil resin, traditionally associated with the term “copal.”
We had a commercial sample (270) labeled “dammar,” provided by G. O.
Poinar Jr. Its 13
C spectra (Figure 8) bear close resemblance to those of sample
1424 (Figure 5), but with additional fine structure. The three peaks between δ
16 and 28 are still present, but with slightly different relative intensities. The
148 Life: The Excitement of Biology 1 (3)
Figure 7. The 2D COSY spectrum of green copal gum from Lampung, South Sumatra,
Indonesia (sample no. 1424) in chloroform-d.
two peaks at δ 37 and 40 in Figure 8 are very similar to those in Figure 5. Now
the broad peak at δ 48 in Figures 2 and 5 has been replaced by a pair of peaks at
δ 48 and 52 (again, really the addition of a new peak). Thus the dammar sample
continues the increased complexity seen in the spectra of sample 1424 compared
with those of sample 1418. Our commercial dammar sample is less mature and
younger than the other samples.
The 1D 1H spectrum of the dammar sample (no. 270) (Figure 9) is very
similar to that of the green copal (1424) (Figure 6). The lower intensity peaks in
the alkane region (δ 1.2-1.5 and 1.8-2.4) are nearly identical in the two spectra.
The high intensity alkane peaks (δ 0.7-1.2 and 1.6-1.8) include new peaks. The
alkenic regions are different, but the peak at δ 5.5 still is present. The aromatic

Life: The Excitement of Biology 1 (3) 149
Figure 8. The solid state 13C spectrum of dammar (sample no. 270) with normal
decoupling (lower) and with dipolar dephasing (upper).
Figure 9. The 1D 1H spectrum of dammar (sample no. 270) in chloroform-d.
region is empty and, as with sample 1424, there are aldehydic peaks at δ 9.3-9.5.
The largest cross peak in the 2D COSY spectrum (Figure 10) is that at (2.0, 5.3),
in common with the Indonesian ambers and copal.

150 Life: The Excitement of Biology 1 (3)
Figure 10. The 2D COSY spectrum of dammar (sample no. 270) in chloroform-d.
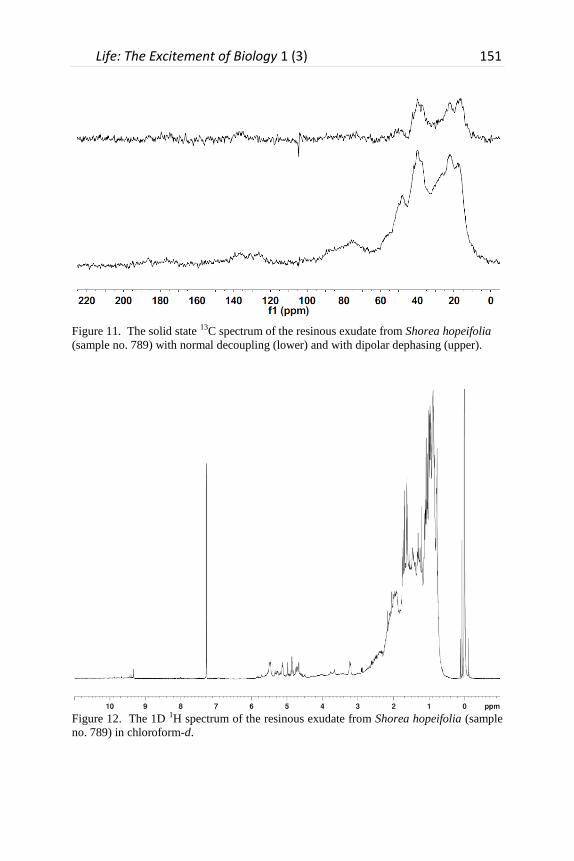
In our study of rosid exudates (Lambert et al., 2013), we examined the
NMR spectra of 50 members of the family Dipterocarpaceae, of which 48 were
resins. All genera and species exhibited very similar spectra, which we divided
into two classifications, distinguished by peak breadth. The spectra of sample
1424 and of the dammar sample are similar to those of the group with sharper
peaks for both 13
C and 1H spectra. Figure 11 illustrates the
13C spectra for the
species Shorea hopeifolia (sample 789). Both modes of decoupling gave spectra
closely resembling those of green copal (1424) and of dammar (270). Similar
resemblances were found in the 1D 1H spectra, illustrated in Figure 12 for the
same species (Shorea hopeifolia), including the alkenic peak at δ 5.5 and the
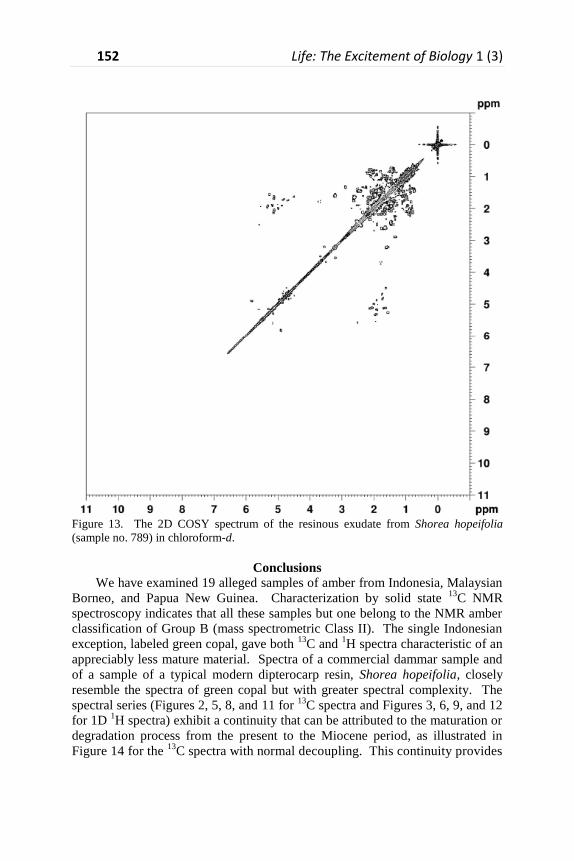
aldehydic peaks at δ 9.3. The COSY spectrum (Figure 13) is similar to that of
dammar but with additional cross peaks.
Life: The Excitement of Biology 1 (3) 151
Figure 11. The solid state 13C spectrum of the resinous exudate from Shorea hopeifolia
(sample no. 789) with normal decoupling (lower) and with dipolar dephasing (upper).
Figure 12. The 1D 1H spectrum of the resinous exudate from Shorea hopeifolia (sample
no. 789) in chloroform-d.
152 Life: The Excitement of Biology 1 (3)
Figure 13. The 2D COSY spectrum of the resinous exudate from Shorea hopeifolia
(sample no. 789) in chloroform-d.
Conclusions We have examined 19 alleged samples of amber from Indonesia, Malaysian
Borneo, and Papua New Guinea. Characterization by solid state 13
C NMR
spectroscopy indicates that all these samples but one belong to the NMR amber
classification of Group B (mass spectrometric Class II). The single Indonesian
exception, labeled green copal, gave both 13
C and 1H spectra characteristic of an
appreciably less mature material. Spectra of a commercial dammar sample and
of a sample of a typical modern dipterocarp resin, Shorea hopeifolia, closely
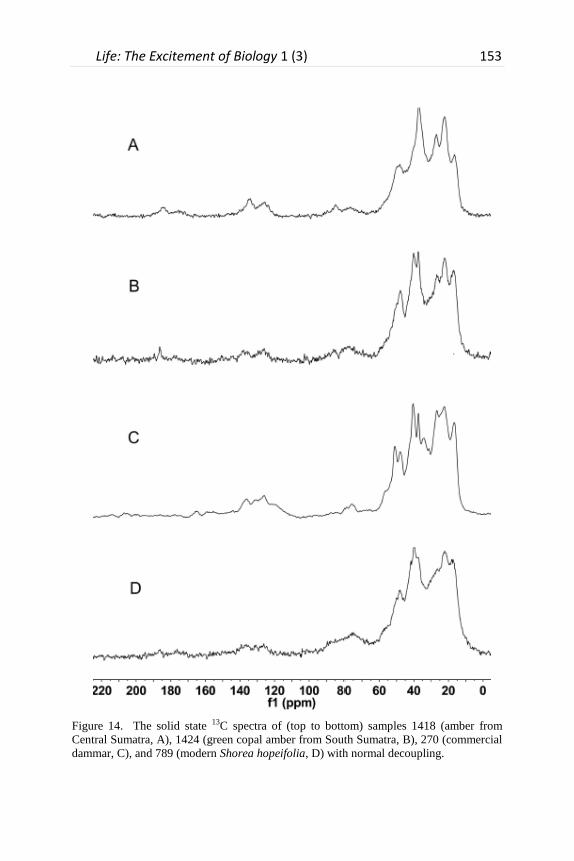
resemble the spectra of green copal but with greater spectral complexity. The
spectral series (Figures 2, 5, 8, and 11 for 13
C spectra and Figures 3, 6, 9, and 12
for 1D 1H spectra) exhibit a continuity that can be attributed to the maturation or
degradation process from the present to the Miocene period, as illustrated in
Figure 14 for the 13
C spectra with normal decoupling. This continuity provides
Life: The Excitement of Biology 1 (3) 153
Figure 14. The solid state 13C spectra of (top to bottom) samples 1418 (amber from
Central Sumatra, A), 1424 (green copal amber from South Sumatra, B), 270 (commercial
dammar, C), and 789 (modern Shorea hopeifolia, D) with normal decoupling.

154 Life: The Excitement of Biology 1 (3)
further support that Indonesian amber came from ancient dipterocarp forests.
The similarity of the spectra from several modern Dipterocarpaceae genera
(Dipterocarpus, Hopea, Shorea, Vateria, and Vatica) (Lambert et al. 2013)
prevents further designation based on genus. The presence of Group B ambers
in North America implies that similar, now-extinct species related to the
Dipterocarpaceae existed in the Northern Hemisphere during the general time of
the Lower Eocene.
Literature Cited
Anderson, K. B. and J. C. Crelling (Editors). 1995. Amber, Resinite, and Fossil Resins. ACS Symposium Series. No. 617. American Chemical Society. Washington, District of Columbia,
USA. 297 pp.
Anderson, K. B and J. V. Muntean. 2000. The nature and fate of natural resins in the geosphere. Part X. Structural characteristics of the macromolecular constituents of modern Dammar resin
and Class II ambers. Geochemical Transactions 1(March). http://dx.doi.org/10.1186/1467-
4866-1-1 Anderson, K. B. and R. E. Winans. 1991. Nature and fate of natural resins in the geosphere. I.
Evaluation of pyrolysis-gas chromatography mass spectrometry for the analysis of natural
resins and resinites. Analytical Chemistry 63:2901-2908. http://dx.doi.org/10.1021/ac00024a019 Beck, C. W. 1986. Spectroscopic investigations of amber. Applied Spectroscopy 22: 57-110.
http://dx.doi.org/10.1080/05704928608060438
Brackman, W., K. Spaargaren, J. P. C. M. Van Dongen, P. A. Couperus, and F. Bakker. 1984. Origin and structure of the fossil resin from an Indonesian Miocene coal. Geochimica
Cosmochimica Acta 48:2483-2487. http://dx.doi.org/10.1016/0016-7037(84)90299-0
Fraquet, H. 1987. Amber. Butterworths. London, England, United Kingdom. 176 pp. Grimaldi, D. A. 2003. Amber: Window to the Past. Harry N. Abrams. New York, NY, USA. 216
pp.
Lambert, J. B. and J. S. Frye. 1982, Carbon functionalities in amber. Science 217: 55-57. http://dx.doi.org/10.1126/science.217.4554.55
Lambert, J. B., J. S. Frye, and G. O. Poinar. 1990. Analysis of North American amber by carbon-13
NMR spectroscopy. Geoarchaeology 5: 43-52. http://dx.doi.org/10.1002/gea.3340050105 Lambert, J. B., S. C. Johnson, G. O. Poinar, Jr., and J. S. Frye. 1993. Recent and fossil resins from
New Zealand and Australia. Geoarchaeology 8:141-155. http://dx.doi.org/10.1002/gea.3340080206
Lambert, J. B., S. C. Johnson, and G. O. Poinar, Jr. 1995. Resin from Africa and South America: criteria for distinguishing between fossilized and recent resin based on NMR spectroscopy. pp.
193-202. In, Anderson, K. B., and J. C. Crelling (Editors). Amber, Resinite, and Fossil Resins.
ACS Symposium Series No. 617. American Chemical Society, Washington, District of Columbia, USA. 297 pp.
Lambert, J. B., Y. Wu, and J. A. Santiago-Blay. 2005. Taxonomic Relationships Revealed by
Nuclear Magnetic Resonance Spectroscopy of Plant Resins and Gums. Journal of Natural Products 68:635-648. http://dx.doi.org/10.1021/np050005f
Lambert, J. B., J. A. Santiago-Blay, and K. B. Anderson. 2008. Chemical signatures of fossilized
resins and recent plant exudates. Angewandte Chemie, International Edition 47:9608-9616.
http://dx.doi.org/10.1002/anie.200705973
Lambert, J. B., C. Y.-h. Tsai, M. C. Shah, A. E. Hurtley, and J. A. Santiago-Blay. 2012.
Distinguishing amber classes by proton magnetic resonance spectroscopy. Archaeometry 54: 332-348. http://dx.doi.org/10.1111/j.1475-4754.2011.00625.x
Lambert, J. B., E. W. Donnelly, E. A. Heckenbach, C. L. Johnson, M. A. Kozminski, Y. Wu, and J.
A. Santiago-Blay. 2013. Molecular classification of the natural exudates of the rosids. Phytochemistry 94:171-183. http://dx.doi.org/10.1016/j.phytochem.2013.06.013
Langenheim, J. H. 2003. Plant Resins. Timber Press. Portland, Oregon, USA. 586 pp.
Life: The Excitement of Biology 1 (3) 155
Mills, J. S., and R. White. 1994. The Organic Chemistry of Museum Objects. Second Edition.
Butterworth-Heinemann, Oxford, UK. 206 pp. Nassau, K. 1983. The Physics and Chemistry of Color: The Fifteen Causes of Color. Wiley, New
York, USA. 454 pp.
Nussinovich, A. 2010. Plant Gum Exudates of the World: Sources, Distribution, Properties, and Applications. CRC Press, Boca Raton, Louisiana, USA. 401 pp.
Poinar, G. E., and R. Poinar, 1994. The Quest for Life in Amber. Helix Addison Wesley. Reading,
Massachusetts, USA. 219 pp. Rice, P. C. 2006. Amber: The Golden Gem of the Ages. Fourth Edition. AuthorHouse
Bloomington, Indiana, USA. 289 pp.
Stout, S. A. 1995. Resin-derived hydrocarbons in fresh and fossil Dammar resins and Miocene rocks and oils in the Mahakam Delta, Indonesia. pp. 42-75. In, Anderson, K. B., and J. C.
Crelling (Editors). Amber, Resinite, and Fossil Resins. ACS Symposium Series No. 617.
American Chemical Society. Washington, District of Columbia, USA. 297 pp. van Aarssen, B. G. K., H. C. Cox, P. Hoogendoorn, and J. W. de Leeuw. 1990. A cadinene
biopolymer in fossil and extant Dammar resins as a source for cadinanes and bicadinanes in
crude oils from South-East Asia. Geochimica Cosmochimica Acta 54:3021-3031. http://dx.doi.org/10.1016/0016-7037(90)90119-6