number e-c200 august 2015 - transportation research...
TRANSCRIPT
T R A N S P O R T A T I O N R E S E A R C H
Number E-C200 August 2015
Transportation Asset Management from
Plans to PracticeA Workshop for State Practitioners
May 31, 2015Denver, Colorado

TRANSPORTATION RESEARCH BOARD 2015 EXECUTIVE COMMITTEE OFFICERS Chair: Daniel Sperling, Professor of Civil Engineering and Environmental Science and Policy;
Director, Institute of Transportation Studies, University of California, Davis Vice Chair: James M. Crites, Executive Vice President of Operations, Dallas–Fort Worth
International Airport, Texas Division Chair for NRC Oversight: Susan Hanson, Distinguished University Professor
Emerita, School of Geography, Clark University, Worcester, Massachusetts Executive Director: Neil J. Pedersen, Transportation Research Board TRANSPORTATION RESEARCH BOARD 2014–2015 TECHNICAL ACTIVITIES COUNCIL Chair: Daniel S. Turner, Emeritus Professor of Civil Engineering, University of Alabama,
Tuscaloosa Technical Activities Director: Ann M. Brach, Transportation Research Board Peter M. Briglia, Jr., Consultant, Seattle, Washington, Operations and Preservation Group
Chair Alison Jane Conway, Assistant Professor, Department of Civil Engineering, City College of
New York, New York, Young Members Council Chair Mary Ellen Eagan, President and CEO, Harris Miller Miller and Hanson, Inc., Burlington,
Massachusetts, Aviation Group Chair Barbara A. Ivanov, Director, Freight Systems, Washington State Department of Transportation,
Olympia, Freight Systems Group Chair Paul P. Jovanis, Professor, Pennsylvania State University, University Park, Safety and Systems
Users Group Chair D. Lane, Associate Principal Research Scientist, Virginia Center for Transportation Innovation
and Research, Design and Construction Group Chair Hyun-A C. Park, President, Spy Pond Partners, LLC, Arlington, Massachusetts, Policy and
Organization Group Chair Harold R. (Skip) Paul, Director, Louisiana Transportation Research Center, Louisiana
Department of Transportation and Development, Baton Rouge, State DOT Representative Ram M. Pendyala, Frederick R. Dickerson Chair and Professor of Transportation, Georgia
Institute of Technology, Planning and Environment Group Chair Stephen M. Popkin, Director, Safety Management and Human Factors, Office of the Assistant
Secretary of Transportation for Research and Technology, Volpe National Transportation Systems Center, Cambridge, Massachusetts, Rail Group Chair
Robert Shea, Senior Deputy Chief Counsel, Pennsylvania Department of Transportation, Legal Resources Group Chair
Eric Shen, Director of Transportation Planning, Port of Long Beach, Marine Group Chair David C. Wilcock, Vice President and National Practice Leader for Rail and Transit, Michael
Baker, Jr., Inc., Norwood, Massachusetts, Public Transportation Group Chair

TRANSPORTATION RESEARCH CIRCULAR E-C200
Transportation Asset Management from Plans to Practice A Workshop for State Practitioners
May 31, 2015 Denver, Colorado
Organized by Transportation Research Board
In conjunction with the
5th International Transportation Systems Performance Measurement and Data Conference
June 1–2, 2015
August 2015
Transportation Research Board 500 Fifth Street, NW
Washington, D.C. www.TRB.org

Lea Camarda, Production Editor; Jennifer Correro, Proofreading; Jennifer J. Weeks, Layout
TRANSPORTATION RESEARCH CIRCULAR E-C200 The Transportation Research Board is one of seven programs of the National Academies of Sciences, Engineering, and Medicine. The mission of the Transportation Research Board is to provide leadership in transportation innovation and progress through research and information exchange, conducted within a setting that is objective, interdisciplinary, and multimodal. The Transportation Research Board is distributing this E-Circular to make the information contained herein available for use by individual practitioners in state and local transportation agencies, researchers in academic institutions, and other members of the transportation research community. The information in this circular was taken directly from the submission of the authors. This document is not a report of the National Academies of Sciences, Engineering, and Medicine.
Transportation Asset Management from Plans to Practice
Workshop Planning Team
Kathryn A. Zimmerman, Chair
Brad W. Allen Stephen J. Gaj
Matthew H. Hardy
Matthew Haubrich Jean Nehme Mark Nelson James Pappas
Hyun-A Park Michael Bridges Andrew Lemer
TRB Staff Thomas M. Palmerlee, Associate Division Director, Data and Information Technology
Mai Q. Le, Senior Program Associate
Transportation Research Board 500 Fifth Street NW Washington, D.C.
www.TRB.org

i
Contents Introduction ................................................................................................................................... 1 Michael Bridges Workshop Format ......................................................................................................................... 3 Developing a Transportation Asset Management Plan ............................................................. 4 Katie Zimmerman and Hyun-A Park Risk Management ......................................................................................................................... 9 Andrew Lemer and Max Grogg Keynote Address Communication and Leadership in Transportation Asset Management Programs ............ 16 Mike Lewis Obtaining Buy-In and Engagement .......................................................................................... 17 Jean Nehme and Butch Wlaschin Roles and Responsibilities and Skills ........................................................................................ 19 Brad Allen and Scott Richrath Leadership and Communications .............................................................................................. 21 Hyun-A Park and David Shrank Wrap-Up Session ......................................................................................................................... 23 Katie Zimmerman Appendixes A. Potential Research Needs Statements .................................................................................. 26
Assessing the Viability of Asset Management Implementation in a Transportation Agency ............................................................................................... 26
An Assessment of the Impact of Sampling Approaches and Survey Frequency on Pavement Condition Results ........................................................................................ 28
Transportation Asset Management Communication for Executives ...................................... 34 B. Fall 2014 State Department of Transportation
Transportation Asset Management Survey ......................................................................... 38


1
Introduction
MICHAEL BRIDGES Louisiana Department of Transportation and Development (Retired)
ransportation asset management (TAM) in state departments of transportation (DOTs)—or in other transportation agencies as well—refers to a strategic and systematic process of
operating, maintaining, and improving physical assets, with a focus on both engineering and economic analyses based on quality information. The goal of TAM is to identify a structured sequence of maintenance, preservation, repair, rehabilitation, and replacement actions that will achieve and sustain a desired state of good repair—at minimum practicable cost over the life of the assets.
Formalized TAM began in the 1980s, when a few agencies used pavement and bridge management systems. The following decade saw the approval of federal transportation legislation—the Intermodal Surface Transportation Efficiency Act (ISTEA)—for which six TAM systems were required. At this time, FHWA created the Office of Asset Management and AASHTO created the Subcommittee on Asset Management.
Interest in TAM began to grow as agencies struggled with growing needs and limited resources. The 2000s brought a greater use of bridge and pavement management systems and greater use of TAM principles in everyday agency activities. Some states established policies that linked decisions to performance measures and good data; others implemented enterprise TAM software systems. In 2011, AASHTO published its Transportation Asset Management Guide: A Focus on Implementation, and in 2012, the Moving Ahead for Progress in the 21st Century Act (MAP-21) passed with requirements that state DOTs develop risk-based TAM plans for pavements and bridges in the National Highway System (NHS).
The number of states using TAM policies and procedures has grown steadily over the years, as has the interest in TAM by DOTs at meetings and conferences. When the AASHTO TAM Subcommittee was established in the early 2000s, many committees saw sparse meeting attendance—mostly just the committee members themselves. But once MAP-21 was passed, committee meeting rooms filled to capacity. The requirement to implement a formal TAM system captured the attention of state DOTs, metropolitan planning organizations (MPOs), transit agencies, and consultants.
The 2006 TAM conference attracted approximately 250 attendees; 468 participants from all 50 states attended the 2014 TAM conference. Sessions have ranged from “Putting the TAM Pieces Together” (2009) to “Peer-to-Peer: Detailed Looks at MAP-21 Pilot States” (2014).
As TAM leaders become more sophisticated, so does their need for knowledge and help from their peers at other transportation agencies. This is especially true in light of the ongoing TAM rulemaking process for MAP-21. The comment period for the rulemaking ended on the date of this workshop, May 31, 2015; the timing was fortuitous as it brought together many DOT representatives with questions and concerns about the proposed MAP-21 TAM plan rule. As state DOTs become increasingly aware that MAP-21 will likely require the reprioritization of resources to support TAM efforts, they look to their neighbors for best practices. Peer exchanges such as this workshop are an ideal way to initiate that state-to-state sharing.
T

2 Circular E-C200: Transportation Asset Management from Plans to Practice
The views contained in this e-circular are those of individual workshop participants and do not necessarily represent the views of all participants; the planning team; the sponsoring committees; the National Academies of Sciences, Engineering, and Medicine; or the Transportation Research Board.

3
Workshop Format
his workshop is one of many over the years that has helped DOTs advance the state of the practice and has provided a venue to exchange knowledge, ideas, experiences, and best
practices. More than 75 participants representing 34 states, two transit agencies, academic institutions, and the FHWA attended the 1-day workshop held on May 31, 2015, in Denver, Colorado. The topics for the workshop were selected based on the results of the pre-workshop survey of the state DOTs. The summary of that survey is included in Appendix B.
The workshop program included ample opportunities for small-group discussions on such topics as TAM plans (TAMPs), risk management, and organizational alignment. This format encouraged the exchange of information among peers and practitioners, as well as the identification of issues and challenges. That information is captured in this e-circular.
The agenda for the workshop follows: 8:00–8:30 a.m. Introduction 8:30–10:00 a.m. Developing a TAMP
Breakout Groups 10:30 a.m.–Noon Risk Management
Panel Discussion 1:00–4:25 p.m. Organizational Alignment
Keynote Speaker Breakout Groups: obtaining buy-in and engagement; roles, responsibilities, and needed skills; leadership and communication
4:40–5:30 p.m. Wrap-Up and Next Steps
T

4
Developing a Transportation Asset Management Plan
KATIE ZIMMERMAN Applied Pavement Technology, Presider
HYUN-A PARK
Spy Pond Partners, Recorder
n this session, the participants were organized into small groups of eight to 10 people. The following questions were distributed among the groups, with each being assigned one question
to discuss and report back on.
1. How is your TAMP development and implementation influenced by your organizational structure?
2. What one or two noteworthy lessons have you learned during the TAMP development process?
3. If the final rule were to pass as drafted in the NPRM (Notice of Proposed Rulemaking), what element of the rules would have the greatest impact on your draft TAMP and how would you address this? If you have not started work on your TAMP, what element of the draft rules are the greatest concern and why?
Though the prepared questions stimulated discussion among the participants, the discussions did not track the questions exactly. However, the following key themes did emerge from individual comments made by participants:
• Leadership, organizational alignment, and responsibility for the development and implementation of the TAMP;
• Leadership changes in a DOT; • Communications; • Coordinating with MPOs and locals on non–state-owned NHS assets; • Requirements for other assets classes if included in the TAMP; • The proposed TAMP rule; • The role of the FHWA Division office in the certification or monitoring of the
TAMP; and • Other topics.
LEADERSHIP, ORGANIZATIONAL ALIGNMENT, AND RESPONSIBILITY FOR DEVELOPMENT AND IMPLEMENTATION OF THE TAMP The importance of the role of the “TAM champion” was discussed by a number of individual participants. The TAM champions at state DOTs ranged from the chief executive officer (CEO), the Deputy Secretary, the Chief Engineer, and other administrators. It is desirable to have the TAM champion at the highest level of the organization and as the TAM program matures, the
I
Developing a Transportation Asset Management Plan 5
role of champion is not as important as having staff-level people engaged in TAM. The champion can then leave the program to staff to carry out.
Many DOTs have a TAM steering committee or a working committee comprised of staff-level people from across the organization. This can be important for buy-in and communication.
There is a range of places where the TAMP responsibility resides in DOTs—in operations, planning, in maintenance, or even in its own division. If TAMP responsibility is in planning, the focus may be more on the big picture, which can bring a more global perspective and cover more areas. If it is in operations, it may be more focused on projects. Wherever the responsibility lies for TAMP it can be successful if people from throughout the organization become engaged, and if they communicate and are accountable.
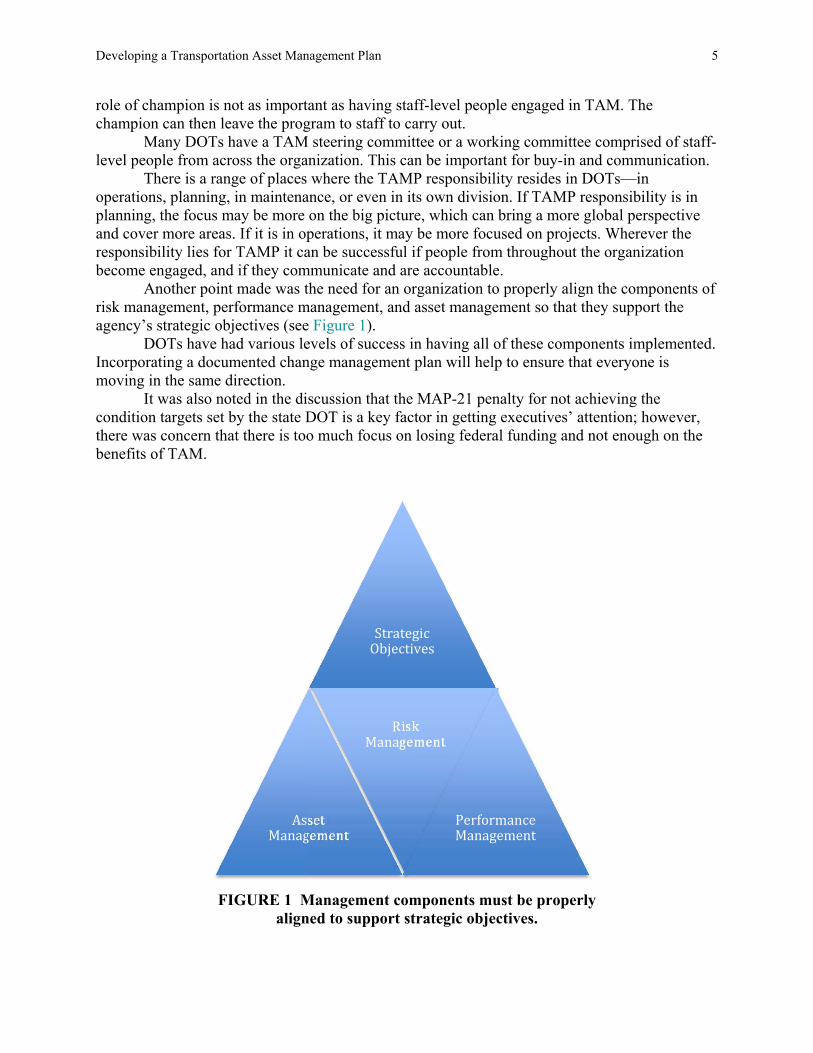
Another point made was the need for an organization to properly align the components of risk management, performance management, and asset management so that they support the agency’s strategic objectives (see Figure 1).
DOTs have had various levels of success in having all of these components implemented. Incorporating a documented change management plan will help to ensure that everyone is moving in the same direction.
It was also noted in the discussion that the MAP-21 penalty for not achieving the condition targets set by the state DOT is a key factor in getting executives’ attention; however, there was concern that there is too much focus on losing federal funding and not enough on the benefits of TAM.
FIGURE 1 Management components must be properly
aligned to support strategic objectives.
Strategic Objectives
Asset Management
Risk ManagementPerformance Management

6 Circular E-C200: Transportation Asset Management from Plans to Practice
Leadership Changes in a Department of Transportation The frequent leadership changes in state DOTs can be a threat to sustaining a TAM initiative. The average “life” of a state DOT CEO or secretary is 2 1/2 years. Many times the CEO change happens with the election of a new governor. In such cases with new leadership, staff may have to seek buy-in from the new leaders for the TAM effort.
More research may be helpful to learn about the practices that state DOTs may use to insulate the TAM program and maintain it through a leadership change. Specifically, such research may focus on the location of the TAM unit within the organization and efforts to educate new leadership on TAM principles. Communications Several participants mentioned challenges to overcoming silos within agencies. Typically TAM processes and functionalities are located in various areas of the typical DOT and one size does not fit all. As such, communication between silos is necessary to coordinate the TAM efforts. For instance, bridge and pavement management systems are sometimes managed in different groups, so it is important for the TAMP to clearly state who is accountable for what and who should drive the TAM effort.
The national TAM performance measures and requirements are causing changes in some DOTs’ organizational structures and are helping to break down silos. The focus on performance targets may impact all state DOT staff, so engagement from all divisions and units in a DOT can be important.
It was also noted by some of the individual participants that it may be helpful for DOTs to engage their public relations staff in developing a plan for communicating the purpose and possible benefits of TAM message to staff and customers. Coordinating with Metropolitan Planning Organizations and Locals on Non–State-Owned NHS Assets Several state DOTs stated that they have no leverage to push MPOs to fund TAM projects on their portions of the NHS system. Usually the locally owned NHS is a small percentage of the overall NHS in a state, so it may not affect the overall condition of the bridges and pavement. States with a significant amount of NHS not in their control have concerns that the MPOs’ inaction could affect their achievement of the condition targets. More clarification could be of assistance in the MAP-21 rules on whether the state DOT could be penalized for not achieving targets and whether the state DOT would be required to spend its share of state and federal funds on local roads.
The DOT representatives discussed how the DOT–MPO engagement process is important and that guidance would be helpful concerning how this engagement will be handled in the TAMP. For instance, there is one state DOT that has considered itself a leader in TAM for years and has a TAM council that represents the DOT, counties, cities, and townships, but its staff now wonder what its council’s role is in taking the MAP-21 TAMP rules forward.
Also, as many MPOs have transit assets, staff at those organizations would find clarification helpful on the interrelationship between the FHWA’s and the FTA’s rules on asset management plans.

Developing a Transportation Asset Management Plan 7
Proposed TAMP Rule Concern was expressed by a few participants about the possible confusion of stakeholders as a result of changing the performance measures for pavements and bridges. One participant said that states have been providing reports to legislatures, stakeholders, and the public based on their own performance metrics; now, they are being directed to use the proposed MAP-21 performance metrics. The sudden change in pavement and bridge condition may lead to confusion.
Participants also discussed possible issues that may arise between bridge and pavement condition performance measures and transportation system performance measures. Further guidance would be helpful on how system performance measures (safety, capacity, freight, emissions) may be included in the TAMP, and on targets for pavement and bridge condition and system performance measures.
A couple of participants brought up pavement condition sampling density. These participants said that further clarification would be helpful on whether they will need to have 100% coverage for the cracking index or just sampling. Some states have invested in robust systems based on representative sampling. Previous methods of collecting data may be helpful to maintain as the information from those methods can inform treatment selection analysis in a pavement management system.
One participant stated that the 10-year financial horizon might lead to a requirement for a 10-year project list. Most, if not all, state DOTs do not maintain a 10-year project list. In general, the list that they do maintain coincides with the timeframe required for their Statewide Transportation Improvement Programs (STIPs). It would be helpful to have clarification on this question.
Some DOTs are waiting until the final rules are issued before they started their TAMPs, while other states have completed their TAMP even though the rules are not finished. Some participants expressed the need for more information as to how to incorporate risk into the TAMP. Most understand the concept of a risk register, but further guidance would be of great assistance. The session on risk management that follows this one should provide some answers.
Additional guidance about how the emergency relief program and the requirement for resilience analysis and programming could be incorporated into the TAMP would also be helpful. Role of FHWA Division Office in the Certification and Monitoring of the Transportation Asset Management Plan Many participants asked about the role of the FHWA Division office in the TAMP certification and monitoring process and how it will be applied. They stated that they were unclear about the FHWA division office’s role and interpretation of the requirements in the final rule and whether all division offices will apply the rule in the same way. Some participants thought that FHWA buy-in throughout the TAMP development process would be important. The participants from a few states indicated that their FHWA division office was involved in writing their TAMP from the start. Steven Gaj, FHWA Director of TAM Division, emphasized that the state DOTs would be well served by including FHWA division offices to the table in the development of their TAMP.

8 Circular E-C200: Transportation Asset Management from Plans to Practice
Other Concerns Some participants commented that there might not be enough money to use the results of true life-cycle cost analysis (LCCA) for the selection of all projects. A combination of preservation projects and projects addressing other needs would be necessary when trying to manage the entire system within a state.
Many DOTs stated that there are various plans that exist in DOTs; these can include a STIP, a long-range transportation plan, and a strategic plan. A better understanding of coordination requirements and integration between the TAMP with existing plans would be helpful.
Another topic that a few participants discussed was on the management of the Interstate and freeway ramps. They stated that guidance on where should these assets be included (pavement or bridge database) would be helpful.
Individual participants discussed the following issues related to research, training, and technology transfer needs and questions:
• Guidance on ways to better insulate the TAM program from leadership changes. • Best practices on organizational alignment to support the TAMP. • How can the agency’s public relations department assist with communication? • How do the different plans within a DOT fit in the TAMP? • Best practices on coordinating with locals on non–state-owned NHS assets. • What is the role of the FHWA in certification and monitoring of the TAMP? • How are Interstate and freeway ramps to be included in the pavement and bridge
databases?

9
Risk Management
ANDREW LEMER Transportation Research Board, Facilitator
MAX GROGG
Federal Highway Administration, Recorder
isk is defined as (a) an event, (b) the probability of that event taking place, and (c) the consequences of that event taking place. Risk includes not only threats, but also
opportunities that present themselves. The issue to be addressed in the TAMP is how risks can prevent or assist in reaching strategic goals.
The format for the Risk Management Session consisted of a facilitator and a panel that included:
• Gordon Proctor, Gordon Proctor and Associates, • Shobna Varna, Starlsis, • Joe Nestler, Wisconsin DOT, and • Greg Slater, Maryland State Highway Department.
The session began with a brief statement from each of the panel members, followed by
questions from the audience. Shobna Varna started by stating that risk management is not about managing the threat; rather, it’s about managing the risk and its consequences so that objectives and performance targets can still be met. She emphasized the importance of considering the long lives of the assets being managed and the risks associated with not achieving the desired life. Risk management is the systematic process of bringing together the policies to identify and manage risks. Greg Slater followed by stating that in Maryland, the risk-management process is begun by asking questions: What could happen? When could it happen? What is the likelihood that it will happen? Why will it happen? They look at asset-based (e.g., engineering-related) risks and programmatic-based (e.g., financial) risks.
Maryland has more than 8,000 mi of coastline so would be well served by working through the risks as they relate to weather events and sea-level rise. Maryland is forced to look at these types of risks, then work through the consequences and develop strategies to mitigate their impact. They first look at the risks associated with the system, then at the risks associated with individual assets (and vice versa). This is a top–down and bottom–up approach to identifying risks. He also noted that risks are not always threats. Financial risks, for instance, can go in either direction. An influx of revenue could be a risk as they may not be able to deliver the program of projects. Thus looking at positive and negative risks is more of a proactive approach to risk management. Joe Nestler noted that the TAM goal in Wisconsin is to provide the safest, most-efficient, and best-condition system that money can buy. Risk management is about identifying and dealing
R
10 Circular E-C200: Transportation Asset Management from Plans to Practice
with risks that get in the way of the goal. There is no coastline in Wisconsin and the state doesn’t have some the weather-related events other state DOTs must deal with. They focus on risks that can be controlled, and those are the only ones included in the TAMP.
He perceives their biggest risk as the selection of the mix of projects. They ask themselves whether the projects are in the right place, whether they are the right scope, and whether they are being done at the right time. In addition, they consider whether they are collecting the right data to support the analytics and whether those analytics are robust enough. Such questions are important because selecting the right projects depends on the data and the analytics. Once Wisconsin goes through the analytics and gets a recommended set of projects, they then have to prioritize because the health of the transportation system depends on it. They fund safety and bridge projects first. Then they fund preservation projects because pavement life is important. Prioritization of pavement preservation projects also considers other factors such as costs of delay, traffic volume, freight movement and other factors. Gordon Proctor completed the panelists’ opening remarks by stating that risk management in the United States is very embryonic and may not mean the same thing to different people. At its simplest form, it may only be a risk register and a few references in the TAMP about how risk in decision making is handled (such as how we address fracture critical bridges, culverts, or other threats to assets). Another level of risk management would be to manage assets to meet strategic performance objectives. The organizational diagram that was presented in the previous session on the TAMP clearly shows that risk management is integral to TAM and performance management. He went on to say that one should think of managing risk as a corollary to managing performance.
Another point Proctor made is that in order to show the benefits of asset and performance management, a longer time frame is needed. Managing for the short-term will likely lead to a worst-first approach, as the benefits of TAM show up in longer timef rames like the 10-year plan. He said that staff can start by putting together a plan of where you want to go in 10 years, then make a reasonable estimate of funding and the conditions that will be achieved. Many risks are beyond a DOT’s control, but in a risk-management plan they must be identified and documented so everyone, including legislators, is aware of the risks that might prevent you from achieving your targets. If it does nothing else but inform everyone that those are the variables that must control in order to meet targets, the risk-based TAMP will be a valuable tool. Further, if staff become engaged in performance, then they will naturally embrace risk management because it will help in achieving performance goals. It can help manage issues that could get in the way of reaching the targets.
Following the opening statements from the four panelists, the floor was opened to questions and comments from the audience. The following is a summary of the questions and panelists’ responses: How often do you revisit the risk register? Varna stated that the frequency is tied to which risk you are trying to manage. If project-based, it might be monthly. For example, when trying to figure out what is preventing a DOT from delivering preservation projects, updating the risk register every month would be a helpful step to take. On the other hand, if the issue is major bridges, then the risk register may be updated

Risk Management 11
annually or biannually, depending upon the inspection cycle. Updating the risk register should be tied to the performance cycle of the risk being measured. It also depends on whether register is being used for operations or strategic planning. Does risk include construction inflation? Proctor replied yes and referred to the FHWA report on risk management that can be found on their website. Monitoring prices would be a great leading indicator and could provide insight on whether performance targets are being met. Depending on the magnitude of inflation and its effect on achieving targets, it may be necessary to monitor futures prices. Bid prices have an effect on project estimates in future years. Rolling up the bids to an average statewide price is problematic due to differences in prices in urban versus rural areas. The average price may not be applicable to the projects in the future plan. How do you account for this in the risk-management plan? Varna stated that the TAMP financial plan is a 10-year plan. When using this financial plan, staff should project the condition that they want and the funding that will be available over that period. In addition, the funding needed to achieve condition targets should be projected as staff will likely be making assumptions over that 10-year period, including ones about construction costs and inflation. The level of detail is greater in the first few years and less in future years. Risk management is all about documentation and continual monitoring, with staff revisiting the plan at an appropriate frequency. Projects that can be done with available funding will change, as will priorities. At each level (agency, program, or project) there will likely have to be different strategies for managing risk. It is therefore necessary to keep in mind that risks at high levels can trickle down to the lower level if not managed effectively, thereby underscoring the need to develop a strategy for monitoring risks in the risk-management plan in agencies’ TAMP.
Nestler added that the issue of cost estimation for urban versus rural projects is real, but in Wisconsin they have only one process for estimation. Having only one process means that staff need to be able to manage this type of risk at all levels. He also noted that risks never go away as it seems like the risk register and documentation needed to maintain it keeps growing. Good data driven by mature performance measures will likely help manage risk.
Slater said that regarding construction inflation risks, in 2012–2013 Maryland DOT did a 10-year analysis as part of a report to the legislature on what funding was needed to maintain system condition. A study done by an outside consultant predicted inflation over that 10-year period would climb to 4.5%, taper off to 2%, then gradually decline to the high 1% range. They reduced the projected budget to account for the loss of purchasing power and reran the analysis. The resulting effect on the delivery of the program to support the condition of the system was not impacted by the loss of purchasing power.

12 Circular E-C200: Transportation Asset Management from Plans to Practice
Michigan DOT commented that they first did a lot of easy preservation projects at low cost to improve conditions. Now the projects that are left are the more expensive projects. They are not expecting new revenue and are faced with not only system condition decline, but also really big projects. Proctor pointed out that this risk was not acute 5 years ago. Now it is. The risk discussion fits into the budget discussion and the TAM plan.
One state DOT representative shared that his DOT had a revenue increase. When the increase took place there was a lot of talk about where it should be spent, but his DOT staff did not want to have a discussion on structurally deficient bridges, for example, in front of the legislature and risk them using the increased revenue on bridges alone. Instead, they wanted to spread the funding over all assets so they made the decisions themselves using sound TAM practices.
Slater commented that Maryland did an analysis and found that simple overlays had the lowest life-cycle cost. The DOT districts in the state wanted to rubbleize and overlay, so they requested lots of money, which the department did not have. After 4 years of requiring the districts to look at lower-cost overlays, the TAM staff were able to prove to the districts that the overlays had a lower life-cycle cost than the rubbleize and overlay process did.
Should the DOT spend time determining the probability of what will happen if an event occurs? Varna responded by stating that the reality is that most DOTs don’t have the data to do a probability analysis. They can use the data they have, but they must use good engineering judgment, too. Typically, DOTs look at the assets and use engineering judgment to rate the risks as low, medium, and high in a matrix or heat map. Then they look at the big picture and develop strategies to deal with assets that are in the high-risk area of the matrix. In the end, everyone should have the same understanding of how the occurrence probability of the risks is calculated. They can then come up with strategies to mitigate them and to determine the agency tolerance to them. Staff should focus their energies on those risks and continually monitor to see where the risks fit in the big picture. Mitigating risks comes down to allocation of limited resources, and that is where engineering judgment comes into play.
Slater agreed that risks should be looked at broadly. At the end of the day, either side of the case could be argued. With roadway flooding, for example, Maryland looks at where the flood will be, then feeds information on the flooding location into a highway vulnerability index. This index uses an algorithm that considers flooding, traffic volume, detour length, etc., to determine the effect of the flooding. Still, in the end, good engineering judgment is needed to determine how best to deal with it. It’s also important to question when risk should be addressed. Sea-level rise may not occur until many years in the future so the question arises of whether it is good strategy to spend funding on it now.
Proctor mentioned that he was a member of a NCHRP international scan team on risk management in 2012. After meeting with TAM professionals in several countries, he came back with the conclusion that it is necessary to keep risk management simple by not spending a great amount of time on managing your software; rather, time should be spent on managing risk.

Risk Management 13
Regarding the MPO–local plan versus the DOT TAMP, do the risks applicable to the locally owned NHS need to be included in the DOT plan? Nestler responded that typically, if they don’t own the asset, they can’t control the asset condition and thus don’t include it in the TAMP. The locals should be good stewards of their assets.
Slater said yes, risks applicable to the locally owned NHS need to be included in the DOT plan and used Baltimore as an example. The city owns a significant amount of the NHS. The risk related to these assets will have a significant effect on the overall NHS in the state. However, Baltimore may not want to spend its own funds when it’s a DOT’s responsibility to report on the condition performance measures. The risk is about how to deal with the condition of assets that the DOT does not own and consider how those assets may impact the state program.
Steve Gaj with FHWA mentioned that the issue of non–state-owned NHS included in the state DOT TAMP has been a challenge since day one. He stated that it’s all about the relationship between the DOT and the MPO. Sometimes a risk perceived by the MPO and one perceived by the state DOT may not align. It is best to include the FHWA Division office in the discussion. People want to see a magic formula, but there is none. If the local NHS has a high economic impact, then the state DOT needs to have coordination with the MPO. Is it also important to keep in mind that MAP-21 is focused on the entire NHS. Louisiana Department of Transportation and Development indicated that their gap analysis revealed that what enabled them to meet their goals for the system condition was the increased funding level over the previous 10 years from state budget surpluses, American Recovery and Reinvestment Act of 2009 (ARRA), and bonds—not from the regular federal or state funding. There is a risk of assuming you have enough steady-state funding to meet your pavement and bridge condition goals when in fact the extra money was the reason that you met your goals. The point is there are risks out that that you don’t know until you analyze the data in several different ways. Proctor noted that the financial plan in the TAMP helps identify the risks for future funding. These risks should show up in the risk register. Many states have been depending on ARRA grants and bonds, which may not be there in the future. The past extra funding should show up in the financial plan and the risk-management plan. A comparison of past and current revenue streams should be part of the financial analysis. What about target-setting? Varna stated that it is necessary to have a comprehensive discussion on pavement and bridge condition target-setting within the agency and ask what can be achieved and how it can be achieved. It would be helpful for agency staff to consider their financial plans and your revenue predictions. Higher performance targets equal higher risks; it will therefore be necessary for an agency to manage its assets closely. It is also important to list assumptions regarding target-setting clearly. No one internationally or in the United States has enough funding to do everything that must be done to maintain and operate their transportation systems. Their TAMPs list all assumptions and the targets are tied to the financial plan. Varna concluded by saying that in other words, tie the targets to the funding expectations and list all the risks. Clearly, it is necessary to communicate with external stakeholders.

14 Circular E-C200: Transportation Asset Management from Plans to Practice
Francine Shaw-Whitson with FHWA commented that state DOTs have complete control over targets. She said that it’s about tolerance: if staff have a low tolerance and want to keep a steady state, the target can reflect that. Katie Zimmerman with Applied Pavement Technology asked what executives need to know to start a discussion on risk management, what are the changes needed to make to get from the basic to the more advanced strategies in risk management, and what is needed to know about the necessary data? Slater said that it is necessary to qualify data accuracy when responding to executives. Executives assume that the data are 100% accurate. They also want to know if the risk is one they can live with.
Nestler added that executives want to know what can be done if an event, such as weather-related events or a funding-related events, happen. For example, in the case of a funding-related event, the executive would want to know if projects can be excluded or if the legislature must approve additional funding. The executive may also ask what projects could be done if extra money is approved.
Proctor said that if an agency is serious about performance management, then adding risk management is a simple step. Risks to performance are easily identified. If the agency is not focused on performance management, then maybe the risk-management process is not necessary.
Varna pointed out that it is her experience that many overseas countries that have good performance-management systems naturally have good risk management. For agencies that formally and successfully manage risk, integrating risk management into performance management seems to minimize overall risk. South Dakota DOT asked the panelists what they put in their TAMPs about risk and how much detail they included. Slater stated that the Maryland DOT is still working on its TAMP. He anticipates that DOT staff will include formal documentation on how they incorporate risk in their decision-making process.
Nestler said that the Wisconsin DOT is just starting to write their TAMP. In doing so, they will explain what they do now and what they are going to do in the future regarding risk management. In addition, DOT staff will include a discussion on their program effectiveness measures and the risks to achieving their targets. Their secretary of transportation testifies before the legislature about their transportation program effectiveness every year, so it’s important to lay out the risks. The TAMP will explain how they do TAM in the Wisconsin DOT and will include a discussion on what they will do if they do not have sufficient funding. Overall, the TAMP risk-management section will explain good business practices and will start with pavement and bridge data, collection methods, and how to use the data to develop recommendations.

Risk Management 15
One state asked about the new pavement condition performance measures and how they will cause changes to the way projects are selected. Nestler commended the proposed rules will use other pavement distress data in addition to using the International Roughness Index (IRI) in the pavement condition analysis and performance targets. However, Wisconsin DOT can’t develop their program of projects from only this rudimentary data; they use more factors. It might be better for the health of the state transportation system if they take the penalty in MAP-21 for not achieving condition performance targets rather than changing the data and measures already in use. They may also determine that they have to let the NHS get rougher because of other system needs. This is something that they will have to evaluate when the final rules come out.
Slater expressed concern that the rules may push DOTs toward a worst first approach on bridges. In Maryland, they look at bridges that are on the brink of becoming structurally deficient instead of just the ones that are already structurally deficient.
In concluding this session, Andrew Lemer pointed out that there was a recent article in the Washington Post on the need for dollars for transportation. He asked the group to consider the risks associated with Congress passing a transportation bill in the coming months and whether they would be able to deliver the projects if there is an increased in funding.

16
KEYNOTE ADDRESS
Communication and Leadership in Transportation Asset Management Programs
MIKE LEWIS
Deputy Executive Director, Colorado Department of Transportation Former Secretary, Rhode Island Department of Transportation
Former President, AASHTO
ewis’s address was about communication and leadership as it relates to TAM programs. He stated that sometimes, there is too much focus on details, which makes it difficult for asset
managers to translate the ideas to management. He said that leaders need to take information, package it effectively for the audience, and share with legislators, the public, and stakeholders.
Lewis posed the question of how leaders can obtain buy-in for their TAM programs from those at all levels in their organizations. Leaders need to think about how they communicate and they need to realize that road and bridge maintenance staff may think differently than those in the transportation planning section, so the message should be tailored to the audience. It is important to get buy-in, but there is a risk to following blindly. The team needs to do a “sanity check” occasionally and ask if the plan is going the way that they think it should.
Lewis then spoke about the different types of leadership. He has worked with leaders in the past who have exhibited the two ends of the spectrum of leadership styles: authoritarian leaders who rule by fear and intimidation versus leaders who empathize and inspire. He also commented on change in DOT leadership. The average tenure of a DOT CEO is approximately 2 1/2 years. Leadership turnover can be demoralizing to staff when the new leader makes changes just for change’s sake. He commented that the shift to an asset and performance management culture is here to stay.
Finally, Lewis stated that in 100 years people may very well look back and realize that the emphasis on TAM principles brought on by MAP-21 changed—for the better—the way that the U.S. transportation network is managed.
L

17
Obtaining Buy-In and Engagement
JEAN NEHME Arizona Department of Transportation, Facilitator
BUTCH WLASCHIN
Consultant, Recorder
hese two sessions were attended by three groups of eight to 10 people and covered how agencies can obtain buy-in and engagement within the DOT for TAM. Three scenarios were
posed to the groups. A summary of the individual participants’ discussion follows. Scenario No. 1. How do you convince data owners to share their data with other groups within an agency? Some of the participants thought that there will most likely be resistance to giving up control of data because information is power. One strategy to get cooperation is to obtain support from senior management and invite the person that maintains the data to be a member of the TAM steering committee. He or she can then be shown the benefits of sharing the data.
Other participants said that some of the main issues that could inhibit the sharing of data are the loss of control over the data. Data owners may be concerned about its possible misinterpretation or misuse and about the lack of control over collection and analysis. Further, there may be additional work required to reformat and translate the data to make it compatible with the multiple information technology (IT) platforms within an agency. A potential solution would be to move toward greater automation and the use of better tools for the IT group, the user, and the field personnel. Additionally, one participant noted that as the workforce changes through retirements, the younger generation might be more receptive to data consolidation and sharing.
When trying to facilitate the sharing of data in an agency, it is crucial to fully explain to the data owners the benefits of sharing and how the data will be used, as noted by some participants. Duplicate datasets that are not consistent can lead to data errors and inconsistency, and then to inaccurate reports. Centralized data governance helps provide consistent and accurate data through quality assurance–quality control processes. Centralized reports and dashboards provide information for decision makers while easing the time required preparing the reports. Scenario No. 2. What are the barriers to divisions within a DOT (such as planning, maintenance, and districts) working with one another? A few participants began the discussion by saying that a barrier to effectively working across divisions can be the perceived lack of buy-in at the lowest and highest levels. Unrealistic expectations of the data by users could also lead to problems. If there is no effort to determine how the data will be used up front, the data collected may not be tailored to the users.
Sometimes, the obstacles to working across divisions come down to a lack of resources (personnel and equipment) or a lack of understanding of each division’s core mission. Some strategies that have worked to overcome these obstacles include the parties being willing to
T

18 Circular E-C200: Transportation Asset Management from Plans to Practice
contribute their own staff and resources; and a willingness to collaborate, cooperate, and coordinate on common goals.
One participant was noted that working across divisions might result in increased funding for IT systems due to collaboration and the sharing of information and resources. Integration of systems across divisions would allow data to be shared or used by other areas, resulting in improved communication, regulatory reporting, and decision making. It may also reduce the strain on the IT unit by supporting technology projects that cross into multiple areas.
Discussions between divisions can reach agreement by having the counterparties understand each other’s respective obstacles and resources, as noted by a few participants. Agreement about the benefits of increased efficiency through reducing duplicated efforts will also encourage buy-in.
Some participants said that TAM and performance management may be perceived as a threat leading to loss of funding. For instance, the bridge management unit may lose funding to the pavement management unit as a result of the agency’s need to achieve their performance targets. To facilitate working across divisions, senior leadership needs to buy in to TAM and performance management, and then communicate the agency’s perspective about the importance of meeting performance targets. There could also be incentives for divisions to work together, such as increased funding for specific initiatives.
While a few other participants noted that other potential barriers to working across divisions include competing priorities, competing resources, and a lack of buy-in on the performance measure targets, strong leadership that communicates the goals of the agency is needed in order to facilitate cooperation between divisions. Scenario No. 3. How do you convince management to fund a TAM initiative at a DOT? Some participants noted that it is important to clearly communicate the objectives and scope of the TAM initiative. For instance, the asset classes to be included, funding needs for the initiative, prioritization methodology, etc., needs to be stated. The benefits, which can include improving the accuracy an agency’s asset database, knowing the cost of operations and maintenance, becoming familiar with the extent to which a state of good repair is being achieved for the network and whether the agency’s return on investment is maximized should also be stated.
A couple of participants thought that the fear of the unknown is probably the greatest barrier to initiating a TAM system within an agency. There is always limited funding for the resources that will need to go into the TAM effort. It is hard to see the benefits of the endeavor up front and groups within the organization may feel that they will lose some control. There needs to be executive-level prioritization of the effort in order to provide adequate resources for the initiative. A third-party consultant with TAM expertise could be used for a pilot or proof of concept. This could build support within the agency.
19
Roles and Responsibilities and Skills
BRAD ALLEN New York State Department of Transportation, Facilitator
SCOTT RICHRATH
Spy Pond Partners, Recorder
wo groups of eight to 10 people worked through an exercise to examine state DOT organization charts, roles, and responsibilities related to TAM.
The groups reviewed state DOT organizational charts to find consistencies among location, size, authority, or structure of TAM units. Some group participants said that while all organizational charts vary, common elements exist. These participants went on to say that most agencies cited the importance of having an engaged steering committee that did not entirely change due to administration turnover. Agencies that had recent turnover at the executive level had to work even harder to maintain direction at the staff level.
Some of the discussion by individual participants centered on the incorporation of TAM with other emerging initiatives, such as process improvement and knowledge management. It is important to have a staff willing to embrace change in a government organization to help ensure success of new programs. A few participants noted that agencies that have woven change management or process improvement into their cultures may enjoy greater acceptance of the shift toward data-driven decision making that comes with effective TAM. And with improved data-driven decision making comes the need for improved data management and strengthened knowledge transfer. Building stability may involve improving skill sets and demonstrating the benefits of dedicating sustained resources to TAM.
Further discussion from this session is as follows:
• What commonality did we see among organization charts? − TAM unit–responsibility gravitated toward the Planning Division; − Every organization can be structured differently and still be successful; − Cultural structure may be more important than the organizational structure; and − Organizational structure may need to include representation from MPOs if off-
system NHS is significant. • What has the key role been for ensuring implementation and why?
− Executive champion, steering committee, and project coordinator who can provide vision for TAM and know how to implement it;
− A lower-level person can coordinate but he or she needs to report to someone high in the organization; and
− Some TAM efforts relied on executive sponsorship and some on grassroots development, while others originated in operations. • What roles are critical to further implementation and why? Is that role being filled or not?
− Greater communication is necessary throughout the organization; − Going forward, implementers must have accountability for the TAMP;
T

20 Circular E-C200: Transportation Asset Management from Plans to Practice
− It is important that change management be identified on the organization chart as its own group;
− Champions must drive changes in the organization that can support sustainability; and
− Executive support and public relations remain critical to further implementation. • Suggestions for further study:
− Find examples in state DOTs of successful TAM initiatives across multiple administrations;
− Best practices for successful implementation of TAM in districts, in operations, and in the project selection division;
− How to build the business case for TAM in an organization; − Synthesis of state DOTs on TAM staffing levels; − Work with AASHTO to clarify that the TAM subcommittee coordinates TAM
activities, but TAM impacts other committees as well; − Determine the right resources and skills for implementation of TAM; − Case studies on universal elements and capabilities of successful structures such
as the TAM champion; − Determine how to incorporate knowledge management and ensure retention of
key ideas; − Determine how to incorporate process improvement into TAM; and − Examine what has been successful in sustaining TAM long-term.

21
Leadership and Communications
HYUN-A PARK Spy Pond Partners, Facilitator
DAVID SHRANK
Texas Transportation Institute, Recorder
hese two sessions consisted of groups of eight to 10 people. The participants discussed TAM challenges, leadership needs for successful TAM culture, and research needs in the areas of
TAM leadership and communications. Below is the content of participants’ discussions. Some participants said that frequent changes in DOT leadership can be a significant
barrier to successful TAM implementation. The average tenure of a DOT CEO is 2 1/2 years, according to records kept by AASHTO. The frequent turnover not only at the CEO level but also at top leadership positions within DOTs can set back the TAM efforts because new leaders must be brought up to speed with the TAM initiatives. Changes in leadership make it difficult to maintain consistent champions for TAM.
Other participants thought that the agency has to make its employees recognize that they all have a role in TAM, which will help to smooth the transition when new leadership arrives. Due to the nature of TAM, there will be ups and downs in the development and implementation of the program, but leaders must stay the course to see it through to its completion. When the TAM is under fire, the leaders must fall back on the clear goals and visions established for the program.
Leaders have a lot of commitments and may not have the time to understand the principles of TAM and what it takes to implement it in an agency, as noted by a few participants. Staff needs to assist leadership and help them understand the long-term benefits of TAM and the agency’s strategy. Leaders must understand that the implementation of TAM in an agency is an iterative process that will take a long time.
In addition, a couple of participants added that communication by the leadership to the agency is paramount to the success of TAM. The leader really has to market TAM both internally and externally to get support for the tough decisions that will be made. Sharing information through avenues such as newsletters, e-mails, website updates, etc., is critical to keeping staff up to date on program developments. DOTs especially need to create simple messages to external parties to educate them on TAM principles and methods.
It was also noted by one participant that it is important to craft the message to the audience. The agency’s public relations staff is a valuable resource that should be used to do this and to get the message out to internal and external audiences. Finally, another participant observed that DOTs need a complete communications plan that deals with internal and external communication and education. POTENTIAL RESEARCH NEEDS AND QUESTIONS
• A synthesis and best practices of how leading DOTs are messaging TAM inside and outside of their agencies (videos, marketing strategies, etc.).
T

22 Circular E-C200: Transportation Asset Management from Plans to Practice
• Do we really need to collect all of the data we have traditionally? Can we get by with less data collection for certain assets? How much is too much?
• What is the trade-off with collecting less core TAM data (pavement, bridges) and spending those resources on some of the ancillary data (signs, roadside treatments, etc.)?
• Benchmark how the private sector does TAM and compare it with public agencies. • A synthesis on how agencies deal with leadership turnover and best practices that
result. • A video featuring DOT executives chronicling TAM successes. • Guidance on implementation of the TAMP. • Training–boot camp for executive leadership on TAM principles and requirements
under MAP-21. • A cross-asset allocation tool for executives with a dial that can adjust the input for
goals and obtain resulting conditions. • A series of short courses on specific topics (financial management, risk management,
target setting, etc.).

23
Wrap-Up Session
KATIE ZIMMERMAN Applied Pavement Technology, Presiding
atie Zimmerman conducted the wrap-up session at the end of the day’s activities. She asked the audience about what wasn’t covered adequately and what should be included in next
year’s TAM conference in Minneapolis. Responses from individual participants are detailed in the bullet points below:
• TAMP certification process; • Financial plans; • Science (or science fiction) of target-setting; • Resilience requirement; • LCCA; • MPO and local agency interaction; • Cross-asset prioritization; and • Leadership and executive training (maybe in one day):
− Will leaders come to the TAM conference or should it be in concert with an event that they’re already attending (e.g., an AASHTO meeting)?
Zimmerman then reviewed the next steps or action items that came out of each of the
day’s sessions: • Develop a TAMP Session:
− Summarize the factors that have enabled agencies to establish a TAM culture that is insulated from leadership changes;
− Develop guidance on how a TAMP aligns with and feeds or supports other agency plans;
− Develop guidance on how states should coordinate TAM plans and targets with MPOs and other local agencies;
− Summarize current practices for managing and tracking conditions of ramps, auxiliary lanes, and turn lanes;
− Identify strategies for using public relations to strengthen TAM teams, TAMPs, and other initiatives; and
− Develop guidance to ensure consistency among FHWA division offices in applying the MAP-21 rules. • Risk Management Session:
− Establish methods of assessing data quality; − Provide examples of how agencies have incorporated risk into their TAMPs and
used risk to drive decisions; − Include examples where multiple scenarios are run to help determine what actions
should be taken; and − Evaluate whether existing performance measures are adequate for managing risks.
K

24 Circular E-C200: Transportation Asset Management from Plans to Practice
• Obtaining Buy-in and Engagement Session: − Measure the effectiveness of the MAP-21 legislation; − Improve the ability to model deterioration for assets such as large culverts,
geotechnical features, and noise walls; − Improve data analytics for decision making (that is, transforming data into
information); − Identify how to develop the next wave of asset managers (Universities? Cross-
training?); − Evaluate the amount of data needed to make decisions and the additional
resources needed to maintain data; and − Provide templates for data governance.
• Leadership and Communications Session: − Develop strategies for evaluating the economic trade-off associated with different
investment options (3-year strategy versus 20-year solution); − Determine whether new data is really needed (for instance, can agencies cut back
on core data so there are resources available for other asset data?); − Survey states to find out how they’re really implementing TAM; − Identify strategies for simplifying the message; and − Develop strategies to prevent leadership changes from derailing efforts.
• Roles and Responsibilities and Skills Session: − Sell benefits of TAM to individuals making program decisions; − Work with AASHTO to clarify that the TAM subcommittee coordinates TAM
activities, but TAM impacts other committees; − Document benefits of investments in TAM staffing and show examples of how
agencies have built the business case for TAM positions; and − Define common roles and responsibilities and show how agencies hold personnel
accountable to those responsibilities. • Other:
− Share business cases displaying “good practice” through peer exchanges and workshops;
− Provide guidance on developing a financial plan; and − Evaluate the amount of data needed at the federal level for reporting purposes.
Zimmerman then convened a panel to reflect on the day’s sessions and key issues that
were discussed so that suggestions for further research may be developed. Individual panel members had the following suggestions:
• Best practices for communicating the benefits of TAM both to the public and to legislators.
• Building a strong TAM organization (TAM tree—strong roots and branches): − TAM committees and champion are the trunk and branches; − Roots are the staff-level individuals that carry out TAM; and − Roots should be as large or large than the branches.
• How do you incorporate TAM with other initiatives and practices within a DOT? − Knowledge management;
Wrap-Up Session 25
− Process improvement initiatives; − What has been effective in sustaining TAM; and − How the bridge and pavement management systems are integrated.
• How do we manage the increased data that will be needed for an effective TAM program?
− What are we going to do with it? − How do we collect it? − What systems will be necessary?
• Data correlation studies: − Sampling frequency and approaches, etc.
• Cost and benefits of automated data collection (e.g., lidar). • Asset condition collection frequency requirements of MAP-21. • Peer exchanges. • How do we use legacy data when TAM systems change.
As this concluded the workshop, Zimmerman then asked the participants to vote on their
way out on the one suggestion that they would like to see addressed in a Research Needs Statement. Later, the workshop planning committee met to discuss the workshop and selected the three Research Needs Statements included in Appendix A.

26
APPENDIX A
Potential Research Needs Statements
Standing Committee on Research, American Association of State Highway and Transportation Officials
1. Assessing the Viability of Asset Management Implementation in a Transportation Agency
PROBLEM NUMBER To be assigned by NCHRP staff. STATEMENT OF THE RESEARCH PROBLEM Transportation agencies are investing millions of dollars to implement asset management in their business practices. These investments include development of plans, standards and guidance documents, data collection and storage, IT system development, training and inefficiencies that are inherent in any change management effort. Asset management requires a long-term focus and strategic decision making to optimize future outcomes. This means agencies may continue to invest significantly in asset management before tangible outcomes can be measured. This disconnect between the need for immediate investment and measurable impact places asset management implementation efforts at risk of being perceived as ineffective before they ever have a chance to gain steam.
Without the ability to measure success, agency asset management champions and executive leaders need some means of guidance to ensure they are on the right path with their implementation efforts. One means would be comparison of efforts being made in TAM implementation to historic efforts to implement other successful programs.
This research project would draw on change management principles as well as lessons learned from specific efforts in transportation agencies to provide guidance for agencies to determine the strengths and weaknesses of their current and planned implementation efforts. The guidance would help states determine which additional efforts may lead to increased chances of long-term successful implementations. Likewise, the tool could indicate which areas the agency may be over investing in.
This research differs from efforts to date in that it does not focus on the agency’s state of maturity in asset management, but rather on how comprehensive the implementation effort has been and how comprehensive their implementation plan is moving forward.

Appendix A: Potential Research Needs Statements 27
LITERATURE SEARCH SUMMARY A literature search revealed little on this subject. Most existing publications focus on an agency’s “level of maturity” of their asset management implementation. These measures identify gaps between the agency’s current and desired states, but do not get at what are the most-effective means of closing those gaps. Neither do they discuss the relationships between gaps. Likewise there is literature on change management in government agencies, but these lack any contextual relationship to transportation asset management. The following are examples of current literature.
• AASHTO Transportation Asset Management Guide: A Focus on Implementation, 1st Edition:
− Item Code: TAMGFI-1; − ISBN Number: 1-56051-499-2; − Item format: Paperback; − Item pages: 496; − Year published: 2011; − Overview and Table of Contents available at https://bookstore.transportation.org
/imageview.aspx?id=913&DB=3; − Executive Summary available at https://bookstore.transportation.org/imageview
.aspx?id=1276&DB=3. • Asset Management Peer Exchange: Transportation Asset Management—A Focus on
Implementation: − Record URL: www.fhwa.dot.gov/asset/pubs/hif12041.pdf. − Abstract: This report summarizes the proceedings of the Asset Management Peer
Exchange hosted by the FHWA and AASHTO. The peer exchange was held in San Diego, California, on April 19, 2012. The peer exchange addressed various aspects of asset management implementation: How can one improve performance through better asset management? What are effective tools and techniques for asset management implementation? How do agencies plan, prioritize, and budget long-term asset needs? Managers from state DOTs and FHWA gathered for dialogue on best practices, challenges, and sharing of experiences.
− Year published: 2012. • Change Management in Government:
− Record type: web article; − Language: English; − Record URL: https://hbr.org/2006/05/change-management-in-government; − Abstract: Article describes five principles for successfully implementing change
in government agencies; − Year published: 2006.

28 Circular E-C200: Transportation Asset Management from Plans to Practice
RESEARCH OBJECTIVE The objective of this research is to look to past change management efforts in transportation or other fields for similar efforts which resulted in long-term sustained changes to agency practices, and glean from those examples lessons that could be applied to the current asset management implementation efforts. The expected product of this research would provide:
1. Guidance to asset management champions regarding strategies that could improve the chances of long-term program sustainability;
2. Advice on how to communicate the need for continued commitment despite the inability to measure success in the short term; and
3. Suggestions on future federal or state legislative or regulatory changes that could support asset management implementation at state DOTs. ESTIMATE OF PROBLEM FUNDING AND RESEARCH PERIOD Recommended Funding Funding for this project is estimated at $200,000 to $300,000.
Research Period The research study will be completed in approximately 18 months. PERSON(S) DEVELOPING THE PROBLEM STATEMENT This research problem statement was developed by the participants in the Transportation Asset Management Workshop: From Plans to Practice, sponsored by TRB on May 31, 2015, in Denver, Colorado.
2. An Assessment of the Impact of Sampling Approaches and
Survey Frequency on Pavement Condition Results PROBLEM NUMBER To be assigned by NCHRP staff. STATEMENT OF THE RESEARCH PROBLEM One of the objectives of the highway legislation commonly referred to as MAP-21 was to establish a performance-based federal-aid highway program that concentrates investments in the NHS on
Appendix A: Potential Research Needs Statements 29
seven national goal areas. The FHWA is responsible for establishing requirements for complying with the legislations through the publication of a NPRM and subsequent publishing of a Final Rule based on comments received on the NPRM. At the time this Research Problem Statement was prepared (July 2015), the NPRM for Infrastructure Condition had been issued and the comment period was closed; however, the Final Rule had not yet been published.
The NPRM for Infrastructure Condition includes four measures to assess pavement condition, including
4. Percentage of pavements on the Interstate system in Good condition; 5. Percentage of pavements on the Interstate system in Poor condition; 6. Percentage of pavements on the NHS (excluding the Interstate system) in Good condition;
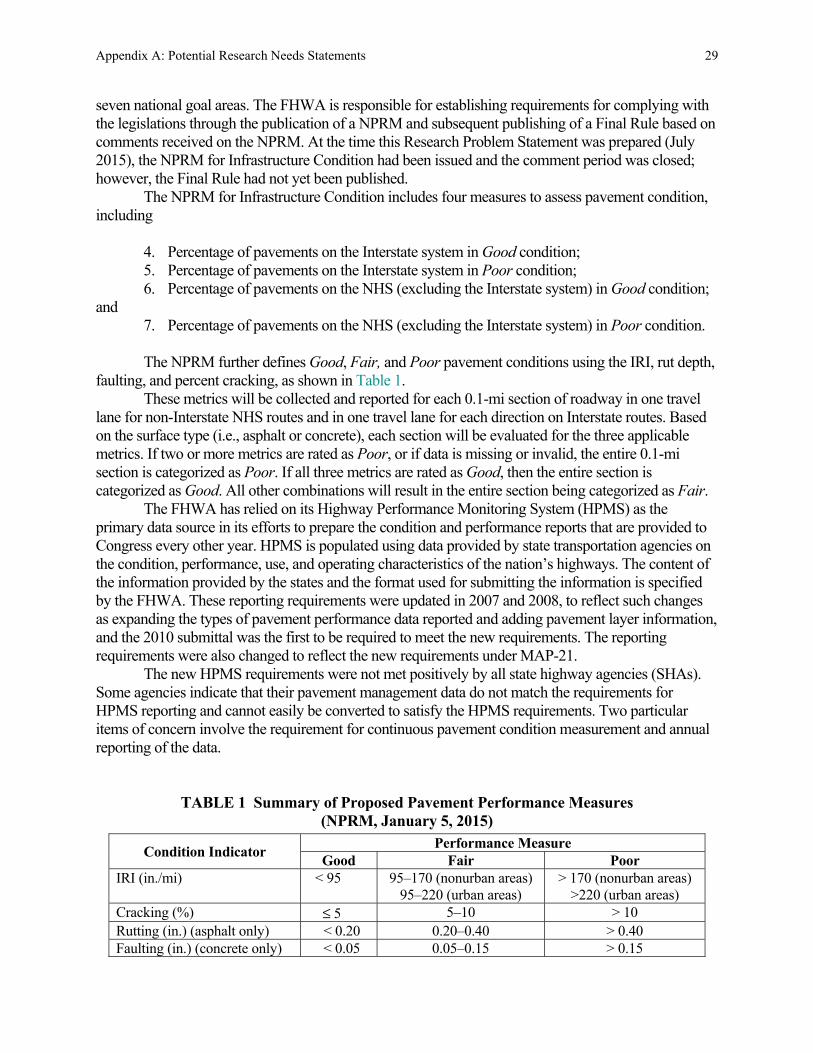
and 7. Percentage of pavements on the NHS (excluding the Interstate system) in Poor condition. The NPRM further defines Good, Fair, and Poor pavement conditions using the IRI, rut depth,
faulting, and percent cracking, as shown in Table 1. These metrics will be collected and reported for each 0.1-mi section of roadway in one travel
lane for non-Interstate NHS routes and in one travel lane for each direction on Interstate routes. Based on the surface type (i.e., asphalt or concrete), each section will be evaluated for the three applicable metrics. If two or more metrics are rated as Poor, or if data is missing or invalid, the entire 0.1-mi section is categorized as Poor. If all three metrics are rated as Good, then the entire section is categorized as Good. All other combinations will result in the entire section being categorized as Fair.
The FHWA has relied on its Highway Performance Monitoring System (HPMS) as the primary data source in its efforts to prepare the condition and performance reports that are provided to Congress every other year. HPMS is populated using data provided by state transportation agencies on the condition, performance, use, and operating characteristics of the nation’s highways. The content of the information provided by the states and the format used for submitting the information is specified by the FHWA. These reporting requirements were updated in 2007 and 2008, to reflect such changes as expanding the types of pavement performance data reported and adding pavement layer information, and the 2010 submittal was the first to be required to meet the new requirements. The reporting requirements were also changed to reflect the new requirements under MAP-21.
The new HPMS requirements were not met positively by all state highway agencies (SHAs). Some agencies indicate that their pavement management data do not match the requirements for HPMS reporting and cannot easily be converted to satisfy the HPMS requirements. Two particular items of concern involve the requirement for continuous pavement condition measurement and annual reporting of the data.
TABLE 1 Summary of Proposed Pavement Performance Measures (NPRM, January 5, 2015)
Condition Indicator Performance Measure Good Fair Poor
IRI (in./mi) < 95 95–170 (nonurban areas) 95–220 (urban areas)
> 170 (nonurban areas) >220 (urban areas)
Cracking (%) ≤ 5 5–10 > 10 Rutting (in.) (asphalt only) < 0.20 0.20–0.40 > 0.40 Faulting (in.) (concrete only) < 0.05 0.05–0.15 > 0.15

30 Circular E-C200: Transportation Asset Management from Plans to Practice
This study will investigate the impact of these two factors on the reliability and repeatability of pavement condition data to help evaluate whether the additional personnel requirements to satisfy the federal requirements are justified in terms of the improve quality of the data. The results of this study are expected to help guide future data reporting requirements at the federal level while also providing guidance needed at the state level to evaluate changes that should be made to pavement condition surveys to improve the quality and reliability of these activities. LITERATURE SEARCH SUMMARY The following studies were identified through a literature search. These studies differ from the objectives of the proposed research because they each address a particular survey methodology which is not related to the HPMS data required at the federal level.
• Evaluation of Texas Condition Assessment Program and Recommendations for Improvement:
− Accession number: 01478117; − Record Type: Component; − Language: English; − Record URL: http://docs.trb.org/prp/13-2850.pdf ; − Order URL: http://amonline.trb.org/; − Source data: 92nd Annual Meeting of the Transportation Research Board, 2013,
Paper #13-2850; − Abstract: The Texas DOT uses the Texas Condition Assessment Program (CAP)
to measure and compare the overall road maintenance conditions among its 25 districts. Texas CAP combines data from its three subsystems: the Pavement Management Information System, which scores the condition of pavement; the Texas Maintenance Assessment Program, which evaluates roadside conditions; and the Texas Traffic Assessment Program, which assesses the condition of signs, work zones, railroad crossings, and other traffic elements. The scores for each of the subsystems are based on data of different sample sizes, accuracy, and levels of variations. Therefore, whether the use of the current Texas CAP system is an effective and consistent means to measure the Texas DOT roadway inventory conditions needs to be evaluated. Statistical analyses were carried out to evaluate the system from two aspects: (1) to determine whether the mechanism employed in Texas CAP is effective in measuring the maintenance performance of 25 districts statistically, and (2) to determine whether the difference between the CAP scores for any two districts is statistically significant in terms of the insufficient sampling of the subsystems. A case study was carried out using sample data collected for the whole state from the year 2008 to 2010. The case study results show that the differences in scores between two districts are statistically significant for some of the districts and insignificant for some other districts. It is therefore recommended that Texas DOT either compare the 25 districts by groups or tiers or increase the sample size of the data being collected if it wants to compare the districts as individual ones. • The Impacts of Continuous Data Collection on the Accuracy of Pavement Management
Decisions:

Appendix A: Potential Research Needs Statements 31
− Accession number: 01475452; − Record type: Component; − Language: English; − Order URL: http://amonline.trb.org/; − Source data: 92nd Annual Meeting of the Transportation Research Board, 2013,
Paper #13-3617; − Abstract: The current economic climate is forcing reduction in the costs of data
collection using sampling. For semi-automated distress data collection techniques, data sampling implies continuous pavement imaging and digitization of the images of sampled pavement segments. Although sampling precipitates immediate reduction in the cost of data collection, its true costs cannot be determined unless the impacts of data sampling on the accuracy and variability of the pavement condition data are analyzed. In this study, sponsored by the FHWA, continuously collected time series pavement distress data were requested and obtained from the states of Colorado, Louisiana, Michigan, and Washington. The transverse and longitudinal cracking data for 109 mis of pavement were used to simulate 10% sampling and determine the effects of data sampling and sample size on the accuracy of the pavement condition data. For each 1 mi of pavement, the distress data along the sample were assumed to represent the condition along the entire mile. The paper shows that the accuracy of data sampling is a function of the sample size and the uniformity or variability of the distress data. Furthermore, as time elapses and pavement deteriorates with no applied treatments, variability between continuous and sampled data sets increases substantially. As expected, increasing the sample size reduces the differences between the sampled and continuous data. However, given that some states use 10% sample size, it is likely that the potential misallocation of pavement treatment funds due to sampling may outweigh the savings incurred by sampling. • The Effect of Pavement Condition Data Sampling on Project Boundary Selection:
− Accession number: 01347193; − Record type: Component; − Language: English; − Record URL: http://dx.doi.org/10.1061/41167(398)2; − Abstract: Pavement condition data are either continuously collected or sampled.
In sampling it is assumed that the time and costs of data collection can be reduced and the pavement condition of shorter segments represent the conditions of larger sections. In a study sponsored by the FHWA, pavement distress data along several miles of roads were obtained from four SHAs. Each department collects and stores distress data on a continuous basis for each 0.1-mi section along the network. The continuous data were sampled and the impacts on the accuracy of pavement decisions were analyzed. Results of the analyses are discussed herein. It is shown that, for variable pavement conditions, 10% sampling leads to inaccurate decisions. Pavement sections in need of repair are ignored whereas healthy sections are selected for repair. The costs incurred due to inaccurate decisions could be much higher than the saving incurred by sampling. • Confidence Level and Efficient Sampling Size of Roughness Measurements for
Pavement Management in Maryland: − Accession Number: 01152462; − Record Type: Component;

32 Circular E-C200: Transportation Asset Management from Plans to Practice
− Language: English; − Record URL: http://dx.doi.org/10.3141/2153-13; − Record URL: http://scholar.google.com/scholar_look...ong&author=G.+Hall
&publication_year=2010; − Abstract: The IRI is the primary index of the Maryland pavement management
system and is the data source for performance trend analysis, budget allocation, and project selection. The Maryland SHA makes a significant investment to collect, process, analyze, and store IRI data every year over the entire network of the roads. Such reliance on IRI data and investment instigated the investigation of the confidence level embedded in the data and of devising possible sampling scenarios. To evaluate the confidence level, repeatability errors of the measurements were assessed. IRI data were repeatedly collected over a designated test loop under normal operating conditions to mimic network-level data collection. Sampling scenarios were devised using the Monte Carlo method for network IRI data collected in 2008. The network was stratified on the basis of functional classifications. Sampling errors in estimating the percentage of the roads in each of five IRI categories established by Maryland SHA were evaluated. The results indicated that the repeatability error of the measurements was less than 7%. The sampling results indicated that the state may survey a third of the network each year and expect estimation errors of less than 0.5% for all IRI categories. As such, Maryland SHA would not incur a considerable sacrifice in the confidence of network condition evaluation. • Effect of Frequency of Pavement Condition Data Collection on Performance
Prediction: − Accession number: 01150981; − Record type: Component; − Language: English; − Record URL: http://dx.doi.org/10.3141/2153-08; − Record URL: http://scholar.google.com/scholar_look...tti&author=C.+Dean
&publication_year=2010; − Abstract: Monitoring pavement surface conditions over time is essential for
pavement management and performance models. Time-series distress data can be used to determine the remaining service life at the project level, which can then be used for all projects to assess the overall health of the pavement network. Observed field performance is also crucial for calibrating performance prediction models for pavement design purposes. Therefore, highway agencies collect pavement condition data to accomplish both policy and engineering objectives. However, differences exist among agencies between the monitoring frequency used for pavement surface distress (imaging) and that used for sensor-measured features. These differences pertain primarily to the relative difficulties in collecting and processing imaging data. Many agencies collect sensor data more frequently than images. Most highway agencies monitor pavement condition at 1-, 2-, or 3-year frequencies. Discrepancies between performance model predictions and observed field performance are conventionally attributed solely to errors in predicted pavement distresses. In fact, inherent uncertainty may also be present in measured pavement distresses due to spatial variability, sampling, and measurement errors. The frequency of distress data collection adds further uncertainty in performance prediction. This paper explores the effect of pavement condition monitoring frequency on pavement performance prediction. Analyses of observed pavement performance show

Appendix A: Potential Research Needs Statements 33
that condition data collection frequency can significantly affect performance prediction. Therefore, more frequent data collection for image-based methods can reduce the associated risk in performance prediction and thus be more effective for better decision making for pavement management.
RESEARCH OBJECTIVE The objective of this research is to develop guidance that can be used at the federal and state level to establish sampling rates and survey frequency for pavement management surveys based on an assessment of the impact these factors have on the quality and repeatability of the final results.
This research objective will be achieved through the conduct of the following activities:
• Compare pavement condition sampling and frequency rates in state DOTs with those required under MAP-21.
• Propose an approach for evaluating the impact of sampling rates and survey frequency on pavement condition survey results.
• Upon approval of the proposed approach by the technical panel, evaluate the impact of various sampling rates and survey frequency on pavement condition survey results.
• Prepare a final report that includes the findings and provides guidance for agencies at the federal and state level concerning pavement condition sampling rates and survey frequency. ESTIMATE OF PROBLEM FUNDING AND RESEARCH PERIOD Recommended Funding Funding for this project is estimated at $250,000 to $300,000. Research Period The research study will be completed in approximately 18 months. PERSON(S) DEVELOPING THE PROBLEM STATEMENT This research problem statement was developed by the participants in the Transportation Asset Management Workshop: From Plans to Practice sponsored by TRB on May 31, 2015, in Denver, Colorado.

34 Circular E-C200: Transportation Asset Management from Plans to Practice
3. Transportation Asset Management Communication for Executives
PROBLEM NUMBER To be assigned by NCHRP staff. STATEMENT OF THE RESEARCH PROBLEM In June 2015, the TRB Asset Management Committee, the AASHTO Subcommittee on Asset Management, and the FHWA Office of Asset Management hosted a workshop in Denver, Colorado, to discuss the furthering the practice of TAM implementation. The goal of the workshop was to share current practices in TAM implementation and to identify priority strategies for advancing national practice. A key area of identified need is to better communicating the value of TAM and have transportation agency leadership be able to understand and communicate the important messages.
TAM research has produced many products over the past decade or two, but despite many efforts, education and training on the research results and communicating the value has not kept pace. Improving TAM decision making requires knowledgeable agency executives and managers. A key outcome of an effective TAM program is the ability to communicate the relationship between asset performance with investment scenarios. An executive’s ability to communicate TAM in a more “holistic” nature with both an understanding of individual TAM components and the development and implementation of the total program increases the success of the program. MAP-21’s TAMP requirement is an important indication of the importance of the integrated TAMP with the understanding of the individual components.
TRB, AASHTO, and FHWA have been working together for the past decade to create forums for executive and managers to share practices and prioritize activities that will advance national practice. A formal program focused on both communicating TAM value and educating executives is now needed to take what has been done to date and advance practice and impact to the next level. The training opportunities available to date is targeted at a cross section of TAM professional and not directly targeted at executives. The impact of transportation agency executives having a better understanding of TAM and having the mechanisms for communicating TAM needs and messages to partners, political entities, and customers can add a lot of value to the advancement of TAM practice and impact. LITERATURE SEARCH SUMMARY The following studies were identified through a literature search.
• Communicating the Value of Preservation: A Playbook: − Record URL: http://onlinepubs.trb.org/onlinepubs/nchrp/nchrp_rpt_742.pdf; − Source Data: NCHRP Report;

Appendix A: Potential Research Needs Statements 35
− Abstract: This report presents guidance for communicating the value of highway system maintenance and preservation. The guidance includes numerous examples and models that transportation agency staff members can use to present—succinctly and persuasively to agency leadership, elected officials, and the public—the case for allocating budgetary and other resources to preserve and maintain the public’s investment in highway infrastructure. • Executive Strategies for Risk Management by State Departments of Transportation:
− Record URL: http://onlinepubs.trb.org/onlinepubs/nchrp/docs/NCHRP20-4%2874%29_ExecutiveSummary.pdf;
− Source data: NCHRP Report; − Abstract: This executive summary, produced for NCHRP project 20-24(74),
provides an overview of risk management. It outlines risk management concepts, benefits, challenges, and approaches to implementation. • Communicating the Results of NCHRP Strategic Transportation Issues Research:
− Record URL: http://apps.trb.org/cmsfe...Display.asp?ProjectID=3466; − Abstract: In a departure from the traditional nature of research conducted by the
NCHRP, seven recently completed and ongoing NCHRP research projects (NCHRP 20-83 series) are examining global and domestic longer-term strategic issues with the potential to affect state DOTs in important ways in 30 to 50 years. The NCHRP 20-83 research series represents a significant investment in research designed to prepare transportation practitioners to respond to future challenges—and opportunities—facing the industry. The NCHRP 20-83 series is intended to meet the following two goals:
1. Anticipate future issues so that transportation agencies are better prepared to respond to new and emerging challenges; and
2. Enable transportation agencies to help shape the future through their decision making by exploring visions of what the future could look like. Currently active research in the NCHRP 20-83 series includes Economic Changes Driving Future Freight Transportation [Project 20-83(01)]; Expediting Future Technologies for Enhancing Transportation System Performance [Project 20-83(02)]; Long-Range Strategic Issues Affecting Preservation, Maintenance, and Renewal of Highway Infrastructure [Project 20-83(03)]; Effects of Changing Transportation Energy Supplies and Alternative Fuel Sources on Transportation [Project 20-83(04)]; Climate Change and the Highway System: Impacts and Adaptation Approaches [Project 20-83(05)]; Effects of Socio-Demographics on Travel Demand [Project 20-83(06)]; and Sustainable Transportation Systems and Sustainability as an Organizing Principle for Transportation Agencies [Project 20-83(07)].
These seven research projects are on a staggered completion schedule and published results are expected in 2013 and 2014. The strategic issues discussed in the NCHRP 20-83 series will have to compete with other issues and matters for the attention of executive-level transportation leaders in the crowded transportation policy environment. To gain that attention, creative and innovative means are needed to convey the relevant and actionable information necessary to begin and sustain a dynamic conversation within transportation leadership circles about the results of NCHRP 20-83 research, how to connect short-term decision making with long-term thinking, and how to prepare for and respond to opportunities and challenges that may occur several decades in the future. Because of the highly changeable nature of the transportation policy

36 Circular E-C200: Transportation Asset Management from Plans to Practice
environment, it is necessary to begin this project before all of the NCHRP 20-83 research projects are completed. This will allow transportation leaders to learn and benefit from the work completed to date and provide timely access to the results of the remaining research projects as they are completed. The objectives of this research are to
1. Identify, synthesize, integrate, communicate, and build on the individual results of the NCHRP 20-83 series to create a master narrative for the transportation industry's executive leadership about the implications of these research results for state DOTS,
2. Develop a comprehensive communication plan that addresses all seven projects in the NCHRP 20-83 series,
3. Develop creative and innovative messages and communication approaches that
a. encourage and enable changing leadership to engage in an ongoing and dynamic conversation to address or respond to these issues and
b. integrates the results of each NCHRP 20-83 project as it is completed, and 4. Identify roles for potential partner communities to amplify and expand the
reach of the message(s). • Successful Practices in GIS-Based Asset Management:
− Record URL: http://onlinepubs.trb.org/onlinepubs/nchrp/nchrp_rpt_800.pdf; − Abstract: This report presents guidance for state transportation agencies on using
geographic information system (GIS) technologies in TAM. The guidance is in two parts: The first, for senior transportation agency leadership, presents the business case for investment in GIS technologies for TAM; the second part, for TAM practitioners, describes lessons learned from current examples of successful practices for implementing these technologies and practical evidence of the benefits and challenges associated with adoption of GIS-based TAM. The first chapter of the report provides an overview of the project. Chapter 2 documents the information gathering and guidance development activities. Chapter 3 covers the outreach components of the project. Chapter 4 provides a brief summary of the products and conclusions from the research. Major project deliverables are included as Annexes to the report: an executive guide, an implementation guide, and GIS–TAM workshop presentation slides.
RESEARCH OBJECTIVE The objectives of this research are to accomplish the following:
1. Identify and document noteworthy practices for communicating TAM needs and benefits for executive-level messaging.
2. Develop education material for a executive-level “boot camp” for communicating TAM.
3. Recruit participants and deliver pilot “boot camp.” 4. Develop a TAM communication “boot camp” guidance so that others can deliver it.

Appendix A: Potential Research Needs Statements 37
ESTIMATE OF PROBLEM FUNDING AND RESEARCH PERIOD Recommended Funding Funding for this project is estimated at $150,000. Research Period The research study will be completed in approximately 9 months. PERSON(S) DEVELOPING THE PROBLEM STATEMENT This research problem statement was developed by the participants in the Transportation Asset Management Workshop: From Plans to Practice sponsored by TRB on May 31, 2015, in Denver, Colorado.

38
APPENDIX B
Fall 2014 State DOT TAM Survey
n November 2014, a web-based survey was distributed to state DOT contacts who had participated in recent TRB and AASHTO TAM events. A total of 286 people were contacted,
and 63 responses were received as of December 9, 2014. The following report summarizes the responses received.
This report was prepared for the use of the planning group working on the 2015 TRB Transportation Asset Management Workshop, which was held May 31, 2015, in Denver, Colorado. This report was prepared by Matt Haubrich of Iowa DOT. STATES REPRESENTED A total of 34 states saw at least one person respond. Respondents came from the following states. Vermont had the most respondents with six.
I
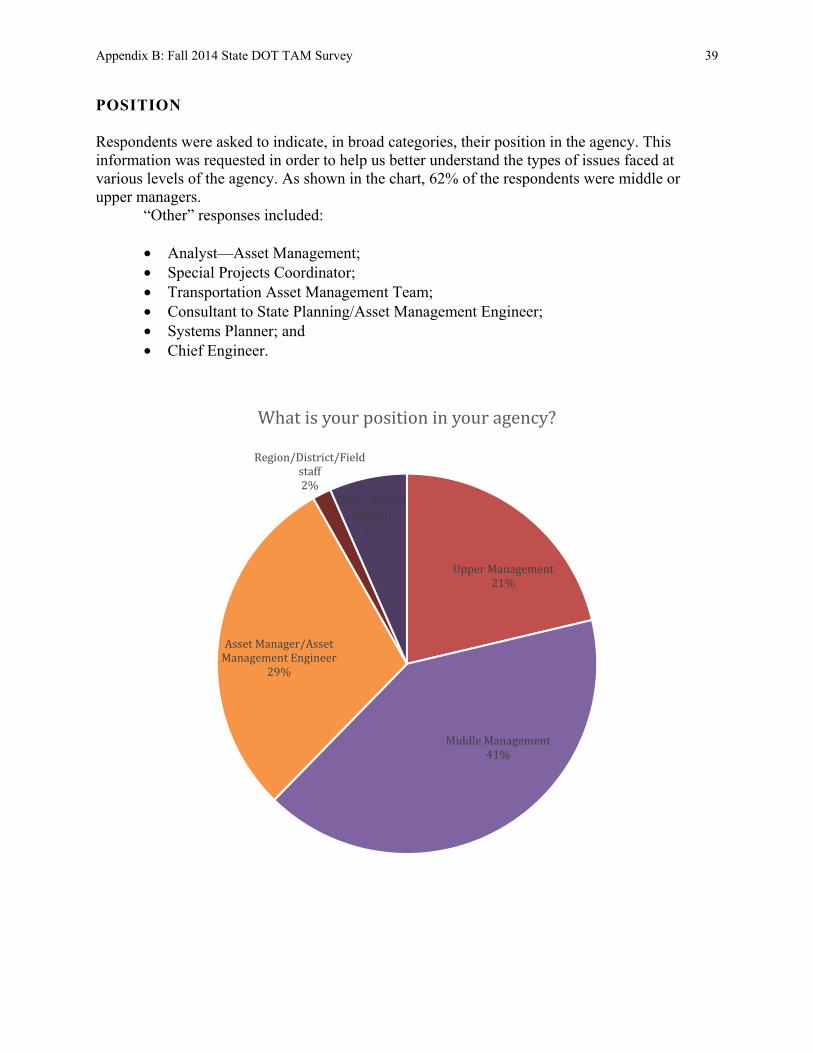
Appendix B: Fall 2014 State DOT TAM Survey 39
POSITION Respondents were asked to indicate, in broad categories, their position in the agency. This information was requested in order to help us better understand the types of issues faced at various levels of the agency. As shown in the chart, 62% of the respondents were middle or upper managers.
“Other” responses included: • Analyst—Asset Management; • Special Projects Coordinator; • Transportation Asset Management Team; • Consultant to State Planning/Asset Management Engineer; • Systems Planner; and • Chief Engineer.
Upper Management21%
Middle Management41%
Asset Manager/Asset Management Engineer29%
Region/District/Field staff2% Other (please specify)7%
What is your position in your agency?

40 Circular E-C200: Transportation Asset Management from Plans to Practice
INTEREST CATEGORIES Respondents were given a list of 17 topics which were assembled from prior surveys and discussions with experts in the field. For each topic, people were asked to indicate their level of interest in that topic from (1 = not interested to 4 = very interested). The results are shown in the chart below.
30 23 25 29 19 26 20 16 13 19 16 20 10 13 11 4 5
26 29 24 19 29 21 25 29 29 21 24 18 25 22 20 15 8
7 10 9 10 15 14 17 17 16 19 21 20 24 25 25 23 18
0 1 5 4 0 1 1 1 5 3 1 5 2 3 7 21 32
SETTING P
ERFORMAN
CE TARG
ETSMAP-
21 ASSET
MANAGEME
NT PLAN
IMPLEMEN
TING TAM
CROSS-ASS
ET ALLO
CATION
DATA MAN
AGEMENT/
STEW
ARDSHIP
RISK MANA
GEMENT
DATA ANAL
YSIS &
MODELING
FINANCIAL
PLANS
COMMUNIC
ATING TAM
RESU
LTSORGA
NIZATIONA
L ISSUES
CONTINUA
L IMPR
OVEMENT
ASSET CON
DITION DA
TA COLL
ECTION
RESOURCE
MANAGEM
ENT (INPU
TS)ASSE
T INVENTO
RYMPO/
LOCAL
GOVERNME
NT …CLIM
ATE ADAPT
ATION
AND TAM TRAN
SIT ASSET
MANAGEME
NT
TOPIC AREAS THAT MIGHT BE OF INTEREST4 - Very Interested 3 - Interested 2 - Somewhat Interested 1 - Not Iinterested
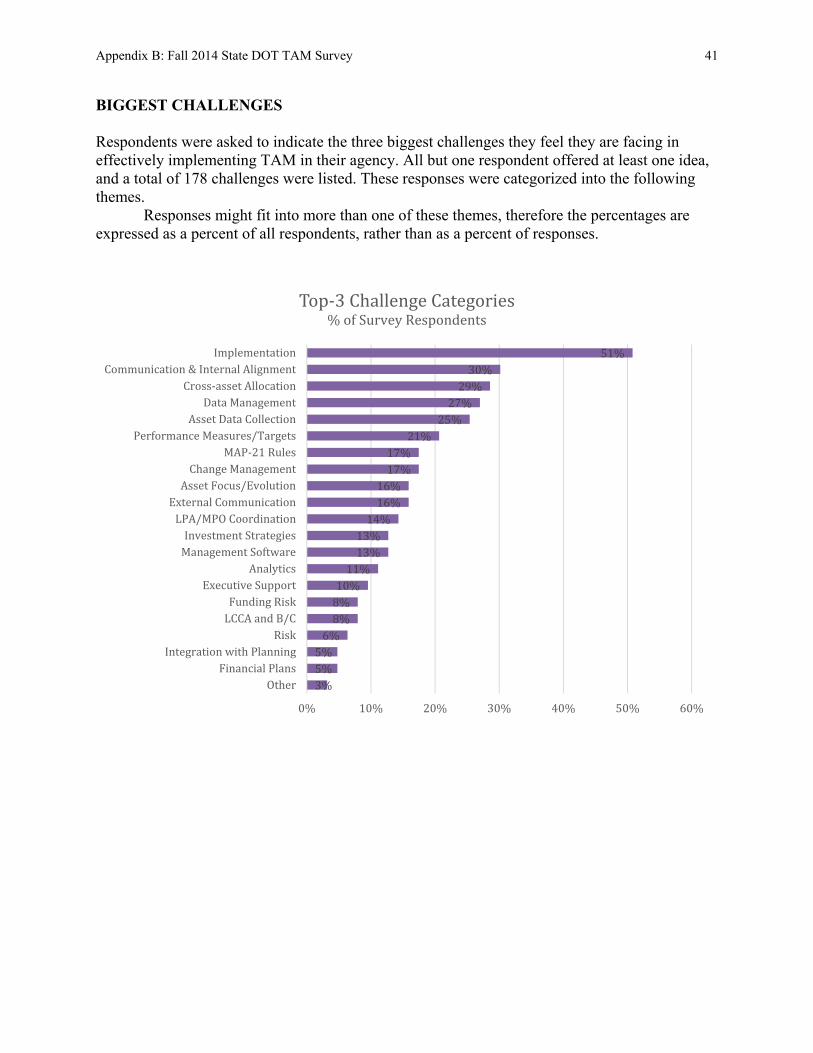
Appendix B: Fall 2014 State DOT TAM Survey 41
BIGGEST CHALLENGES Respondents were asked to indicate the three biggest challenges they feel they are facing in effectively implementing TAM in their agency. All but one respondent offered at least one idea, and a total of 178 challenges were listed. These responses were categorized into the following themes.
Responses might fit into more than one of these themes, therefore the percentages are expressed as a percent of all respondents, rather than as a percent of responses.
3%5%5%6%8%8%10%11%13%13%14%16%16%17%17%21% 25%27%29%30% 51%
0% 10% 20% 30% 40% 50% 60%OtherFinancial PlansIntegration with PlanningRiskLCCA and B/CFunding RiskExecutive SupportAnalyticsManagement SoftwareInvestment StrategiesLPA/MPO CoordinationExternal CommunicationAsset Focus/EvolutionChange ManagementMAP-21 RulesPerformance Measures/TargetsAsset Data CollectionData ManagementCross-asset AllocationCommunication & Internal AlignmentImplementationTop-3 Challenge Categories% of Survey Respondents

42 Circular E-C200: Transportation Asset Management from Plans to Practice
IMPLEMENTATION The most common challenge, mentioned by over half of respondents, dealt with Implementation. Typical responses included:
• Development of TAMP for MAP-21 and who will be owner. • Devoting appropriate resources and commitment to TAM in face of stagnant and
declining state and federal resources. • Determining which office should “own” TAM. • Organizational structure to facilitate completion of the TAMP.
COMMUNICATION The next most common theme dealt with communications and internal alignment. Typical responses were:
• Communication with asset owners. • Defining terms and business practices to ensure consistent approaches. • Buy in—getting other offices that need to have a significant role to prioritize asset
management tasks. • Are there any training programs out there for implementation of TAMPs? How have
other states introduced the TAMP to the rank and file employees? CROSS-ASSET ALLOCATION Cross-asset allocation was also mentioned frequently, as typified by these responses:
• Cross-asset allocation; • Cross-asset allocation between system preservation and system enhancement
activities; and • Establishing cross-asset allocation procedures and associated data needs.
DATA MANAGEMENT Data management was mentioned by 27% of survey respondents, as shown in these responses:
• Data integration/data quality. • Data management/stewardship. • Efficient interaction between the various information management systems. We have
gaps in this area and there is no quick, easy, or affordable solution. • Disparate sources of data, lack of useable data. • Changing how we gather, house, and report information.

Appendix B: Fall 2014 State DOT TAM Survey 43
ASSET DATA COLLECTION The collection of asset data was mentioned by 25% of respondents. In some cases the comment referred to both asset data as well as coordination with local agencies, in which case the comment was coded to both themes.
• What assets should be inventoried? What assets, in addition to being inventoried, should have their conditions assessed?
• Asset data collection. • Obtaining consistent data statewide.
TOP IMPLEMENTATION ISSUE After listing the three challenges in the previous question, respondents were asked to pick one as their “most pressing” issue. A total of 57 respondents offered an issue. These responses were categorized, as in the previous question, with results summarized as follows.
2%2%3%3%3% 5%5% 6%6%6%6%6%6% 8%10%11%13% 19%
0% 5% 10% 15% 20% 25%MAP-21 RulesIntegration with PlanningPerformance Measures/TargetsLCCA and B/CManagement SoftwareFunding RiskAsset Focus/EvolutionExecutive SupportLPA/MPO CoordinationAsset Data CollectionExternal CommunicationAnalyticsInvestment StrategiesChange ManagementCommunication & Internal AlignmentData ManagementCross-asset AllocationImplementationTop Implementation Issue
% of Survey Respondents
44 Circular E-C200: Transportation Asset Management from Plans to Practice
The top implementation issue mentioned by nearly 20% of respondents is “implementation”. Specific comments illustrating this theme include:
• Devoting the appropriate resources and commitment to TAM. If this is in place, transportation asset challenges will be appropriately addressed and opportunities will be more completely realized.
• Staffing. • TAMP.
The first issue is “How can we deal with cultural issues in middle management even with
executive support and approval? They don’t want to change (modify) duties, workflows, and policies that support asset management.” “It won’t be around in a few years.” Not all managers are convinced asset management will benefit them (or the program). Asset management shifts some responsibilities, such as project selection and project-level activities from development level groups to planning–asset management-level groups.

The National Academy of Sciences was established in 1863 by an Act of Congress, signed by President Lincoln, as a private, nongovernmental institution to advise the nation on issues related to science and technology. Members are elected by their peers for outstanding contributions to research. Dr. Ralph J. Cicerone is president.
The National Academy of Engineering was established in 1964 under the charter of the National Academy of Sciences to bring the practices of engineering to advising the nation. Members are elected by their peers for extraordinary contributions to engineering. Dr. C. D. Mote, Jr., is president.
The National Academy of Medicine (formerly the Institute of Medicine) was established in 1970 under the charter of the National Academy of Sciences to advise the nation on medical and health issues. Members are elected by their peers for distinguished contributions to medicine and health. Dr. Victor J. Dzau is president.
The three Academies work together as the National Academies of Sciences, Engineering, and Medicine to provide independent, objective analysis and advice to the nation and conduct other activities to solve complex problems and inform public policy decisions. The Academies also encourage education and research, recognize outstanding contributions to knowledge, and increase public understanding in matters of science, engineering, and medicine.
Learn more about the National Academies of Sciences, Engineering, and Medicine at www.national-academies.org.
The Transportation Research Board is one of seven major programs of the National Academies of Sciences, Engineering, and Medicine. The mission of the Transportation Research Board is to increase the benefits that transportation contributes to society by providing leadership in transportation innovation and progress through research and information exchange, conducted within a setting that is objective, interdisciplinary, and multimodal. The Board’s varied activities annually engage about 7,000 engineers, scientists, and other transportation researchers and practitioners from the public and private sectors and academia, all of whom contribute their expertise in the public interest. The program is supported by state transportation departments, federal agencies including the component administrations of the U.S. Department of Transportation, and other organizations and individuals interested in the development of transportation.
Learn more about the Transportation Research Board at www.TRB.org.

TRANSPORTATION RESEARCH BOARD500 Fifth Street, NWWashington, DC 20001