number of licensed wisconsin dairy farms · 4 a brief history of wisconsin dairy heritage stephen...
TRANSCRIPT


• Number of licensed Wisconsin dairy farms 9,520 dairy farms
• Number of Wisconsin dairy cows 1,279,000 dairy cows
• Average milk production per cow per year in Wisconsin 23,552 lbs. / 2,739 gal.
• Total Wisconsin milk production 30,123,000,000 lbs. / 3,503,000,000 gal.
• Wisconsin milk production (percentage of the U.S. total) 14.2%
• Average number of cows per farm in Wisconsin 134 dairy cows
• Total Wisconsin cheese production 3,167,495,000 lbs.
• Wisconsin cheese production (percentage of the U.S. total) 26.2%
• Total Wisconsin specialty cheese production (2015) 722,101,000 lbs.
• Total Wisconsin cheddar cheese production 677,742,000 lbs.
• Total Wisconsin other American cheese production 300,151,000 lbs.
• Total Wisconsin mozzarella cheese production 1,093,854,000 lbs.
• Total Wisconsin other Italian cheese production 531,563,000 lbs.
• Total Wisconsin dry whey (for human consumption) production 312,387,000 lbs.
• Number of cheese plants in Wisconsin 144 plants
• Number of butter plants in Wisconsin 14 plants
• Number of yogurt plants in Wisconsin 15 plants
• Total Wisconsin plants manufacturing one or more dairy products (2015) 203 plants
All statistics are from 2016 data unless noted otherwise. Source: Wisconsin Agricultural Statistics Service (WASS); USDA National Agricultural Statistics Service (NASS);Wisconsin Department of Agriculture, Trade and Consumer Protection (WDATCP)
2
Wisconsin’s Dairy Industry

1Source: University of Wisconsin; Florida Citrus Mutual; University of Idaho2Source: NASS, 2012 Census of Agriculture3Source: University of Wisconsin, Department of Agriculture & Applied Economics
96% of Wisconsin Dairy Farms are Family Owned2
Dairy is the Largest Segment of Wisconsin Agriculture3
Individuals & Families
Total Ag=
Total Dairy=
Billion
Billion
Partnerships
FamilyCorporationsNon-family Corporations
& Other
(approximately 3%non-family partnerships)
3
Wisconsin’s Dairy Economic Impact
Dairy means more to Wisconsin than
citrus to Florida or potatoes to Idaho—
contributing $43.4 billion annually
to Wisconsin’s economy.1

4
A Brief History of Wisconsin Dairy Heritage
Stephen Babcock, an agriculture research chemist, develops the Babcock test, a simple method of measuring the butterfat content of milk. Later, in 1895, Babcock discovers the natural milk enzyme galactase, which aids cheese ripening.
UW–Madison bio-chemistry professor Harry Steenbock develops a method to increase the vitamin D content in foods like milk, a discovery that would eliminate the crippling childhood bone disease known as rickets.
The number of Wisconsin farms with dairy cows reaches its highest point at 180,695 farms.
William D. Hoard, who founded Hoard’s Dairyman, “a journal devoted to dairy farming,” in 1885, is elected as the 16th governor of Wisconsin symbolizing the rise of dairying.
Wisconsin has 1,500 factories located at rural crossroads where farmers can deliver their daily milk. More than 90 percent of Wisconsin farms raise dairy cows. Cheese production stands at 77,848,600 pounds.
The 1850 census records reveal 90% of the state’s population lives on farms and 400,283 pounds of cheese are made in Wisconsin.
Pioneering Wisconsin farm wives begin making “kitchen” cheese from milk produced by their herds.
Colby cheese, a soft open textured cheese, is invented in Colby, Wisconsin by John Steinwand.
John Jossi, Swiss native from Dodge County, invents a Wisconsin original, brick cheese.
1841
1830s
Anne Pickett of Lake Mills makes the first official Wisconsin cheese by adding milk from her neighbor’s cows to that of her own small herd.
1850 1890 1899 1921 1935
192318881877
1885
1890Dairying achieves academic recognition with the establish-ment of the first dairy school in the nation at the University of Wisconsin-Madison.
Wisconsin becomes the first state to grade its cheese for quality. Quality assurance, coupled with Wiscon-sin’s central location for distribution, enables the industry to con-tinue to grow rapidly. By 1922, more than 2,800 cheese factories exist in the state.
Wisconsin becomes the first state to create rules and regulations for milk and other dairy products ensuring clean milk is entering the marketplace.
1920s
Masters G
allery
WH
I1986-cropped
WH
I24440-cropped
WH
I5585-cropped
UW
A-S00117
WH
I1940-cropped
UW
A-S05574
WH
I76303-cropped
WH
I4779-cropped
Photos courtesy of: Masters Gallery Foods, Inc.: Original Commissioned Artwork by Bruce Wolfe; Wisconsin State Historical Society (WHI); University of Wisconsin Archives (UWA); World Dairy Expo; Wisconsin Cheese Makers Association (WCMA).
WH
I26649-cropped
WH
I2166-cropped
WH
I2166-cropped

5
EatWisconsinCheese.com/history
19481939
1940
The legislature adds the phrase “America’s Dairyland” to the state’s license plates, a title that Wisconsin officially earned in 1930.
World D
airy Expo
WC
MA
1970Margaret McGuire becomes the first “Alice in Dairyland,” a program estab-lished to promote Wisconsin’s dairy industry nationwide. Today, Alice remains one of the state’s most visible dairy spokespeople.
The first World Dairy Expo is held in Madison, WI.
1967
The first organized dairy breakfast is held at Craig and Laura Beane’s farm in Jefferson County.
1983
WH
I6841
The “Belle of Wisconsin,” a mammoth, 20-ton block of cheddar, begins a yearlong tour of the United States.
1988
The Wisconsin Master Cheesemaker program is established. The program remains the only one of its kind in the country.
2001
1994
WMMB brings CowParade, the largest and most successful public art event around the world, to Wisconsin.
2006 2016
20172016Today, more than 9,500 dairy farms, with 1.28 million cows producing an average of 23,552 pounds of milk per year, continue the reputation for quality milk from Wisconsin.
Wisconsin dominates the World Champion-ship Cheese Contest and claims the World Champion Cheese title, judged the best cheese in the world.
Wisconsin cheese-makers continue their historic winning streak at the U.S. Championship Cheese Contest, sweeping the top awards and 31 competition classes.
WH
I25131-cropped
Wisconsin Governor Julius P. Heil signs the official proclamation for the state’s first observance of June Dairy Month.
WH
I99734-cropped
The Wisconsin Milk Marketing Board, (WMMB) an orga-nization created by dairy farmers to promote Wisconsin cheese and other dairy products across the nation, is formed.
WMMB and Wisconsin Dept. of Agriculture provide start-up fund-ing to establish UW Discovery Farms where on-farm and related research help to determine the economic and envi-ronmental effects of agricultural practices on a diverse group of Wisconsin farms.

*Preliminary. Source: NASS
62006 2008 2010 2012 2014 2016*
U.S. & Wisconsin Milk Production
Wisconsin Milk Production, 2016* 212.436 billion lbs. 30.123 billion lbs.
In 2016, Wisconsin milk production topped 30 billion pounds for the first time.
1. California 40.5 billion lbs.2. Wisconsin 30.1 billion lbs.3. New York 14.8 billion lbs.4. Idaho 14.7 billion l bs.5. Michigan 10.9 billion lbs.
U.S. Milk Production, 2016*
23.424.5
26.027.2
27.8
30.1
28.7%
2006-201
6*
1
4 2 5 3
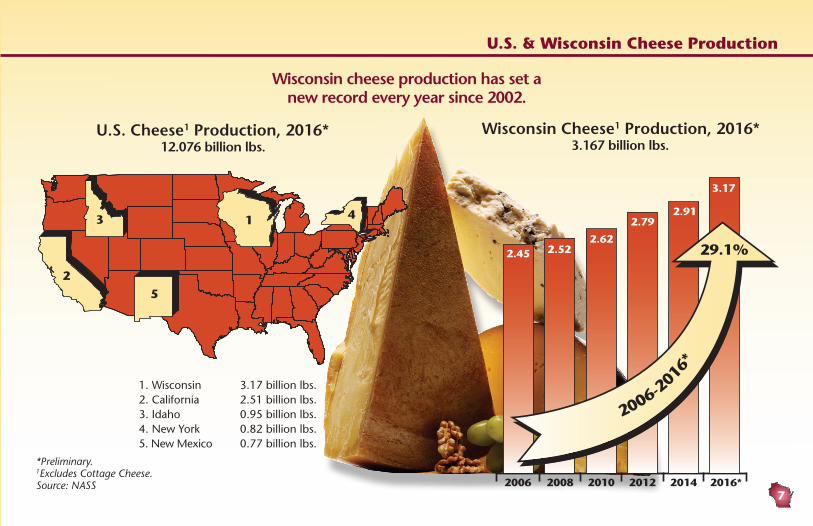
1. Wisconsin 3.17 billion lbs.2. California 2.51 billion lbs.3. Idaho 0.95 billion lbs.4. New York 0.82 billion lbs. 5. New Mexico 0.77 billion lbs.
*Preliminary. 1Excludes Cottage Cheese. Source: NASS
7
Wisconsin Cheese1 Production, 2016* 3.167 billion lbs.
2006 2008 2010 2012 2014 2016*
Wisconsin cheese production has set a new record every year since 2002.
2.45 2.522.62
2.792.91
3.17
29.1%
U.S. & Wisconsin Cheese Production
1 4
25
3
2006-201
6*
12.076 billion lbs.U.S. Cheese1 Production, 2016*

Total Cheese1 3,070,202,000 lbs. 25.4% 1 American Varieties 909,940,000 lbs. 18.7% 1 Cheddar 613,467,000 lbs. 17.4% 1 Italian Varieties 1,537,315,000 lbs. 29.4% 2 Mozzarella 1,051,356,000 lbs. 25.2% 2 Provolone 200,982,000 lbs. 53.2% 1 Parmesan 127,135,000 lbs. 40.6% 1 Romano 29,364,000 lbs. 60.2% 1 Brick and Muenster 64,022,000 lbs. 36.0% 1 Feta 86,751,000 lbs. 77.5% 1 Limburger 481,000 lbs. 100.0% 1 Hispanic 77,197,000 lbs. 29.0% 2 Specialty 722,101,000 lbs. 45.4% 1Processed Cheese 665,900,000 lbs. 52.6% 1Dry Whey, Human Food 308,582,000 lbs. 32.7% 1Milk 29,030,000,000 lbs. 13.5% 2Milk Cows 1,279,000 cows 13.7% 2
*Preliminary. 1Excludes Cottage Cheese. Source: WASS; NASS
Product % of U.S. RankWisconsin Production
Wisconsin’s Rank Among States in the Dairy Industry, 2015* World Cheese Production, 2015*42.225 billion lbs.
8
Wisconsin’s Dairy Ranking
United States
France
Germany
Wisconsin
Italy
11.84
4.54
2.75
3.07
4.57
*U.S. total includes WI production.
Source: NASS; EuroStat Online Database; USDA Foreign Agricultural Service, Production, Supply and Distribution Online Database
If Wisconsin were a country, it would rank 4th in world cheese
production.

9
1Includes only cow’s milk or mixed milk (including cow) cheese winners. 2Winners shown for all classes. Source: American Cheese Society; Wisconsin Cheese Makers Association
Recent Contest Results
American Cheese Society Contest, 2016 U.S. Championship Cheese Contest, 2017Percent of 241 Awards Given1 Percent of 306 Awards Given2
Wisconsin 35.7%
86Awards
All Other States31.5%
VT10.8%
OR5.0%
CA10.4%
Canada6.6%
Wisconsin 60.1%
184 Awards
All Other States14.7%
NY 8.2%
VT5.6%
CA4.9%
NM & OH(tie)3.3%
Wisconsin wins more awards in major cheese
contests than any other state.

*Pounds of milk-equivalent, milk-fat basis.
Source: USDA Economic Research Service (ERS), Food Availability (Per Capita) Data System; ERS, Dairy Data
Per Capita Consumption of Selected Dairy Products(lbs. of product per person)
1990 20051995 20102000 2015
1990 20051995 20102000 2015 1990 20051995 20102000 2015 1990 20051995 20102000 2015
1990 20051995 20102000 2015 1990 20051995 20102000 2015
All Products* Beverage Milk Butter
Cheese Yogurt Ice Cream
10
568
4.3
24.6
21.8
219
3.9
26.7
22.3
205
6.1
29.523.0
196
6.5
31.3 21.3
185
10.4
32.7 20.6
177
13.535.1
19.7
155
14.7
603
4.5570
4.6
6034.9
590
4.5
627 5.6
U.S. Dairy Product Consumption

11
Dairy’s Contribution to the Diet
*The quantity of milk used to produce one pound of each product depends primarily upon the milkfat content of the milk. Therefore, this chart is only an approximation.
Source: USDA
*The % Daily Value (DV) tells you how much a nutrient in a serving of food contributes to a daily diet. 2,000 calories a day is used for general nutrition advice.Source: USDA, Agricultural Research Service, 2016; USDA National Nutrient Database for Standard Reference, Release 28
How Much Whole Milk* Does it Take
to Make One Pound of:
Butter Cheese YogurtIce
CreamCottage Cheese

12
The Impact of Wisconsin Cheese
2005 2007 2009 2011 2013 2015*
361
504
399
575
640
722
Wisconsin Specialty Cheese Production (million lbs.)
9750
*Preliminary. Source: WASS; NASS
Specialty cheese accounts for 23.5% of the total cheese production in Wisconsin.
About 90% of Wisconsin milk is turned into cheese and about 90% of Wisconsin cheese is sold outside of the state.
Wisconsin accounts for 45% of all specialty cheese made in the United States.
8418 Excelsior DriveMadison, WI 53717608-836-8820
AmericasDairyland.com
Wisconsin is the only state that offers advanced education in cheesemaking. Of the 1,200 licensed cheesemakers, 70 have earned the right to be called ‘Master Cheesemakers.’
Over 100%
2005-2015*