numbers business template - dangmath.com · calculus bc ap/dual, revised ©2017...
TRANSCRIPT

LOGISTIC GROWTH
Section 6.3A
Calculus BC AP/Dual, Revised ©2017
7/30/2018 11:40 AM §6.3A: Logistic Growth 1

RECALL
Solve the logistic differential equation 𝒅𝑷
𝒅𝒕= 𝒌𝑷 𝟏 −
𝑷
𝑳.
7/30/2018 11:40 AM §6.3A: Logistic Growth 2
1dP P
kPdt L
= −
1
1
dP kdtP
PL
= −
1 1dP kdt
P L P
+ =
−

RECALL
Solve the logistic differential equation 𝒅𝒚
𝒅𝒕= 𝒌𝑷 𝟏 −
𝑷
𝑳.
7/30/2018 11:40 AM §6.3A: Logistic Growth 3
ln lnP L P kt C+ − = +
lnL P
kt CP
−= − −
kt CL Pe
P
− −−=
C ktL Pe e
P
− −−=
ktL PBe
P
−−=
1 kt
LP
Be−=
+

LOGISTIC CURVES
A. Logistics Differential Equation: 𝒅𝑷
𝒅𝒕= 𝒌𝑷 𝟏 −
𝑷
𝑳or
𝒅𝑷
𝒅𝒕= 𝒌𝑷 𝑳 − 𝑷 where
𝒌 will be multiplied and the inside is divided
B. The 𝒌 can be different depending on the use of the equation
C. Logical Growth Model: 𝑷 =𝑳
𝟏+𝑩𝒆−𝒌𝒕
1. 𝑳 = Carrying Capacity (Upper Horizontal LIMIT)
2. 𝑲 = Proportionality Constant
3. 𝑩 = Beginning Amount (arbitrary), use the equation: 𝑩 =𝑳−𝑷𝟎
𝑷𝟎where P0 is the initial
population
C. Point of Inflection: 𝒚 =𝑳
𝟐
7/30/2018 11:40 AM §6.3A: Logistic Growth 4

LOGISTIC GROWTH
7/30/2018 11:40 AM §6.3A: Logistic Growth 5

EXAMPLE 1
Given 𝒅𝑷
𝒅𝒕= 𝑷 𝟐 −
𝑷
𝟓𝟎𝟎𝟎identify the 𝒌 and 𝑳 of the equation.
7/30/2018 11:40 AM §6.3A: Logistic Growth 6
1dy y
kydt L
= −
1dP P
kPdt L
= −
25000
dP PP
dt
= −

EXAMPLE 1
Given 𝒅𝑷
𝒅𝒕= 𝑷 𝟐 −
𝑷
𝟓𝟎𝟎𝟎identify the 𝒌 and 𝑳 of the equation.
7/30/2018 11:40 AM §6.3A: Logistic Growth 7
25000
dP PP
dt
= −
( )2 500022 2
P
dPP
dt
= −
2 110000
dP PP
dt
= −
2
10,000
k
L
=
=

YOUR TURN
Given 𝒅𝑷
𝒅𝒕= 𝟎. 𝟎𝟏𝑷 𝟏𝟎𝟎 − 𝑷 identify the 𝒌 and 𝑳 of the equation.
7/30/2018 11:40 AM §6.3A: Logistic Growth 8
1
100
k
L
=
=

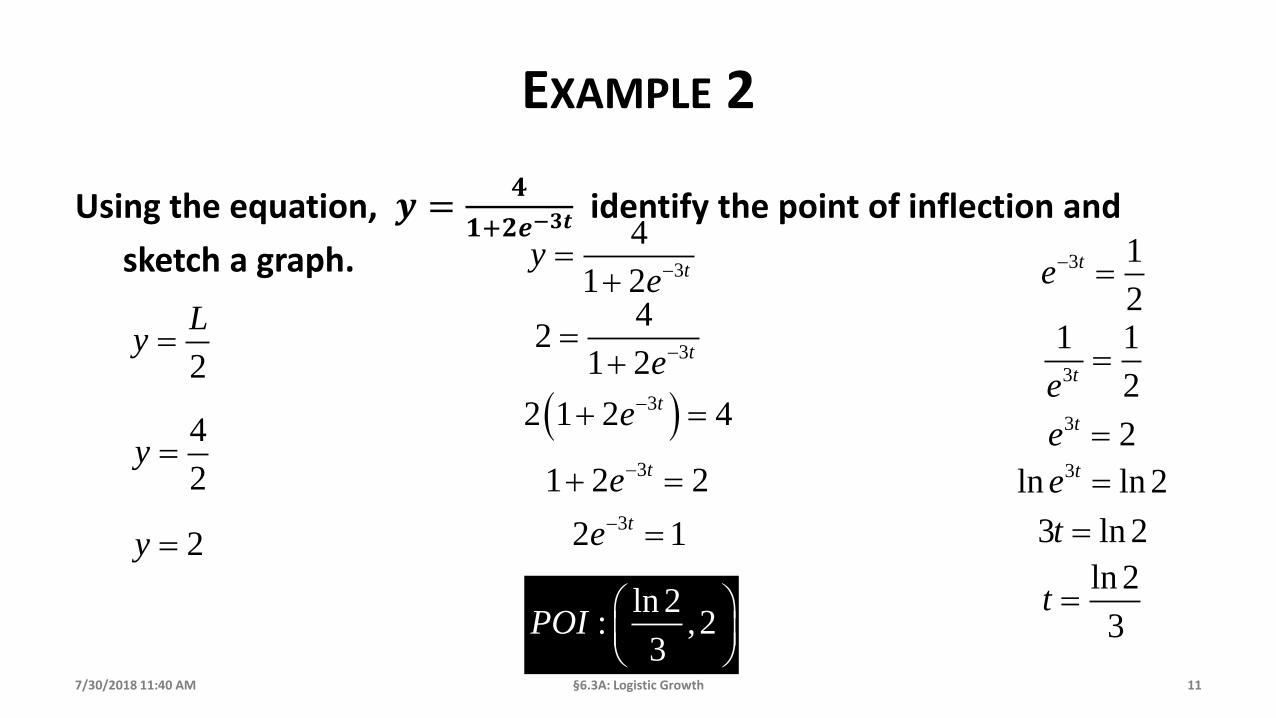
EXAMPLE 2
Using the equation, 𝒚 =𝟒
𝟏+𝟐𝒆−𝟑𝒕identify the point of inflection and
sketch a graph.
7/30/2018 11:40 AM §6.3A: Logistic Growth 9
( )1
34 1 2 ty e−
−= +
( ) ( ) ( )2
3 3' 4 1 1 2 6t ty e e−
− −= − + −
4, 2, 3L B and k= = =
3
3 3
4 2' 3
1 2 1 2
t
t t
ey
e e
−
− −
=
+ +
3
1' 3 1
1 2
using Long Division
ty y
e−
= −
+

EXAMPLE 2
Using the equation, 𝒚 =𝟒
𝟏+𝟐𝒆−𝟑𝒕identify the point of inflection and
sketch a graph.
7/30/2018 11:40 AM §6.3A: Logistic Growth 10
' 3 14
yy y
= −
( )3
4' 3 1
4 1 2 ty y
e−
= −
+
( ) ( )3 0
4 4; 0
31 2y y
e−
= =+
3
1' 3 1
1 2
using Long Division
ty y
e−
= −
+
EXAMPLE 2
Using the equation, 𝒚 =𝟒
𝟏+𝟐𝒆−𝟑𝒕identify the point of inflection and
sketch a graph.
7/30/2018 11:40 AM §6.3A: Logistic Growth 11
2
Ly =
4
2y =
2y =
3
4
1 2 ty
e−=
+
3
42
1 2 te−=
+
( )32 1 2 4te−+ =
31 2 2te−+ =32 1te− =
3 1
2
te− =
3
1 1
2te=
3 2te =3ln ln 2te =
3 ln 2t =
ln 2
3t =ln 2
: ,23
POI

EXAMPLE 2
Using the equation, 𝒚 =𝟒
𝟏+𝟐𝒆−𝟑𝒕identify the point of inflection and
sketch a graph.
7/30/2018 11:40 AM §6.3A: Logistic Growth 12
ln 2: ,2
3POI
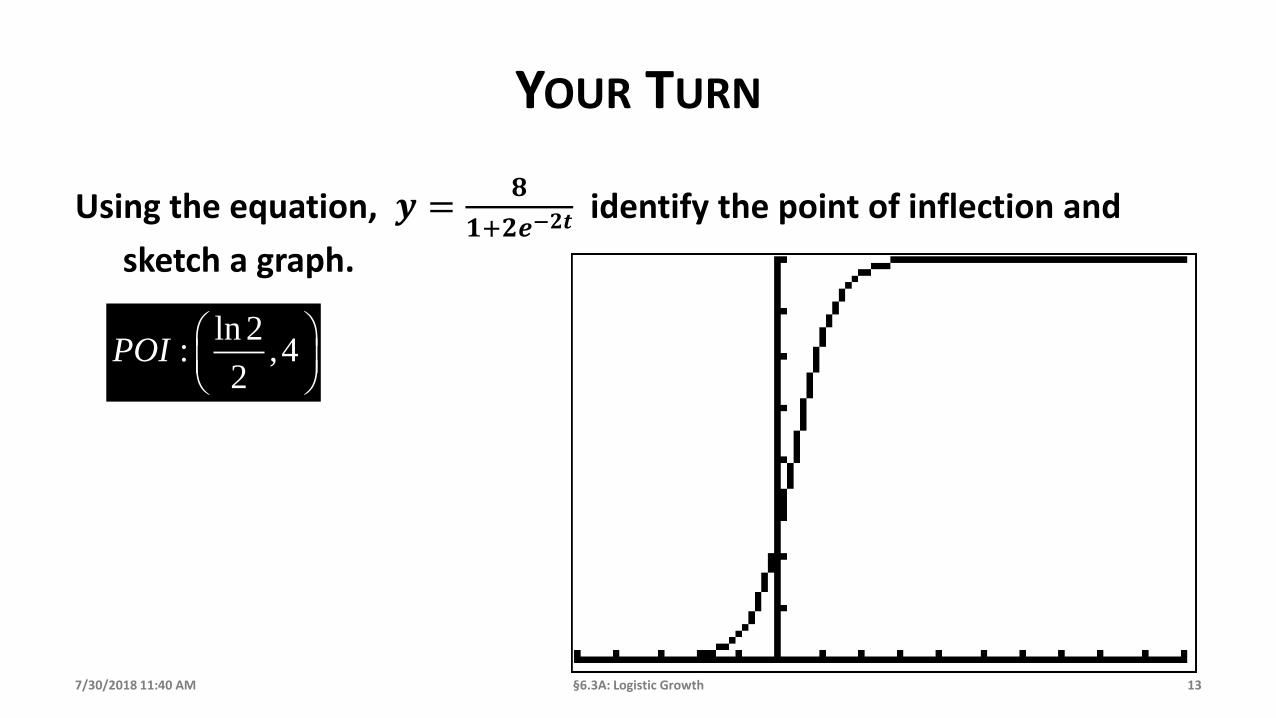
YOUR TURN
Using the equation, 𝒚 =𝟖
𝟏+𝟐𝒆−𝟐𝒕identify the point of inflection and
sketch a graph.
7/30/2018 11:40 AM §6.3A: Logistic Growth 13
ln 2: ,4
2POI

EXAMPLE 3
A state game commission releases 40 elk into a game refuge. After 5 years, the elk population is 104. The commission believes that the environment can support no
more than 4000 elk. The growth rate of the elk population, 𝒑, is: 𝒅𝑷
𝒅𝑻=
𝒌𝑷 𝟏 −𝑷
𝟒𝟎𝟎𝟎, 𝟒𝟎 ≤ 𝒑 ≤ 𝟒𝟎𝟎𝟎 where 𝒕 is the number of years.
A. Write a model for the elk population in terms of 𝒕.
B. Estimate the elk population in 15 years.
C. Find the limit of the model as 𝒕 → ∞.
7/30/2018 11:40 AM §6.3A: Logistic Growth 14

EXAMPLE 3A
A state game commission releases 40 elk into a game refuge. After 5 years, the elk population is 104. The commission believes that the environment can support no
more than 4000 elk. The growth rate of the elk population, 𝒑, is: 𝒅𝑷
𝒅𝑻=
𝒌𝑷 𝟏 −𝑷
𝟒𝟎𝟎𝟎, 𝟒𝟎 ≤ 𝒑 ≤ 𝟒𝟎𝟎𝟎 where 𝒕 is the number of years.
A. Write a model for the elk population in terms of 𝒕.
7/30/2018 11:40 AM §6.3A: Logistic Growth 15
1 ,40 40004000
4000, ??, B ??
dP Pkp P
dt
L k
= −
= = =
1 kt
Ly
Be−=
+
4000
1 ktP
Be−=
+
( )0
400040
1k
Be−
=+
( )( )040 1 4000
kBe
−+ =
40 40 4000B+ =
40 3960B =
99B =
4000
1 99 ktP
e−=
+
1 ,40 40004000
4000, ??,B 99
dP PkP P
dt
L k
= −
= = =

4000
1 99 ktP
e−=
+
EXAMPLE 3A
A state game commission releases 40 elk into a game refuge. After 5 years, the elk population is 104. The commission believes that the environment can support no more than 4000 elk. The growth
rate of the elk population, p, is: 𝒅𝑷
𝒅𝑻= 𝒌𝑷 𝟏 −
𝑷
𝟒𝟎𝟎𝟎, 𝟒𝟎 ≤ 𝒑 ≤ 𝟒𝟎𝟎𝟎 where t is the number of
years.
A. Write a model for the elk population in terms of 𝒕.
7/30/2018 11:40 AM §6.3A: Logistic Growth 16
4000
1 99 kty
e−=
+
( )5
4000104
1 99k
e−
=+
( )5104 1 99 4000ke−+ =
5 40001 99
104
ke−+ =
5 400099 1
104
ke− = −
599 37.5
99 99
ke−
=
0.1942k 0.1942
4000
1 99 tP
e−=
+
1 ,40 40004000
4000, ??, B 99
dP Pkp P
dt
L k
= −
= = =
5 37.5
99
ke− =
5
1 37.5
99ke=
( ) 537.5 99ke =
5 2.64ke =
5ln ln 2.64ke =
5 ln 2.64
5 5
k=
1 ,40 40004000
4000, 0.1942,B 99
dP PkP P
dt
L k
= −
= =

EXAMPLE 3B
A state game commission releases 40 elk into a game refuge. After 5 years, the elk population is 104. The commission believes that the environment can support no more than 4000 elk. The growth
rate of the elk population, p, is: 𝒅𝑷
𝒅𝑻= 𝒌𝑷 𝟏 −
𝑷
𝟒𝟎𝟎𝟎, 𝟒𝟎 ≤ 𝒑 ≤ 𝟒𝟎𝟎𝟎 where t is the number of
years.
B. Estimate the elk population in 15 years.
7/30/2018 11:40 AM §6.3A: Logistic Growth 17
1 ,40 40004000
4000, ??, B ??
dP Pkp P
dt
L k
= −
= = =( )0.1942 15
4000
1 99P
e−
=+
627.2598 elk0.1942
4000
1 99 tP
e−=
+
1 ,40 40004000
4000, ??, B 99
dP Pkp P
dt
L k
= −
= = =

EXAMPLE 3C
A state game commission releases 40 elk into a game refuge. After 5 years, the elk population is 104. The commission believes that the environment can support no more than 4000 elk. The growth
rate of the elk population, p, is: 𝒅𝑷
𝒅𝑻= 𝒌𝑷 𝟏 −
𝑷
𝟒𝟎𝟎𝟎, 𝟒𝟎 ≤ 𝒑 ≤ 𝟒𝟎𝟎𝟎 where t is the number of
years.
C. Find the limit of the model as 𝒕 → ∞.
7/30/2018 11:40 AM §6.3A: Logistic Growth 18
1 ,40 40004000
4000, ??, B ??
dP Pkp P
dt
L k
= −
= = =
( )0.1942
4000lim
1 99tt e
−→ +
4000
0.1942
4000
1 99 tP
e−=
+1 ,40 4000
4000
4000, ??,B 99
dP PkP P
dt
L k
= −
= = =

EXAMPLE 4
Suppose the population of bears in a national park grows according to
the logistic differential equation, 𝒅𝑷
𝒅𝑻= 𝟓𝑷 − 𝟎. 𝟎𝟎𝟐𝑷𝟐 , where 𝑷 is
the number of bears at time 𝒕 in years. Find the limit of the model as 𝒕 → ∞ where 𝑷 𝟎 = 𝟏𝟎𝟎.
7/30/2018 11:40 AM §6.3A: Logistic Growth 19
1dP P
kPdt L
= −
( )0.002
2500lim
1 24tx e
−→ +2500
25 0.002dP
P Pdt
= −( )0.002
2500100
1 24
24
te
B
−=
+
=
5 12500
dP PP
dt
= −
25 0.002
5 5
dP P P
dt= −

YOUR TURN
Ten grizzly bears were introduced to a national park 10 years ago. There are 23 bears in the park at the present time. The park can support a maximum of 100 bears. Assuming a logistic growth model, when will the bear population reach 50? 75? 100?
7/30/2018 11:40 AM §6.3A: Logistic Growth 20
1 kt
LP
Be−=
+
( )100 0
10010
1 Be−
=+
( )0,10
( )10,23
10010
1 B=
+
10 10 100B+ =
10 90B =
9B =
100
1 9 ktP
e−=
+
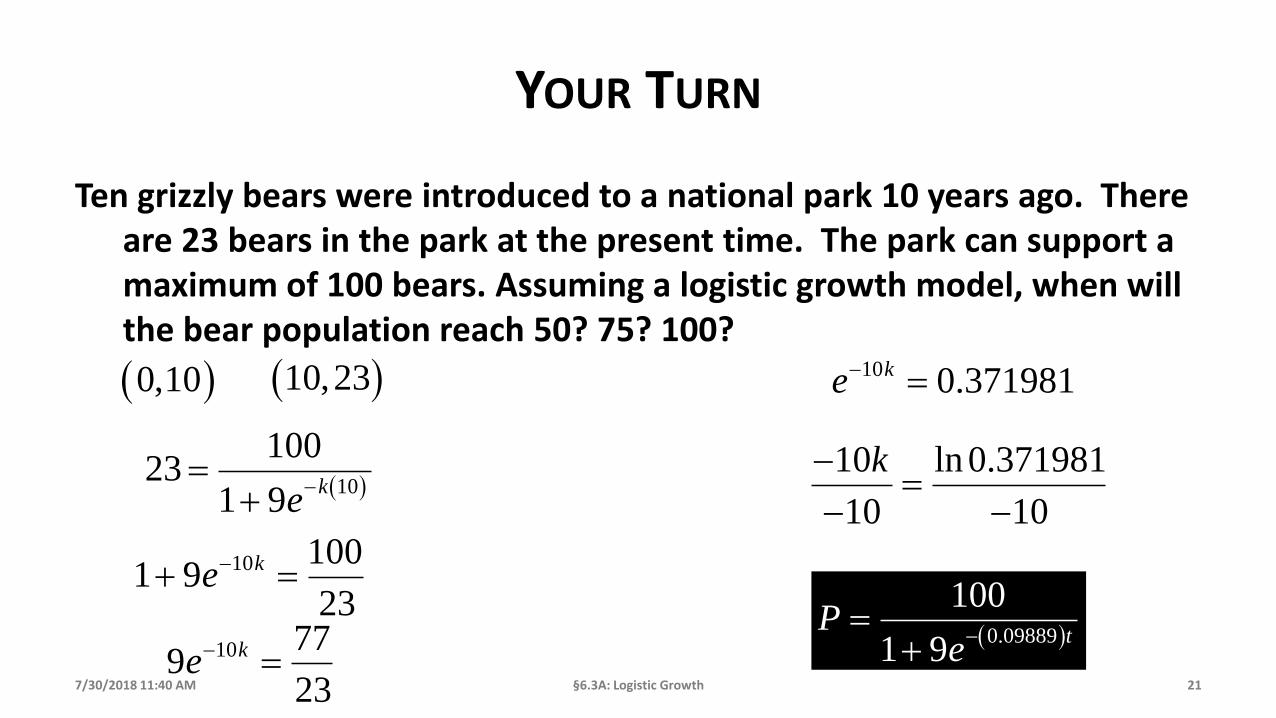
YOUR TURN
Ten grizzly bears were introduced to a national park 10 years ago. There are 23 bears in the park at the present time. The park can support a maximum of 100 bears. Assuming a logistic growth model, when will the bear population reach 50? 75? 100?
7/30/2018 11:40 AM §6.3A: Logistic Growth 21
10 1001 9
23
ke−+ =
10 779
23
ke− =
10 0.371981ke− =
( )0.09889
100
1 9t
Pe−
=+
( )0,10 ( )10,23
( )10
10023
1 9k
e−
=+
10 ln 0.371981
10 10
k−=
− −

YOUR TURN
7/30/2018 11:40 AM §6.3A: Logistic Growth 22
0
20
40
60
80
100
20 40 60 80 100Years
Bears
𝒀 = 𝟓𝟎 𝒂𝒕 𝟐𝟐 𝒚𝒆𝒂𝒓𝒔
𝒀 = 𝟕𝟓 𝒂𝒕 𝟑𝟑 𝒚𝒆𝒂𝒓𝒔
𝒀 = 𝟏𝟎𝟎 𝒂𝒕 𝟕𝟓 𝒚𝒆𝒂𝒓𝒔
( )0.09889
100
1 9t
Pe−
=+

EXAMPLE 5
In a particular town of 100,000 residents, 20,000 watched a viral video on the Internet. The rate of growth of the spread of information was jointly proportional to the amount of people who had not watched it. If 50% watched it after one hour, how long does 80% of the population watched the viral video?
7/30/2018 11:40 AM §6.3A: Logistic Growth 23
1 kt
LP
Be−=
+
100,000 20,000
20,000B
−=
( )
( )
100,000
?
0,20000
1,50000
L
B
=
=
4B =
( )100,000
1 4 ktP t
e−=
+

EXAMPLE 5
In a particular town of 100,000 residents, 20,000 watched a viral video on the Internet. The rate of growth of the spread of information was jointly proportional to the amount of people who had not watched it. If 50% watched it after one hour, how long does 80% of the population watched the viral video?
7/30/2018 11:40 AM §6.3A: Logistic Growth 24
( )1
100,00050,000
1 4k
e−
=+
( )50,000 1 4 100,000ke+ =
1 4 2ke−+ =
( )
( )
100,000
?
0,20000
1,50000
L
B
=
=( )100,000
1 4 ktP t
e−=
+

EXAMPLE 5
In a particular town of 100,000 residents, 20,000 watched a viral video on the Internet. The rate of growth of the spread of information was jointly proportional to the amount of people who had not watched it. If 50% watched it after one hour, how long does 80% of the population watched the viral video?
7/30/2018 11:40 AM §6.3A: Logistic Growth 25
1 4 2ke−+ =
4 1ke− =1
4
ke− =
( )
( )
100,000
?
0,20000
1,50000
L
B
=
=
1 1
4ke=
4ke =

EXAMPLE 5
In a particular town of 100,000 residents, 20,000 watched a viral video on the Internet. The rate of growth of the spread of information was jointly proportional to the amount of people who had not watched it. If 50% watched it after one hour, how long does 80% of the population watched the viral video?
7/30/2018 11:40 AM §6.3A: Logistic Growth 26
( )
( )
100,000
?
0,20000
1,50000
L
B
=
=4ke =
( ) ( )ln 4
100,000
1 4t
P te−
=+
ln 4k =
ln 4
100,00080,000
1 4 te−=
+
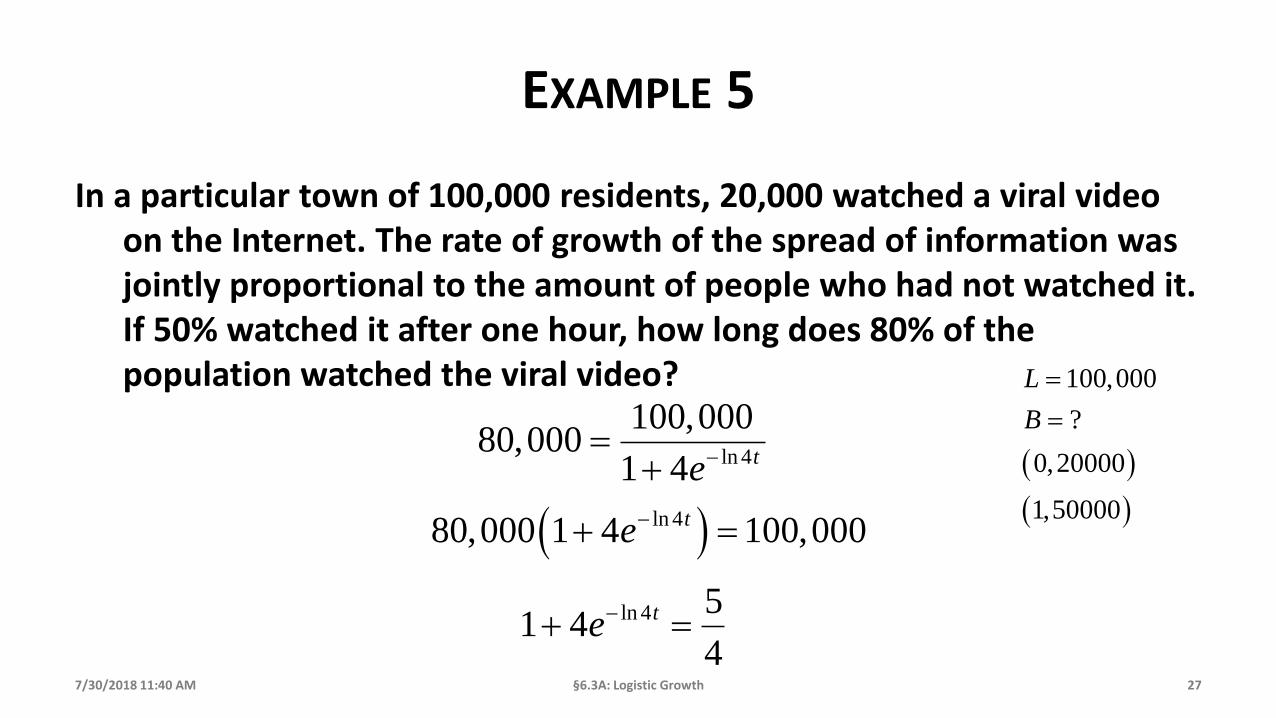
EXAMPLE 5
In a particular town of 100,000 residents, 20,000 watched a viral video on the Internet. The rate of growth of the spread of information was jointly proportional to the amount of people who had not watched it. If 50% watched it after one hour, how long does 80% of the population watched the viral video?
7/30/2018 11:40 AM §6.3A: Logistic Growth 27
ln 4
100,00080,000
1 4 te−=
+
( )ln 480,000 1 4 100,000te−+ =
ln 4 51 4
4
te−+ =
( )
( )
100,000
?
0,20000
1,50000
L
B
=
=

EXAMPLE 5
In a particular town of 100,000 residents, 20,000 watched a viral video on the Internet. The rate of growth of the spread of information was jointly proportional to the amount of people who had not watched it. If 50% watched it after one hour, how long does 80% of the population watched the viral video?
7/30/2018 11:40 AM §6.3A: Logistic Growth 28
ln 4 1
16
te− =
ln 4 1ln ln
16
1ln
16ln 4ln 4
te
t
− =
= −
2 t hours=
ln 4 14
4
te− =
ln 4 1
16
te− =
( )( )ln 4 1
16
te
−= ( )
( )
100,000
?
0,20000
1,50000
L
B
=
=ln 4 51 4
4
te−+ =

AP MULTIPLE CHOICE PRACTICE QUESTION 1 (NON-CALCULATOR)
Which of the following differential equations for a population could model the logistic growth equation for the graph below?
(A) 𝒅𝑷
𝒅𝒕= 𝟎. 𝟐𝑷 − 𝟎. 𝟎𝟎𝟏𝑷𝟐
(B) 𝒅𝑷
𝒅𝒕= 𝟎. 𝟏𝑷 − 𝟎. 𝟎𝟎𝟏𝑷𝟐
(C) 𝒅𝑷
𝒅𝒕= 𝟎. 𝟐𝑷𝟐 − 𝟎. 𝟎𝟎𝟏𝑷
(D) 𝒅𝑷
𝒅𝒕= 𝟎. 𝟏𝑷𝟐 − 𝟎. 𝟎𝟎𝟏𝑷
7/30/2018 11:40 AM §6.3A: Logistic Growth 29

AP MULTIPLE CHOICE PRACTICE QUESTION 1 (NON-CALCULATOR)
Which of the following differential equations for a population could model the logistic growth equation for the graph below?
7/30/2018 11:40 AM §6.3A: Logistic Growth 30
Vocabulary Connections and Process
Logistic Growth
Equation( )1 ; 200
200
dP P dPkP kP P
dt dt
= − = −
2
200
dP kPkP
dt= −
2
)
0.2 0.001
0.2
10.2 1 0.2
200 1000
A
dPP P
dt
k
dP PP P P
dt
= −
=
= − = −
2
)
0.1 0.001
0.1
10.1 1 0.1
200 2000
B
dPP P
dt
k
dP PP P P
dt
= −
=
= − −

AP MULTIPLE CHOICE PRACTICE QUESTION 1 (NON-CALCULATOR)
Which of the following differential equations for a population could model the logistic growth equation for the graph below?
7/30/2018 11:40 AM §6.3A: Logistic Growth 31
Connections and Process Answer
( )1 ; 200200
dP P dPkP kP P
dt dt
= − = −
2
200
dP kPkP
dt= −
2
)
0.2 0.001
0.001
10.001 1 0.001
200 200000
C
dPP P
dt
k
dP PP P P
dt
= −
=
= − −
2
)
0.1 0.001
0.001
10.001 1 0.001
200 200000
D
dPP P
dt
k
dP PP P P
dt
= −
=
= − −
A

ASSIGNMENT
Worksheet
7/30/2018 11:40 AM §6.3A: Logistic Growth 32