numerical analysis of blood flow through multiple stenosis ... · zahraa a. nadeem1, sadoun f....
TRANSCRIPT

International Journal of Applied Engineering Research ISSN 0973-4562 Volume 13, Number 22 (2018) pp. 16064-16071
© Research India Publications. http://www.ripublication.com
16064
Numerical Analysis of Blood Flow through Multiple Stenosis Right
Coronary Artery
Zahraa A. Nadeem1, Sadoun F. Dakhil 2, Hassan M. Abdullah 3
1 Department of Thermal Mechanical Engineering, Engineering Technical College, Sothern Technical University, Basra, Iraq
2 Department of Fuel & Energy Engineering, Engineering Technical College, Sothern Technical University, Basra, Iraq
3 Basra Cardiac Center, Basra, Iraq
Abstract
The effect of stenosis on pulsatile blood flow through multiple
stenosis right coronary artery (RCA) was found by using
computational fluid dynamics (CFD). The data of this study
were taken from Catheterization Laboratory in Basra Cardiac
Center. The case used is for woman has three stenosis in her
RCA with different stenosis ratios which are; 75.15%, 41.21%,
and 32.09% respectively. A non-Newtonian blood model
characterized by Carreau equation, as well as Newtonian model
of blood viscosity was used in the flow simulation. The
simulations were performed by using ANSYS FLUENT
software based on the finite volume method. The study shows
that, non-Newtonian viscosity of blood flow is inversely
proportional with shear rate distributions and its effects
occurring close to the centerline of flow. The hemodynamics
characteristics (velocity, pressure drop, and wall shear stress)
increases with increase stenosis ratio for multiple stenosis
RCA. In addition, comparison between two viscosity models
shows very similar behavior for axial velocity profile, also the
non-Newtonian property strengthen the peak values of WSS
and increasing pressure drop.
Keywords: Pulsatile flow; Non-Newtonian; Hemodynamic
characteristics; Right coronary artery; Multiple stenosis.
1. INTRODUCTION
Recent developments in the field of computational fluid
dynamics CFD have capability to simulate the blood flow in the
cardiovascular system. Computer can show you the flow
pattern of blood for a various disease artery. Therefore, CFD is
nowadays become a clinical diagnostic tool for the medical
practicing throughout the region of vascular diseases.
Blood does the main functions of delivering nutrients and
oxygen to all the human tissues, protecting the body against
infection by removing waste products through the work of
antibodies. The heart is hollow muscular organ responsible for
providing the driving pump to move blood in body, the heart is
composed of two separate pumps: a left heart that pumps blood
through systemic circulation that provides blood to all organs
and tissues of the body except lungs, and a right heart that
pumps blood in pulmonary circulation that provides blood to
lungs. Each of these hearts is a pulsatile two separate pump
composed of an atrium and a ventricle [1]. Arterial stenosis is
a partial occlusion of the artery caused by abnormal growth of
tissues or plaque build-up on the arterial wall which cause
atherosclerosis, this plaque cause a narrowing of the arterial
passage [2].
There were strong proof that hemodynamic factors like; flow
recirculation, flow separation, low and oscillatory wall shear
stress (WSS), and changes in the rheological properties of
blood and its components, play a main role in the development
and progression of atherosclerotic and other arterial lesions [3].
X. Xu and M. Collins (1994) [4], and T. Ishikawa et al. (1998)
[5] they were investigated the effects of the non-Newtonian
viscosity of blood flow in general three-dimensional arterial
bifurcation, they found that the duration of flow separation is
shorter and the reverse flow is weaker with the non-Newtonian
fluid compared with Newtonian fluid except this it does not
have significant effects on the basic features of the flow field.
B. Johnston et al. (2006) [6] seen transient study of pulsatile
blood flow through four right coronary arteries using both the
Newtonian and non-Newtonian models used was the
Generalised Power Law of blood viscosity, the results shows a
little practical difference between Newtonian and non-
Newtonian models of blood viscosity about 30% of the cardiac
cycle. Rabby et al., (2013) [7] find out how pulsatile blood flow
behaves in arterial stenosis, they found how pressure drops at
stenosis and its shear stress increases suddenly at the center of
the stenosis. Jahangiri et al, (2018) [8] presented the behavior
of hemodynamic parameters of blood by using six non-
Newtonian models and compared the results with Newtonian
model, they found that Walburn-Schneck and Power-law
models have the lowest axial velocity, pressure difference, and
shear stress as compared with other viscosity models.
A number of researchers have studied the flow of blood through
single stenosis arteries as illustrated in the upper part, but a very
few researchers have studied blood flow through multiple
stenosis arteries. One of the important factors that effect on
blood flow through arteries is the geometry of the artery. In the
present study, we show hemodynamic parameters behavior for
blood characterized by Carreau model that flow through real
multiple stenosis arterial geometric. Moreover, compare the
effects of two viscosity models (Carreau and Newtonian) on
hemodynamic factors.

International Journal of Applied Engineering Research ISSN 0973-4562 Volume 13, Number 22 (2018) pp. 16064-16071
© Research India Publications. http://www.ripublication.com
16065
2. METHOD
2.1. Right Coronary Artery
Coronary arteries are the blood vessels which deliver the
oxygenated blood to the cardiac muscles. The left coronary
artery supplies the left lateral and anterior portions of the left
ventricle, while the right coronary artery supplies the right
ventricle and the posterior part of the left ventricle [1].
Coronary arteries in the human body will generally curve and
bend. As seen from x-ray pictures in Fig. (1). The data was
taken from Catheterization Laboratory in Basra Cardiac Center.
The picture shows that this patient has a three stenosis in RCA
with stenosis ratios 75.15%, 41.21%, and 32.09% respectively.
In order to study the hemodynamics of flow through RCA, we
need to simplify the geometry while keeping the essential
features intact. Two-dimensional blood flow through rigid
RCA walls was numerically simulated. AutoCAD 2013
software is used to modeling RCA, with a scale appropriate
with RCA dimensions.
Figure 1: Multiple Stenosis RCA.
2.2 Governing Equations
The governing equations represent mathematical statement of
conservation laws of physics, which were used to formulate a
solution based on the flow properties and the boundary
conditions. The continuity and momentum equations for two-
dimensional, unsteady, incompressible, and laminar flow are
written respectively as follows [9]:
The Continuity Equation:
𝜕𝑢
𝜕𝑥+
𝜕𝑣
𝜕𝑦= 0 (1)
The Momentum Equations:
X-Direction:
𝜌 (𝜕𝑢
𝜕𝑡+ 𝑢
𝜕𝑢
𝜕𝑥+ 𝑣
𝜕𝑢
𝜕𝑦) = −
𝜕𝑝
𝜕𝑥+ 𝜇 (
𝜕2𝑢
𝜕𝑥2 +𝜕2𝑢
𝜕𝑦2) (2)
Y-Direction:
𝜌 (𝜕𝑣
𝜕𝑡+ 𝑢
𝜕𝑣
𝜕𝑥+ 𝑣
𝜕𝑣
𝜕𝑦) = −
𝜕𝑝
𝜕𝑦+ 𝜇 (
𝜕2𝑣
𝜕𝑥2 +𝜕2𝑣
𝜕𝑦2) (3)
Where u and v velocity components in x and y directions
respectively, p is pressure, 𝜌 is the density of blood, and 𝜇 is
blood viscosity.
2.3 Flow Conditions
The governing equations normally contain arbitrary functions,
and to solve governing equations a set of boundary conditions
are required. It was assumed that initially no flow takes place
when the system is at rest. The boundary conditions (t>0) can
be summarized as follows:
Inlet RCA: using mean pressure readings were appearing in
monitor’s screen when catheter reaches RCA in Catheterization
Laboratory. Pressure reading at artery inlet is 16998.3 Pa
(127.5 mmHg).
RCA Walls: On the rigid walls of the RCA were assumed, the
no-slip condition is imposed on the velocities.
𝑢 = 𝑣 = 0 (4)
Outlet RCA: unsteady parabolic velocity profile was
imposed. The outlet velocity was provided in a sine waveform
Equation for the pulsatile flow simulations, and it is
represented by the following equation [10]:
𝑈(𝑡) = 0.25 [1 + sin (2𝜋𝑡
𝑇)] (5)
Where t is a local time and T is the period of oscillation time.
In the present study T=0.8s.
2.4 Non-Newtonian Model
Non-Newtonian blood flow was modeled as Carreau viscosity
model. Which is the most popular models in non-Newtonian
blood modeling. The complex rheological behavior of blood is
approximated using a shear-thinning model by the Carreau
model [11]:
𝜇 = 𝜇∞ + (𝜇0 − 𝜇∞)[1 + (𝜆�̇�)2](𝑛−1) 2⁄ (6)
Where: 𝜇0 = 0.056 𝑃𝑎. 𝑠 is zero shear viscosity, 𝜇∞ =0.0035 𝑃𝑎. 𝑠 infinite shear viscosity, 𝜆 = 3.313 𝑠 is time
constant, n= 0.6 flow behavior index, and �̇� is the shear rate
tensor was given as [11]:
�̇� = √1
2∑ ∑ 𝑑𝑖𝑗𝑑𝑗𝑖𝑗𝑖 (7)
Where 𝑑𝑖𝑗 is the rate of deformation tensor. Final shape of the
shear rate tensor for 2D (x-y) is:
�̇� = [2 (𝜕𝑢
𝜕𝑥)
2
+ 2 (𝜕𝑣
𝜕𝑦)
2
+ (𝜕𝑣
𝜕𝑥+
𝜕𝑢
𝜕𝑦)
2
]
1
2 (8)
2.5 Computational Details
The 2D unsteady Navier-Stokes equations were solved by
means of a commercial CFD package FLUENT 15.0 based on
the finite volume method. The upwind differencing scheme was
employed for all equations and the velocity-pressure coupling
algorithm was SIMPLE (Semi-Implicit Method for Pressure

International Journal of Applied Engineering Research ISSN 0973-4562 Volume 13, Number 22 (2018) pp. 16064-16071
© Research India Publications. http://www.ripublication.com
16066
Linked Equations) in the CFD calculations. For this study, 80
time steps per cycle were chosen, with 0.01 time step size.
3. RESULTS AND DISCUSSION
Transient simulations were performed for each of the three
arteries described above. Each simulation was from t=0 to 0.8s,
yielding a heart rate of 75 beats per minute. The simulations
were performed using Carreau blood viscosity model with
additional simulation performed using a Newtonian model.
This simulation is used to study the difference between the two
viscosity models. The waveform in Fig. (2) represent velocity
equation at artery outlet and can be divided into four different
phases; early systole, peak systole, early diastole and peak
diastole corresponded to 𝑡
𝑇 = 0, 0.25, 0.5, and 0.75 respectively.
Velocity, pressure drops, and wall shear stress (WSS)
distributions results are presented in this section.
Figure 2: Velocity waveform at the artery outlet.
3.1 Non-Newtonian Viscosity
The dynamic viscosity distributions at four phases (early
diastolic, peak diastolic, early systolic, and peak systolic) with
in one cardiac cycle of blood flow through multiple stenosis
RCA are show in fig. (3). They would seem that more of the
flow region has a viscosity near to the Newtonian viscosity
value (0.00345 Pa.s), as observed by the majority of the
contours plot falling within the legend containing the non-
Newtonian viscosity values. This deduces that the majority of
the flow has a high shear rate, in which blood losses its non-
Newtonian properties.
The regions in which the non-Newtonian viscosity is more
dominate, is the regions close to the centerline of flow. There
is a noticeable peak in viscosity values at this place, which
corresponds to the place of highest viscosity. Where blood flow
there is shear forces from the boundary layer resist flow
therefore, a high shear occurs near the wall but low shear rates
exists near the centerline of flow. These regions of high
viscosity dose not vary with time of cardiac cycle, particularly
they clearly seen in peak systolic phase of cardiac cycle, which
is the end-deceleration phase where velocity are very low.
Mean viscosity values at peak diastolic phase at throats of
multiple stenosis RCA are 0.00366, 0.00393, and 0.00396 Pa.s
for 75.15%, 41.21% and 32.09% respectively. From these
result we can conclude that blood flow viscosity decreases with
increases stenosis ratio of RCA because of increasing shear rate
as stenosis ratio increase in stenosis regions.
Figure 3: Viscosity counters of multiple stenosis RCA for one
cardiac cycle.
3.2 Velocity Distribution
The velocity distributions results are shown at four phases
(early diastolic, peak diastolic, early systolic, and peak systolic)
with in one cardiac cycle. Fig.(4) presents the mean velocity
along the length of multiple stenosis RCA, it seen that the
magnitudes of mean velocities are larger during peak diastolic
phase, and velocity value increase as blockage artery increase.
Peak velocity value at 75.15% stenosis is 53% larger than peak
velocity value at 41.21% stenosis and 56% larger than peak
velocity value at 32.09% stenosis. Opposite of peak diastolic
phase is peak systolic phase, in this phase velocity value
decreases as blockage artery increase reach minimum value
0.0135 m/s at the throat of 75.15% stenosis due to reverse flow
during peak systolic phase.
Figure 4: Mean velocity along length of multiple stenosis
RCA during one cardiac cycle.
To show the effects of stenosis ratio on axial velocity profiles
in multiple stenosis RCA, Fig.(5) (a)-(c) present axial velocity
profiles during four phases of one cardiac cycle and at three
locations; at throats of 75.15% , 41.21%, and 32.09 % stenosis

International Journal of Applied Engineering Research ISSN 0973-4562 Volume 13, Number 22 (2018) pp. 16064-16071
© Research India Publications. http://www.ripublication.com
16067
respectively. As stenosis ratio increase the effect of jet flow
increase and axial velocity profiles becomes uniform,
furthermore RCA is sinuate so the effects of curvatures cause
inclined velocity profiles.
(a) At throat of 75.15% stenosis (b) At throat of 41.21% stenosis
(c) At throat of 32.09% stenosis
Figure 5: Axial velocity profiles for the three stenosis of multiple stenosis RCA during one cardiac cycle.
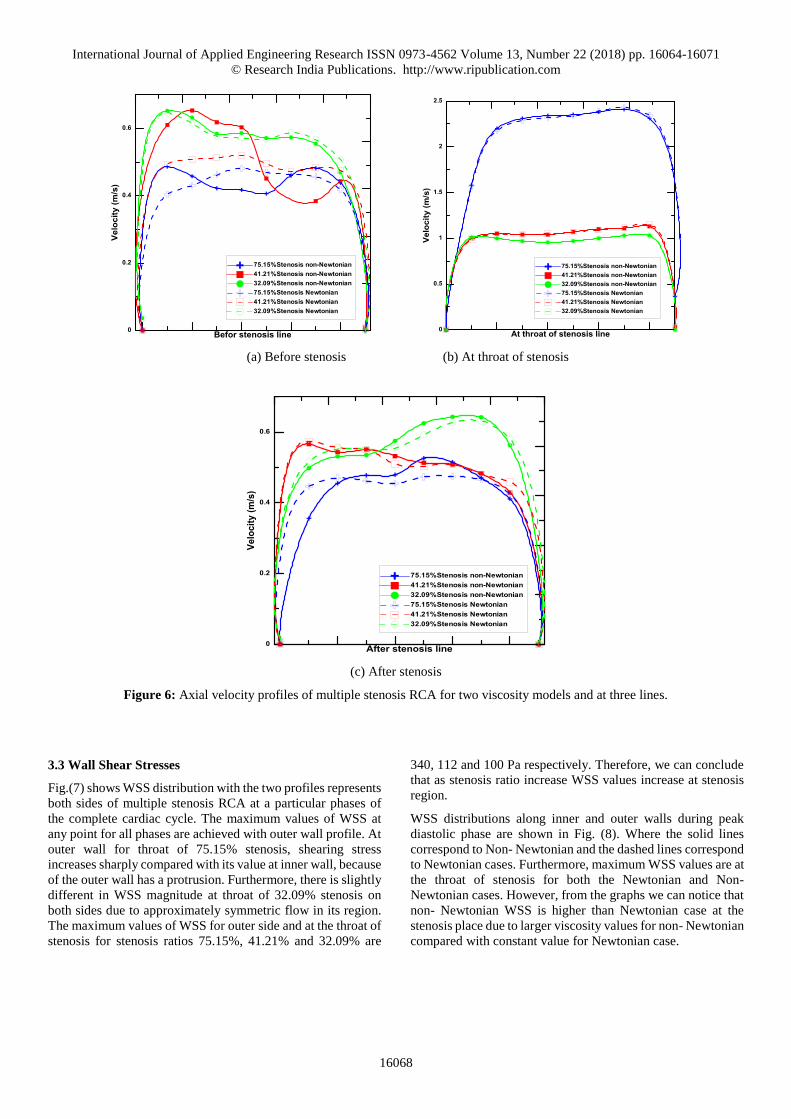
In Fig. (6), here we can observe the velocity profile of the
Newtonian and non-Newtonian models through multiple
stenosis RCA for three different axial locations and at peak
diastolic phase. Very little variation occurred between the two
models at the throat of stenosis and largest difference occurred
in the before stenosis lines during the low velocity portion. It
can be observed that the axial velocity profiles in non-
Newtonian model will be bending inwards in comparison with
Newtonian model. Because of non-Newtonian fluid provides
higher resistance to flow due to increase viscosity values
toward centerline of blood flow compared with constant
viscosity value to Newtonian model.
International Journal of Applied Engineering Research ISSN 0973-4562 Volume 13, Number 22 (2018) pp. 16064-16071
© Research India Publications. http://www.ripublication.com
16068
(a) Before stenosis (b) At throat of stenosis
(c) After stenosis
Figure 6: Axial velocity profiles of multiple stenosis RCA for two viscosity models and at three lines.
3.3 Wall Shear Stresses
Fig.(7) shows WSS distribution with the two profiles represents
both sides of multiple stenosis RCA at a particular phases of
the complete cardiac cycle. The maximum values of WSS at
any point for all phases are achieved with outer wall profile. At
outer wall for throat of 75.15% stenosis, shearing stress
increases sharply compared with its value at inner wall, because
of the outer wall has a protrusion. Furthermore, there is slightly
different in WSS magnitude at throat of 32.09% stenosis on
both sides due to approximately symmetric flow in its region.
The maximum values of WSS for outer side and at the throat of
stenosis for stenosis ratios 75.15%, 41.21% and 32.09% are
340, 112 and 100 Pa respectively. Therefore, we can conclude
that as stenosis ratio increase WSS values increase at stenosis
region.
WSS distributions along inner and outer walls during peak
diastolic phase are shown in Fig. (8). Where the solid lines
correspond to Non- Newtonian and the dashed lines correspond
to Newtonian cases. Furthermore, maximum WSS values are at
the throat of stenosis for both the Newtonian and Non-
Newtonian cases. However, from the graphs we can notice that
non- Newtonian WSS is higher than Newtonian case at the
stenosis place due to larger viscosity values for non- Newtonian
compared with constant value for Newtonian case.

International Journal of Applied Engineering Research ISSN 0973-4562 Volume 13, Number 22 (2018) pp. 16064-16071
© Research India Publications. http://www.ripublication.com
16069
(a) Early diastolic (b) Peak diastolic
(c) Early systolic (d) Peak systolic
Figure 7: WSS along inner and outer multiple stenosis RCA walls for one cardiac cycle.
3.4 Pressure drops
Fig.(9) present pressure drops curves in multiple stenosis RCA.
Along the first stenosis (75.15%) the pressure decreased owing
to spatial acceleration of flow and viscous effect, pressure
drops value is11.54 mmHg along first stenosis at peak diastolic
phase. Also at same phase, pressure drops increases again as
flow accelerated in the region of decreasing area at 41.21%
stenosis along this region pressure drops value is1.6 mmHg. In
the flow separation region between the stenosis, the pressure
remained relatively constant. At 32.09% stenosis pressure
drops along its region equal to 1.3 mmHg. Therefore, pressure
drops along stenosis region for multiply stenosis RCA increase
as stenosis ratio increase.
Figure 8: WSS along inner and outer multiple stenosis RCA
walls at peak diastolic phase for two viscosity models.

International Journal of Applied Engineering Research ISSN 0973-4562 Volume 13, Number 22 (2018) pp. 16064-16071
© Research India Publications. http://www.ripublication.com
16070
Figure 9: Pressure drops along multiple stenosis RCA during
one cardiac cycle.
The local pressure drops along the multiple stenosis RCA are
shown in Fig.(10) at peak diastolic phase. Predictions from the
non-Newtonian viscosity of blood given in solid line whereas
these from the Newtonian viscosity are presented in dashed
line. The pressure drops calculated from the Newtonian blood
viscosity are substantially smaller than those calculated from
the non-Newtonian blood viscosity, but the decreases of the
pressure drops distal to the stenosis regions are much more
rapid in non-Newtonian flow due to the strong influence of the
viscous force.
Figure 10: Pressure drops along multiple stenosis RCA at
peak diastolic phase for two viscosity models
4. CONCLUSION
The hemodynamics characteristics of laminar flow in two-
dimensional under pulsatile conditions for blood flow through
multiple stenosis RCA are obtain. Geometrical date of RCA is
taken from catheterization laboratory in Basra Cardiac Center,
and commercial computational fluid dynamics code FLUENT
is employ to solve the governing equations. The main
conclusions from this study can be summary as follows:
The viscosity distributions for the Carreau model
show significant non-Newtonian effects occurring
close to the centerline of flow.
In stenosis region, viscosity values decreases due to
increasing shear rate this leads to increasing blood
flow velocity. Furthermore, increasing stenosis ratio
leads to increasing velocity and decreasing viscosity
for blood flowing through stenosis.
At stenosis region, WSS increases rapidly especially
at peak flow phase, WSS values increase as stenosis
ratio increase. In addition, WSS for the non-
Newtonian model tended to have a slightly higher
magnitude than the Newtonian model.
Pressure drops along stenosis region increase as
stenosis ratio increase. The non-Newtonian model
shows higher pressure drops from the inlet to the
outlet throughout the flow phase than the Newtonian
model.
REFRENCES
[1] J. E. Hall, Guyton and Hall textbook of medical physiology e-Book, Thirteen ed.: Elsevier Health
Sciences, 2015.
[2] W. Chan, "Simulation of arterial stenosis
incorporating fluid-structural interaction and non-
Newtonian blood flow," Mechanical and
Manufacturing Engineering RMIT University, 2006.
[3] T. Bodnár, A. Sequeira, and M. Prosi, "On the shear-
thinning and viscoelastic effects of blood flow under
various flow rates," Applied Mathematics and Computation, vol. 217, pp. 5055-5067, 2011.
[4] X. Xu and M. Collins, "Studies of blood flow in
arterial bifurcations using computational fluid
dynamics," Proceedings of the Institution of Mechanical Engineers, Part H: Journal of Engineering in Medicine, vol. 208, pp. 163-175, 1994.
[5] T. Ishikawa, L. F. Guimaraes, S. Oshima, and R.
Yamane, "Effect of non-Newtonian property of blood
on flow through a stenosed tube," Fluid dynamics research, vol. 22, pp. 251-264, 1998.
[6] B. M. Johnston, P. R. Johnston, S. Corney, and D.
Kilpatrick, "Non-Newtonian blood flow in human
right coronary arteries: transient simulations,"
Journal of biomechanics, vol. 39, pp. 1116-1128,
2006.
[7] M. G. Rabby, A. Razzak, and M. M. Molla, "Pulsatile
non-Newtonian blood flow through a model of arterial

International Journal of Applied Engineering Research ISSN 0973-4562 Volume 13, Number 22 (2018) pp. 16064-16071
© Research India Publications. http://www.ripublication.com
16071
stenosis," Procedia Engineering, vol. 56, pp. 225-231,
2013.
[8] M. Jahangiri, M. Saghafian, and M. R. Sadeghi,
"Effect of six non-Newtonian viscosity models on
hemodynamic parameters of pulsatile blood flow in
stenosed artery," Journal of Computational & Applied Research in Mechanical Engineering (JCARME), vol.
7, pp. 199-207, 2018.
[9] H. Versteeg and W. Malalasekera, An Introduction to Computational Fluid Dynamics, 1995.
[10] J.-F. Dietiker and K. A. Hoffmann, "Computation of
Three-Dimensional Blood Flows in Arteries," in
Proceedings of 36 th AIAA Fluid Dynamics Conference, 2006, pp. 797-811.
[11] Y. I. Cho and K. R. Kensey, "Effects of the non-
Newtonian viscosity of blood on flows in a diseased
arterial vessel. Part 1: Steady flows," Biorheology, vol. 28, pp. 241-262, 1991.