numerical analysis of structural behavior inside a
TRANSCRIPT
Numerical Analysis of Structural Behavior Inside a Pressurized-Water Reactor (PWR)
by
Hai Wang
A dissertation submitted in partial fulfillment of the requirements for the degree of
Doctor of Philosophy (Mechanical Engineering)
in the University of Michigan 2017
Doctoral Committee:
Professor Michael Thouless, Co-Chair Professor Wei Lu, Co-Chair Professor Krishna R. Garikipati Professor Gary S. Was

Hai Wang
ORCID iD: 0000-0002-8350-8314
Copyright © Hai Wang 2017
All Rights Reserved

ii
Dedication
To my parents
To my friends
iii
Acknowledgements
First and foremost, I want to express my appreciation and thanks to my advisors
Professor Michael Thouless and Professor Wei Lu. It has been an honor to be your Ph.D. student.
I appreciate all your contributions of time, ideas, and discussion to my research. I am also
thankful for the excellent examples you have provided as successful research scientists and
professors.
I would like to thank my committee members Professor Gary Was and Professor
Krishna Garikipati for their time, insightful questions and helpful comments. The class of
Professor Gary Was about mechanical behaviors of material under irradiation and the class of
Professor Krishna Garikipati about finite element method are invaluable to my research.
Many thanks to the CASL program (http://www.casl.gov), an Energy Innovation Hub
(http://www.energy.gov/hubs) for Modeling and Simulation of Nuclear Reactors under U.S.
Department of Energy, for the financial and technical support over my entire graduate years. It
was a great journey to be part of it.
I would also thank my partner and friend, Zupan Hu and A. Joksaari for the insightful
discussion and enjoyable collaboration. My time at University of Michigan was made enjoyable
in large part due to my friends that became a part of my life. I am grateful to all individuals who
have guided, supported and encouraged me throughout my Ph.D. life.

iv
Lastly, I would like to thank my family for all their love and encouragement. The faithful
support of my parents during the final stages of this Ph.D. is so appreciated. Thank you.
v
Table of Contents
Dedication ................................................................................................................................ ii
Acknowledgements ............................................................................................................... iii
List of Figures ........................................................................................................................ ix
Abstract ................................................................................................................................. xix
Chapter 1 Introduction .......................................................................................................... 1
1.1 Overview ................................................................................................................... 1
1.2 Mechanism-based framework for zircaloy creep............................................... 3
1.3 In-pile contact force relaxation by coupled wear and creep ........................... 3
1.4 Multi-scale modeling of hydride formation in zirconium alloy ...................... 4
1.5 Effect of hydride growth on contact force and gap formation between the
fuel rod and spacer grid .......................................................................................................... 5
Chapter 2 A mechanism-based framework for the numerical analysis of creep in
Zircaloy-4 ...................................................................................................................................... 7
2.1 Introduction ............................................................................................................. 7
2.2 Methodology .......................................................................................................... 11
vi
2.2.1 Creep mechanisms for zircaloy-4 ............................................................... 13
2.3 FEM results ............................................................................................................ 29
2.3.1 Numerical examples of zircaloy-4 plate with a hole ............................... 29
2.3.2 Numerical examples of zircaloy-4 as a cladding around a fuel rod ..... 32
2.3.3 Effects of microstructure ............................................................................. 34
2.4 Conclusions ............................................................................................................ 36
Chapter 3 The effect of coupled wear and creep during grid-to-rod fretting ........... 39
3.1 Introduction ........................................................................................................... 39
3.2 Methodology .......................................................................................................... 41
3.3 Model ....................................................................................................................... 44
3.3.1 Geometry and boundary conditions .......................................................... 44
3.3.2 Wear and creep models ................................................................................ 47
3.4 Results and discussion .......................................................................................... 50
3.4.1 Relaxation from creep only ......................................................................... 50
3.4.2 Relaxation from wear only ........................................................................... 51
3.4.3 Combined creep and wear ........................................................................... 53
3.4.4 Effects of friction coefficient, wear coefficient and amplitude of
excitation force................................................................................................................... 56
3.4.5 Effect of initial misfit .................................................................................... 60
3.4.6 Effect of zircaloy grain size ......................................................................... 61
vii
3.4.7 Effect of irradiation growth ........................................................................ 62
3.5 Conclusions ............................................................................................................ 64
Chapter 4 A physics-based, multi-scale model for hydride formation in zirconium
alloy .............................................................................................................................................. 67
4.1 Introduction ........................................................................................................... 67
4.1.1 Hydride formation in the nuclear reactor ................................................. 67
4.1.2 Multi-scale modeling ..................................................................................... 68
4.2 Model and method ................................................................................................ 70
4.2.1 Bridging phase-field simulation and continuum-level simulation ........ 70
4.2.2 Phase-field simulation ................................................................................... 71
4.2.3 Results of the phase-field simulation ......................................................... 72
4.2.4 Hydrogen diffusion in the continuum-level simulation ......................... 77
4.2.5 Hydride volume fraction calculation in the continuum-level simulation
78
4.2.6 Material texture .............................................................................................. 79
4.2.7 Thermal and mechanical material behaviors ............................................ 80
4.2.8 Flow chart of the continuum-level simulation ......................................... 80
4.3 Results...................................................................................................................... 81
4.3.1 Model validation ............................................................................................ 81

viii
4.3.2 The effect of hydrostatic stress gradient on hydride formation in a 3D
model 83
4.4 Discussion ............................................................................................................... 87
4.5 Conclusions ............................................................................................................ 90
Chapter 5 Effect of hydride growth on contact force and gap formation between
fuel rod and spacer grid ............................................................................................................ 95
5.1 Introduction ........................................................................................................... 95
5.2 Material models ...................................................................................................... 96
5.2.1 The multiscale model for hydride formation ........................................... 96
5.2.2 Thermal expansion, creep and swelling .................................................... 97
5.3 The evolution of contact force and gap size in the GTRF problem ........... 99
5.3.1 Boundary conditions ................................................................................... 100
5.3.2 Evolution of hydride distribution, contact force and gap size ........... 102
5.4 Conclusion ............................................................................................................ 107
Chapter 6 Conclusions ...................................................................................................... 112
Bibliography ......................................................................................................................... 116
ix
List of Figures
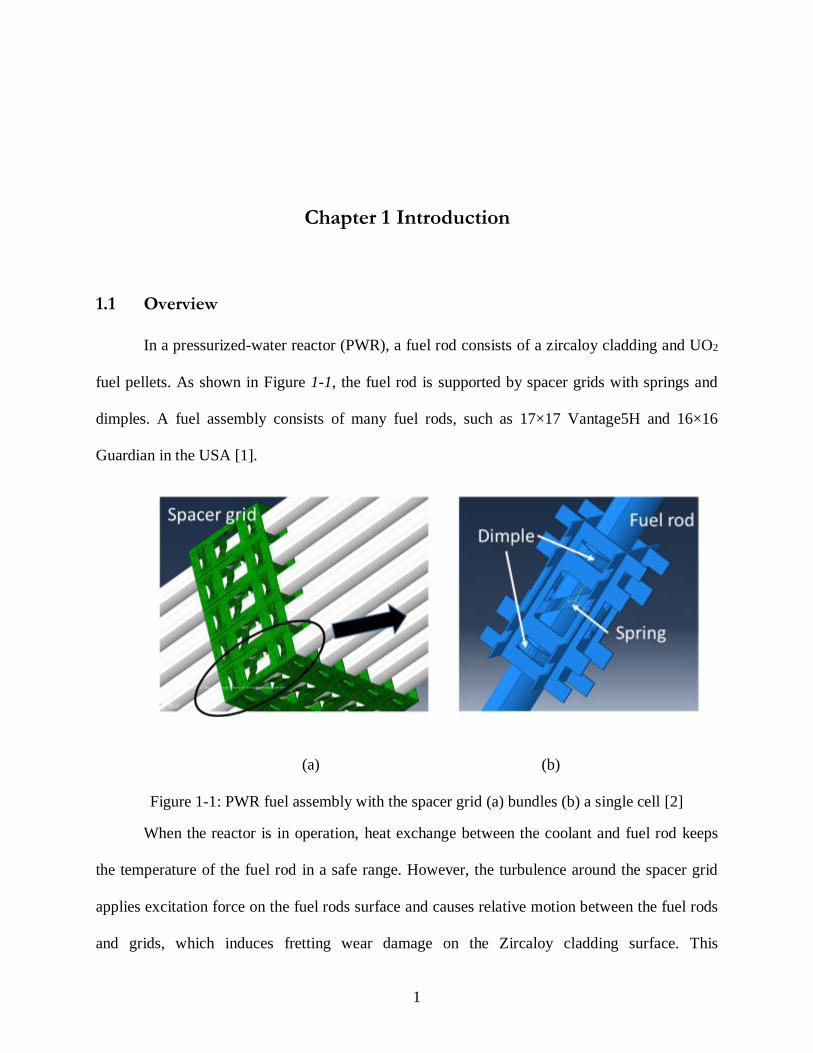
Figure 1-1: PWR fuel assembly with the spacer grid (a) bundles (b) a single cell......................... 1
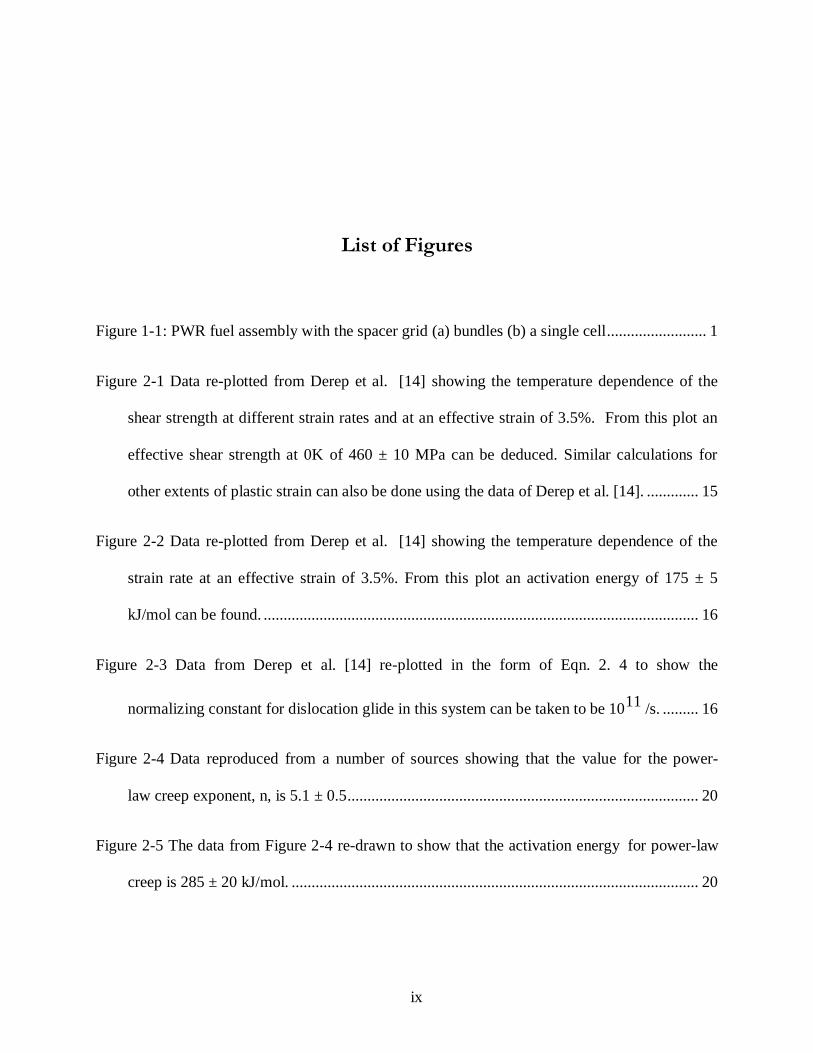
Figure 2-1 Data re-plotted from Derep et al. [14] showing the temperature dependence of the
shear strength at different strain rates and at an effective strain of 3.5%. From this plot an
effective shear strength at 0K of 460 ± 10 MPa can be deduced. Similar calculations for
other extents of plastic strain can also be done using the data of Derep et al. [14]. ............. 15
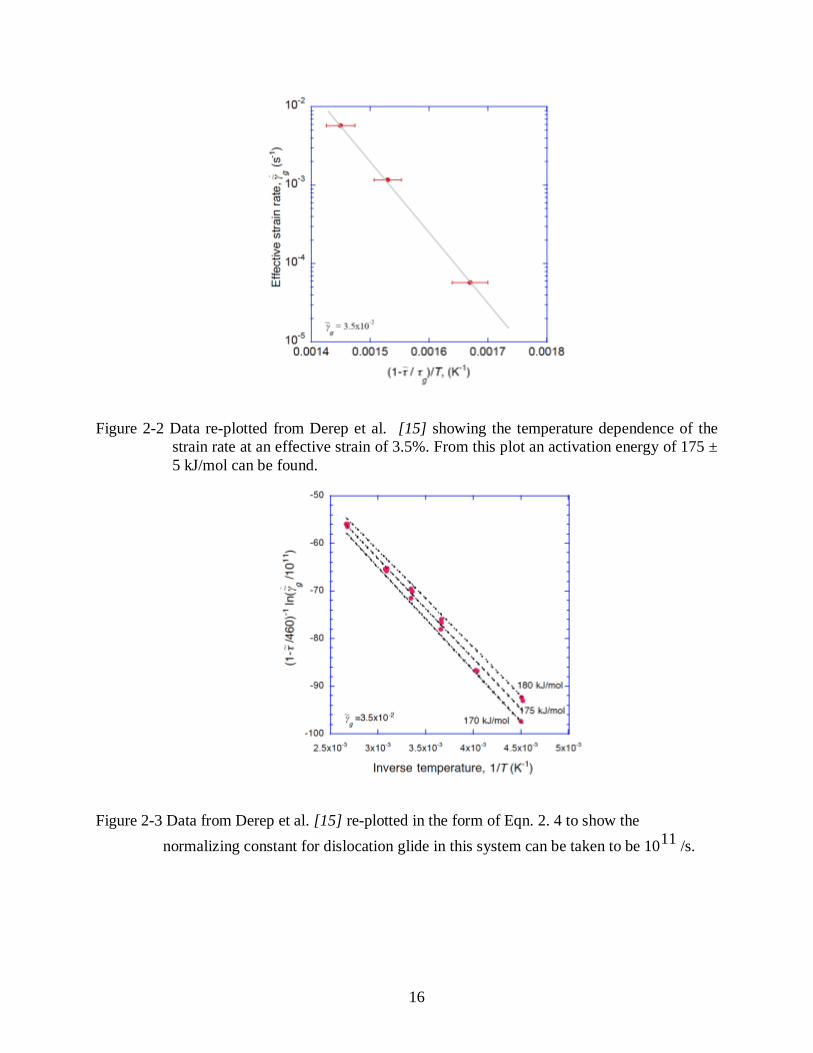
Figure 2-2 Data re-plotted from Derep et al. [14] showing the temperature dependence of the
strain rate at an effective strain of 3.5%. From this plot an activation energy of 175 ± 5
kJ/mol can be found. ............................................................................................................. 16
Figure 2-3 Data from Derep et al. [14] re-plotted in the form of Eqn. 2. 4 to show the
normalizing constant for dislocation glide in this system can be taken to be 1011
/s. ......... 16
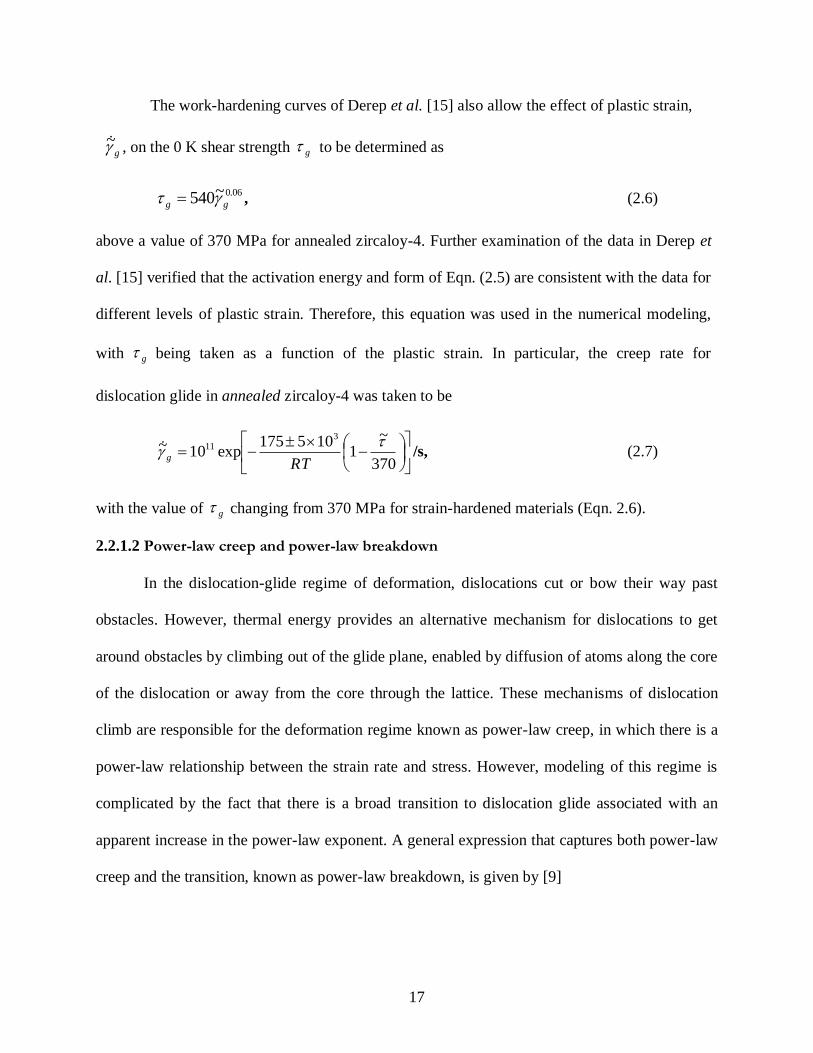
Figure 2-4 Data reproduced from a number of sources showing that the value for the power-
law creep exponent, n, is 5.1 ± 0.5........................................................................................ 20
Figure 2-5 The data from Figure 2-4 re-drawn to show that the activation energy for power-law
creep is 285 ± 20 kJ/mol. ...................................................................................................... 20
x
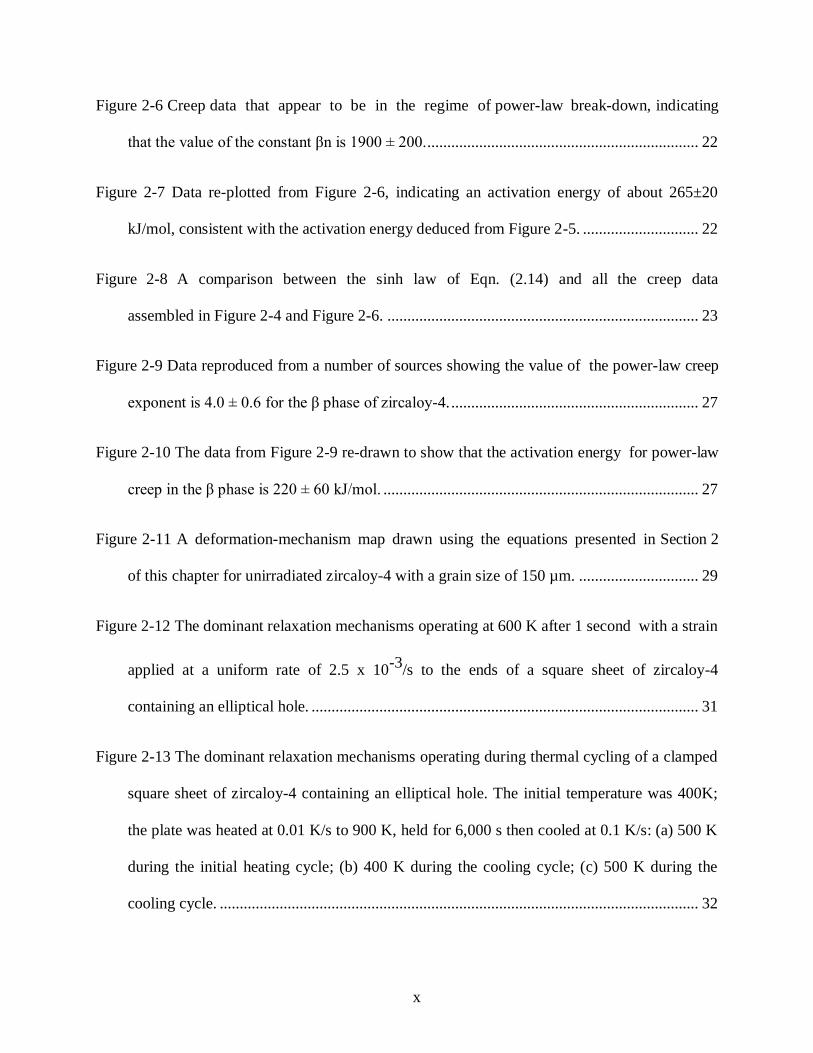
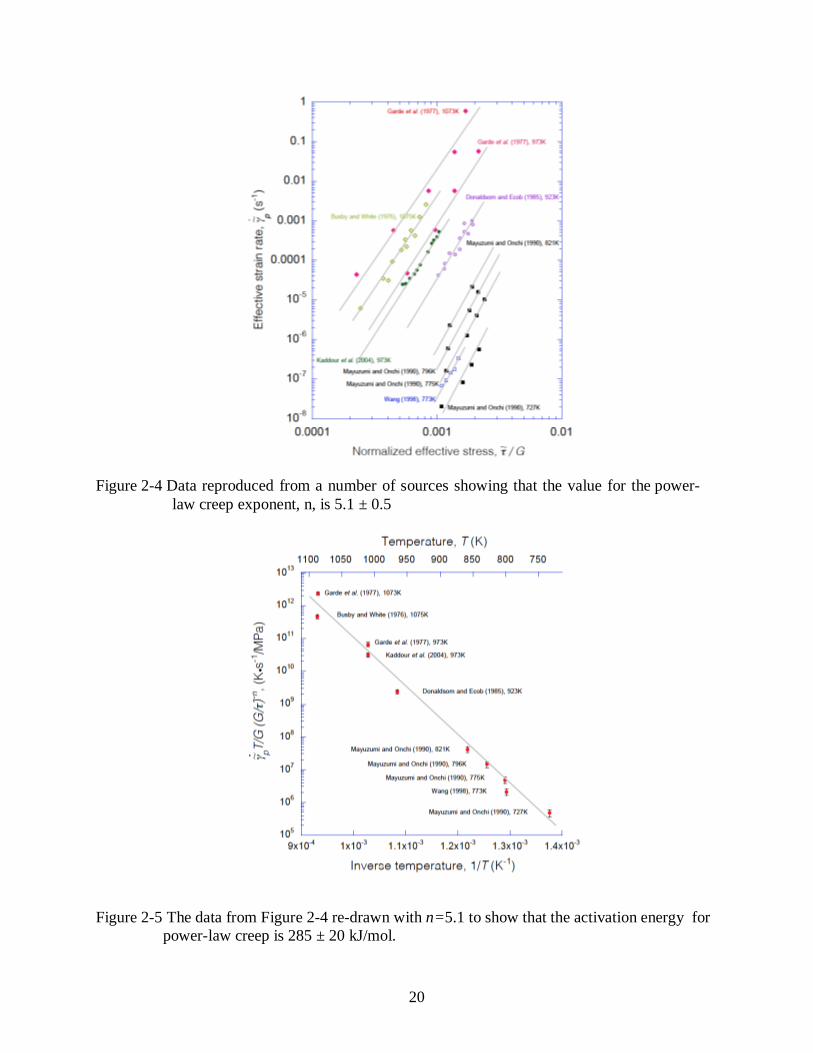
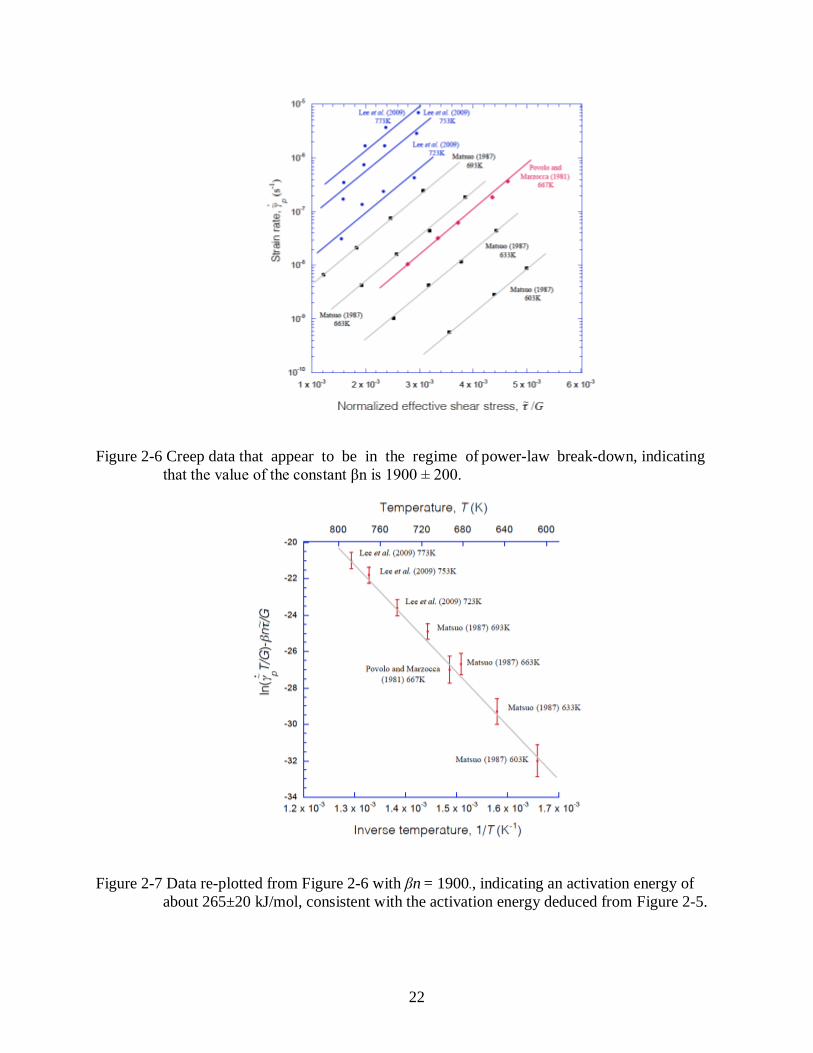
Figure 2-6 Creep data that appear to be in the regime of power-law break-down, indicating
that the value of the constant βn is 1900 ± 200..................................................................... 22
Figure 2-7 Data re-plotted from Figure 2-6, indicating an activation energy of about 265±20
kJ/mol, consistent with the activation energy deduced from Figure 2-5. ............................. 22
Figure 2-8 A comparison between the sinh law of Eqn. (2.14) and all the creep data
assembled in Figure 2-4 and Figure 2-6. .............................................................................. 23
Figure 2-9 Data reproduced from a number of sources showing the value of the power-law creep
exponent is 4.0 ± 0.6 for the β phase of zircaloy-4. .............................................................. 27
Figure 2-10 The data from Figure 2-9 re-drawn to show that the activation energy for power-law
creep in the β phase is 220 ± 60 kJ/mol. ............................................................................... 27
Figure 2-11 A deformation-mechanism map drawn using the equations presented in Section 2
of this chapter for unirradiated zircaloy-4 with a grain size of 150 µm. .............................. 29
Figure 2-12 The dominant relaxation mechanisms operating at 600 K after 1 second with a strain
applied at a uniform rate of 2.5 x 10⁻³
/s to the ends of a square sheet of zircaloy-4
containing an elliptical hole. ................................................................................................. 31
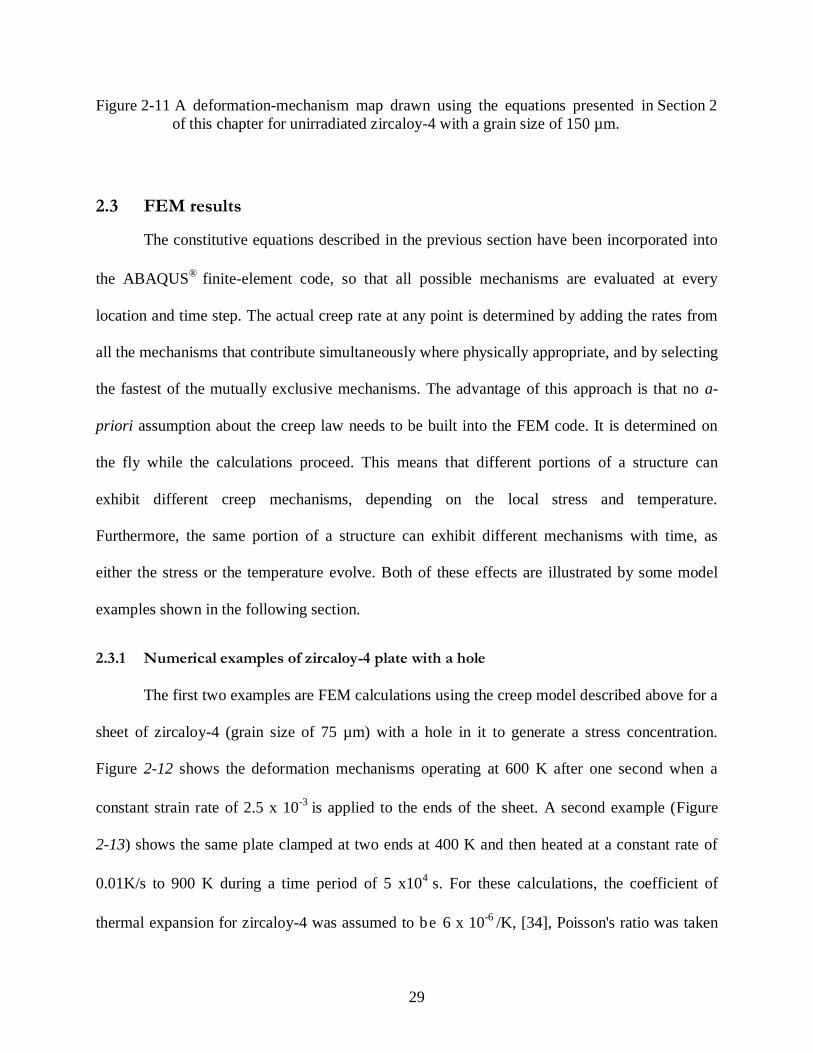
Figure 2-13 The dominant relaxation mechanisms operating during thermal cycling of a clamped
square sheet of zircaloy-4 containing an elliptical hole. The initial temperature was 400K;
the plate was heated at 0.01 K/s to 900 K, held for 6,000 s then cooled at 0.1 K/s: (a) 500 K
during the initial heating cycle; (b) 400 K during the cooling cycle; (c) 500 K during the
cooling cycle. ........................................................................................................................ 32

xi
Figure 2-14 Steady-state temperature profile for a cladding and fuel pellet with a power density
of 95 MW/m3
and a surface temperature of 550K. .............................................................. 34
Figure 2-15 Evolution of deformation mechanisms with time for the cladding and fuel assembly
shown in Figure 2-14. ........................................................................................................... 34
Figure 2-16 Nominal stress-strain curves for the geometry of Figure 2-12 with a nominal applied
strain rate of 1/s, showing the effects of work hardening on the creep curves. .................... 36
Figure 3-1 The black, dashed line is the actual excitation force. The red, solid line is the
assumed force history that is used to couple wear and creep. Both creep and tangential
loading can both induce relative displacements across the interface. Therefore, to separate
the two effects, two actual cycles (with a period of T0) are simulated without creep. Steady-
state is reached after the first cycle, so it is the second cycle that is used to compute wear
damage from the oscillating force. After this second cycle, no further vibrations are
assumed, but creep is allowed to occur. This results in some additional relative
displacement and wear. The total wear is assumed to be given by the sum of the damage
accumulated in the second cycle multiplied by a factor of Te /T0, plus the damage from
associated with creep. The maximum value of Te is set by imposing a limit on the drop in
local contact stresses. ............................................................................................................ 44
Figure 3-2 A diagram showing the assembly of the grid, cladding and UO2 . Wear is simulated on
the surfaces of CD, OP, EF and IJ. Symmetrical boundary conditions are enforced along AB.
An oscillating pressure is applied along the surface BC and AF. To apply the initial
interference, the boundaries MN and QR are displaced along x-direction, and the boundaries
LK and GH are displaced along y-direction, with the misfit being defined by the distance

xii
each support has to be moved to join them at L and M. The four boundaries are then fully-
constrained before beginning the simulation. The angle , defining the regions DC and EF,
has a value of 5, while the angle ’, defining the point C has a value of 42.5. ................. 45
Figure 3-3 Plots of total contact force per unit thickness, N, time t (a) Diffusional creep is
important for the relaxation of the contact force. The stress drops to low levels much more
slowly if diffusional creep mechanisms are ignored. (b) The role of creep-down is
separated from the role of local stress relaxation at the contact by setting the gauge pressure
to zero. It is clear that the creep-down process plays a dominant role in the relaxation of the
stresses at the contacts. In these plots, the contact force is normalized by its initial value (N0
= 26.8 N/mm), and the time is normalized by the period of the oscillations (To = 0.1 s). ... 51
Figure 3-4 Creep causes the slip boundary to moves, so the wear scare propagates (solid square
data points). In the absence of creep, the wear scar just gets deeper (open circular data
points). In this plot the wear depth is normalized by the cladding thickness (h = 0.57 mm),
and the position from the center of the contact is normalized by the outer radius of the
cladding (R = 4.75 mm). ....................................................................................................... 53
Figure 3-5 The effect of wear on the relaxation of the contact force. Initially, although there is
local wear damage caused by partial slip, the wear damage is too small to cause significant
relaxation. The stress relaxation is dominated by creep. The dramatic increase in the rate of
relaxation just before gap formation occurs is associated with the onset of full slip. The
contact force is normalized by its initial value, N0 = 26.8 N/mm, and the time is normalized
by the period To = 0.1 s. ........................................................................................................ 54

xiii
Figure 3-6 Wear profiles at different times. (a) Initially, wear occurs only at the edges of the
contact. As the contact force is relaxed by creep, the wear scars expands into the middle. (b)
At some point before they touch, full slip occurs, and wear then occurs over the entire
interface, eventually evolving into a profile where the maximum wear depth is in the middle
of the contact. In this plot the wear depth is normalized by the cladding thickness
(h = 0.57 mm), and the position from the center of the contact is normalized by the outer
radius of the cladding (R = 4.75 mm). .................................................................................. 55
Figure 3-7 The wear profile evolves homogeneously after the onset of full slip. By subtracting
the local wear depth from the maximum wear depth at any given moment, the wear profiles
at different times collapse onto a master curve. This homogeneous evolution is attributed to
a uniform dissipation of frictional energy. In this plot the wear depth is normalized by the
cladding thickness (h = 0.57 mm), and the position from the center of the contact is
normalized by the outer radius of the cladding (R = 4.75 mm). ........................................... 56
Figure 3-8 The effect of (a) the amplitude of the excitation force, (b) the friction coefficient, and
(c) the wear coefficient on the relaxation of the contact force as a function of time, for no
initial misfit. The contact force is normalized by the initial contact force (No = 26.8 N/mm).
The onset of full slip is delayed by a drop in the amplitude of the excitation force and by an
increase in the friction coefficient, leading to a longer time before contact is lost.
Conversely, while a decrease in the wear coefficient extends the time until contact is lost, it
has no effect on the onset of full slip. ................................................................................... 58
Figure 3-9 (a) Plots of the wear profiles with no initial misfit at the time when contact is lost,
for different magnitudes of the wear coefficient, friction coefficient and excitation force.
xiv
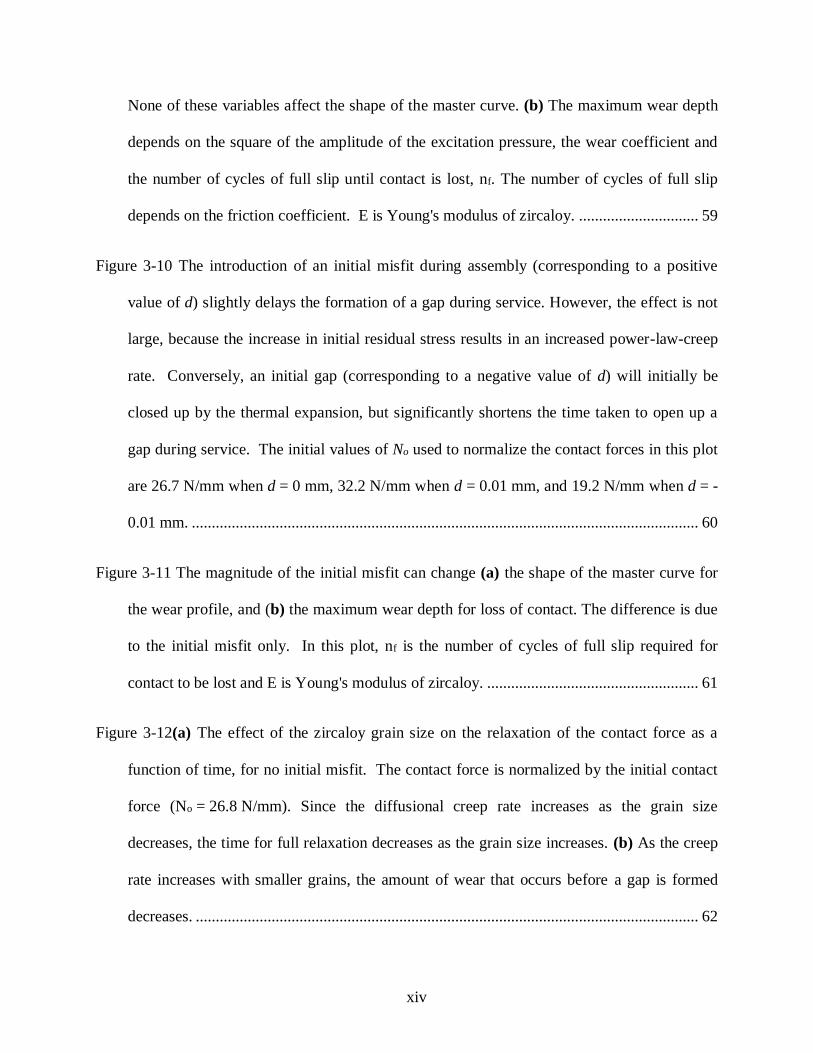
None of these variables affect the shape of the master curve. (b) The maximum wear depth
depends on the square of the amplitude of the excitation pressure, the wear coefficient and
the number of cycles of full slip until contact is lost, nf. The number of cycles of full slip
depends on the friction coefficient. E is Young's modulus of zircaloy. .............................. 59
Figure 3-10 The introduction of an initial misfit during assembly (corresponding to a positive
value of d) slightly delays the formation of a gap during service. However, the effect is not
large, because the increase in initial residual stress results in an increased power-law-creep
rate. Conversely, an initial gap (corresponding to a negative value of d) will initially be
closed up by the thermal expansion, but significantly shortens the time taken to open up a
gap during service. The initial values of No used to normalize the contact forces in this plot
are 26.7 N/mm when d = 0 mm, 32.2 N/mm when d = 0.01 mm, and 19.2 N/mm when d = -
0.01 mm. ............................................................................................................................... 60
Figure 3-11 The magnitude of the initial misfit can change (a) the shape of the master curve for
the wear profile, and (b) the maximum wear depth for loss of contact. The difference is due
to the initial misfit only. In this plot, nf is the number of cycles of full slip required for
contact to be lost and E is Young's modulus of zircaloy. ..................................................... 61
Figure 3-12(a) The effect of the zircaloy grain size on the relaxation of the contact force as a
function of time, for no initial misfit. The contact force is normalized by the initial contact
force (No = 26.8 N/mm). Since the diffusional creep rate increases as the grain size
decreases, the time for full relaxation decreases as the grain size increases. (b) As the creep
rate increases with smaller grains, the amount of wear that occurs before a gap is formed
decreases. .............................................................................................................................. 62
xv
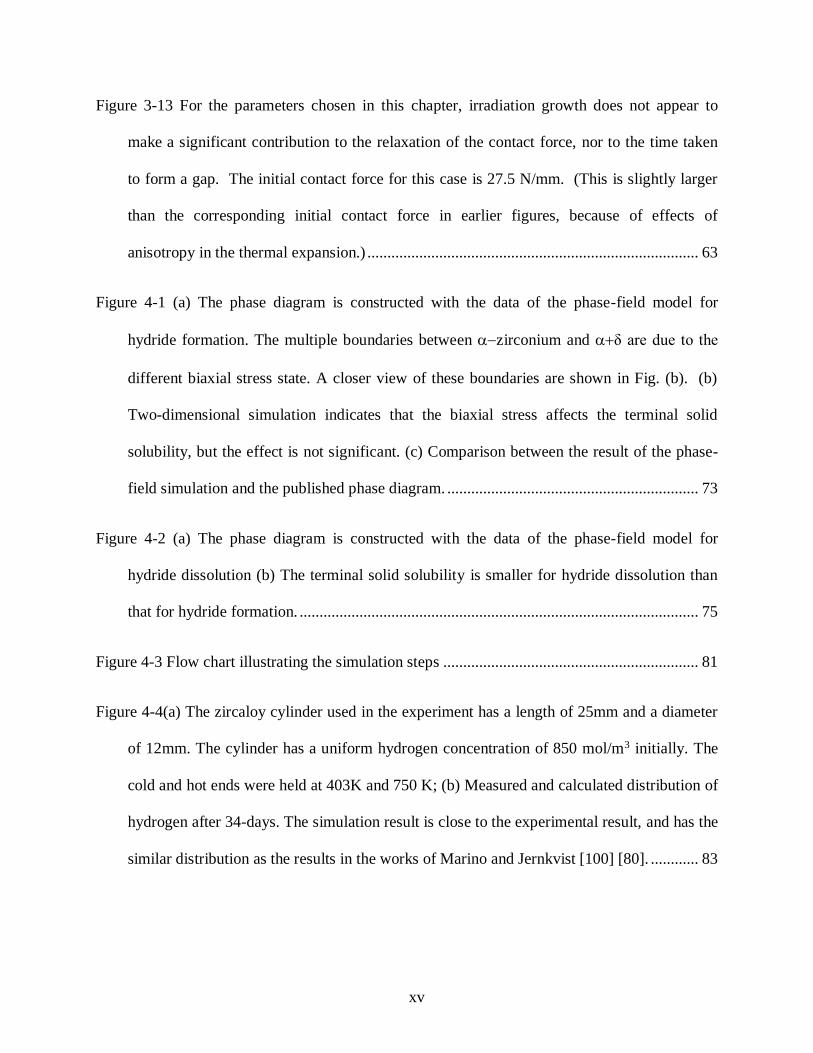
Figure 3-13 For the parameters chosen in this chapter, irradiation growth does not appear to
make a significant contribution to the relaxation of the contact force, nor to the time taken
to form a gap. The initial contact force for this case is 27.5 N/mm. (This is slightly larger
than the corresponding initial contact force in earlier figures, because of effects of
anisotropy in the thermal expansion.) ................................................................................... 63
Figure 4-1 (a) The phase diagram is constructed with the data of the phase-field model for
hydride formation. The multiple boundaries between zirconium and δ are due to the
different biaxial stress state. A closer view of these boundaries are shown in Fig. (b). (b)
Two-dimensional simulation indicates that the biaxial stress affects the terminal solid
solubility, but the effect is not significant. (c) Comparison between the result of the phase-
field simulation and the published phase diagram. ............................................................... 73
Figure 4-2 (a) The phase diagram is constructed with the data of the phase-field model for
hydride dissolution (b) The terminal solid solubility is smaller for hydride dissolution than
that for hydride formation. .................................................................................................... 75
Figure 4-3 Flow chart illustrating the simulation steps ................................................................ 81
Figure 4-4(a) The zircaloy cylinder used in the experiment has a length of 25mm and a diameter
of 12mm. The cylinder has a uniform hydrogen concentration of 850 mol/m3 initially. The
cold and hot ends were held at 403K and 750 K; (b) Measured and calculated distribution of
hydrogen after 34-days. The simulation result is close to the experimental result, and has the
similar distribution as the results in the works of Marino and Jernkvist [100] [80]. ............ 83
xvi
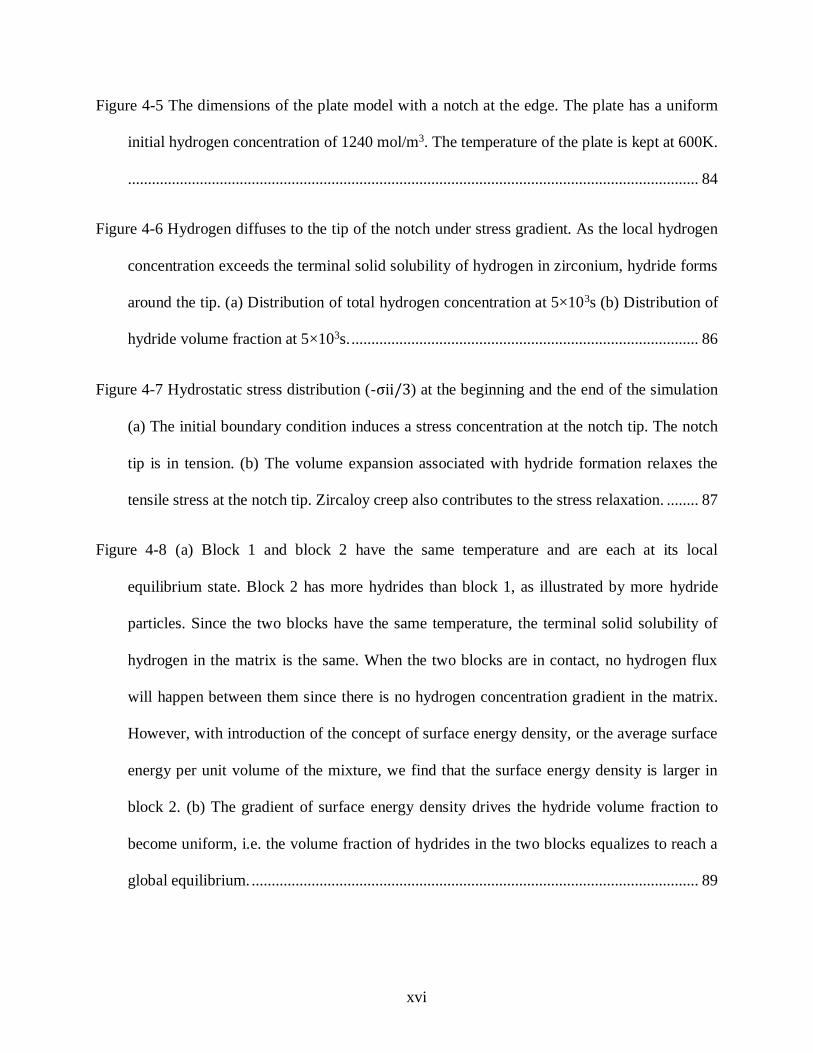
Figure 4-5 The dimensions of the plate model with a notch at the edge. The plate has a uniform
initial hydrogen concentration of 1240 mol/m3. The temperature of the plate is kept at 600K.
............................................................................................................................................... 84
Figure 4-6 Hydrogen diffuses to the tip of the notch under stress gradient. As the local hydrogen
concentration exceeds the terminal solid solubility of hydrogen in zirconium, hydride forms
around the tip. (a) Distribution of total hydrogen concentration at 5×10³s (b) Distribution of
hydride volume fraction at 5×10³s. ....................................................................................... 86
Figure 4-7 Hydrostatic stress distribution (-σii/3) at the beginning and the end of the simulation
(a) The initial boundary condition induces a stress concentration at the notch tip. The notch
tip is in tension. (b) The volume expansion associated with hydride formation relaxes the
tensile stress at the notch tip. Zircaloy creep also contributes to the stress relaxation. ........ 87
Figure 4-8 (a) Block 1 and block 2 have the same temperature and are each at its local
equilibrium state. Block 2 has more hydrides than block 1, as illustrated by more hydride
particles. Since the two blocks have the same temperature, the terminal solid solubility of
hydrogen in the matrix is the same. When the two blocks are in contact, no hydrogen flux
will happen between them since there is no hydrogen concentration gradient in the matrix.
However, with introduction of the concept of surface energy density, or the average surface
energy per unit volume of the mixture, we find that the surface energy density is larger in
block 2. (b) The gradient of surface energy density drives the hydride volume fraction to
become uniform, i.e. the volume fraction of hydrides in the two blocks equalizes to reach a
global equilibrium. ................................................................................................................ 89

xvii
Figure 4-9 The poly-crystal is assumed to consist of three kinds of grains, X, Y, and Z, whose
orientations are along the axes. ............................................................................................. 94
Figure 5-1: Grid, cladding and UO2 assembly. Symmetrical boundary conditions are enforced
along the horizontal and AC, which is 45° off the horizontal, so one eighth of the complete
model is modeled. To apply the initial interference, the boundary DE is displaced along
horizontal. Then, the boundary DE is fully constrained before beginning the simulation. 101
Figure 5-2 (a) Evolution of hydride volume fraction distribution. Hydride has a uniform
distribution along the circumferential direction, and the hydride distribution along AB in
Fig. 1 is plotted. The outer surface of cladding is where the position is 0. Hydride
concentrates on the outer surface of the cladding and forms a rim. The hydride volume
fraction inside the hydride rim increases with time. (b) This figure shows the evolution of
rim thickness. Hydride begins to form at 3.7×10⁷s and hydride rim thickness reaches the
plateau at about 7×10⁷s. After 7×10⁷s, the change of the rim thickness is little. The hydride
rim thickness at the end of the three cycles is about 0.12mm. The error bar is due to element
size. ..................................................................................................................................... 104
Figure 5-3: Effects of hydride on the contact force and gap size between the grid and cladding.
Since hydride begins to form at 3.7×10⁷s when hydrogen flux is 1.7×10⁻⁸ mol/m2s. Before
3.7×10⁷s, there is no difference for contact force and gap size with or without hydrogen flux.
After 3.7×10⁷s, the volume expansion associated with hydride accelerates the gap closing,
and increases contact force after gap closing. However, the effect is not significant. (a) The
evolution of contact force between the grid and cladding. The initial contact force relaxes to
zero at about 1.4 ×10⁷s, which is due to the local creep relaxation and the creep-down of

xviii
cladding. (b) The evolution of gap size between grid and cladding. When the cladding
creep-down to the UO2 completely, the gap reaches the maximum size of about 0.01 mm at
about 2.9 ×10⁷s. Then, the gap close is caused by UO2 swelling. The gap recloses at
5.9×10⁷s when the hydrogen flux is 1.7×10⁸s, while the gap recloses at 6.2×10⁷s when there
is no hydrogen flux. ............................................................................................................ 107

xix
Abstract
Fluid-induced grid-to-rod fretting (GTRF) wear is currently one of the main causes of
fuel leakage in pressurized-water reactors (PWRs) in the U.S. The root causes of failure have
been identified as insufficient grid-to-rod support in the assembly and the fluid-induced vibration.
Creep and wear are the two important relaxation mechanisms for the insufficient grid-to-rod
support. The hydride formation in the cladding is associated with volume expansion, which may
impact the contact force and gap size between the grid and cladding.
The mechanisms of creep for zircaloy-4 have been studied for many years. The creep
data published in the recent 35 years were collected and analyzed to identify different creep
mechanisms (dislocation-glide creep, power-law and power-law breakdown creep and
diffusional creep), based on the forms of the relationships between stress, temperature and strain
rate. This identification allowed the activation energies and other associated creep parameters to
be derived for each mechanism. The creep parameters were used to construct a deformation-
mechanism map for zircaloy-4 that shows the conditions under which different mechanisms are
dominant. This multi-mechanism creep model was implemented into the ABAQUS CREEP
subroutine to study the effect of creep on the structure deformation and stress evolution. This
subroutine allowed the finite-element analysis to select the most proper creep mechanism
naturally based on the local stress and temperature, which improved the accuracy for structures

xx
with a complex geometry and stress distribution.
The multiple-mechanism creep model was coupled with a wear model to study the in-pile
relaxation of the contact force between the spacer grid and cladding, and the evolution of the
wear profile before formation of a gap. These two processes occur at different time scales.
Therefore, an effective-cycle technique was developed to couple the two mechanisms in a
fashion that combined an acceptable level of both efficiency and accuracy. The simulations
indicated that two stages exist during the relaxation of the contact force: partial slip and full slip.
During partial slip, wear damage occurs at the edges of the contact region. Creep is the dominant
relaxation mechanism during the partial-slip, and allows the wear scar to propagate across the
entire contact, which causes a transformation from the partial slip to full slip. Once full-slip
occurs, the contact forces are relatively low, and the creation of the wear scar becomes the
dominant relaxation mechanism. In this regime, reducing the wear coefficient and the amplitude
of excitation force delays the formation of a gap between the grid and cladding. The wear profile
developed during full-slip occurs homogeneously. For a given initial interference, there is a
master curve for the wear scar, which does not depend on the friction coefficient, the amplitude
of the excitation pressure, or the wear coefficient. Therefore, the wear profile is characterized by
the maximum wear depth, which depends on the product of the square of the excitation pressure,
the wear coefficient, and the number of wear cycles. The existence of such a relationship means
that the results can be used to estimate the effects of the parameters that are particularly ill-
defined in the GTRF problem.
In addition to vibration, the coolant can also cause corrosion to the cladding. The reaction
between water and zirconium on the cladding surface produces hydrogen in addition to the oxide.
Hydrogen diffuses into the cladding and reacts with zirconium below the oxide layer to produce
xxi
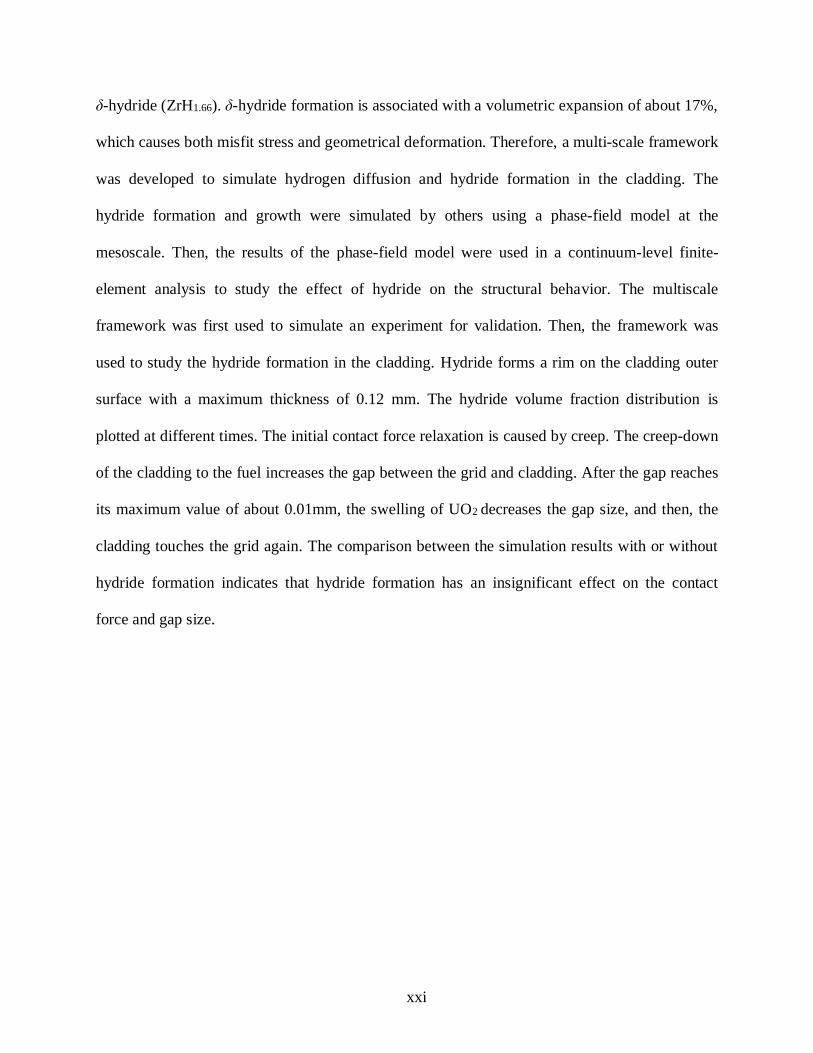
δ-hydride (ZrH1.66). δ-hydride formation is associated with a volumetric expansion of about 17%,
which causes both misfit stress and geometrical deformation. Therefore, a multi-scale framework
was developed to simulate hydrogen diffusion and hydride formation in the cladding. The
hydride formation and growth were simulated by others using a phase-field model at the
mesoscale. Then, the results of the phase-field model were used in a continuum-level finite-
element analysis to study the effect of hydride on the structural behavior. The multiscale
framework was first used to simulate an experiment for validation. Then, the framework was
used to study the hydride formation in the cladding. Hydride forms a rim on the cladding outer
surface with a maximum thickness of 0.12 mm. The hydride volume fraction distribution is
plotted at different times. The initial contact force relaxation is caused by creep. The creep-down
of the cladding to the fuel increases the gap between the grid and cladding. After the gap reaches
its maximum value of about 0.01mm, the swelling of UO2 decreases the gap size, and then, the
cladding touches the grid again. The comparison between the simulation results with or without
hydride formation indicates that hydride formation has an insignificant effect on the contact
force and gap size.
1
Chapter 1 Introduction
1.1 Overview
In a pressurized-water reactor (PWR), a fuel rod consists of a zircaloy cladding and UO2
fuel pellets. As shown in Figure 1-1, the fuel rod is supported by spacer grids with springs and
dimples. A fuel assembly consists of many fuel rods, such as 17×17 Vantage5H and 16×16
Guardian in the USA [1].
(a) (b)
Figure 1-1: PWR fuel assembly with the spacer grid (a) bundles (b) a single cell [2]
When the reactor is in operation, heat exchange between the coolant and fuel rod keeps
the temperature of the fuel rod in a safe range. However, the turbulence around the spacer grid
applies excitation force on the fuel rods surface and causes relative motion between the fuel rods
and grids, which induces fretting wear damage on the Zircaloy cladding surface. This

2
phenomenon is known as grid-to-rod fretting (GTRF) wear [3]. Grid-to-rod fretting (GTRF)
wear is currently one of the main causes of fuel leakage for the pressurized-water reactors
(PWRs) in the U.S [3]. The main root causes of failure have been identified as insufficient grid-
to-rod support in the assembly and the fluid-induced vibration.
At the early stage of operation, the spacer grid can provide sufficient support to the fuel
rod owing to an interference fit and thermal expansion. However, both wear [1] and creep [4] can
cause contact force relaxation during the operation. Eventually, the contact pressure can relax to
such an extent that a gap opens up between the two components. Once this happens, the wear
process changes to one associated with dynamic impact [5], which significantly increases the
wear rate and eventually causes fuel leak problem. Modeling the first stage of the fretting process,
where wear and creep interact, is complicated by the facts that the two processes are associated
with very different time scales and there is no multi-mechanism-based framework to model
zircaloy creep accurately. The questions of how to construct an accurate framework for creep
and integrate the two time scales associated with creep and wear into a numerical model of
GTRF are the focus.
In addition to the fluid-induced vibration, another problem associated with the coolant is
the cladding corrosion. Hydride [6] is the product of corrosion and it can degrade the cladding by
embrittlement [7]. Meanwhile, the volume expansion associated with hydride formation can
change the cladding geometry [8], which could affect the GTRF problem by changing the
contact force or gap size between the cladding and grid. Therefore, another focus is to develop a
framework, which could simulate the hydrogen diffusion and hydride formation, to study the
effect of hydride on GTRF problem.

3
1.2 Mechanism-based framework for zircaloy creep
A deformation-mechanism map has been developed for unirradiated zircaloy-4 based on
the creep data available from the literature of the last thirty-five years. These data have been
analyzed to identify different creep mechanisms, based on the forms of the relationships between
stress, temperature and strain rate. This identification allowed the activation energies and other
associated creep parameters to be derived for each mechanism. The creep parameters were used
to construct a deformation-mechanism map for zircaloy-4 that shows the conditions under which
different mechanisms are dominant. This information provides an important tool for assessing
the effects of stress and temperature in design, especially when extrapolating to different
regimes. As an example of how this information might be used in a numerical analysis for design
purposes, a novel mechanism-based creep framework was implemented within a finite-element
code. Although the framework was developed specifically for zircaloy-4, it provides a general
example of how mechanism-based creep laws can be implemented into finite-element analyses.
This approach allows the creep of complex geometries to be analyzed rigorously, with the
dominant deformation mechanisms being identified and evolving automatically in response to
the local temperatures and stresses.
1.3 In-pile contact force relaxation by coupled wear and creep
The initial stages of grid-to-rod fretting (GTRF) is associated with stress-relaxation.
Both creep and wear contribute to this process. These mechanisms act in concert, and are
influenced by each other. The development of a strategy to couple creep and wear is important
for the numerical modeling of gap formation in a pressurized-water reactor (PWR). However,
the characteristic time scales for the two processes are very different, which can cause numerical
problems. An approach is presented to develop reasonably efficient, yet accurate, models that

4
couple the two processes. This approach is used for a numerical analysis of gap formation
during grid-to-rod fretting. In this analysis, the effects of wear are integrated with the effects of
creep relaxation, providing insight into the relative roles of the two mechanisms in this particular
application. During the early stages of gap formation, interfacial slip and wear are limited to the
edges of the contact, and creep is the dominant mechanism that dictates the evolution of the
contact stress. Creep contributes to stress relaxation both through the creep-down of the cladding
onto the fuel, and by local stress relaxation at the contacts. Although localized wear always
occurs at the edge of the contacts, the effects are so small that this can be considered to be an
incubation period for wear. Eventually, the contact force relaxes to such an extent that slip
occurs over the entire contact between the pin and cladding, and wear becomes the dominant
relaxation mechanism. The simulations demonstrating these concepts explored different pressure
fluctuations, friction coefficients, wear coefficients, and initial interference, to show how these
different parameters affect the wear profile and the time at which contact is lost between the grid
and cladding.
1.4 Multi-scale modeling of hydride formation in zirconium alloy
A multi-scale model, which bridges simulations at different length scales, is developed to
simulate the effect of hydride formation or dissolution on the assembly of pressurized-water
reactor (PWR). Hydride formation or dissolution in -zirconium is simulated with the phase-
field model and nucleation model at the mesoscale, while hydrogen diffusion, thermal analysis
and stress analysis are conducted in the continuum-level simulation. The results of the phase-
field model and nucleation model are used to construct the zirconium-hydrogen phase diagram,
which are interpolated and implemented in the continuum-level simulation to calculate the
hydride distribution and the stress evolution associated with hydride formation. The multi-scale
5
model has been validated by the experimental data. This model works as an example to
demonstrate how to link the simulations at different length scales to solve engineering problems,
in which the experimental data at the mesoscale maybe insufficient. The application of the
multi-scale model is demonstrated by solving engineering problems, such as GTRF problem. For
the GTRF problem, the hydrogen diffusion and hydride formation in the zircaloy cladding are
simulated to study the effect of hydride formation on the contact force or gap size between the
cladding and grid. The evolution of hydride distribution is also plotted, so the cladding
embrittlement by hydride formation can be studied if necessary data is provided.
1.5 Effect of hydride growth on contact force and gap formation between the
fuel rod and spacer grid
Contact force between the grid and cladding is important to the GTRF problem.
Additionally, it is reported in the literature that the gap size between the grid and fuel rod is an
important parameter in the calculation of wear damage, and can affect the rod vibration
behaviors. Therefore, the evolution of contact force and gap size between the grid and fuel rod
over the three operation cycles of the pressurized-water reactor need to be studied. Hydride
formation in the zircaloy cladding is associated with volumetric expansion that can cause
cladding deformation. In addition to creep and thermal expansion of zircaloy, a multiscale model
to simulate hydride formation in zircaloy is implemented in the model to study the evolution of
hydride volume fraction distribution. The effect of hydride formation in the zircaloy cladding on
the contact force and gap size is also explored. Creep, swelling and thermal expansion of UO2
are modeled with existing material models. The simulation result indicates that the creep-down
of zircaloy cladding is the main reason of the initial contact force relaxation and the following
gap size increase. After the cladding creeping down to UO2 completely, the gap reaches its

6
maximum value of about 0.01mm. Then, the swelling of UO2 is responsible for the gap closure
and the following contact force increase. Additionally, hydride forms a rim on the cladding
surface with a final thickness of 0.12mm, but the hydride formation has insignificant effect on
the evolutions of contact force and gap size.
7
Chapter 2 A mechanism-based framework for the numerical analysis
of creep in Zircaloy-4
2.1 Introduction
One of the fundamental challenges of multi-scale modelling in materials science is to
develop suitable frameworks that allow the physics of phenomena occurring at the atomistic
scale to be incorporated at the continuum scale. As an example, the analysis of creep
deformation in large structures of arbitrary shapes may require continuum-level finite-element
calculations to compute local stresses and temperatures that need to be integrated with physics-
based models of how the local microstructure evolves and how atoms and dislocations move in
response to the stresses and temperatures within the evolved microstructure. Owing to the
complexities involved, different types of analytical approaches are needed at different scales, and
a major challenge involves establishing a framework by which models from different scales can
be incorporated at the other scales.
All too often, attempts at multi-scale modelling are focused on the development of
models, particularly at the lower length scales, and are stymied when it comes to bridging to
larger length scales. Motivated by an ongoing US Department of Energy initiative for multi-scale
modelling of nuclear reactors (CASL), we use the example of creep deformation to suggest the
sort of framework that could be the basis to incorporate mechanism-based creep models into

8
finite-element calculations. It should be emphasized that we are not developing creep models
but, rather, we are attempting to show one way by which existing atomistic-level creep models
might be included in a relatively simple fashion into a commercial finite-element program. The
results are limited by the quality of the data available in the literature for creep of zircaloy and
UO2, and the fact that models of microstructure evolution and its effect on creep are not well-
developed. In this context, the framework is illustrated primarily by the use of steady-state
creep models. However, we will illustrate the form in which lower-level models of the
interaction between radiation, temperature, time, microstructure, stress and creep could be
framed so that they could be incorporated in a continuum-level creep calculation.
The mechanisms of steady-state creep that are valid when there is no microstructural
evolution during creep have been elucidated over the past sixty years, and models for these
mechanisms are summarized in Frost and Ashby [9]. The basic mechanisms are diffusional creep
in which atoms diffuse in response to a stress gradient between different orientations of grain
boundary, dislocation glide in which flow is controlled by the motion of dislocations that may be
pinned by microstructural features such as precipitates, and dislocation climb in which thermal
energy provides an additional mechanism for dislocations to overcome pinning obstacles. Each
of these laws has a characteristic constitutive relationship between stress and strain rate that
can be incorporated into finite-element models. Various forms of these constitutive relationships
are incorporated into commercial finite element packages such as ABAQUS®. However, the use
of single relationships in finite-element codes is only valid within a relatively narrow range of
stresses and temperatures, which causes problems for the analysis of large structures in which
both of these may vary appreciably.
An alternative approach currently used in finite-element analyses is the use of an

9
empirical equation to describe creep behavior that can incorporate multiple mechanisms and also
microstructural changes [10]. In principal, it might be possible to develop a sufficiently inclusive
empirical law to accommodate all combinations of stress, temperature and microstructure
evolution. However, such an approach suffers from several potential disadvantages stemming
from the intrinsic problems of combining many factors into a single monolithic form. In the first
place, there are considerable challenges in developing a useful multi-parameter all-inclusive law
that embraces all the effects that are of interest. Even an empirical law that forsakes an equation
and substitutes in its place a numerical look-up table runs into considerable numerical difficulty
when one considers the number of dimensions that such a table would need to have to be useful.
However, there are more fundamental concerns with empirical approaches to creep models in
that they hide any insight that might be provided by physics, they do not lend themselves easily
to a goal of being guided and modified by lower-scale modelling which tends to be done in a
mechanism-specific fashion, and they cannot be used to extrapolate to new design spaces.
In the present work we incorporate the concepts of creep-mechanism maps developed by
Ashby and co-workers [9] within a finite-element program. The basic principle behind the
construction of creep-mechanism maps is that multiple creep mechanisms operate under a given
set of conditions but, generally, one will be rate controlling. By simultaneously evaluating the
constitutive equations resulting from mechanistic models for all possible mechanisms that might
operate under a given set of conditions, and adding the effects where appropriate, the dominant
mechanism emerges automatically from the calculations. No assumptions need to be made about
which mechanism might be dominant, and refinement of individual models can be done in
isolation from others. Indeed, an initial basic framework can be expanded systematically to
include additional models that might be developed as part of an on- going research program. An

10
empirical law or database that convoluted all creep models together would generally have to be
re-evaluated if any of the underlying models were to change.
The mechanistic-based models and equations that form the basis of deformation-
mechanism maps have been used for forty years. Their use in a multi-mechanism analysis has
been shown for the thermal cycling of metal films [11]. However, this analysis was limited to a
situation with uniform stresses and temperatures, allowing an analytical approach. There does
not appear to have been a systematic effort to incorporate the models into a finite-element code,
as part of a multi-scale modelling effort, so that complex 3-D geometries with variable stress and
temperatures can be analyzed. This was one of the goals that motivated the present work.
Deformation-mechanism maps can be found in the literature for zirconium, and its alloys
[12, 13, 14]. However, a recent one for zircaloy-4 [14] appears to be incomplete in that it is
missing some of the creep mechanisms that are associated with the alloy in the literature.
Therefore, the first task of this work was to use data that could be found from the open literature
and to interpret them in the context of standard creep mechanisms and develop a more complete
deformation mechanism map for zircaloy-4, within the limits of the data and existing models.
We then incorporated this map into a commercial finite- element code, and demonstrated its use
to analyze some characteristic geometries approximating fuel / clad assemblies in a nuclear
reactor. It will be observed from the results we present that the framework automatically allows
dominant creep mechanisms to be identified in different parts of a component, depending on the
local stress state and temperature, and also allows these to change as the conditions change.
It is recognized that the creep models we will be using for both materials are incomplete,
and are missing a number of important features. A particular limitation is the absence of models

11
linking the evolution of microstructure to temperature, stress, and radiation, and a corresponding
link between the resultant microstructure and the creep parameters for different creep
mechanisms. Some of these issues will be discussed in this chapter with some thoughts on how
such models might be designed to interact with a finite-element program within a multi-scale
modelling framework. It is hoped that the models and framework presented in this chapter will
highlight what may be currently missing in the literature and will motivate the development and
refinement of suitable mechanistic based-models. It is also noted that, we have not yet included
the deviatoric and volumetric strains that can be induced by radiation effects alone into the
framework. This is a project that is currently in progress.
2.2 Methodology
A multiple-mechanism description of creep relies on the development of distinct
constitutive equations from mechanism-based models for each individual mechanism that acts in
a material [9]. These equations are cast as a relationship between the effective shear-strain rate,
~ , and the effective shear stress,~ , which are related to the principle normal strains and stresses
by
2/1
2
13
2
32
2
213
2~
(2.1a)
2/1
2
13
2
32
2
216
1~
. (2.1b)
The use of an effective stress to describe creep is predicated on an assumption of isotropy.
While many zircaloy-4 components exhibit texture in their grain structures, the consistency of
the creep data in the literature indicated that texture does not provide a significant effect on creep,
so an assumptions of isotropy is valid when considering only the effects of stress on creep. It is

12
recognized that texture effects need to be included in any discussion of radiation growth and
creep.
With the exception of dislocation glide, the individual constitutive equations that are
derived from the lower-level models will generally be of the form
RTQfA nnnn /exp~~ (2.2)
for a constant microstructure, and where the subscript n indicates a particular mechanism. In
this expression, Qn is the activation energy of the mechanism for the material in question, T is
the absolute temperature, R is the molar gas constant, fn is the functional dependence of strain
rate on stress for the mechanism as it operates in the material, and An is a material parameter
that depends on the mechanism and microstructure. Unless any are mutually exclusive, the
mechanisms are assumed to operate simultaneously within a numerical model under all
conditions. Generally, owing to the different activation energies and stress dependencies, one
mechanism automatically dominates under a given set of conditions. However, this dominant
mechanism evolves naturally without any external selection, and automatically changes as the
conditions change. This automatic identification of the dominant mechanism is a very powerful
advantage of using a multi-mechanism analysis for numerical purposes
The microstructural parameters, An, will generally evolve with time during service, and
will depend on the integrated history of time, temperature, stress and radiation. In a fully-
established multi-scale framework, the continuum finite-element calculations that include the
creep models would probably be separated from any calculations of microstructure evolution,
since they would employ different numerical approaches. The finite-element calculations with
the creep models would give information on the temporal evolution of temperature, stress and

13
deformation for each element. These parameters would then be the inputs to microstructure
calculations, along with information on the radiation flux and chemical environment, to produce
modified values for the microstructural parameters that could be returned to the finite-element
model to calculate the creep rates in subsequent increment of times. Currently, the models and
data for microstructural evolution and its effects on creep parameters are not sufficient to be
useful. Therefore, we assume representative steady-state microstructures and creep rates in our
simulations. However, we will illustrate the principles of how one might incorporate
microstructure evolution in the framework, using a simple empirical model for work hardening
with dislocation glide.
2.2.1 Creep mechanisms for zircaloy-4
Based on the data and models available in the literature, the multi-mechanism model for
zircaloy-4 was predicated on 4 major creep mechanisms: (i) diffusional creep, (ii) power- law
creep, (iii) breakdown of power-law creep, and (iv) dislocation glide. Standard models for these
mechanisms [9] have been used, and values for the appropriate parameters for zircaloy-4 have
been deduced from a variety of different sources, as described in the sections that follow. At this
juncture, the models only include the effects of stress and temperature. Incorporating the effects
of radiation (as it relates to microstructural evolution, and the evolution of volumetric and
deviatoric strain), and its interaction with a time-dependent 3-D stress state is the subject of an
on-going project.
2.2.1.1 Dislocation glide
At very high stress levels, deformation is dominated by dislocation glide. This is the
dominant mechanism associated with yield, and is controlled by the ability of dislocations to
move along glide planes under the influence of a shear stress. The general form of the creep
14
equation for this mechanism is [9]
g
g
gRT
Q
~1exp~
0 , (2.3)
where 0 is a normalizing constant, Qg is the activation energy for dislocation glide, and g
is the shear strength required to overcome the barriers to dislocation glide at 0K. This equation
can be re-arranged as
0
~
ln~
g
g
g
gQ
RT , (2.4)
to provide a very distinctive signature for dislocation glide, as opposed to any other creep
mechanism, by plotting the stress required to maintain a fixed strain rate as a function of
temperature. Such a plot is linear decay with temperature for glide (since 0~ g ), as opposed
to the exponential inverse temperature decay generally valid for creep.
A paper by Derep et al. [15] provides data for the creep of zircaloy-4 that appear to be in
the regime of dislocation glide. These data form the basis for deducing the creep parameters of
Eqn. (2.4). Figure 2-1 shows a plot of the data for an effective plastic strain of 3.5 % expressed
in terms of the temperature-dependent yield strength as described by Eqn. (2.3). Extrapolation of
the data to 0K, allows the 0K yield strength, g , to be deduced as 460 ± 10 MPa. In Figure 2-2,
the data are re-expressed as an Arrhenius plot in the form suggested by Eqn. (2.3). From this
plot, it can be seen that the activation energy for dislocation glide, Qg, is 175 ± 5 kJ/mol: a value
that is very consistent with the activation energy for glide in zirconium quoted by Sargent and
Ashby [13]. Finally, Figure 2-3 shows a fit to the data, using the uncertainty in Qg, allowing the
value of the normalizing constant, 0 , to be determined as 1011/s. The equation for creep from
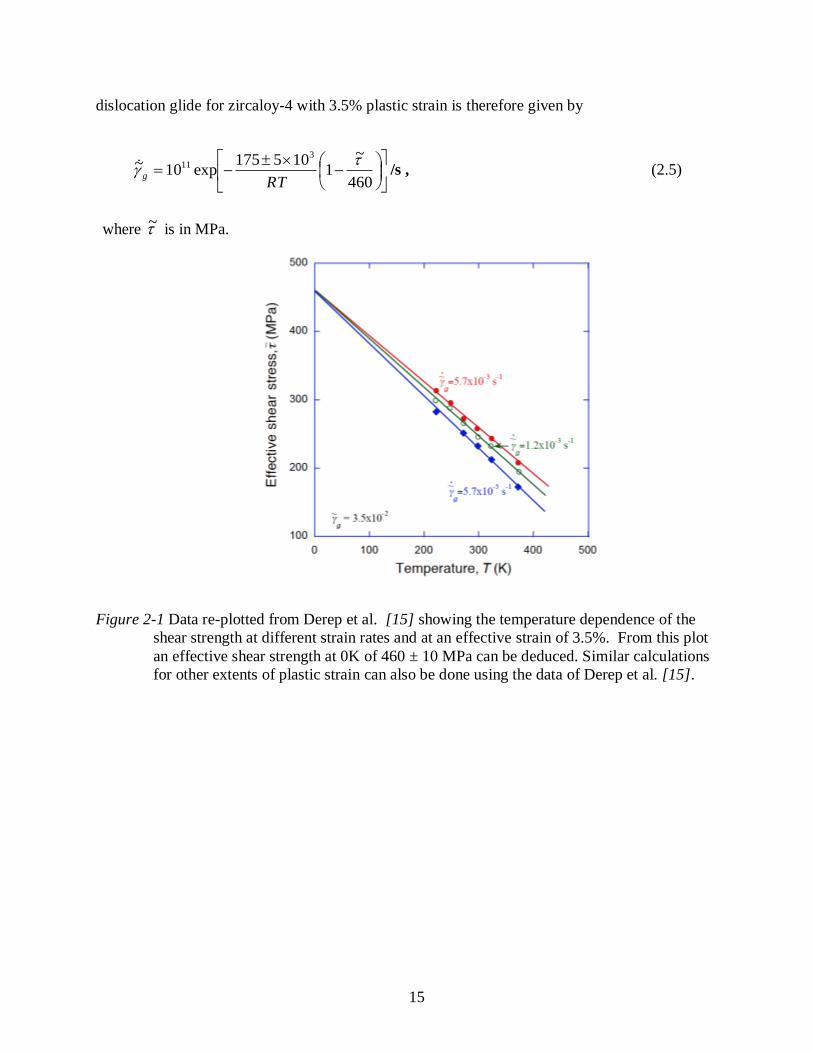
15
dislocation glide for zircaloy-4 with 3.5% plastic strain is therefore given by
460
~1
105175exp10~
311
RT
g /s , (2.5)
where ~ is in MPa.
Figure 2-1 Data re-plotted from Derep et al. [15] showing the temperature dependence of the
shear strength at different strain rates and at an effective strain of 3.5%. From this plot
an effective shear strength at 0K of 460 ± 10 MPa can be deduced. Similar calculations
for other extents of plastic strain can also be done using the data of Derep et al. [15].
16
Figure 2-2 Data re-plotted from Derep et al. [15] showing the temperature dependence of the
strain rate at an effective strain of 3.5%. From this plot an activation energy of 175 ±
5 kJ/mol can be found.
Figure 2-3 Data from Derep et al. [15] re-plotted in the form of Eqn. 2. 4 to show the
normalizing constant for dislocation glide in this system can be taken to be 1011
/s.
17
The work-hardening curves of Derep et al. [15] also allow the effect of plastic strain,
g~ , on the 0 K shear strength g to be determined as
06.0~540 gg , (2.6)
above a value of 370 MPa for annealed zircaloy-4. Further examination of the data in Derep et
al. [15] verified that the activation energy and form of Eqn. (2.5) are consistent with the data for
different levels of plastic strain. Therefore, this equation was used in the numerical modeling,
with g being taken as a function of the plastic strain. In particular, the creep rate for
dislocation glide in annealed zircaloy-4 was taken to be
370
~1
105175exp10~
311
RT
g /s, (2.7)
with the value of g changing from 370 MPa for strain-hardened materials (Eqn. 2.6).
2.2.1.2 Power-law creep and power-law breakdown
In the dislocation-glide regime of deformation, dislocations cut or bow their way past
obstacles. However, thermal energy provides an alternative mechanism for dislocations to get
around obstacles by climbing out of the glide plane, enabled by diffusion of atoms along the core
of the dislocation or away from the core through the lattice. These mechanisms of dislocation
climb are responsible for the deformation regime known as power-law creep, in which there is a
power-law relationship between the strain rate and stress. However, modeling of this regime is
complicated by the fact that there is a broad transition to dislocation glide associated with an
apparent increase in the power-law exponent. A general expression that captures both power-law
creep and the transition, known as power-law breakdown, is given by [9]

18
RT
Q
GT
GA p
n
p
p exp~
sinh~ , (2.8)
where G is the shear modulus of the material, Qp is the activation energy for dislocation climb
by diffusion through the lattice1, Ap and β are material constants, and n is the power-law-creep
exponent. In this work, it was assumed that the shear modulus of zircaloy-4 is given by [10]:
G = 39400 -13.4T MPa, (2.9)
for relatively low stresses, ~ < 0.8G / β , Eqn. (2. 8) reduces to the classical form of equation
for power-law creep [9]:
RT
Q
GT
GA
p
n
p
n
p exp~
~ . (2.10)
At higher values of stress, Eqn. (2.8) reduces to the power-law breakdown form of [9]
RT
Q
G
n
T
GA p
n
p
p exp~
exp2
~ . (2.11)
In the section that follows, the material parameters β, n and Ap for zircaloy-4 are determined
from data collected from the many sources in the literature that have appeared over the past 35
years.
Inspection of the literature indicated that the data could be divided into two groups, those
that appeared to be described by the power-law creep of Eqn. (2.10), and those that appeared to
be described by the power-law break-down of Eqn. (2.11). These two groups of data were
analyzed separately to determine the creep parameters and, as will be seen, there is good
consistency between the two sets of data, indicating that Eqn. (2.8) is a good description of the
1 In many materials, Qp is equal to the activation energy for lattice diffusion, QL. However, Zr alloys appear
to exhibit an anomaly in this regard, with Qp being much larger than QL [9, 13].

19
creep behavior in this regime. In the analysis that follows, all the quoted stresses and strain rates
have been converted to effective stresses and strains, so that both multiaxial and uniaxial data
could be used. Again, the consistency between all the sets of data indicates the validity of
assuming isotropy and the use of effective stress and strain to describe creep. Figure 2-4 presents
creep data over the temperature range of 727-1073K and at values of effective shear stress in the
range of about 10-4
G to about 2 x 10⁻³
G. The log-log plot of Figure 2-4 indicates an average
power- law exponent of n = 5.1 ± 0.5 for all the reported data. The activation energy could then
be found by re-plotting the data from Eqn. (2.10) in the form
p
np
n
pA
RT
QG
G
T
ln~
~
ln
, (2.12)
as shown in Figure 2-5. This somewhat complicated form of an Arrhenius plot was chosen
because it permits all the data from Figure 2-4 to be plotted simultaneously, and the error bars
include the uncertainty associated with the value of the power-law exponent. All the data
combine to indicate an activation energy of 285 ± 20 kJ/mol. The plot also allows the creep
constant p
n A to be determined. However, the value of this constant depends on n, and can't
be determined independently. For example, if n is taken to be 5.1, then p
n A = 6 x 1025
K/MP·s with upper and lower bounds of 15 x 1025
and 2 x 1025
K/MP·s, respectively.
20
Figure 2-4 Data reproduced from a number of sources showing that the value for the power-
law creep exponent, n, is 5.1 ± 0.5
Figure 2-5 The data from Figure 2-4 re-drawn with n=5.1 to show that the activation energy for
power-law creep is 285 ± 20 kJ/mol.

21
Figure 2-6 presents creep data from the literature in a slightly lower temperature range
(603 to 733K), but in a higher effective shear stress range (2 x 10⁻³
G to 5 x 10⁻³
G). These data
are presented on a log-linear plot, showing the linearity that is expected for the power-law-
breakdown regime. The slopes of all these different sets of data give an essentially constant value
of βn of 1900 ± 200. It should be noted that the individual data sets also give reasonably linear
plots on a log-log plot, but with slopes that systematically change with temperature. The
temperature-independent slopes of Figure 2-6 indicate that the data are better described by
power-law breakdown. The activation energy for power-law breakdown can be deduced in a
similar fashion to how the activation energy was determined for the power-law creep regime.
Equation (2.11) can be re-expressed as
n
ppp A
RT
Q
G
n
G
T
2ln
~~
ln
, (2.13)
and is plotted in Figure 2-7. As with Figure 2-5, the uncertainties of the data and the parameter
βn are represented in the error bars of the plot. The slope of the best-fit line gives an activation
energy of 265 ± 20 kJ/mol, which is consistent with the activation energy calculated from the
previous set of data. The value of Ap that is calculated from the intercept of Figure 2-7 is
dependent on the choice of βn. If this parameter is taken to be 1900, and n is taken to be 5.1
(so that β = 370), then Ap = 4 x 10¹²
K/MP·s, ranging from between 4 x 10¹²
K/MP·s and 1.5 x
1011
K/MP·s. This is very consistent with the value of 5 x 10¹²
K/MP·s calculated in the
previous paragraph for n =5.1 and β = 370.
22
Figure 2-6 Creep data that appear to be in the regime of power-law break-down, indicating
that the value of the constant βn is 1900 ± 200.
Figure 2-7 Data re-plotted from Figure 2-6 with βn = 1900., indicating an activation energy of
about 265±20 kJ/mol, consistent with the activation energy deduced from Figure 2-5.

23
In conclusion, the two sets of data from the literature which fall into either the power-
law or power-law break-down regime show a remarkable consistency in the creep parameters,
suggesting that both regimes can be reasonably described by a single sinh law of the form:
RTGT
Gp
31.511 10275exp
~370sinh
108~ . (2.14)
As shown in Figure 2-8, the full range of the uncertainty in the model can be captured by
putting a relatively small uncertainty on the scaling parameter, Ap, with it varying between
about 4 x 10¹²
and 1.5 x 10¹¹
K/MP·s.
Figure 2-8 A comparison between the sinh law of Eqn. (2.14) and all the creep data
assembled in Figure 2-4 and Figure 2-6.
In general, it is expected that power-law creep will be controlled by core diffusion at
lower temperatures. However, an extensive search of the literature did not reveal creep data for
zircaloy-4 below about 600 K; all the power-law creep data above this temperature are consistent
with a single mechanism of lattice-controlled climb. Therefore, it appears that any transition
between lattice-controlled and core-controlled power-law creep is below 600 K, and the

24
parameters for core-controlled power-law creep specific to zricalloy-4 are not currently
available. In the absence of better data, and to provide a place-holder for this mechanism we
have adapted a value for the activation energy of core-diffusion in zirconium of Qc = 125 kJ/mol
from Sargent and Ashby [13]. This would appear to be justified because the activation energy for
lattice- controlled power-law creep obtained in the present work for zircaloy-4 is essentially
identical to the value quoted by Sargent and Ashby for zirconium (275 kJ/mol versus 270
kJ/mol). A value for the scaling parameter was then chosen arbitrarily to provide a match
between the two regimes of power-law creep, with an assumed transition between lattice and
core- controlled power-law creep at 550 K at a strain rate of 10-9
s-1
. This results in an equation
for core-diffusion controlled creep of
RTGGT
Gc
125000exp
~370sinh
~100~
1.52
. (2.15)
However, it is emphasized that we have not found any experimental data in the literature in a
suitable regime of stresses and temperatures to validate these parameters for core- diffusion
controlled creep.
2.2.1.3 Diffusional creep
Diffusional creep is associated with the diffusion of atoms driven by gradients in the
normal stresses along grain boundaries or in the matrix, and is identified by strain rates that are
linear with stress. It generally dominates over other creep mechanisms at low stresses and high
temperature. Diffusional creep, which includes effects of grain-boundary sliding [16] can be
characterized by two mechanisms of diffusion: lattice diffusion [17, 18] and grain-boundary
diffusion [19]. While both mechanisms exhibit the same linear dependence on stress, each has a

25
different dependence on temperature and grain size. Nabarro-Herring, or lattice-controlled,
creep is described by an equation of the form
RT
Q
Td
A ll
l exp~~2 , (2.16a)
where d is the grain size, and Ql is the activation energy for diffusion through the lattice.
Coble, or boundary-controlled, creep is described by an equation of the form
RT
Q
Td
A bb
b exp~~3 , (2.16b)
where Qb is the activation energy for diffusion along grain boundaries.
A number of authors have reported linear creep in zircaloy-4 at relatively low stresses
[20, 21, 14], and other forms of zirconium [22, 23, 24, 25, 26, 27]. Unfortunately, these data are
not sufficiently complete in terms of grain-size and temperature dependence to be useful in
deducing the relevant creep parameters. Therefore, in the absence of more appropriate
experimental data, we have assumed that the diffusional creep parameters of zircaloy-4 can be
described by the parameters given by Sargent and Ashby [1982] for α-zirconium:
Ql = 190 kJ/mol, Al = 2.1 × 10⁻³K· m /MPa· s,
and Qb = 120 kJ/mol; Ab = 1.8 × 10⁻¹¹K· m /MPa· s .
2.2.1.4 Phase transitions
There is a phase transition in zircaloy-4 that begins to take place at about 1100K, when
the α phase of zirconium transforms to the β phase. This transition is complete at around 1200K.
There are some data in the literature for the creep of zircaloy-4 at these higher temperatures in
the power-law regime [28, 29, 30]and the process to deduce the creep parameters is identical to

26
that described earlier for the α phase. As shown in Figure 2-9 and Figure 2-10, the power-law
exponent is 4.0 ± 0.6 while the activation energy is 220 kJ/mol, with a relatively large
uncertainty of ± 60 kJ/mol owing to the limited data set. Therefore, the equation for power law
creep in the β phase is
RTGT
Gp
220000exp
~109~
4
19 /s . (2.17)
with the scaling parameter at the beginning of the equation varying between 1.7 x 10¹⁹
and 3 x
1020
/s.
There do not appear to be data for diffusional creep in the β region. Therefore, as a place-
holder, we use the parameters assumed for the β -phase of zirconium in Sargent and Ashby [13].
Furthermore, although there are some data for creep in the mixed α and β region [28, 29, 30],
they are to scarce to be of use in deducing the values of any parameters. Therefore, in this two-
phase region, the creep rate is linearly interpolated between the models in the two single- phase
regions.

27
Figure 2-9 Data reproduced from a number of sources showing the value of the power-law creep
exponent is 4.0 ± 0.6 for the β phase of zircaloy-4.
Figure 2-10 The data from Figure 2-9 re-drawn to show that the activation energy for power-law
creep in the β phase is 220 ± 60 kJ/mol.
28
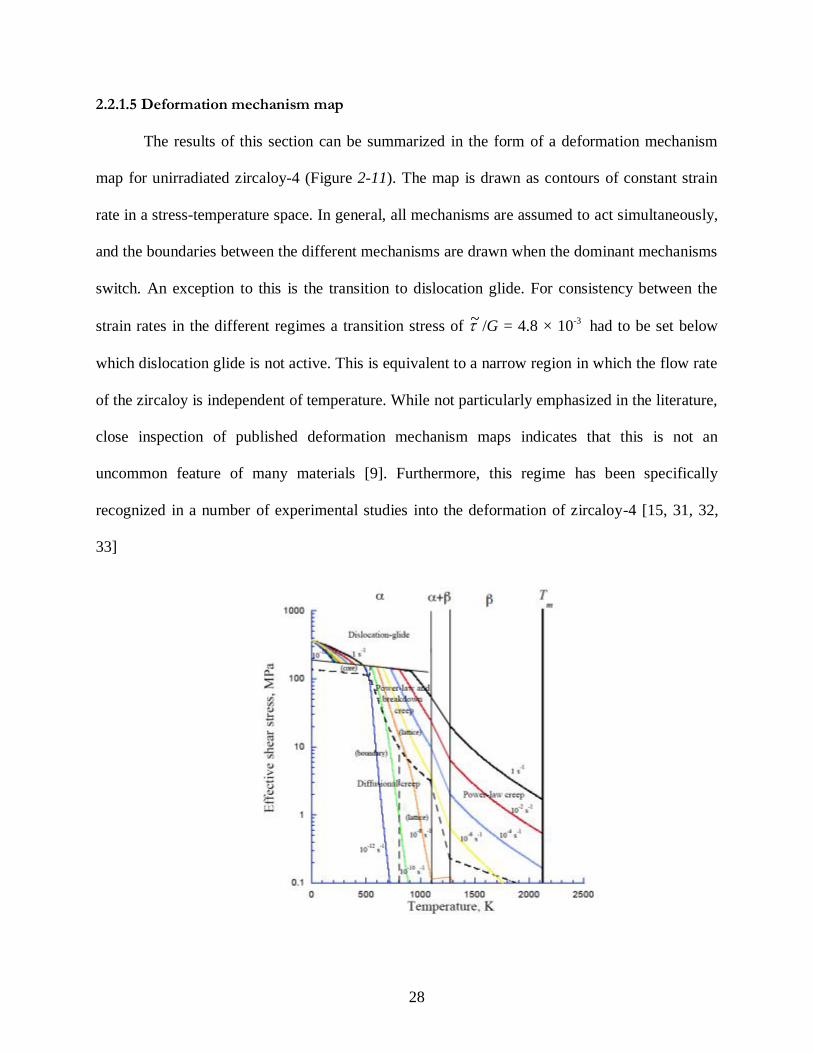
2.2.1.5 Deformation mechanism map
The results of this section can be summarized in the form of a deformation mechanism
map for unirradiated zircaloy-4 (Figure 2-11). The map is drawn as contours of constant strain
rate in a stress-temperature space. In general, all mechanisms are assumed to act simultaneously,
and the boundaries between the different mechanisms are drawn when the dominant mechanisms
switch. An exception to this is the transition to dislocation glide. For consistency between the
strain rates in the different regimes a transition stress of ~ /G = 4.8 × 10⁻³
had to be set below
which dislocation glide is not active. This is equivalent to a narrow region in which the flow rate
of the zircaloy is independent of temperature. While not particularly emphasized in the literature,
close inspection of published deformation mechanism maps indicates that this is not an
uncommon feature of many materials [9]. Furthermore, this regime has been specifically
recognized in a number of experimental studies into the deformation of zircaloy-4 [15, 31, 32,
33]
29
Figure 2-11 A deformation-mechanism map drawn using the equations presented in Section 2
of this chapter for unirradiated zircaloy-4 with a grain size of 150 µm.
2.3 FEM results
The constitutive equations described in the previous section have been incorporated into
the ABAQUS®
finite-element code, so that all possible mechanisms are evaluated at every
location and time step. The actual creep rate at any point is determined by adding the rates from
all the mechanisms that contribute simultaneously where physically appropriate, and by selecting
the fastest of the mutually exclusive mechanisms. The advantage of this approach is that no a-
priori assumption about the creep law needs to be built into the FEM code. It is determined on
the fly while the calculations proceed. This means that different portions of a structure can
exhibit different creep mechanisms, depending on the local stress and temperature.
Furthermore, the same portion of a structure can exhibit different mechanisms with time, as
either the stress or the temperature evolve. Both of these effects are illustrated by some model
examples shown in the following section.
2.3.1 Numerical examples of zircaloy-4 plate with a hole
The first two examples are FEM calculations using the creep model described above for a
sheet of zircaloy-4 (grain size of 75 µm) with a hole in it to generate a stress concentration.
Figure 2-12 shows the deformation mechanisms operating at 600 K after one second when a
constant strain rate of 2.5 x 10⁻³
is applied to the ends of the sheet. A second example (Figure
2-13) shows the same plate clamped at two ends at 400 K and then heated at a constant rate of
0.01K/s to 900 K during a time period of 5 x10⁴
s. For these calculations, the coefficient of
thermal expansion for zircaloy-4 was assumed to be 6 x 10⁻⁶
/K, [34], Poisson's ratio was taken

30
to be 0.342 [10], and the temperature-dependent shear modulus of Eqn. (2.9) was used [10]. As
in the similar problem considered by Thouless et al. [11], the stress level depends on the
competition between the elastic stresses introduced by constrained thermal expansion and
relaxation by creep. At low temperatures, the stresses build up elastically since the diffusional
creep causes only limited relaxation. At higher temperatures and stresses, dislocation-climb
mechanisms become dominant, starting in the high-stress region at the tip of the hole (Figure
2-13a) and eventually spreading across the specimen. When the temperature is held at 900 K for
104
s there is extensive stress relaxation and the stresses fall to a level at which the dominant
mechanism switches to diffusional creep. The cooling cycle at 0.1K/s (Figure 2-13a b & c)
induces tensile stresses that are relaxed rapidly at high temperatures, but build up at lower
temperatures. Dislocation climb dominates for much of the cooling cycle, with glide becoming
dominant at the stress concentrations, and eventually spreading across the specimen when the
temperature is low enough. When the temperature is held at a low value, so that thermal
contraction ceases, stress relaxation occurs with transitions from glide to diffusion mechanisms.

31
Figure 2-12 The dominant relaxation mechanisms operating at 600 K after 1 second with a strain
applied at a uniform rate of 2.5 x 10⁻³
/s to the ends of a square sheet of zircaloy-4
containing an elliptical hole.
(a)
(b)
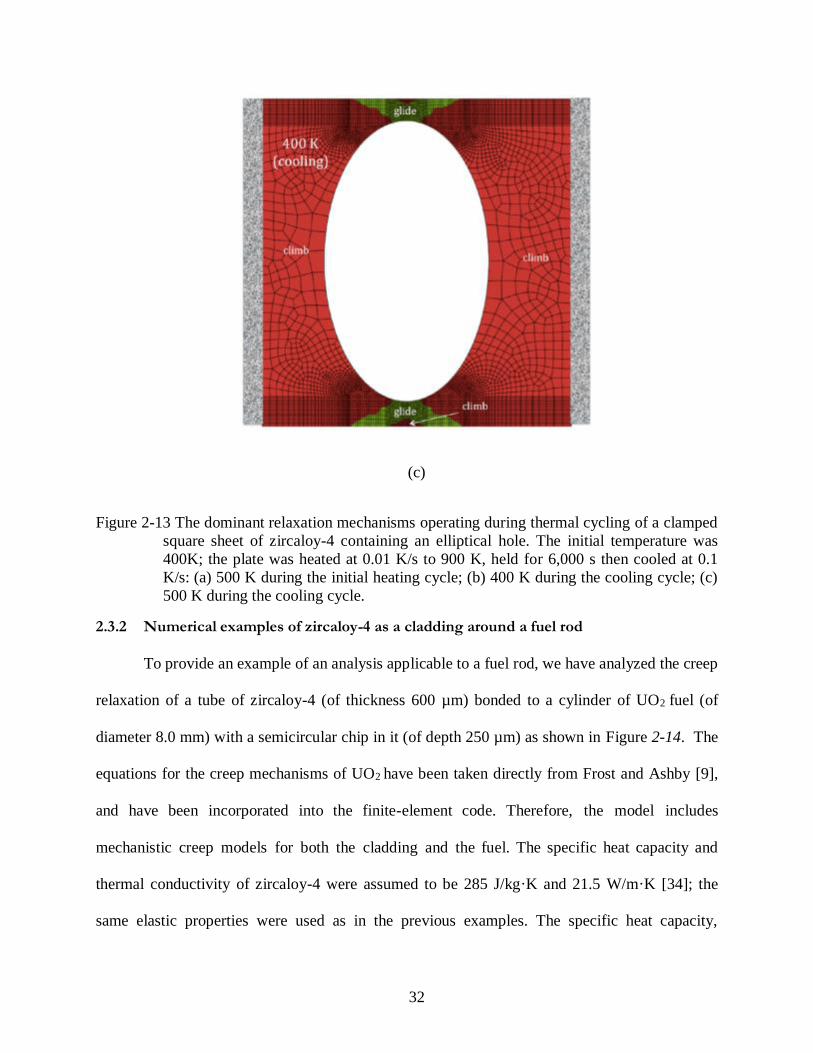
32
(c)
Figure 2-13 The dominant relaxation mechanisms operating during thermal cycling of a clamped
square sheet of zircaloy-4 containing an elliptical hole. The initial temperature was
400K; the plate was heated at 0.01 K/s to 900 K, held for 6,000 s then cooled at 0.1
K/s: (a) 500 K during the initial heating cycle; (b) 400 K during the cooling cycle; (c)
500 K during the cooling cycle.
2.3.2 Numerical examples of zircaloy-4 as a cladding around a fuel rod
To provide an example of an analysis applicable to a fuel rod, we have analyzed the creep
relaxation of a tube of zircaloy-4 (of thickness 600 µm) bonded to a cylinder of UO2 fuel (of
diameter 8.0 mm) with a semicircular chip in it (of depth 250 µm) as shown in Figure 2-14. The
equations for the creep mechanisms of UO2 have been taken directly from Frost and Ashby [9],
and have been incorporated into the finite-element code. Therefore, the model includes
mechanistic creep models for both the cladding and the fuel. The specific heat capacity and
thermal conductivity of zircaloy-4 were assumed to be 285 J/kg·K and 21.5 W/m·K [34]; the
same elastic properties were used as in the previous examples. The specific heat capacity,
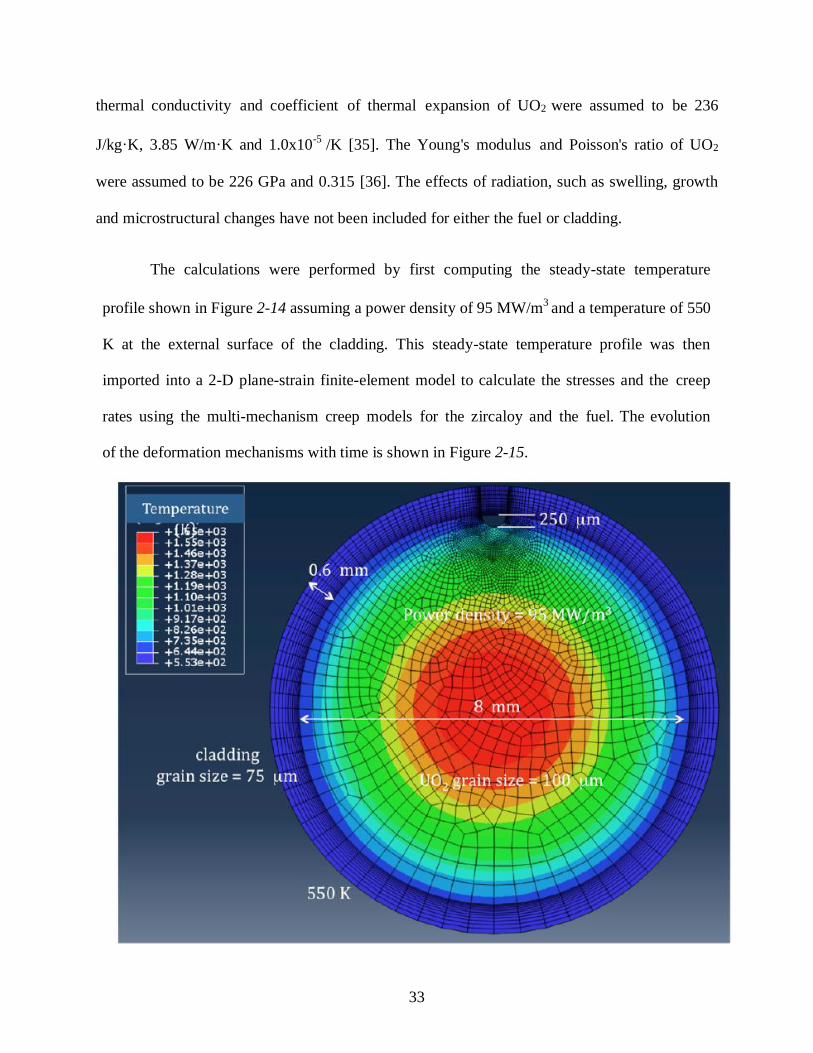
33
thermal conductivity and coefficient of thermal expansion of UO2 were assumed to be 236
J/kg·K, 3.85 W/m·K and 1.0x10⁻⁵
/K [35]. The Young's modulus and Poisson's ratio of UO2
were assumed to be 226 GPa and 0.315 [36]. The effects of radiation, such as swelling, growth
and microstructural changes have not been included for either the fuel or cladding.
The calculations were performed by first computing the steady-state temperature
profile shown in Figure 2-14 assuming a power density of 95 MW/m3 and a temperature of 550
K at the external surface of the cladding. This steady-state temperature profile was then
imported into a 2-D plane-strain finite-element model to calculate the stresses and the creep
rates using the multi-mechanism creep models for the zircaloy and the fuel. The evolution
of the deformation mechanisms with time is shown in Figure 2-15.
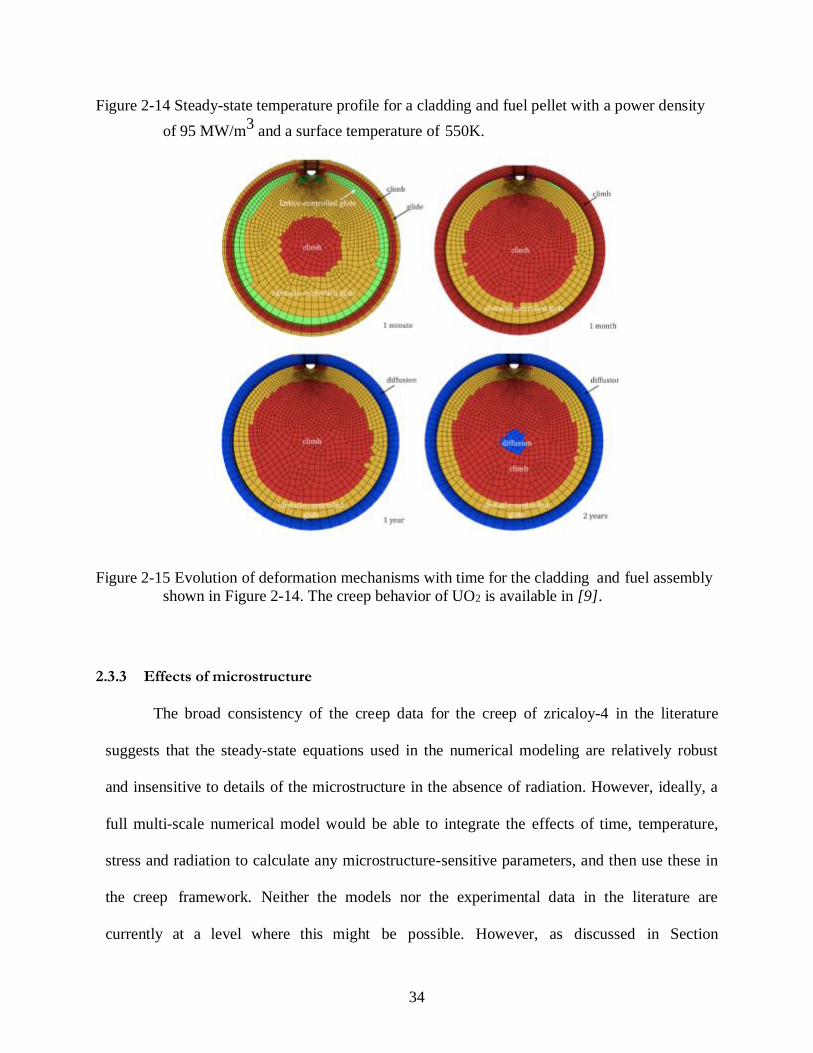
34
Figure 2-14 Steady-state temperature profile for a cladding and fuel pellet with a power density
of 95 MW/m3
and a surface temperature of 550K.
Figure 2-15 Evolution of deformation mechanisms with time for the cladding and fuel assembly
shown in Figure 2-14. The creep behavior of UO2 is available in [9].
2.3.3 Effects of microstructure
The broad consistency of the creep data for the creep of zricaloy-4 in the literature
suggests that the steady-state equations used in the numerical modeling are relatively robust
and insensitive to details of the microstructure in the absence of radiation. However, ideally, a
full multi-scale numerical model would be able to integrate the effects of time, temperature,
stress and radiation to calculate any microstructure-sensitive parameters, and then use these in
the creep framework. Neither the models nor the experimental data in the literature are
currently at a level where this might be possible. However, as discussed in Section
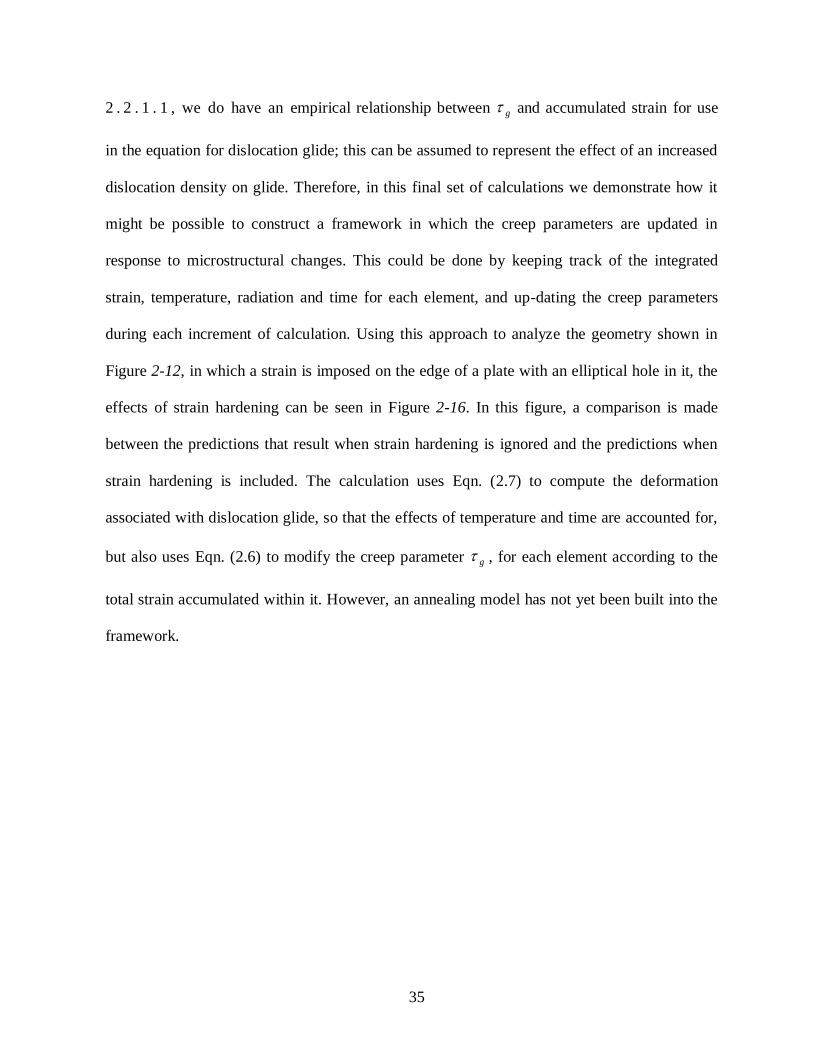
35
2 . 2 . 1 . 1 , we do have an empirical relationship between g and accumulated strain for use
in the equation for dislocation glide; this can be assumed to represent the effect of an increased
dislocation density on glide. Therefore, in this final set of calculations we demonstrate how it
might be possible to construct a framework in which the creep parameters are updated in
response to microstructural changes. This could be done by keeping track of the integrated
strain, temperature, radiation and time for each element, and up-dating the creep parameters
during each increment of calculation. Using this approach to analyze the geometry shown in
Figure 2-12, in which a strain is imposed on the edge of a plate with an elliptical hole in it, the
effects of strain hardening can be seen in Figure 2-16. In this figure, a comparison is made
between the predictions that result when strain hardening is ignored and the predictions when
strain hardening is included. The calculation uses Eqn. (2.7) to compute the deformation
associated with dislocation glide, so that the effects of temperature and time are accounted for,
but also uses Eqn. (2.6) to modify the creep parameter g , for each element according to the
total strain accumulated within it. However, an annealing model has not yet been built into the
framework.

36
Figure 2-16 Nominal stress-strain curves for the geometry of Figure 2-12 with a nominal applied
strain rate of 1/s, showing the effects of work hardening on the creep curves.
2.4 Conclusions
While deformation maps were first conceived and developed more than thirty years ago,
there do not seem to have been significant attempts during the intervening period to incorporate
the concepts of multi-mechanism models into a framework for continuum-level finite-element
creep problems. However, the computing power now available makes this a relatively simple
concept to implement. Such a frame-work allows the constitutive creep equations appropriate for
a particular set of temperatures and stresses to be automatically invoked during a creep analysis,
so that different mechanisms and creep equations can operate as appropriate in different regions
and at different times during a finite-element analysis. From a creep-analysis perspective, this
approach has many advantages: (i) the creep mechanism does not have to be postulated a priori
before the analysis begins; (ii) design spaces can be extrapolated to regimes outside those
37
covered by empirical equations; (iii) it lends itself to integration with lower-length scale models
for microstructural changes; and (iv) different dominant mechanisms can be visualized as a
function of space and time in the out-put of numerical calculations.
The mechanisms of creep for zircaloy-4 have been studied for many years. By re-
analyzing the available experimental data, a deformation mechanism map has been developed for
unirradiated zircaloy-4. This has then been used in illustrative examples of the multi-mechanism
creep model. The consistency of all the experimental data for zircaloy-4 over four decades
indicates that effects of microstructure and texture are reasonably small in the absence of
radiation. This consistency means that useful analyses can be developed at the continuum level,
and justifies the use of a continuum creep model that uses effective stresses for complex multi-
axial stress states. However, there are clearly missing areas of experimental data that would be
required for a more comprehensive model. In particular, the data for the diffusional creep that
operates at low stresses are too limited to build an accurate model from.
To realize an ultimate goal of multi-scale modeling in a nuclear reactor, additional
models need to be developed that would link the effects of radiation to creep, including radiation
growth, radiation creep, and changes in microstructure. While an on-going project will attempt to
incorporate some of these effects into the creep frame-work, there are many aspects in which the
present results should be of practical use. For example, in the problem of grid-to-rod fretting,
different creep mechanisms play an important role in the deformation of the classing, and in the
relaxation of the contact stresses between the grid and the cladding (which will lead to fretting).
Current empirical models apply only in a very limited temperature and stress range, which are
not appropriate for all aspects of the problem. An accurate prediction of the changes in geometry

38
and evolution of the contact stresses require an accurate creep model that can automatically
capture the mechanism change, in addition to a detailed understanding of radiation effects.
Furthermore, the development of continuum-level radiation creep models and correlation to
experimental results will require these creep models, so that the effects of radiation and stress
can be isolated from the effects of stress alone.
Chapter 2 is reproduced from the publication:
H. Wang, Z. Hu, W. Lu, and M. Thouless, "A mechanism-based framework for the numerical
analysis of creep in zircaloy-4." Journal of Nuclear Materials, 433, 188-198, 2013.
39
Chapter 3 The effect of coupled wear and creep during grid-to-rod
fretting
3.1 Introduction
Grid-to-rod fretting (GTRF) induced by turbulence in the coolant can cause wear of the
zirconium alloy used as cladding for the fuel in pressurized-water reactors [37]. This wear
mechanism is a major cause of leaking fuel, and is a significant concern for the design and safety
of reactors. The contact pressure between the grid and cladding, which can relax as a result of
both wear and creep, controls the wear rate. Eventually, the contact pressure can relax to such an
extent that a gap opens up between the two components. Once this happens, the wear process
changes to one associated with dynamic impact [5, 38]. Modeling the first stage of the fretting
process, where wear and creep interact, is complicated by the fact that the two processes are
associated with very different time scales. The question of how to integrate the two time scales
into a numerical model of GTRF is the focus of the present study.
There are two types of frictional interaction across an interface: sticking and slipping [39].
Sticking occurs wherever the friction coefficient is sufficiently high to prevent relative sliding
between the two surfaces. If the contact stress relaxes sufficiently by creep, for example, then
40
the two components can slide relative to each other, and wear can occur at the interface. Full slip
occurs when there is sliding along an entire contact area. Partial slip occurs when the slip
condition is met on only a portion of the interface (usually close to the edge of a contact where
the shear stresses tend to be the highest).
Creep and wear can have very different characteristic times; this discrepancy needs to be
addressed when developing numerical models for the combined phenomena. For example, the
coolant in a reactor causes the rods to vibrate at relatively high frequencies [40, 41, 42]. To
capture the wear associated with each cycle would require very small time increments. However,
creep processes can take place over much longer time scales, depending on the stress level. The
use of time increments short enough to describe each wear cycle individually would not be an
efficient way to model creep. Conversely, the use of time increments large enough to model
creep efficiently would correspond to many wear cycles. The error associated with this could
lead to inaccuracies in both wear and creep calculations. This is the issue that motivated the work
described in this chapter, in which we discuss the use of an algorithm to determine the
appropriate time increments that should be used to couple the two mechanisms efficiently, but
without significant loss of accuracy.
Conventional re-meshing algorithms to model a wear scar introduce another numerical
problem when trying to couple wear with creep. Re-meshing requires unloading the model; this
can cause loss of the loading history for the system. To overcome this difficulty, we use an
eigenstrain algorithm developed by Hu et al. [43] to model wear. This algorithm allows the
wear-scar profile to be updated dynamically without re-meshing, so the stress history is
maintained continuously. This feature makes the algorithm particularly useful in the coupled
wear-creep problem.
41
A complication associated with numerical models of creep is that the mechanism for
stress relaxation depends upon the temperature, stress level, radiation and time. So, the creep
law can change during the relaxation process. To address this issue, we use the creep model
developed by Wang et al. [4], in which a deformation map of zircaloy-4 is embedded within the
finite-element code, allowing the dominant mechanism to evolve naturally as the conditions
change.
In summary, in this chapter we present a numerical analysis of pin-on-grid wear during a
prolonged operation cycle for a pressurized-water reactor. The primary purpose of the work is to
illustrate how one can couple creep and wear, and to examine the regimes in which wear or creep
control the stress relaxation. We are not attempting to do a detailed analysis of wear scar
formation. There are too many parameters that are currently unknown in sufficient detail. So,
while the model includes some effects such as creep and swelling of the fuel for which we have
access to reasonable models or empirical data, we have not included important effects such as
radiation creep, hydride formation, or oxidation. The important results of this chapter are to
show how one can couple creep and wear in a numerical simulation, and to illustrate the types of
behavior that might occur prior to gap formation between the rod and grid.
3.2 Methodology
During the operation of a reactor, the coolant exerts a random vibration pressure on the
cladding surface. However, for the purposes of this study, we assume that the pressure, P, can be
described by a periodic sinusoidal form with a period of To that is in the range of 0.001s to 0.1s
[44] [45].
42
Within a single period of such a short duration, neither creep nor wear will cause
significant changes to the geometry or to the contact pressure. Therefore, the rate of wear over a
limited computational interval, Te, greater than To, will be constant. The wear damage that
accumulates over such a period can be approximated reasonably accurately by calculating the
wear over one cycle, but multiplying the wear coefficient by the ratio Te/To. This reduces the
number of cycles that have to be calculated, and makes the simulation more efficient. However,
the important question is how to ensure that Te is small enough so that any changes in the contact
pressure that occur during this interval don't affect the solution.
Optimizing the computational interval, Te, requires a balance between efficiency and
some small loss of accuracy associated with changes in the contact pressure that must occur
because of both wear and creep during this time. A criterion can be established in the form of
limiting the maximum allowable decrease in the contact pressure, p, at any point along the
interface2 to some acceptable fraction, , of the maximum contact pressure across the interface,
pmax:
p <pmax . (3.1)
A companion study [46, 47], has shown that choosing a value of less than about 3% is
more than adequate to provide solutions that are essentially independent of .
One numerical approach to this problem is to replace a block of vibrational cycles with a
single, lower-frequency cycle and use an enhanced wear coefficient to correct for the number of
cycles. However, such an approach neglects the possibility that creep alone can cause relative
2 The contact pressure at each node, or the average contact pressure across the interface, could also be used in
Eqn. 3. 1. However, our studies suggested that the use of the maximum contact pressure across the interface was the
best approach.

43
slip across an interface, and that this relative slip can contribute to wear. It would be wrong to
use an enhanced wear coefficient when calculating wear from any slip induced by creep.
Therefore. the interfacial slip resulting from the two phenomena needs to be separated.
To separate the two contributions to interfacial slip, the periodic excitation pressure is
replaced by the pressure history shown in Figure 3-1 . At the beginning of each new
computational interval, two cycles of oscillation are used to calculate the wear rate in a single
cycle. A steady state is established in periodic slip calculations after the first cycle; so, the wear
rate for a single cycle is calculated from the second cycle. After the second cycle, the oscillating
pressure is set to zero for the rest of the computational interval, Te; during this period, creep
relaxation can occur. At the end of the computational interval, the local wear at every point
along the interface is calculated using the enhanced wear coefficient for the damage induced by
the cyclic loading, and the regular wear coefficient for wear induced by any creep deformation.
At this stage the resultant change in contact pressure is calculated along the interface to
investigate how it compares with the pre-established criterion, and whether the computational
interval needs to be decreased for accuracy, or increased for efficiency.

44
Figure 3-1 The black, dashed line is the actual excitation force. The red, solid line is the
assumed force history that is used to couple wear and creep. Both creep and
tangential loading can both induce relative displacements across the interface.
Therefore, to separate the two effects, two actual cycles (with a period of T0) are
simulated without creep. Steady-state is reached after the first cycle, so it is the
second cycle that is used to compute wear damage from the oscillating force. After
this second cycle, no further vibrations are assumed, but creep is allowed to occur.
This results in some additional relative displacement and wear. The total wear is
assumed to be given by the sum of the damage accumulated in the second cycle
multiplied by a factor of Te /T0, plus the damage from associated with creep. The
maximum value of Te is set by imposing a limit on the drop in local contact stresses.
3.3 Model
3.3.1 Geometry and boundary conditions
A two-dimensional model was constructed to simulate the contact between the grid and
cladding (Figure 3-2), using the commercial finite-element code ABAQUS [48]. A simplified
model of a single cell was considered, with a symmetry plane at 45 to the horizontal (x-axis)
along which sliding can occur. The default contact elements of ABAQUS were placed on top of
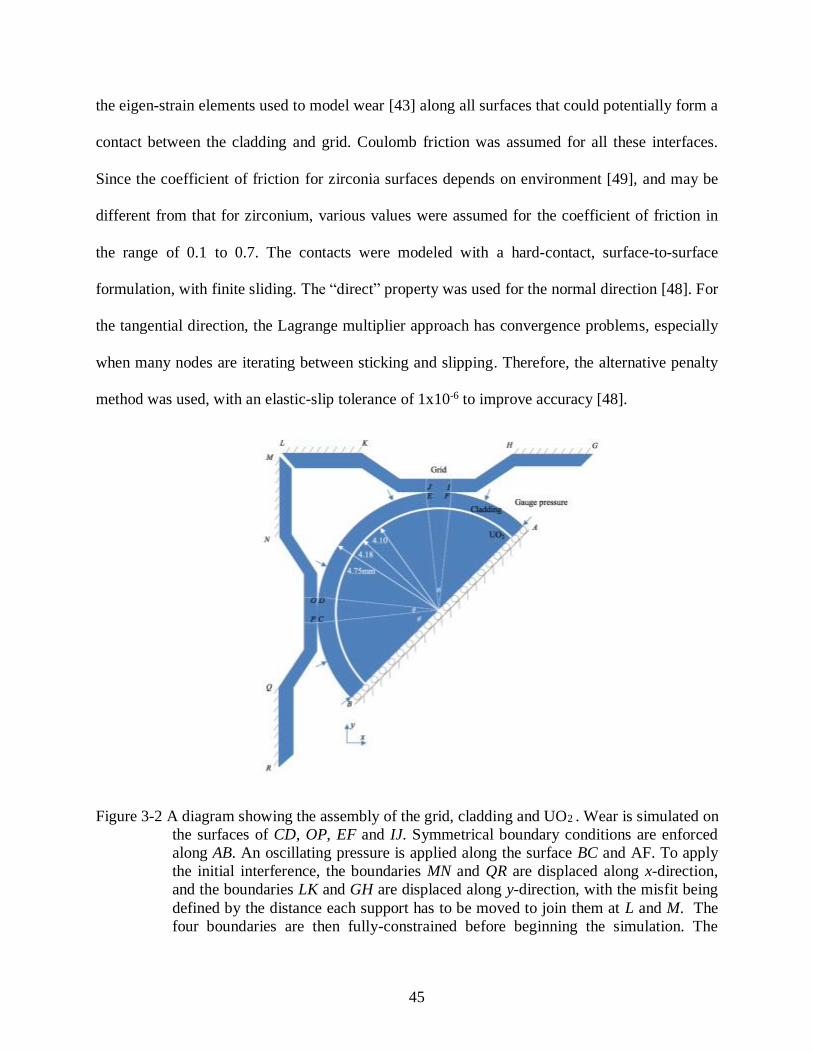
45
the eigen-strain elements used to model wear [43] along all surfaces that could potentially form a
contact between the cladding and grid. Coulomb friction was assumed for all these interfaces.
Since the coefficient of friction for zirconia surfaces depends on environment [49], and may be
different from that for zirconium, various values were assumed for the coefficient of friction in
the range of 0.1 to 0.7. The contacts were modeled with a hard-contact, surface-to-surface
formulation, with finite sliding. The “direct” property was used for the normal direction [48]. For
the tangential direction, the Lagrange multiplier approach has convergence problems, especially
when many nodes are iterating between sticking and slipping. Therefore, the alternative penalty
method was used, with an elastic-slip tolerance of 1x10⁻⁶ to improve accuracy [48].
Figure 3-2 A diagram showing the assembly of the grid, cladding and UO2 . Wear is simulated on
the surfaces of CD, OP, EF and IJ. Symmetrical boundary conditions are enforced
along AB. An oscillating pressure is applied along the surface BC and AF. To apply
the initial interference, the boundaries MN and QR are displaced along x-direction,
and the boundaries LK and GH are displaced along y-direction, with the misfit being
defined by the distance each support has to be moved to join them at L and M. The
four boundaries are then fully-constrained before beginning the simulation. The

46
angle , defining the regions DC and EF, has a value of 5, while the angle ’,
defining the point C has a value of 42.5.
An assumed misfit between the cladding and grid, associated with assembly, was
established at a reference temperature of 300 K. This was done by imposing a displacement on
the constrained surfaces of the grid (Figure 3-2) beyond that required for the grid just to make
contact with the surface of the cladding. Once this misfit had been imposed, the calculations
were subsequently conducted using the thermal and pressure conditions appropriate for the
service of reactors.
The thermal boundary conditions for the problem were established by assuming that the
power production in the fuel had a uniform value of 15 W/mm [50], and that the temperature of
the outer surface of the cladding was 600 K, corresponding to the temperature of the coolant. The
temperature-dependent thermal conductivities and the specific heats for the zircaloy and fuel
were taken from MATPRO models [51]. It was assumed that there was an initial gap of 0.08
mm between the inner surface of the cladding and the outer surface of the fuel. The gas in this
gap was assumed to be helium with a thermal conductivity of 0.00264T0.71 W/m K [51], where T
is the average temperature between the inner surface of the cladding and the outer surface of the
fuel. This value of thermal conductivity for a gas was used until direct contact between the fuel
and cladding occurred.
The mean level of the pressure outside the cladding was set to 16 MPa, and an internal
gas pressure of 4 MPa was assumed until contact occurred between the fuel and the cladding [52,
53]. In addition, a sinusoidal pressure with an amplitude of Po and a period of To = 0.1 s was
assumed to act on the section BC of the exterior surface of the cladding, with a corresponding

47
out-of-phase pressure acting on section AF. This results in an oscillatory motion along the
symmetry plane, and identical wear on the contacts EF and DC. The amplitude of the pressure,
Po, was assumed to vary between 0 and 0.04 MPa, as this corresponds to a range of excitation
forces of up to 0.5N/mm cited in the literature [54, 45]. In the calculations, the periodic loading
was replaced by a pressure-time history of the form shown in Figure 3-1. As discussed in
Section 3.2, this was done to allow creep and wear to be coupled efficiently.
3.3.2 Wear and creep models
The wear rate was calculated using Archard’s law [55]. In the two-dimensional
formulation used in this study, the incremental wear depth, W(s, t), at any location along a
contact, s, and at a given time, t, was calculated by
𝜕𝑊
𝜕∆(𝑠,𝑡)= 𝜇𝐾𝑝(𝑠, 𝑡), (3.2)
where K is the wear coefficient, p(s, t) is the local contact pressure, (s, t) is the local relative
slip between the two surfaces, and is the friction coefficient. During the numerical simulations,
both the local pressure and the slip across the contact were calculated using the ABAQUS
subroutine, URDFIL.3 A large range of wear coefficients, varying between 5x10⁻⁸ /MPa and
2x10⁻⁷ /MPa, has been reported in the literature [56, 57, 58], which was the range we chose to
explore here.
3 ABAQUS outputs the contact information for the “slave” surface only. URDFIL acquires
the contact information only for nodes on the “slave” surface, so only the pressure and slip on the
“slave” surface, set in this study to be the cladding surface, can be calculated. Therefore, the
contact regions of both the grid and the cladding were meshed identically, and the wear was
assumed to be the same for both surfaces.
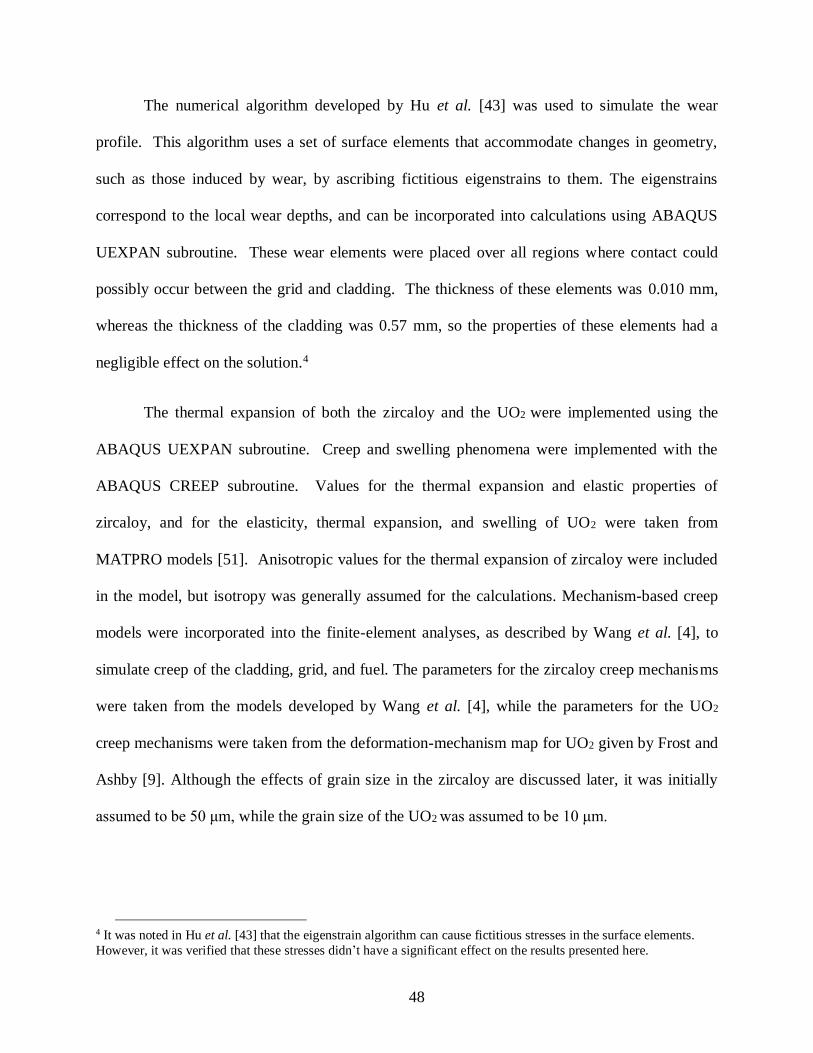
48
The numerical algorithm developed by Hu et al. [43] was used to simulate the wear
profile. This algorithm uses a set of surface elements that accommodate changes in geometry,
such as those induced by wear, by ascribing fictitious eigenstrains to them. The eigenstrains
correspond to the local wear depths, and can be incorporated into calculations using ABAQUS
UEXPAN subroutine. These wear elements were placed over all regions where contact could
possibly occur between the grid and cladding. The thickness of these elements was 0.010 mm,
whereas the thickness of the cladding was 0.57 mm, so the properties of these elements had a
negligible effect on the solution.4
The thermal expansion of both the zircaloy and the UO2 were implemented using the
ABAQUS UEXPAN subroutine. Creep and swelling phenomena were implemented with the
ABAQUS CREEP subroutine. Values for the thermal expansion and elastic properties of
zircaloy, and for the elasticity, thermal expansion, and swelling of UO2 were taken from
MATPRO models [51]. Anisotropic values for the thermal expansion of zircaloy were included
in the model, but isotropy was generally assumed for the calculations. Mechanism-based creep
models were incorporated into the finite-element analyses, as described by Wang et al. [4], to
simulate creep of the cladding, grid, and fuel. The parameters for the zircaloy creep mechanisms
were taken from the models developed by Wang et al. [4], while the parameters for the UO2
creep mechanisms were taken from the deformation-mechanism map for UO2 given by Frost and
Ashby [9]. Although the effects of grain size in the zircaloy are discussed later, it was initially
assumed to be 50 μm, while the grain size of the UO2 was assumed to be 10 μm.
4 It was noted in Hu et al. [43] that the eigenstrain algorithm can cause fictitious stresses in the surface elements.
However, it was verified that these stresses didn’t have a significant effect on the results presented here.
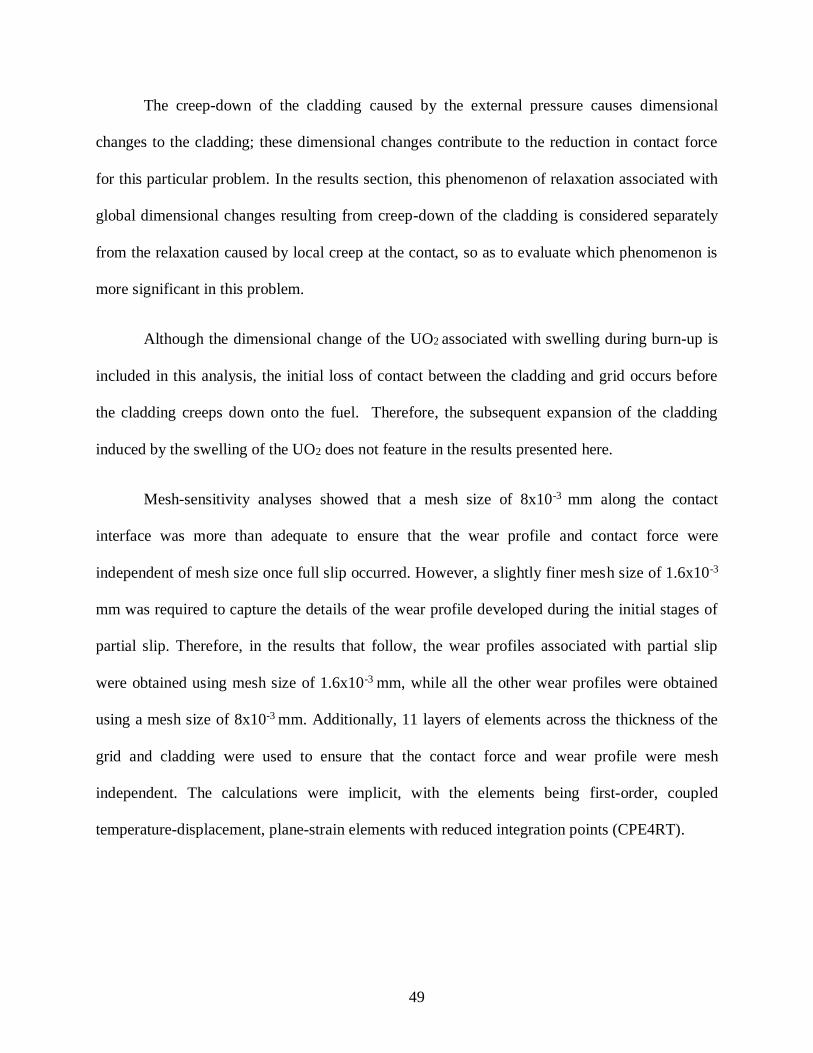
49
The creep-down of the cladding caused by the external pressure causes dimensional
changes to the cladding; these dimensional changes contribute to the reduction in contact force
for this particular problem. In the results section, this phenomenon of relaxation associated with
global dimensional changes resulting from creep-down of the cladding is considered separately
from the relaxation caused by local creep at the contact, so as to evaluate which phenomenon is
more significant in this problem.
Although the dimensional change of the UO2 associated with swelling during burn-up is
included in this analysis, the initial loss of contact between the cladding and grid occurs before
the cladding creeps down onto the fuel. Therefore, the subsequent expansion of the cladding
induced by the swelling of the UO2 does not feature in the results presented here.
Mesh-sensitivity analyses showed that a mesh size of 8x10⁻³ mm along the contact
interface was more than adequate to ensure that the wear profile and contact force were
independent of mesh size once full slip occurred. However, a slightly finer mesh size of 1.6x10⁻³
mm was required to capture the details of the wear profile developed during the initial stages of
partial slip. Therefore, in the results that follow, the wear profiles associated with partial slip
were obtained using mesh size of 1.6x10⁻³ mm, while all the other wear profiles were obtained
using a mesh size of 8x10⁻³ mm. Additionally, 11 layers of elements across the thickness of the
grid and cladding were used to ensure that the contact force and wear profile were mesh
independent. The calculations were implicit, with the elements being first-order, coupled
temperature-displacement, plane-strain elements with reduced integration points (CPE4RT).

50
3.4 Results and discussion
In this section we explore the relative importance of creep and wear on the stress
relaxation that leads to slip, to the development of a wear scar, and to the eventual loss of contact
between the cladding and grid. In this context, it is noted that there are two manifestations of
creep relaxation in this problem: it can cause relaxation of the local contact stresses directly
owing to creep at the contact region, and it can also cause general relaxation because of the
creep-down of the cladding onto the fuel. The approach we take in this chapter is to model
different problems, and then selectively "switch off" phenomena whose effects we wish to
explore to identify its contribution.
Since there is uncertainty about the value of several parameters, the results are presented
in a non-dimensional form. In particular, the Young’s modulus of zircaloy-4 at 600 K,
E = 71.6 GPa, the outer radius of the cladding, R = 4.75 mm, the cladding thickness,
h = 0.57 mm, and the natural period of the excitation pressure, To = 0.1 s, are used to normalize
the normal contact force, N, the wear depth, W, the time, t, and the distance from the center of
the contact region, x.
3.4.1 Relaxation from creep only
Creep can relax the stresses at the contacts. In particular, diffusional creep alone can
reduce the contact stresses to a very low level within the operating cycle of a reactor. Often the
analysis of creep in zircaloy focuses only on power-law creep. Figure 3-3a emphasizes why
diffusional creep must be included in long-term analyses, because it becomes the dominant
mechanism at low stresses. This figure shows that if diffusional creep is "switched off", and
only power-law creep is assumed to operate, the long-term stresses are much higher. This would
result in an underestimate of the extent of slip and wear.

51
Figure 3-3b separates the role of creep-down from the role of local stress relaxation at the contact.
By setting the gauge pressure to zero, the only creep process that can relax the stresses is the
local relaxation at the contact. Also, to compensate for the effect of removing the gauge pressure
on the initial contact force, an initial gap of 6.75x10⁻³ mm was introduced into the model, to keep
the initial contact force the same. It is clear that creep-down plays a dominant role in the
relaxation of the stresses at the contacts in this particular problem.
(a) (b)
Figure 3-3 Plots of total contact force per unit thickness, N, time t (a) Diffusional creep is
important for the relaxation of the contact force. The stress drops to low levels much
more slowly if diffusional creep mechanisms are ignored. (b) The role of creep-down
is separated from the role of local stress relaxation at the contact by setting the gauge
pressure to zero. It is clear that the creep-down process plays a dominant role in the
relaxation of the stresses at the contacts. In these plots, the contact force is normalized
by its initial value (N0 = 26.8 N/mm), and the time is normalized by the period of the
oscillations (To = 0.1 s).
3.4.2 Relaxation from wear only
The geometry of the contact at the pins is similar to that of a Hertzian contact. The wear
behavior for such a problem is well-known [59, 60]. If the coefficient of friction is less than the
ratio of the shearing force to the normal contact force, the entire interface will slip, and a wear

52
scar will develop across the entire contact. If the coefficient of friction is high enough to prevent
full slip, partial slip will occur at the edges of the contact. This will lead to localized wear scars
at the edges of the contact. However, in a perfectly elastic system with only Coulomb friction,
the wear scar will not propagate [60]. Propagation of the wear scar requires either a finite
interfacial strength [61], or some form of plasticity [62].
Figure 3-4 shows that creep is another mechanism that allows the wear scar to propagate
beyond the initial slip region. If there is no creep, wear only occurs in the initial slip region. The
scar gets deeper with time, it doesn't extend. With the misfit and turbulent pressures assumed in
this study, only unrealistically low values of friction coefficient would permit full slip across the
contact in a perfectly elastic system. Without any creep, the region of slip would be limited to a
very small portion of the interface, and the stress-relaxation associated with wear alone would be
negligible.

53
Figure 3-4 Creep causes the slip boundary to moves, so the wear scare propagates (solid square
data points). In the absence of creep, the wear scar just gets deeper (open circular
data points). In this plot the wear depth is normalized by the cladding thickness (h =
0.57 mm), and the position from the center of the contact is normalized by the outer
radius of the cladding (R = 4.75 mm).
3.4.3 Combined creep and wear
A major effect of creep during the wear process is to permit the wear scar to extend. This
is illustrated by the curve in Figure 3-4 which compares the wear scar that evolves at a fixed time
when there is creep, to the scar that evolves without creep. Since the region of slip and wear
propagates across the interface in the presence of creep, a condition of full-slip eventually
develops at the contact. This accelerates the wear process, which, in turn, reduces the time it
takes for contact to be lost. An example of how the contact force decays when there is only
creep, rather than combined creep and wear, is shown in Figure 3-5. It can be seen that
significant acceleration in the relaxation of the normal contact force occurs once full-slip
develops. However, as discussed above, this state of full-slip can only occur in the presence of
creep (except under extreme conditions, with very large sliding forces).

54
Figure 3-5 The effect of wear on the relaxation of the contact force. Initially, although there is
local wear damage caused by partial slip, the wear damage is too small to cause
significant relaxation. The stress relaxation is dominated by creep. The dramatic
increase in the rate of relaxation just before gap formation occurs is associated with
the onset of full slip. The contact force is normalized by its initial value, N0 = 26.8
N/mm, and the time is normalized by the period To = 0.1 s.
The wear profiles corresponding to the calculations of Figure 3-5 are shown in Figure 3-6,
at different times in the cycle. Initially, wear occurs just at the edges of the contact, where there
is slip. Creep allows the wear damage to progress towards the center of the contact. Eventually,
full-slip occurs, resulting in wear along the entire interface. This results in a final wear profile
that has a maximum depth in the middle of the contact.
55
(a) (b)
Figure 3-6 Wear profiles at different times. (a) Initially, wear occurs only at the edges of the
contact. As the contact force is relaxed by creep, the wear scars expands into the
middle. (b) At some point before they touch, full slip occurs, and wear then occurs
over the entire interface, eventually evolving into a profile where the maximum wear
depth is in the middle of the contact. In this plot the wear depth is normalized by the
cladding thickness (h = 0.57 mm), and the position from the center of the contact is
normalized by the outer radius of the cladding (R = 4.75 mm).
Figure 3-7 shows the same data for the evolution of the wear profile in the full-slip
regime as shown in Figure 3-6b, but now the data are plotted in a form that shows how the wear
profiles at different times collapse into a single master curve. The existence of such a master
curve provides a useful way of presenting wear scars non-dimensionally, as has been observed
and explained by other authors [63]. According to Archard’s law, the wear rate will be higher at
any point within a contact where the pressure is higher. The resultant increase in the local wear
rate will cause the local pressure to drop and, eventually, the pressure will become uniform
across the contact. Once the contact pressure is uniform, the wear rate also becomes uniform,
and a steady-state profile evolves.

56
Figure 3-7 The wear profile evolves homogeneously after the onset of full slip. By subtracting
the local wear depth from the maximum wear depth at any given moment, the wear
profiles at different times collapse onto a master curve. This homogeneous evolution
is attributed to a uniform dissipation of frictional energy. In this plot the wear depth
is normalized by the cladding thickness (h = 0.57 mm), and the position from the
center of the contact is normalized by the outer radius of the cladding (R = 4.75 mm).
3.4.4 Effects of friction coefficient, wear coefficient and amplitude of excitation force
Figure 3-8 shows the effects of friction coefficient (in the range of 0.1 to 0.7 [49]), wear
coefficient (in the range of 5x10⁻⁸ to 2x10⁻⁷ /MPa [56, 57, 58]), and amplitude of the excitation
pressure (consistent with excitation forces in the range of 0 to 0.5 N/mm [54, 45]) on the
relaxation of the normal contact force as a function of time. The onset of full-slip in these plots
can be identified by the sudden increase in the relaxation rate. These figures show the expected
results that the onset of full slip can be delayed either by decreasing the amplitude of the
excitation force or by increasing the coefficient of friction. The loss of contact occurs later if full
slip is delayed. There is no effect of wear coefficient on the onset of full slip, but once full slip
occurs loss of contact occurs more quickly for higher wear coefficients.
57
(a)
(b)

58
(c)
Figure 3-8 The effect of (a) the amplitude of the excitation force, (b) the friction coefficient, and
(c) the wear coefficient on the relaxation of the contact force as a function of time,
for no initial misfit. The contact force is normalized by the initial contact force
(No = 26.8 N/mm). The onset of full slip is delayed by a drop in the amplitude of the
excitation force and by an increase in the friction coefficient, leading to a longer time
before contact is lost. Conversely, while a decrease in the wear coefficient extends
the time until contact is lost, it has no effect on the onset of full slip.
As discussed above, the wear profile grows homogeneously during the full-slip stage.
Therefore, the wear profile corresponding to any particular value of maximum wear depth can be
obtained from the master curve. This is shown in Figure 3-9(a). Furthermore, as shown in
Figure 3-9(b), a systematic study of the effect of different variables shows that the depth of the
wear scar when contact is lost, Wmax, depends on the non-dimensional group 𝑃𝑜2𝐾𝑛𝑓/𝐸, where nf
is the number of wear cycles of full slip. This can be justified by a simple analysis of Archard's
law (Eqn. 3.2). The springs ensure that equilibrium is maintained until a gap is formed, so the
slip distance is proportional to the applied pressure and is inversely dependent on the stiffness of

59
the system. The total slip distance is also proportional to the number of cycles before contact is
lost. It is of interest to note that the wear depth at which contact is lost does not depend on . A
lower value of results in less wear, but more cycles are needed to lose contact. This can be
seen by the result for vary low value of = 0.01, which sits on the master curve.The two plots
shown in Figure 3-9 provide a general way of presenting the development of the wear scar in a
fashion that is not sensitive to the variables that are particularly poorly known for this problem -
Po and K
(a) (b)
Figure 3-9 (a) Plots of the wear profiles with no initial misfit at the time when contact is lost,
for different magnitudes of the wear coefficient, friction coefficient and excitation
force. None of these variables affect the shape of the master curve. (b) The
maximum wear depth depends on the square of the amplitude of the excitation
pressure, the wear coefficient and the number of cycles of full slip until contact is
lost, nf. The number of cycles of full slip depends on the friction coefficient. E is
Young's modulus of zircaloy.
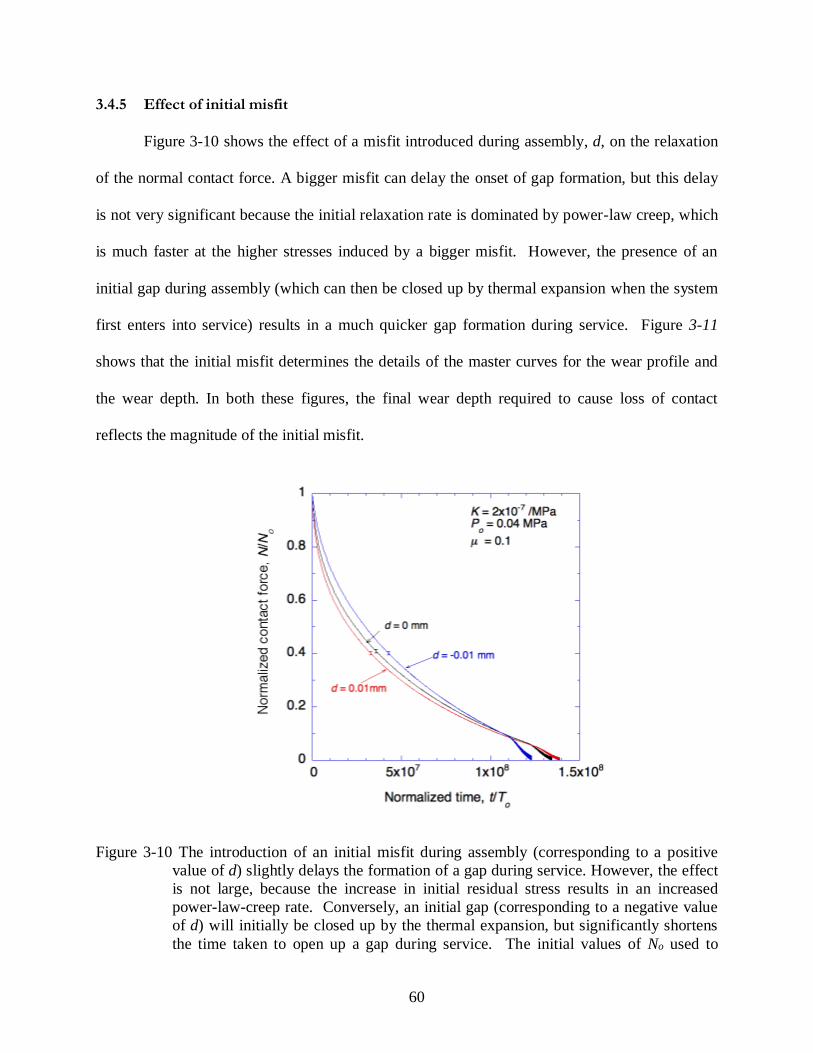
60
3.4.5 Effect of initial misfit
Figure 3-10 shows the effect of a misfit introduced during assembly, d, on the relaxation
of the normal contact force. A bigger misfit can delay the onset of gap formation, but this delay
is not very significant because the initial relaxation rate is dominated by power-law creep, which
is much faster at the higher stresses induced by a bigger misfit. However, the presence of an
initial gap during assembly (which can then be closed up by thermal expansion when the system
first enters into service) results in a much quicker gap formation during service. Figure 3-11
shows that the initial misfit determines the details of the master curves for the wear profile and
the wear depth. In both these figures, the final wear depth required to cause loss of contact
reflects the magnitude of the initial misfit.
Figure 3-10 The introduction of an initial misfit during assembly (corresponding to a positive
value of d) slightly delays the formation of a gap during service. However, the effect
is not large, because the increase in initial residual stress results in an increased
power-law-creep rate. Conversely, an initial gap (corresponding to a negative value
of d) will initially be closed up by the thermal expansion, but significantly shortens
the time taken to open up a gap during service. The initial values of No used to
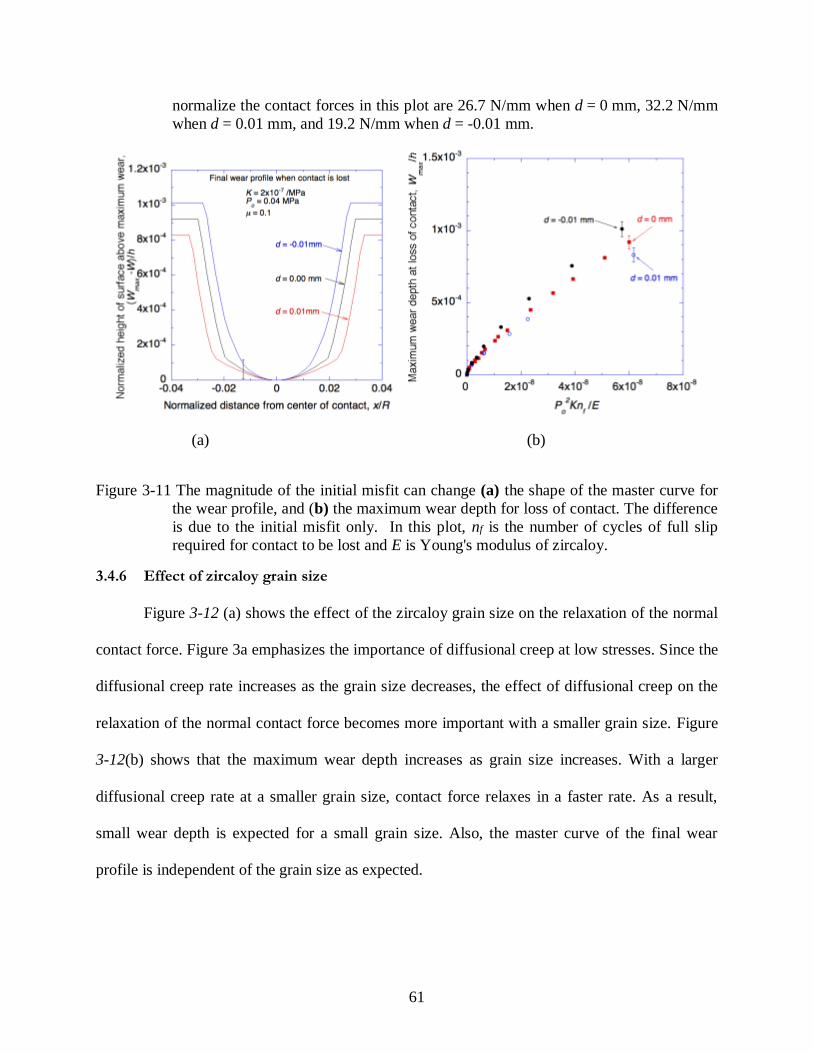
61
normalize the contact forces in this plot are 26.7 N/mm when d = 0 mm, 32.2 N/mm
when d = 0.01 mm, and 19.2 N/mm when d = -0.01 mm.
(a) (b)
Figure 3-11 The magnitude of the initial misfit can change (a) the shape of the master curve for
the wear profile, and (b) the maximum wear depth for loss of contact. The difference
is due to the initial misfit only. In this plot, nf is the number of cycles of full slip
required for contact to be lost and E is Young's modulus of zircaloy.
3.4.6 Effect of zircaloy grain size
Figure 3-12 (a) shows the effect of the zircaloy grain size on the relaxation of the normal
contact force. Figure 3a emphasizes the importance of diffusional creep at low stresses. Since the
diffusional creep rate increases as the grain size decreases, the effect of diffusional creep on the
relaxation of the normal contact force becomes more important with a smaller grain size. Figure
3-12(b) shows that the maximum wear depth increases as grain size increases. With a larger
diffusional creep rate at a smaller grain size, contact force relaxes in a faster rate. As a result,
small wear depth is expected for a small grain size. Also, the master curve of the final wear
profile is independent of the grain size as expected.
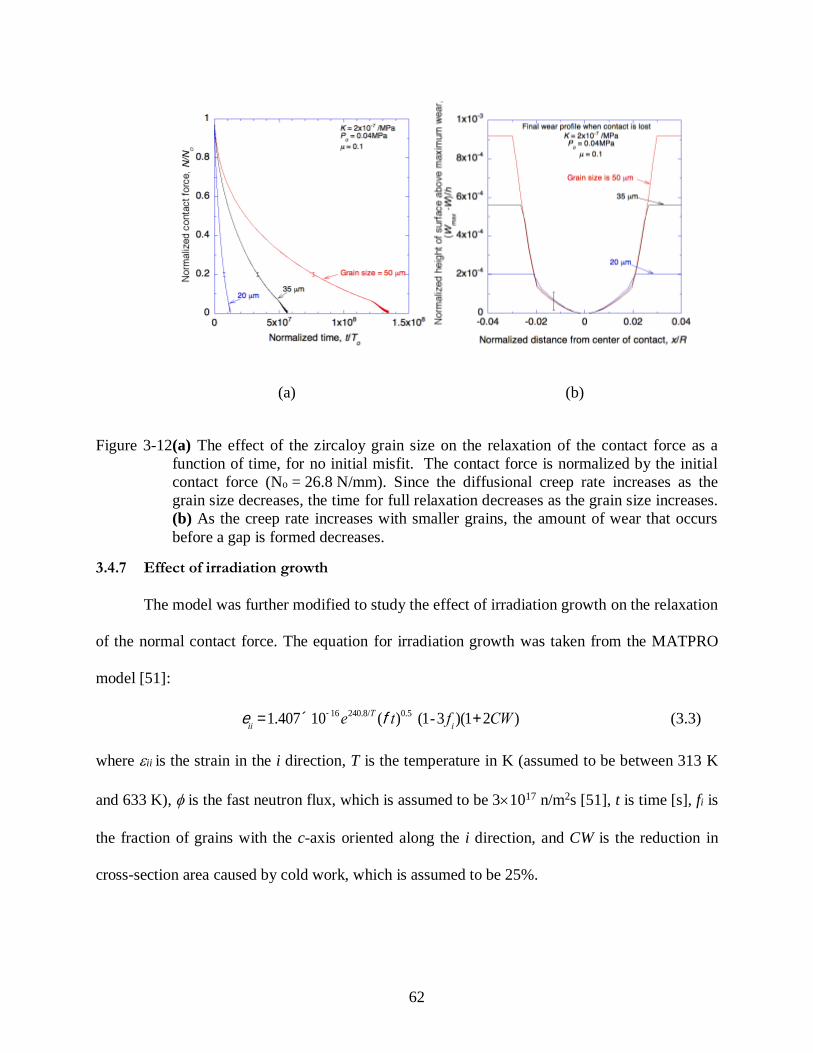
62
(a) (b)
Figure 3-12(a) The effect of the zircaloy grain size on the relaxation of the contact force as a
function of time, for no initial misfit. The contact force is normalized by the initial
contact force (No = 26.8 N/mm). Since the diffusional creep rate increases as the
grain size decreases, the time for full relaxation decreases as the grain size increases.
(b) As the creep rate increases with smaller grains, the amount of wear that occurs
before a gap is formed decreases.
3.4.7 Effect of irradiation growth
The model was further modified to study the effect of irradiation growth on the relaxation
of the normal contact force. The equation for irradiation growth was taken from the MATPRO
model [51]:
eii
=1.407´10-16e240.8/T (ft)0.5 (1-3 fi)(1+2CW ) (3.3)
where ii is the strain in the i direction, T is the temperature in K (assumed to be between 313 K
and 633 K), is the fast neutron flux, which is assumed to be 31017 n/m2s [51], t is time [s], fi is
the fraction of grains with the c-axis oriented along the i direction, and CW is the reduction in
cross-section area caused by cold work, which is assumed to be 25%.
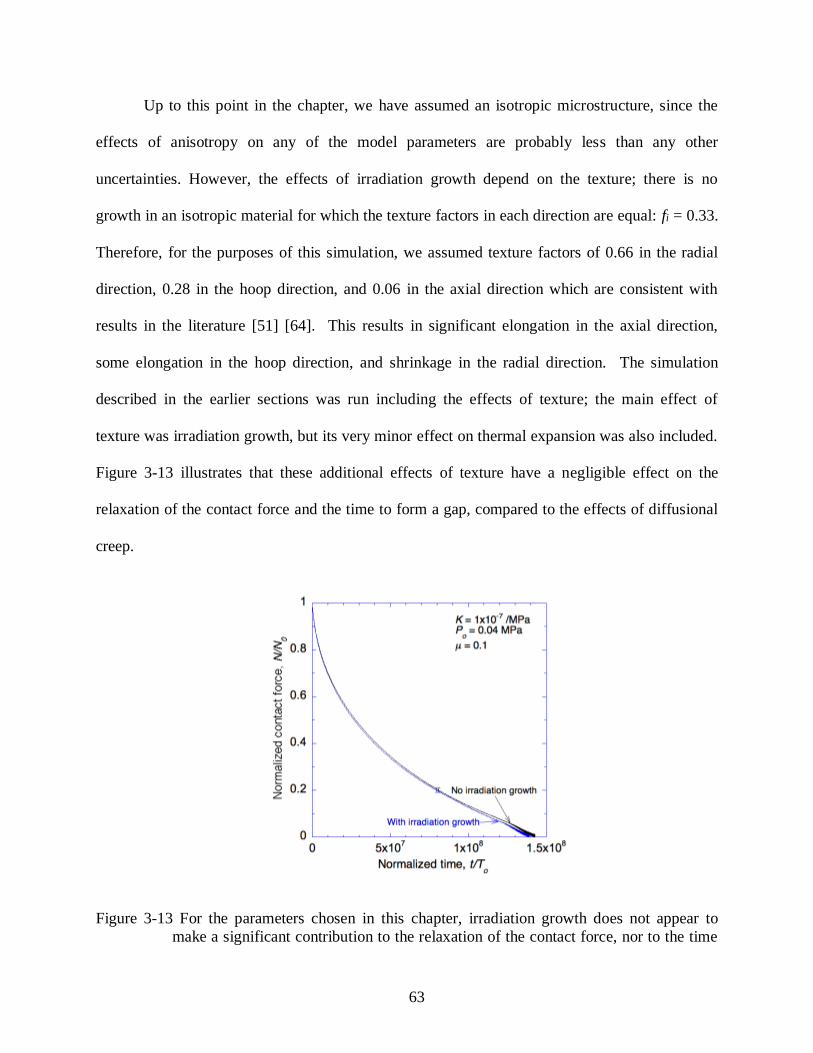
63
Up to this point in the chapter, we have assumed an isotropic microstructure, since the
effects of anisotropy on any of the model parameters are probably less than any other
uncertainties. However, the effects of irradiation growth depend on the texture; there is no
growth in an isotropic material for which the texture factors in each direction are equal: fi = 0.33.
Therefore, for the purposes of this simulation, we assumed texture factors of 0.66 in the radial
direction, 0.28 in the hoop direction, and 0.06 in the axial direction which are consistent with
results in the literature [51] [64]. This results in significant elongation in the axial direction,
some elongation in the hoop direction, and shrinkage in the radial direction. The simulation
described in the earlier sections was run including the effects of texture; the main effect of
texture was irradiation growth, but its very minor effect on thermal expansion was also included.
Figure 3-13 illustrates that these additional effects of texture have a negligible effect on the
relaxation of the contact force and the time to form a gap, compared to the effects of diffusional
creep.
Figure 3-13 For the parameters chosen in this chapter, irradiation growth does not appear to
make a significant contribution to the relaxation of the contact force, nor to the time
64
taken to form a gap. The initial contact force for this case is 27.5 N/mm. (This is
slightly larger than the corresponding initial contact force in earlier figures, because
of effects of anisotropy in the thermal expansion.)
3.5 Conclusions
In-pile relaxation of the contact force is a significant reason for the development of a
wear scar during grid-to-rod fretting. Both wear and creep are responsible for this relaxation of
the contact force, and a model has been developed to couple the two mechanisms. The two
processes occur at different time scales. Wear is associated with fluid-induced vibrations at
relatively high frequencies, so the time increment of any wear simulation needs to be fairly small.
However, creep occurs over relatively long time scales, and a time increment based on the
vibration frequency is not efficient for creep simulation. Therefore, an optimization method had
to be developed to couple the two mechanisms in a fashion that combines an acceptable level of
both efficiency and accuracy. This was done by developing an effective cycle, with a varying
period that depended on keeping the changes in normal contact pressure constant within some
acceptable limit.
One of the important contributions of creep to the wear process is that it allows a wear
scar to propagate across the entire contact. In a purely elastic system slip occurs only at the
edges of a contact. Any wear scar that develops in such a system does not grow with time; it just
gets deeper. However, creep relaxes the high stresses at the slip-stick boundary, allows the
region of slip (and wear) wear to propagate across the contact. This process eventually leads to
full slip across the entire contact, and the rate of wear increases significantly. Since the wear
damage before the onset of full-slip may be relatively minor, the time taken for the slip zone to
propagate across the entire interface may be manifested as an incubation period for wear damage.
65
The other aspect of creep that plays an important role in the wear process is stress
relaxation. This can be the result of both creep-down of the cladding onto the fuel, and of local
stress relaxation at the contacts. Creep-down appears to be more important in this particular
problem. Power-law creep is dominant at the initial stages of relaxation, when the stresses are
high. However, diffusional creep eventually becomes dominant. It is this mechanism that is
responsible for reducing the contact stresses to a very low level within the operating period of a
reactor, allowing full slip to occur across the contact. Owing to the dominance of diffusional
creep on the relaxation process, the grain size of the zircaloy will have a large effect on the time
taken for gap formation, with smaller grains resulting in a faster loss of contact.
By coupling the two mechanisms, simulations were conducted assuming different friction
coefficients, excitation pressures, wear coefficients and initial misfits to explore how the
different parameters affect both the wear profile and the time at which the grid and cladding lose
contact. The simulations indicate that two stages exist during the relaxation of the contact force:
partial slip and full slip. When partial slip occurs, the dominant relaxation mechanism is creep.
During this regime, the wear scar propagates across the contact, and there is a transition to full-
slip. Once full-slip occurs across the entire interface, and the contact forces are relatively low,
the creation of a wear scar becomes the dominant relaxation mechanism. In this regime, reducing
the wear coefficient and the amplitude of excitation force delays the formation of a gap between
the grid and cladding.
As is intuitively obvious, an initial gap between the grid and cladding created during
assembly results in the quicker formation of a gap during service. Conversely, an initial misfit
between the clad and pin will delay the gap formation. However, stress relaxation by power-law

66
creep is more rapid at high stresses, so any stress induced by an initial misfit tends to get relaxed
relatively quickly. This means that there is limited benefit to increasing the initial misfit.
The wear profile developed during full-slip occurs homogeneously. For a given initial
interference, there is a master curve for the wear scar, which does not depend on the friction
coefficient, the amplitude of the excitation pressure, or the wear coefficient. Therefore, the wear
profile is defined by the maximum wear depth that depends on the product of the square of the
excitation pressure times the wear coefficient and the number of wear cycles. The existence of
such a relationship means that the results presented in this chapter can be used to estimate the
effects of the parameters that particularly ill-defined for the GTRF problem.
Chapter 3 is reproduced from the publication:
H. Wang, Z. Hu, W. Lu, and M. Thouless, "The effect of coupled wear and creep during grid-to-
rod fretting." Nuclear Engineering and Design, 318, p. 163-173, 2017.
67
Chapter 4 A physics-based, multi-scale model for hydride formation
in zirconium alloy
4.1 Introduction
The zircaloy cladding of the fuel assembly, which contains the UO2 fuel, is important for
the safety of a pressurized-water reactor (PWR). However, when the reactor is operating, a
reaction between water and zirconium that generates hydrogen takes place on the surface of the
cladding. The hydrogen can diffuse into the cladding, and react with the zirconium to form a
hydride. The resultant hydride can lead to embrittlement, and cause degradation of the fuel
assembly.
4.1.1 Hydride formation in the nuclear reactor
There are three important phases of zirconium hydride (γ, δ and ε). The δ-hydride
(ZrH1.66) is the one usually seen in reactors [6]. The formation of this phase is associated with a
volumetric expansion of about 17% [8]; this causes misfit stresses and deformation of the
cladding [65]. The deformation can change the contact stresses between the supporting grid and
the fuel rod, which affects the wear associated with grid-to-rod fretting (GTRF) [58] [44].
Furthermore, the presence of hydride on the cladding surface can lead to locally high wear rates
[58], because the hydride can embrittle the zirconium [7]. The hydride can also jeopardize the
integrity of the cladding by hydride cracking [66] [67]. and hydride blistering [68] [65], leading

68
to severe safety issues for nuclear plants [69] [66] [70]. Issues such as the degree of
embrittlement, other changes in the material properties and deformation of the structure depend
on the volume fraction and orientation of hydride, which are both affected by and affect local
stress states [71] [72]. Therefore, accurate computational models of hydride formation and
dissolution that link local events to the continuum level need to be developed to study the
hydride-related structural behavior.
Models of hydride formation in the literature can be categorized into two groups. The
first group includes phase-field simulations at the mesoscale [73] [74] [75], in which hydride
nucleation and growth are the primary concerns. The second group includes continuum-level
simulations [76] [77] [78]], in which hydrogen diffusion, thermal analyses and stress analyses
are conducted at the engineering scale to compute hydride volume fractions. A connection
between these two scales is missing, and local changes in temperature, stress or hydrogen
concentration can affect the formation or dissolution of hydrides. In addition, the local hydride
nucleation rate, the terminal solid-solubility of hydrogen in -zirconium, and the hydride
composition can affect the volume fraction of hydrides and the corresponding local volume
expansions associated with hydride formation. Therefore, it is necessary to develop a framework
that bridges the simulations of hydride formation at the mesoscale and continuum-level.
4.1.2 Multi-scale modeling
A framework that links physical phenomena at different length and time scales is known
as multi-scale modeling [79] [80]. Multi-scale modeling has a wide application in material
science and solid mechanics [81]. In material science, one of the fundamental challenges of
multi-scale modeling is to develop suitable frameworks that allow the physics of phenomena
occurring at the atomistic scale to be incorporated into higher scales. As an example, the
69
analysis of creep deformation in large structures requires continuum-level, finite-element
calculations to compute local stresses and temperatures. These need to be integrated with
physics-based models of how the local microstructure evolves, and how atoms and dislocations
move in response to the local stresses and temperatures [4]. Owing to the complexities involved,
different types of analytical approaches are needed at different scales, and a major challenge is
establishing a framework by which models from different scales can be integrated.
Generally, there are two approaches of multi-scale modelling in material science: bottom-
up and top-down [82] [4] [80]. The bottom-up approach starts the modeling at the atomistic scale
moving up to the structural level. The top-down approach starts off with a continuum model of
the structural level and reaches down in a phenomenological fashion to pull information up from
lower-level scales on an as-needed basis. This approach has an advantage in allowing one to
identify more readily which lower-length-scale phenomena need to be included. Furthermore,
there are scales below which details of the microstructure and properties can only be described in
average material microstructure and properties. While specific microstructures can be analyzed
to describe the behavior of particular specimens, useful design approaches can only be developed
if microstructural details can be described by suitable averaging techniques.
In this chapter, a framework is constructed using the top-down approach to incorporate
results of a phase-field simulation of hydride formation into a continuum-level model. The
phase-field simulation is conducted separately from the continuum-level simulation to model
hydride formation and dissolution as a function of the local stress, temperature and hydrogen
concentration. The continuum model is used to calculate these parameters using bulk material
properties, diffusion laws, thermal analyses, mechanism-based creep models. Additionally, the
effects of the volume expansion associated with hydride formation on the local stresses are
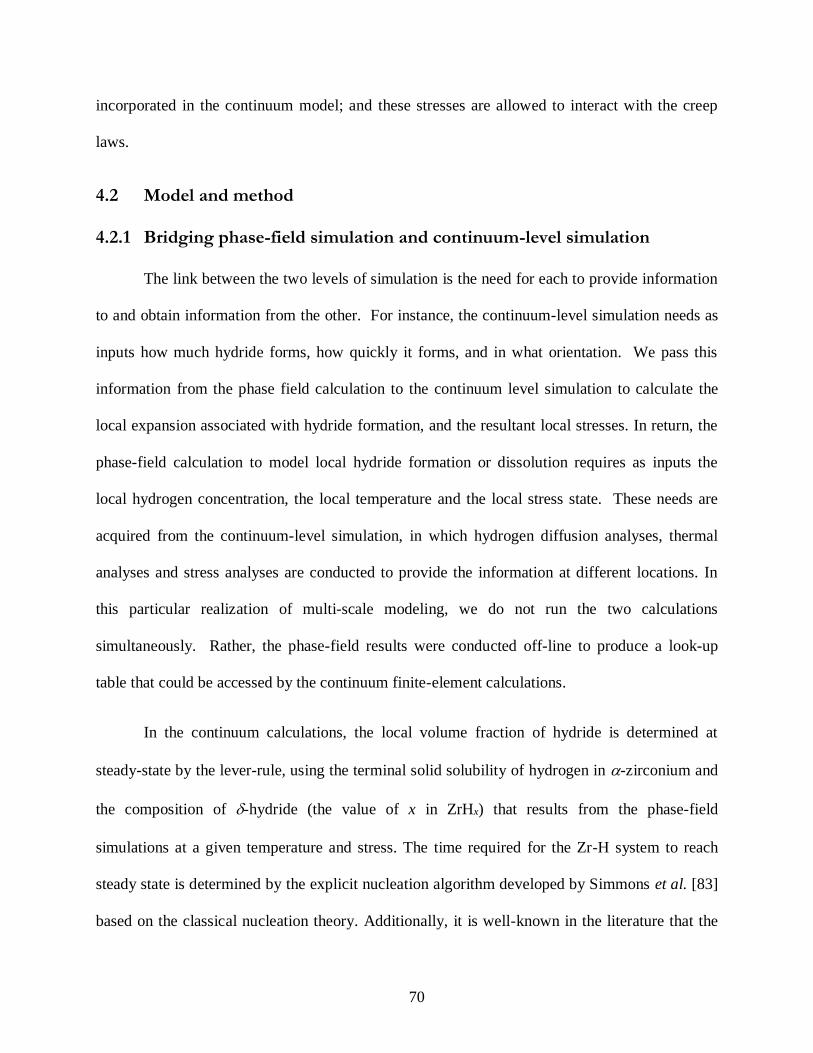
70
incorporated in the continuum model; and these stresses are allowed to interact with the creep
laws.
4.2 Model and method
4.2.1 Bridging phase-field simulation and continuum-level simulation
The link between the two levels of simulation is the need for each to provide information
to and obtain information from the other. For instance, the continuum-level simulation needs as
inputs how much hydride forms, how quickly it forms, and in what orientation. We pass this
information from the phase field calculation to the continuum level simulation to calculate the
local expansion associated with hydride formation, and the resultant local stresses. In return, the
phase-field calculation to model local hydride formation or dissolution requires as inputs the
local hydrogen concentration, the local temperature and the local stress state. These needs are
acquired from the continuum-level simulation, in which hydrogen diffusion analyses, thermal
analyses and stress analyses are conducted to provide the information at different locations. In
this particular realization of multi-scale modeling, we do not run the two calculations
simultaneously. Rather, the phase-field results were conducted off-line to produce a look-up
table that could be accessed by the continuum finite-element calculations.
In the continuum calculations, the local volume fraction of hydride is determined at
steady-state by the lever-rule, using the terminal solid solubility of hydrogen in -zirconium and
the composition of -hydride (the value of x in ZrHx) that results from the phase-field
simulations at a given temperature and stress. The time required for the Zr-H system to reach
steady state is determined by the explicit nucleation algorithm developed by Simmons et al. [83]
based on the classical nucleation theory. Additionally, it is well-known in the literature that the
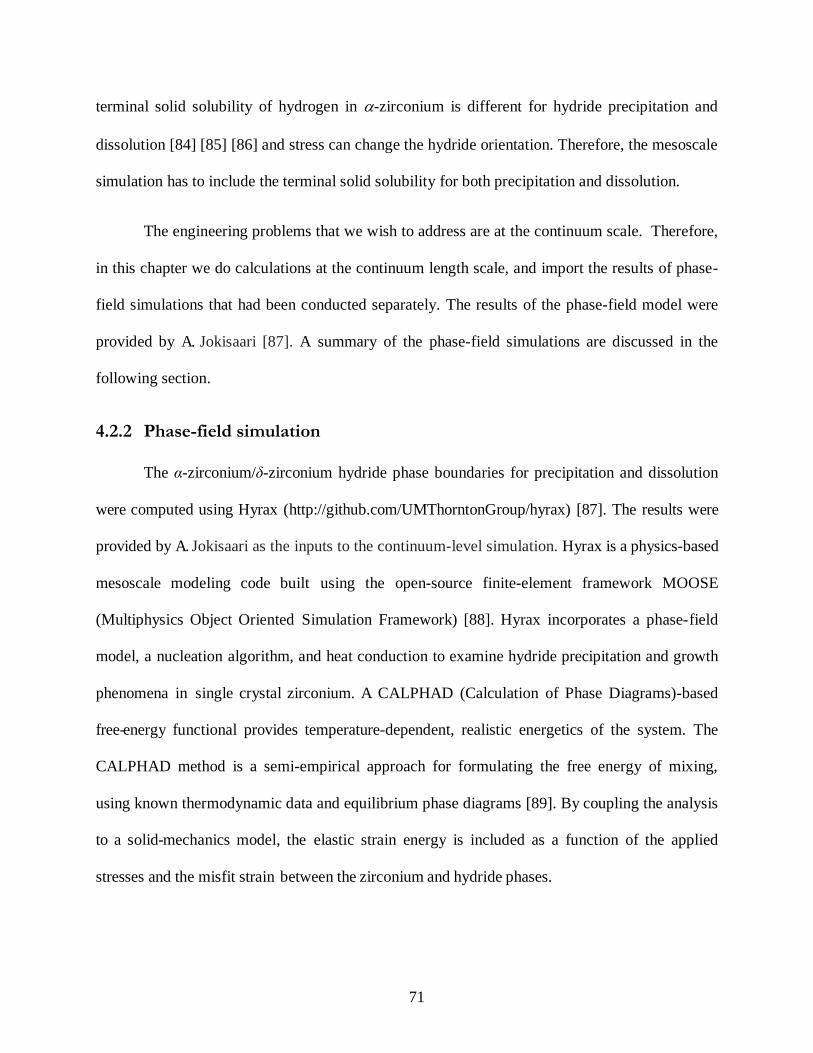
71
terminal solid solubility of hydrogen in -zirconium is different for hydride precipitation and
dissolution [84] [85] [86] and stress can change the hydride orientation. Therefore, the mesoscale
simulation has to include the terminal solid solubility for both precipitation and dissolution.
The engineering problems that we wish to address are at the continuum scale. Therefore,
in this chapter we do calculations at the continuum length scale, and import the results of phase-
field simulations that had been conducted separately. The results of the phase-field model were
provided by A. Jokisaari [87]. A summary of the phase-field simulations are discussed in the
following section.
4.2.2 Phase-field simulation
The α-zirconium/δ-zirconium hydride phase boundaries for precipitation and dissolution
were computed using Hyrax (http://github.com/UMThorntonGroup/hyrax) [87]. The results were
provided by A. Jokisaari as the inputs to the continuum-level simulation. Hyrax is a physics-based
mesoscale modeling code built using the open-source finite-element framework MOOSE
(Multiphysics Object Oriented Simulation Framework) [88]. Hyrax incorporates a phase-field
model, a nucleation algorithm, and heat conduction to examine hydride precipitation and growth
phenomena in single crystal zirconium. A CALPHAD (Calculation of Phase Diagrams)-based
free-energy functional provides temperature-dependent, realistic energetics of the system. The
CALPHAD method is a semi-empirical approach for formulating the free energy of mixing,
using known thermodynamic data and equilibrium phase diagrams [89]. By coupling the analysis
to a solid-mechanics model, the elastic strain energy is included as a function of the applied
stresses and the misfit strain between the zirconium and hydride phases.
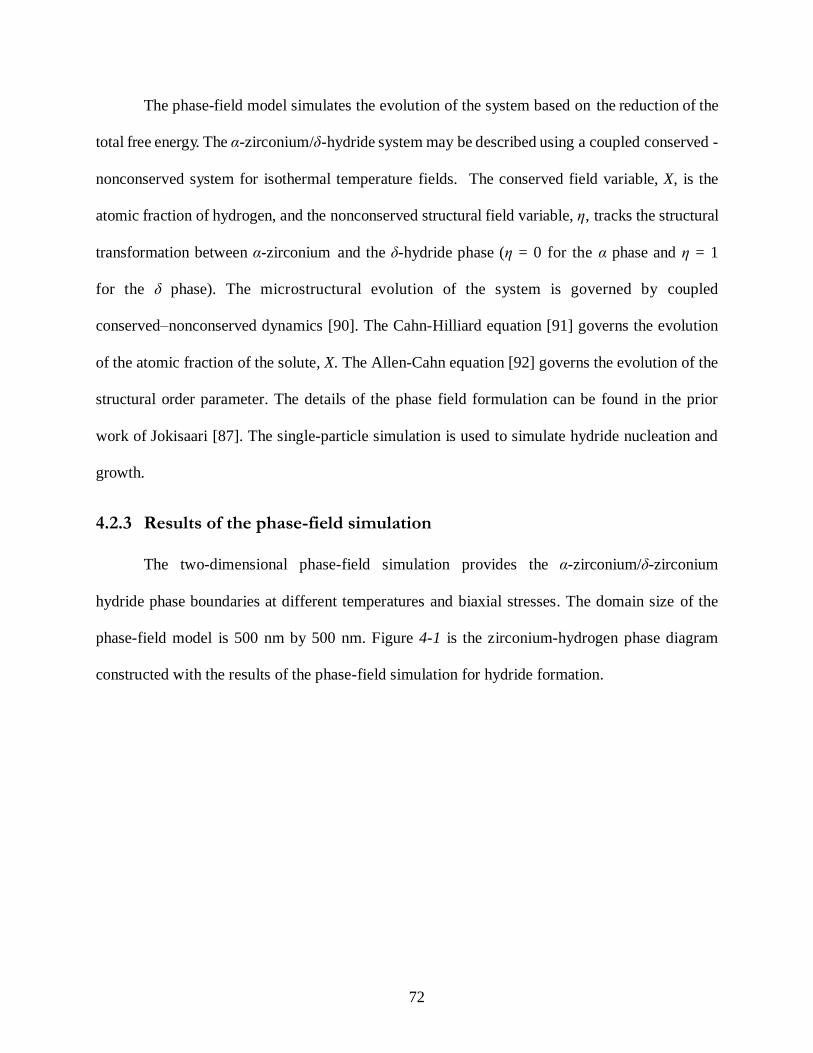
72
The phase-field model simulates the evolution of the system based on the reduction of the
total free energy. The α-zirconium/δ-hydride system may be described using a coupled conserved -
nonconserved system for isothermal temperature fields. The conserved field variable, X, is the
atomic fraction of hydrogen, and the nonconserved structural field variable, η, tracks the structural
transformation between α-zirconium and the δ-hydride phase (η = 0 for the α phase and η = 1
for the δ phase). The microstructural evolution of the system is governed by coupled
conserved–nonconserved dynamics [90]. The Cahn-Hilliard equation [91] governs the evolution
of the atomic fraction of the solute, X. The Allen-Cahn equation [92] governs the evolution of the
structural order parameter. The details of the phase field formulation can be found in the prior
work of Jokisaari [87]. The single-particle simulation is used to simulate hydride nucleation and
growth.
4.2.3 Results of the phase-field simulation
The two-dimensional phase-field simulation provides the α-zirconium/δ-zirconium
hydride phase boundaries at different temperatures and biaxial stresses. The domain size of the
phase-field model is 500 nm by 500 nm. Figure 4-1 is the zirconium-hydrogen phase diagram
constructed with the results of the phase-field simulation for hydride formation.
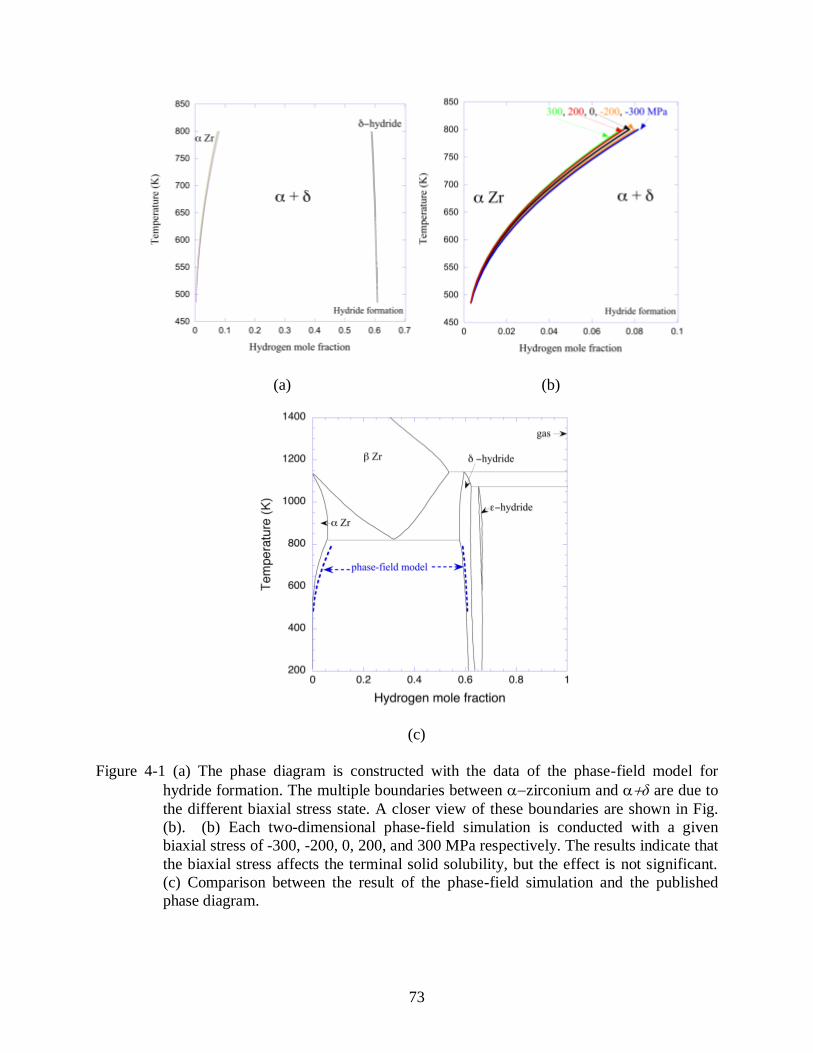
73
(a) (b)
(c)
Figure 4-1 (a) The phase diagram is constructed with the data of the phase-field model for
hydride formation. The multiple boundaries between zirconium and δ are due to
the different biaxial stress state. A closer view of these boundaries are shown in Fig.
(b). (b) Each two-dimensional phase-field simulation is conducted with a given
biaxial stress of -300, -200, 0, 200, and 300 MPa respectively. The results indicate that
the biaxial stress affects the terminal solid solubility, but the effect is not significant.
(c) Comparison between the result of the phase-field simulation and the published
phase diagram.
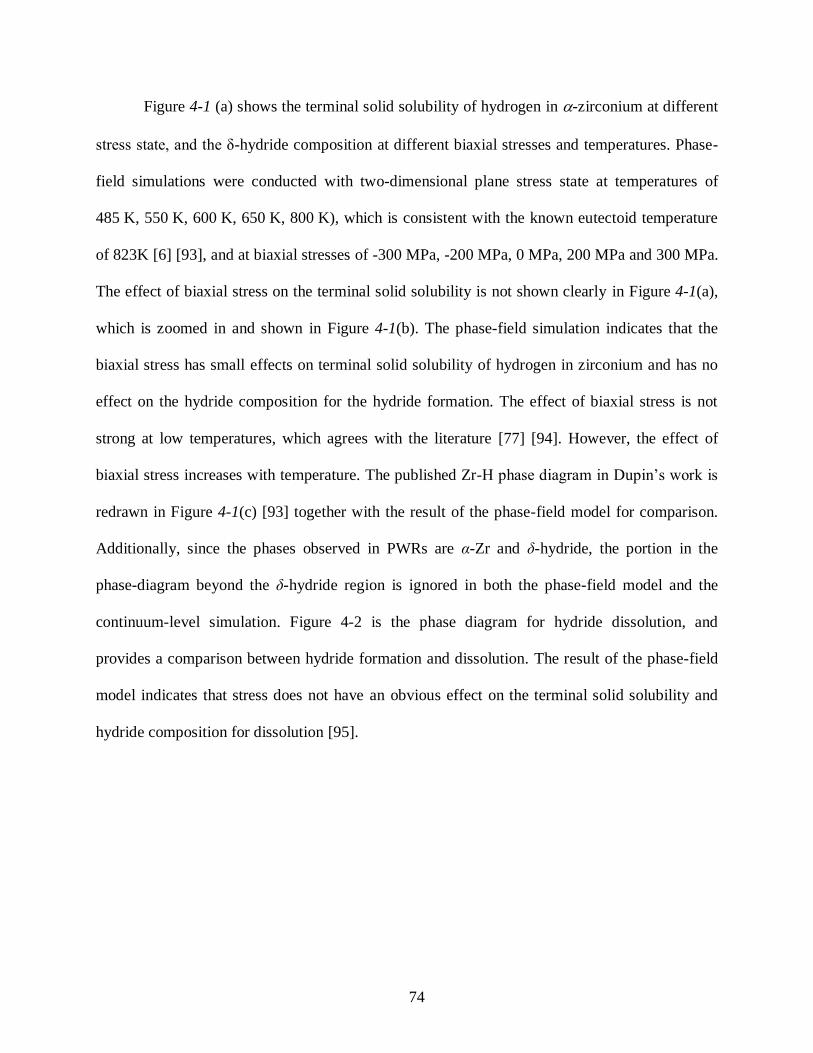
74
Figure 4-1 (a) shows the terminal solid solubility of hydrogen in -zirconium at different
stress state, and the δ-hydride composition at different biaxial stresses and temperatures. Phase-
field simulations were conducted with two-dimensional plane stress state at temperatures of
485 K, 550 K, 600 K, 650 K, 800 K), which is consistent with the known eutectoid temperature
of 823K [6] [93], and at biaxial stresses of -300 MPa, -200 MPa, 0 MPa, 200 MPa and 300 MPa.
The effect of biaxial stress on the terminal solid solubility is not shown clearly in Figure 4-1(a),
which is zoomed in and shown in Figure 4-1(b). The phase-field simulation indicates that the
biaxial stress has small effects on terminal solid solubility of hydrogen in zirconium and has no
effect on the hydride composition for the hydride formation. The effect of biaxial stress is not
strong at low temperatures, which agrees with the literature [77] [94]. However, the effect of
biaxial stress increases with temperature. The published Zr-H phase diagram in Dupin’s work is
redrawn in Figure 4-1(c) [93] together with the result of the phase-field model for comparison.
Additionally, since the phases observed in PWRs are α-Zr and δ-hydride, the portion in the
phase-diagram beyond the δ-hydride region is ignored in both the phase-field model and the
continuum-level simulation. Figure 4-2 is the phase diagram for hydride dissolution, and
provides a comparison between hydride formation and dissolution. The result of the phase-field
model indicates that stress does not have an obvious effect on the terminal solid solubility and
hydride composition for dissolution [95].
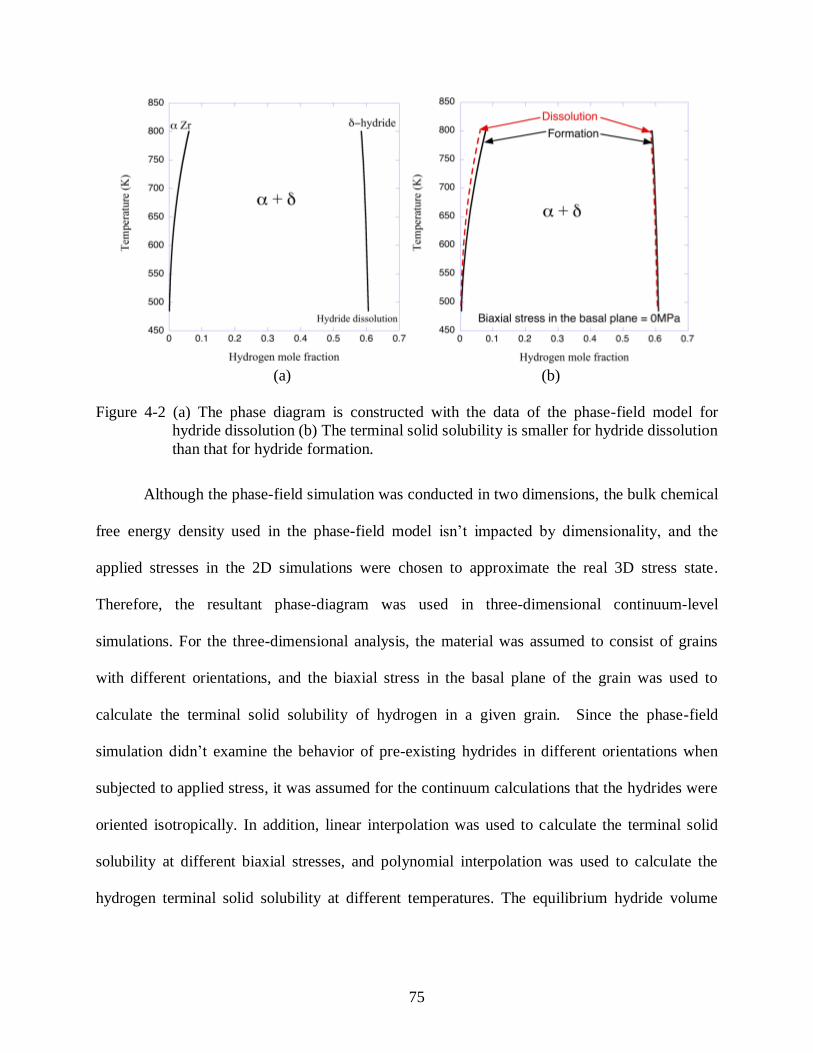
75
(a) (b)
Figure 4-2 (a) The phase diagram is constructed with the data of the phase-field model for
hydride dissolution (b) The terminal solid solubility is smaller for hydride dissolution
than that for hydride formation.
Although the phase-field simulation was conducted in two dimensions, the bulk chemical
free energy density used in the phase-field model isn’t impacted by dimensionality, and the
applied stresses in the 2D simulations were chosen to approximate the real 3D stress state.
Therefore, the resultant phase-diagram was used in three-dimensional continuum-level
simulations. For the three-dimensional analysis, the material was assumed to consist of grains
with different orientations, and the biaxial stress in the basal plane of the grain was used to
calculate the terminal solid solubility of hydrogen in a given grain. Since the phase-field
simulation didn’t examine the behavior of pre-existing hydrides in different orientations when
subjected to applied stress, it was assumed for the continuum calculations that the hydrides were
oriented isotropically. In addition, linear interpolation was used to calculate the terminal solid
solubility at different biaxial stresses, and polynomial interpolation was used to calculate the
hydrogen terminal solid solubility at different temperatures. The equilibrium hydride volume
76
fraction for hydride formation and dissolution was calculated from the results shown in Figure
4-1 and Figure 4-2, respectively.
The simulation of the hydride nucleation was also performed in two dimensions for a
given initial hydrogen concentration. The domain size was 500nm by 500nm. The results
indicated that equilibrium was reached in less than one second. This is faster than experimental
observations that indicate the Zr-H system reaches equilibrium in about 200s at 673K [96].
Hydride precipitation is a diffusion-controlled process [84] [96], and the time to reach the
equilibrium state depends on the spacing between nucleation sites [76] [97]. Therefore, to get
accurate numerical data that incorporate this effect, further phase-field simulations need be
conducted with domain sizes comparable to the grain size, to ensure appropriate spacing between
nuclei. Also, instead of using the single-particle simulation, the couple conserved-nonconserved
phase field model can be used to estimate the time required by the Zr-H system to reach
equilibrium [87].
However, in many applications, such as PWRs, where the time scale of interest is on the
order of months or years. it is not necessary to capture the time to reach the steady state, and the
system can be assumed to be in equilibrium. In terms of simulations, it is reasonable to assume
that the system is always in equilibrium provided the time required to reach the equilibrium state
is much smaller than the simulation time. In particular, for the simulations described in this and
the companion paper, the Zr-H system is considered to be in equilibrium during each time step
[98] [99] [78] [100]

77
4.2.4 Hydrogen diffusion in the continuum-level simulation
Water reacts with zirconium on the cladding surface, producing oxide and hydrogen.
Hydrogen diffuses into the cladding from the surface, and reacts with zirconium below the oxide
layer to produce hydride. Therefore, to calculate how much hydride forms, hydrogen diffusion
must be simulated to compute the hydrogen concentration at different locations. The governing
equation for hydrogen diffusion is
𝜕𝑐
𝜕𝑡= −𝛻 ⋅ 𝐉solid, (4. 1)
where c is the total hydrogen concentration and JSolid is the hydrogen flux in the solid solution.
Since the hydrogen is assumed to not diffuse in the hydride, the change of the total hydrogen
concentration depends on the hydrogen flux in the solid solution only. The flux is assumed to be
controlled by the gradients in the hydrogen concentration of the solid solution, the temperature
and the hydrostatic stress [98] [101] [102] [77]. Since it is assumed that the hydrogen in the
hydride does not diffuse, so the hydrogen flux in solid solution is reduced by a pre-factor of (1-
F). F is the hydride volume fraction. The equation used to determine the hydrogen flux in the
solid solution is given by [99] [78] [76]:
𝐉solid = (1 − 𝐹) [−𝐷𝛻𝑐𝐻 −DQ∗𝑐𝐻
RT2𝛻𝑇 −
D𝑐𝐻𝑉𝐻
RT𝛻𝜎𝐻], [4. 2]
where F is the volume fraction of hydride (0 ≤ F ≤ 1), cH is the hydrogen concentration in the
solid solution [mol/m3]. cH is the terminal solid solubility, cz when F > 0, and cH is the total
hydrogen concentration, c when F=0. The terminal solid solubility of hydrogen in -zirconium,
cz depends on the temperature and the biaxial stress in the basal plane. D is hydrogen diffusion
coefficient in -zirconium with the value of 2.17×10⁻⁷exp(-Q/RT) m2/s, where Q is 35000 J/mol

78
[103] [101]. R is the gas constant of 8.314 J/K mol, Q* is the heat of transport, VH is the molar
volume of hydrogen in the solid solution, and σH is the hydrostatic stress. Q* is 25100 J/mol [98].
VH is 1.67×10⁻⁶ m3/mol [102] [101].
4.2.5 Hydride volume fraction calculation in the continuum-level simulation
With the assumption that the Zr-H system is always in equilibrium, the hydride volume
fraction can be calculated using the lever rule:
𝐹 =𝑐−𝑐𝑧
𝑐ℎ−𝑐𝑧. (4. 3)
where ch is the hydrogen concentration in the δ-hydride. Since the terminal solid solubility is
different for hydride formation or dissolution, the hydride volume fraction calculation is
discussed further below.
The comparison shown in Figure 4-2 (b) illustrates a hysteresis associated with the fact
that the hydrogen solubility is smaller when hydride dissolves than when it forms [93] [102] This
figures shows that the terminal solid solubility for hydride dissolution, czTSSd, is smaller than the
terminal solid solubility for hydride precipitation, czTSSp, but the hydride composition is about the
same for precipitation and dissolution. Therefore, two hydride volume fractions associated with
dissolution and precipitation can be calculated:
𝐹𝑑 =𝑐𝑡+𝛥𝑡−𝑐𝑧
TSSd
𝑐ℎ−𝑐𝑧TSSd , (4. 4a)
𝐹𝑝 =𝑐𝑡+𝛥𝑡−𝑐𝑧
TSSp
𝑐ℎ−𝑐𝑧TSSp . (4. 4b)

79
Here 𝑐𝑡+𝛥𝑡is total hydrogen concentration at time t+t, and Fp and Fd are the equilibrium hydride
volume fractions at time t+t for precipitation and dissolution. If the hydride volume fraction at
time t is designated by Ft, the hydride volume fraction at time t+t is
𝐹𝑡+𝛥𝑡 = 𝐹𝑝 , if Ft < Fp; (4. 5a)
𝐹𝑡+𝛥𝑡 = 𝐹𝑡 , if Fp < Ft < Fd; (4. 5b)
𝐹𝑡+𝛥𝑡 = 𝐹𝑑 , if Ft > Fd. (4. 5c)
4.2.6 Material texture
The expansion caused by hydride formation is anisotropic [8]. Therefore, for a given
volume fraction of hydride, the local expansions will be different between regions of different
textures. These differences in local expansions will affect the local stresses and, according to the
phase-field simulations, the local stresses have a slight effect on the terminal solid solubility of
hydrogen in -zirconium. As a result, the extent of hydride formation is dependent on the local
texture, which should be incorporated in the continuum-level simulation. The definition of
texture and its effects on the expansion associated with hydride formation are discussed in
Appendix 4.A.
It should be noted, however, that in a design calculation, the actual grain orientations
cannot be known. All that might be known is a value for an average texture. It is the effect of an
average texture that is incorporated into our continuum model. An alternative problem, that we
do not address is one in which a specific system is modeled, where the individual grain
orientations are known a priori. This, however, is not a luxury of information that one has in a
general design problem of the type we are addressing in this work.

80
4.2.7 Thermal and mechanical material behaviors
A mechanism-based creep model for zircaloy [4] was used to simulate creep in the
zircaloy structure. An empirical thermal-expansion model of zircaloy [51] and elasticity [51]
were also implemented in the model. The thermal expansion of zircaloy was implemented with
ABAQUS UEXPAN subroutine. The creep was implemented with ABAQUS CREEP subroutine.
4.2.8 Flow chart of the continuum-level simulation
The geometry of the model was discretized in space to generate a mesh, which consisted
of elements and nodes. The hydride volume fraction, the hydrogen concentration, and the
mechanical and thermal boundary conditions, and hydrogen flux were defined as initial
conditions at the beginning of the simulation. The time-dependent partial differential equation
for hydrogen diffusion was solved by a finite-element method using the ABAQUS® subroutine,
URDFIL, to calculate the free hydrogen concentration at each node, with an implicit time
stepping (backward Euler method) being used for the discretization with respect to time. Other
routines in ABAQUS were used to do the thermal and mechanical analyses to compute the local
stresses and temperatures. These results were then combined to calculate the volume fraction of
hydride, using a look-up table from the phase-field results. The volume expansion resulting
from the new hydride distributions were then calculated to establish a new level of stress. If a
convergent result was obtained, the simulation moved to the next step. If the solution was not
convergent, the time increment was decreased until the result converged. The flow chart is
shown in Figure 4-3.

81
Figure 4-3 Flow chart illustrating the simulation steps
4.3 Results
4.3.1 Model validation
The model was used to simulate an experiment conducted by Sawatzky [98], and the
simulation result was compared with the experimental results for validation. Figure 4-4 (a) shows
the setup. A zircaloy cylinder with a length of 25 mm and a diameter of 12 mm was pre-charged
in hydrogen gas, and annealed at 1173 K for six hours to produce an initially uniform hydrogen
distribution of 130 wppm, which is about 850 mol/m3. It was then placed in a fixture that
allowed the two ends of the cylinder to be held at temperatures of 403K and 750K, respectively.
After being held for 34 days in the temperature gradient, the cylinder was removed and cut into 1
mm thick discs. These were analyzed for hydrogen by hot extraction, and the axial hydrogen
distribution determined. Our simulation follows the experimental setup exactly, and the
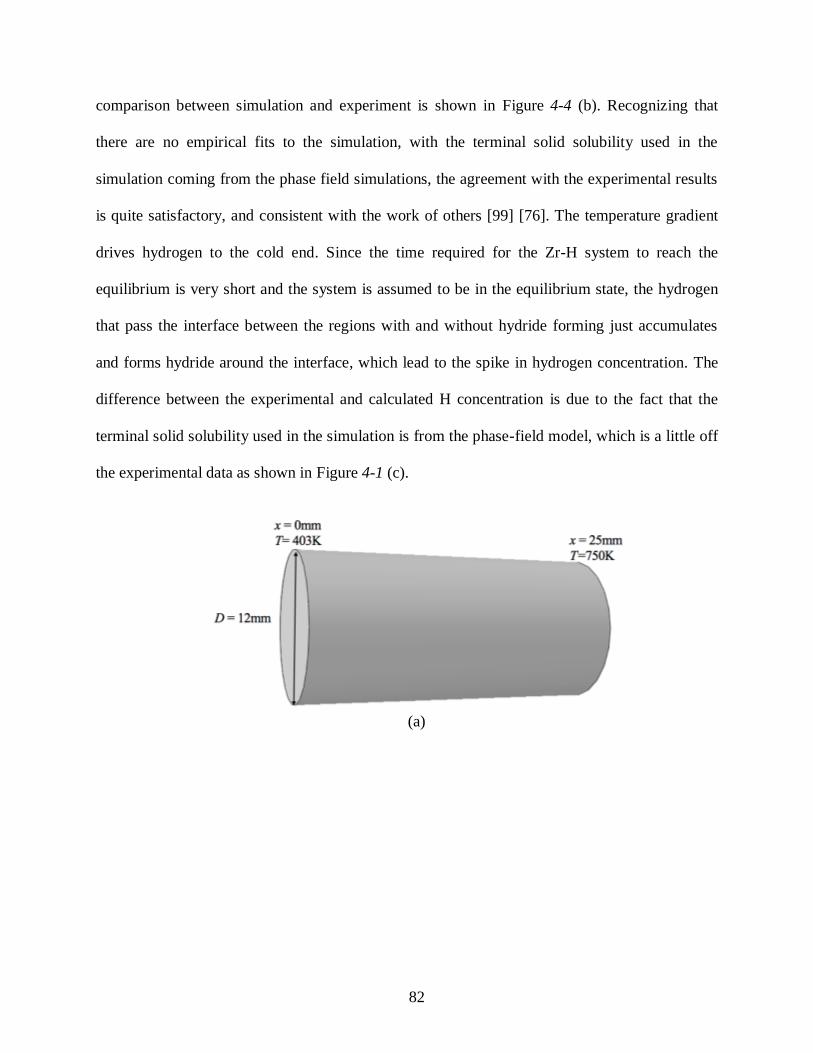
82
comparison between simulation and experiment is shown in Figure 4-4 (b). Recognizing that
there are no empirical fits to the simulation, with the terminal solid solubility used in the
simulation coming from the phase field simulations, the agreement with the experimental results
is quite satisfactory, and consistent with the work of others [99] [76]. The temperature gradient
drives hydrogen to the cold end. Since the time required for the Zr-H system to reach the
equilibrium is very short and the system is assumed to be in the equilibrium state, the hydrogen
that pass the interface between the regions with and without hydride forming just accumulates
and forms hydride around the interface, which lead to the spike in hydrogen concentration. The
difference between the experimental and calculated H concentration is due to the fact that the
terminal solid solubility used in the simulation is from the phase-field model, which is a little off
the experimental data as shown in Figure 4-1 (c).
(a)
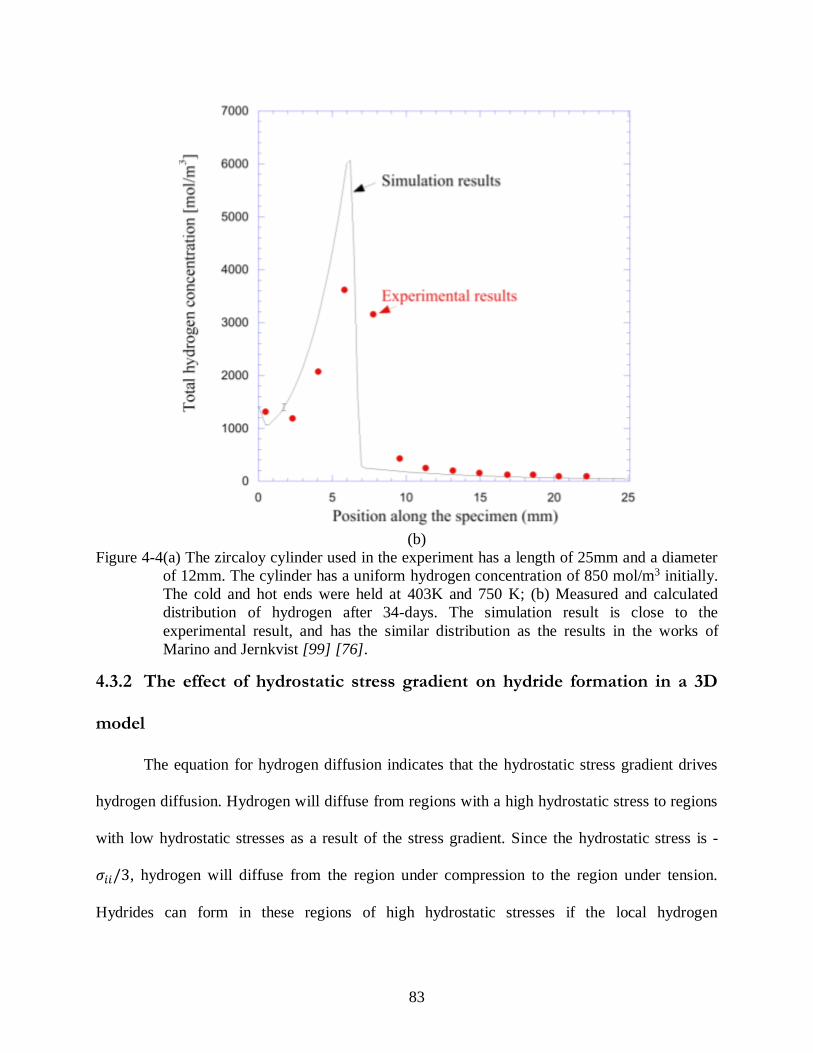
83
(b)
Figure 4-4(a) The zircaloy cylinder used in the experiment has a length of 25mm and a diameter
of 12mm. The cylinder has a uniform hydrogen concentration of 850 mol/m3 initially.
The cold and hot ends were held at 403K and 750 K; (b) Measured and calculated
distribution of hydrogen after 34-days. The simulation result is close to the
experimental result, and has the similar distribution as the results in the works of
Marino and Jernkvist [99] [76].
4.3.2 The effect of hydrostatic stress gradient on hydride formation in a 3D
model
The equation for hydrogen diffusion indicates that the hydrostatic stress gradient drives
hydrogen diffusion. Hydrogen will diffuse from regions with a high hydrostatic stress to regions
with low hydrostatic stresses as a result of the stress gradient. Since the hydrostatic stress is -
𝜎𝑖𝑖/3, hydrogen will diffuse from the region under compression to the region under tension.
Hydrides can form in these regions of high hydrostatic stresses if the local hydrogen

84
concentration exceeds the terminal solid solubility. The following example is an illustration of
this process.
Figure 4-5 shows the model geometry of a notched plate with a uniform initial hydrogen
concentration of 1240 mol/m3, held at a constant temperature of 600 K. The material was
assumed to be a zircaloy with a texture given by fx=0.66, fy=0.28 and fz=0.06, and a grain size of
50 μm. The terminal solid solubility of hydrogen in zirconium obtained from the mesoscale
simulation is about 1250 mol/m3 at 600K. Therefore, no hydride forms under the initial
conditions.
Figure 4-5 The dimensions of the plate model with a notch at the edge. The plate has a uniform
initial hydrogen concentration of 1240 mol/m3. The temperature of the plate is kept at
600K.
The, surface AB was then constrained along x-axis and a displacement of 2×10⁻³ mm was
applied to the surface CD along x-axis for a time of 5×10³ s. This results in a stress concentration
with high stresses around the tip of the notch during this period. Hydrogen diffused to the tip of

85
the notch to form hydride. Figure 4-6 (a) and (b) show the total hydrogen concentration
distribution (as hydrides and hydrogen in solution with zirconium) and hydride volume fraction
distribution at 5×10³ s. It is well known that the formation of hydrides in stored fuel rods can
cause embrittlement [69], and this simulation shows how the hydrides can form around stress-
concentration sites from an initial distribution of hydrogen. With hydride formation around the
notch tip, the volume expansion associated with hydride formation causes the relaxation of the
tension at the notch tip, which is shown by comparing Figure 4-7 (a) and (b). Meanwhile, creep
also contributes to this stress relaxation.
(a)

86
(b)
Figure 4-6 Hydrogen diffuses to the tip of the notch under stress gradient. As the local hydrogen
concentration exceeds the terminal solid solubility of hydrogen in zirconium, hydride
forms around the tip. (a) Distribution of total hydrogen concentration at 5×10³s (b)
Distribution of hydride volume fraction at 5×10³s.
(a)
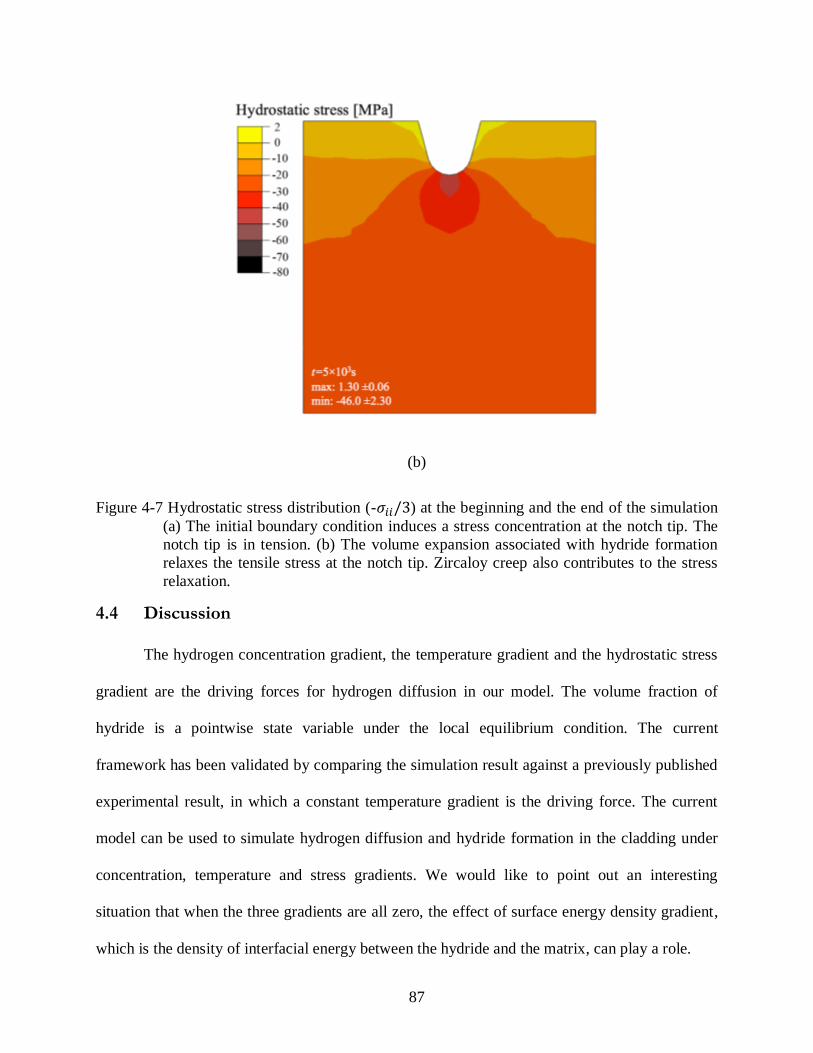
87
(b)
Figure 4-7 Hydrostatic stress distribution (-𝜎𝑖𝑖/3) at the beginning and the end of the simulation
(a) The initial boundary condition induces a stress concentration at the notch tip. The
notch tip is in tension. (b) The volume expansion associated with hydride formation
relaxes the tensile stress at the notch tip. Zircaloy creep also contributes to the stress
relaxation.
4.4 Discussion
The hydrogen concentration gradient, the temperature gradient and the hydrostatic stress
gradient are the driving forces for hydrogen diffusion in our model. The volume fraction of
hydride is a pointwise state variable under the local equilibrium condition. The current
framework has been validated by comparing the simulation result against a previously published
experimental result, in which a constant temperature gradient is the driving force. The current
model can be used to simulate hydrogen diffusion and hydride formation in the cladding under
concentration, temperature and stress gradients. We would like to point out an interesting
situation that when the three gradients are all zero, the effect of surface energy density gradient,
which is the density of interfacial energy between the hydride and the matrix, can play a role.
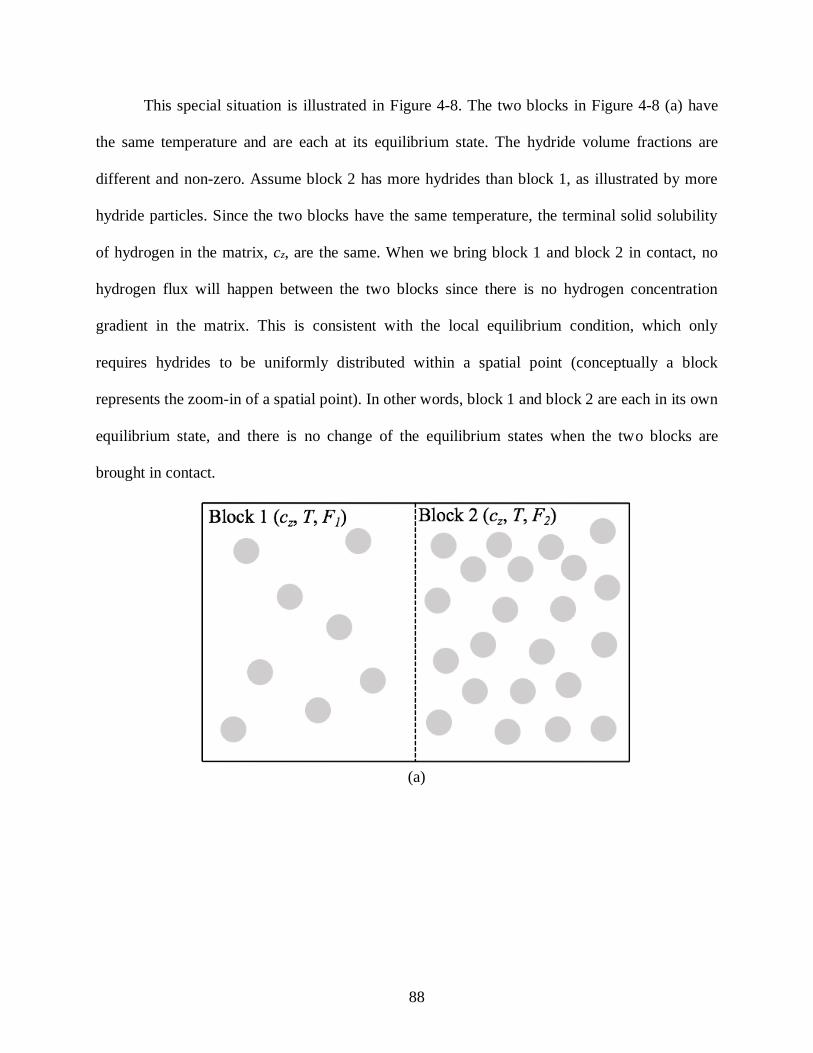
88
This special situation is illustrated in Figure 4-8. The two blocks in Figure 4-8 (a) have
the same temperature and are each at its equilibrium state. The hydride volume fractions are
different and non-zero. Assume block 2 has more hydrides than block 1, as illustrated by more
hydride particles. Since the two blocks have the same temperature, the terminal solid solubility
of hydrogen in the matrix, cz, are the same. When we bring block 1 and block 2 in contact, no
hydrogen flux will happen between the two blocks since there is no hydrogen concentration
gradient in the matrix. This is consistent with the local equilibrium condition, which only
requires hydrides to be uniformly distributed within a spatial point (conceptually a block
represents the zoom-in of a spatial point). In other words, block 1 and block 2 are each in its own
equilibrium state, and there is no change of the equilibrium states when the two blocks are
brought in contact.
(a)
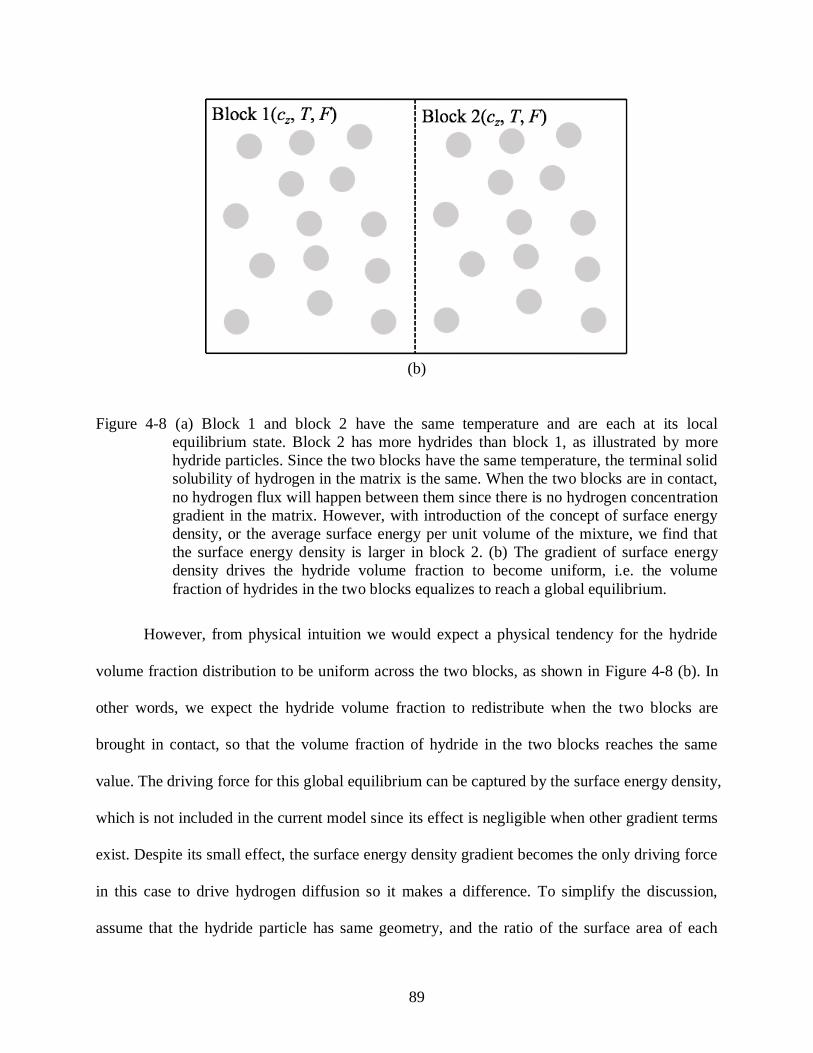
89
(b)
Figure 4-8 (a) Block 1 and block 2 have the same temperature and are each at its local
equilibrium state. Block 2 has more hydrides than block 1, as illustrated by more
hydride particles. Since the two blocks have the same temperature, the terminal solid
solubility of hydrogen in the matrix is the same. When the two blocks are in contact,
no hydrogen flux will happen between them since there is no hydrogen concentration
gradient in the matrix. However, with introduction of the concept of surface energy
density, or the average surface energy per unit volume of the mixture, we find that
the surface energy density is larger in block 2. (b) The gradient of surface energy
density drives the hydride volume fraction to become uniform, i.e. the volume
fraction of hydrides in the two blocks equalizes to reach a global equilibrium.
However, from physical intuition we would expect a physical tendency for the hydride
volume fraction distribution to be uniform across the two blocks, as shown in Figure 4-8 (b). In
other words, we expect the hydride volume fraction to redistribute when the two blocks are
brought in contact, so that the volume fraction of hydride in the two blocks reaches the same
value. The driving force for this global equilibrium can be captured by the surface energy density,
which is not included in the current model since its effect is negligible when other gradient terms
exist. Despite its small effect, the surface energy density gradient becomes the only driving force
in this case to drive hydrogen diffusion so it makes a difference. To simplify the discussion,
assume that the hydride particle has same geometry, and the ratio of the surface area of each

90
partial to its volume is as. Denote the surface energy per area between the hydride particle and
the -zirconium matrix is . The surface energy per unit volume of the mixture, which we note
as surface energy density, is given by d= asF. asF is equal to the ratio of the total surface area
of the hydride particle to the volume, so asF is the surface energy density. We can observe that
an energy difference between block 1 and block 2 arises due to d, and the hydrogen flux will
depend on d. This driving force will lead to uniform d or F. We plan to apply a phase-field
model to the state in Figure 4-8(a) in future work to obtain the dependence of hydrogen flux on
the gradient of surface energy density.
4.5 Conclusions
Engineering problems often consist of physical phenomena at different length scales. A
multi-scale model that properly links the lower length scale and the engineering length scale is
critical to generate efficient and accurate simulation results. This chapter serves this purpose by
constructing a framework to link the phase-field model and the continuum-level simulation to
solve hydride-related problems. Hydride nucleation and formation/dissolution is simulated with
the phase-field model, and the results are input into the continuum-level model to simulate the
evolution of stress and deformation associated with hydride formation. This framework offers a
useful tool to address hydride-related engineering problems.
The α-zirconium/δ-zirconium hydride phase boundaries for precipitation and dissolution are
computed using Hyrax, a physics-based mesoscale modeling code based on the open-source finite
element framework MOOSE (Multiphysics Object Oriented Simulation Framework). Hyrax
incorporates a phase field model, a nucleation algorithm, and heat conduction to examine
hydride precipitation and growth phenomena. The phase-field simulation indicates that the

91
terminal solid solubility of hydrogen in zirconium slightly depends on the stress state. The Zr-H
phase diagram is constructed with the data of phase-field simulation. Hydride formation is a
diffusion-controlled process, so the spacing between the nucleation sites controls the nucleation
and growth rate. The domain size of the current model is 500 nm 500 nm, which is smaller than
the grain size. Therefore, the time to reach the equilibrium state, which is calculated by the current
model, is smaller than the experimental result. The domain size of further nucleation model should
be comparable to the grain size. However, the experimental results also indicate that the time to
reach the equilibrium state is short enough to treat the Zr-H system to be always in the equilibrium
phase state. This equilibrium phase condition is used in the continuum-level simulation to study
hydrogen diffusion and hydride formation. The hydride formation depends on the local hydrogen
concentration, temperature, and stress state, so hydrogen diffusion, thermal analysis and stress
analysis are conducted in the continuum-level simulation to calculate hydride formation at
different locations. The multi-scale model has been validated by comparison with the
experimental data, and has been used to investigate hydride formation around a stressed notch.
The results demonstrate that the multi-scale model is a useful tool to investigate delayed hydride
cracking in future studies.
Appendix 4.A: Expansion associated with hydride formation
It is necessary to incorporate the expansion associated with hydride formation to calculate
the evolution of stress and structural deformation in the continuum-level simulation. The local
expansion depends on volume fraction of the hydride and the texture of the cladding. The texture
of zirconium is referenced to the global Cartesian coordinate system: x, y and z.
92
The texture is specified by three values, fx, fy and fz. fx is the effective volume fraction of
grains whose <c>-axis is parallel to the x-direction, fy is the effective volume fraction of grains
whose <c>-axis is parallel to the y-direction, and fz is the effective volume fraction of grains
whose <c>-axis is parallel to the z-direction. In the continuum-level simulation we assume that
the poly-crystal consists of three kinds of grains, X, Y and Z, whose <c>-axes are parallel to one
of the three axes of the Cartesian coordinate system, as shown in Figure 4-9. The volumes of the
three grains are Vx, Vy and Vz. The relations between the volume and the volume fraction are
given by
xx
Vf
V ,
y
y
Vf
V , z
z
Vf
V (4.A.1)
Now consider the misfit strains associated with δ-hydride (ZrH1.66) formation. The
temperature-dependent misfit strains in a single grain are [Singh, et al., 2007]
[𝑚aa 0 00 𝑚aa 00 0 𝑚cc
],
where 𝑚aa = 0.03888 + 2.135×10⁻⁵𝑇and 𝑚cc = 0.06646 + 1.935×10⁻⁵𝑇. maa is the misfit
strain in the basal plane, and mcc is the misfit strain normal to the basal plane.
Within a three-dimensional analysis, the biaxial stress in the basal planes will be different
for grains with different orientations, so the hydride volume fractions in the three kinds of grains
could be different. The hydride volume fractions in each of the three grains are noted as FX, FY,
and FZ. The total hydride volume fraction, F, in an element is
𝐹 = 𝑓𝑥𝐹𝑋 + 𝑓𝑦𝐹𝑌 + 𝑓𝑧𝐹𝑍. (4. A. 2)
The crystallographic strains associated with hydride formation in the grain X, Y and Z are

93
[
𝜀aa𝑋 0 0
0 𝜀aa𝑋 0
0 0 𝜀cc𝑋
], [
𝜀aa𝑌 0 0
0 𝜀aa𝑌 0
0 0 𝜀cc𝑌
], [
𝜀aa𝑍 0 0
0 𝜀aa𝑍 0
0 0 𝜀cc𝑍
],
where 𝜀aa𝑋 is the strain in the basal plane of the grain X and 𝜀cc
𝑋is the strain along the <c>-axis of
the grain X. 𝜀aa𝑌 is the strain in the basal plane of the grain Y and 𝜀cc
𝑌 is the strain along the <c>-axis
of the grain Y. 𝜀aa𝑍 is the strain in the basal plane of the grain Z and 𝜀cc
𝑍 is the strain along the <c>-
axis of the grain Z. The strains are calculated as
𝜀aa𝑋 = 𝐹𝑋𝑚aa, (4. A. 3a)
𝜀cc𝑋 = 𝐹𝑋𝑚cc, (4. A. 3b)
𝜀aa𝑌 = 𝐹𝑌𝑚aa, (4. A. 3c)
𝜀cc𝑌 = 𝐹𝑌𝑚cc, (4. A. 3d)
𝜀aa𝑍 = 𝐹𝑍𝑚aa, (4. A. 3e)
𝜀cc𝑍 = 𝐹𝑍𝑚cc. (4. A. 3f)
In the continuum-level simulation, the macroscopic strains of an element associated with
hydride formation is
[
𝜀𝑥 0 00 𝜀𝑦 0
0 0 𝜀𝑧
],
where εx, εy and εz are the strains of the expansion along the x, y, and z directions. εx, εy and εz are
calculated as
𝜀𝑥 = 𝜀cc𝑋𝑓𝑥 + 𝜀aa
𝑌 𝑓𝑦 + 𝜀aa𝑍 𝑓𝑧, (A. 4a)
𝜀𝑦 = 𝜀aa𝑋𝑓𝑥 + 𝜀cc
𝑌𝑓𝑦 + 𝜀aa𝑍 𝑓𝑧, (A. 4b)
𝜀𝑧 = 𝜀aa𝑋𝑓𝑥 + 𝜀aa
𝑌 𝑓𝑦 + 𝜀cc𝑍𝑓𝑧. (A. 4c)

94
fx, fy and fz are the material texture, which are also the volume fraction of grain X, Y and Z in the
poly-crystal. εx, εy and εz are the input to the ABAQUS subroutine, UEXPAN, to calculate the
misfit stress associated with hydride formation.
Figure 4-9 The poly-crystal is assumed to consist of three kinds of grains, X, Y, and Z, whose
orientations are along the axes.
95
Chapter 5 Effect of hydride growth on contact force and gap
formation between fuel rod and spacer grid
5.1 Introduction
Grid-to-rod-fretting (GTRF) wear is an important reason for the fuel leaks in pressurized-
water reactors (PWRs), and is a significant concern for design and safety [104] [44] [3]. The
relaxation of the grid-to-rod support and the flow-induced vibration are the main causes of GTRF.
In a fuel assembly, the fuel rods are supported by the springs and dimples of the spacer grid with
an initial preload. However, the preload will relax as a result of structural deformation during the
operation of PWRs. Eventually, the grid can no longer maintain continuous contact with the fuel
rod, and a gap opens up between them. The gap can induce larger amplitudes of vibration, and
the impact resulting from dynamic vibrations can accelerate the wear process [42] [38] [58].
Predicting the evolution of the contact force between the grid and cladding and the gap size is
important.
In addition to thermal expansion, creep and swelling, this work considers the effect of hydride
formation on the cladding deformation. When the reactor is in operation, the reaction between
water and zirconium on the cladding surface will generate hydrogen. Hydrogen will diffuse into
the cladding and react with zirconium to generate hydride. Hydride can degrade the cladding by
96
embrittlement [7], and can cause structural deformation by the volume expansion associated with
hydride formation [8]. Therefore, a multiscale model is developed in the previous work to study
the effect of hydride formation on the zircaloy structure. By bridging the phase-field simulation
at the mesoscale and the stress, thermal, diffusion simulations at the continuum level, the
multiscale model can successfully simulate hydrogen diffusion, hydride formation and its effect
on the structural behavior. The other material properties are simulated with existing models. The
thermal expansion of zircaloy and UO2 ,and the swelling of UO2 are simulated with the material
model available in MATPRO [51]. The creep behavior of zircaloy is simulated with the multi-
mechanism based framework developed in the previous work [4], and the creep behavior of UO2
is simulated by the model developed by Frost and Ashby [9]. By integrating the established
material models together, the effects of different material properties on the evolution of contact
force and gap size during the 3-cycle operation of PWRs under the quasi-static state is studied in
this chapter. The simulation result of the gap size can be used in the GTRF problem to calculate
wear damage and analyze vibration behaviors in the future. Additionally, since the hydride rim is
important to the cladding failure during the reactivity-initiated accident (RIA) [105], this chapter
also serves the purpose of studying the evolution of hydride volume fraction distribution and
hydride rim thickness during the PWR operation.
5.2 Material models
5.2.1 The multiscale model for hydride formation
The hydrogen produced on the cladding surface between water and zirconium diffuses
into the cladding and reacts with zirconium to produce hydride. The hydride formation is
associated with a volume expansion of 17% [8], which can cause structural deformation. Hydride
formation is usually simulated with the phase-field model at the mesoscale [73], but the effect of
97
hydride formation on structural behaviors is simulated at the continuum level. Therefore, a
multiscale model is developed to bridge the simulations at different length scales to calculate the
hydride distribution and to study the effect of hydride deformation on structural behaviors. δ-
hydride is usually observed in the PWRs. The α-zirconium/δ- hydride phase boundaries for
precipitation and dissolution were computed by A. Jokisaari using Hyrax
(http://github.com/UMThorntonGroup/hyra). Hyrax is a physics-based mesoscale modeling code
using the open-source finite element framework MOOSE (Multiphysics Object Oriented
Simulation Framework) [88]. Hyrax incorporates a phase-field model, a nucleation algorithm,
and heat conduction to examine hydride precipitation and growth phenomena.
The details of the governing equation for hydrogen diffusion in the continuum-level
simulation, and the hydride volume fraction calculation for hydride formation and dissolution are
discussed in Section 4.2.4 and 4.2.5 in Chapter 4.
5.2.2 Thermal expansion, creep and swelling
The other material models include thermal expansion, creep and swelling. These material
properties are implemented into ABAQUS subroutines [48]. The thermal expansion of both
zircaloy and UO2 were implemented in ABAQUS UEXPAN subroutine. Creep and swelling
phenomena were implemented in ABAQUS CREEP subroutine.
Zircaloy
Elastic property and thermal expansion of zircaloy were taken from MATPRO [51]. The
expression of the Young’s modulus is
E=1.04×10¹¹-5.4×10⁷T, [5.1]
98
where E is the Young’s modulus [Pa] and T is temperature [K]. For a single crystal, the thermal
strains are
∆ε11=4.95×10⁻⁶∆T, [5.2a]
∆ε33=1.26×10⁻⁵∆T, [5.2a]
where ∆ε11 is the change of the isotropic thermal strain in the basal plane of the single crystal and
∆ε33 is the change of the axial strain along the axial direction of the single crystal. For the
isotropic material, the thermal expansion coefficient is 7.42×10⁻⁶.
The multiple-mechanism based creep models were incorporated into the finite element
analysis to simulate zircaloy creep [4]. The creep mechanisms are dislocation-glide controlled
plasticity at low temperature, power-law creep and diffusional creep. The parameters for the
zircaloy creep mechanisms were taken from the models developed by Wang et al. [4]. The
equations of creep mechanisms are in Appendix 5. A.
Uranium dioxide
Elastic property, thermal expansion and swelling of UO2 were taken from MATPRO [51].
The expression of the Young’s modulus is
E=2.01×10¹¹-2.20×10⁷T, [5.3]
where E is the Young’s modulus [Pa] and T is temperature [K]. The expression of thermal
expansion strain of UO2, εth is
εth=1.00×10⁻⁵T-3.00×10⁻³+4.00×10⁻²e-U/kT , [5.4]
99
where T is temperature [K], U is the energy of a defect formation [J] with a value of 7.00×10⁻²⁰
and k is Boltzmann’s constant. The thermal expansion strain at 300K is 0. The UO2 swelling
consists of solid fission product swelling and fission gas swelling. The expression for the UO2
swelling strain associated with solid fission product is [51]
∆εsolid=7.43×10⁻¹³ρ∆B, [5.5]
The expression for the UO2 swelling strain associated with fission gas is [51]
∆εgas=2.62×10-39ρ∆B(2800-T)11.73e[-0.0162(2800-T)] e[-2.4×10⁻¹⁰Bρ], [5.6]
where ρ is the initial density of 1.045×10⁴ kg/m3 (which is 95% of the theoretical density). B is
total burnup at the end of a given time increment, and ∆B is the change of the burnup for this
time increment. The units of B and ∆B are [MWs/kg(U)]. The total burnup over the three
operational cycles is assumed to be 3.89×10⁶ MWs/kg(U), which is 45 MWd/kg(U), and the
burnup is assumed to increase linearly with time [51].
The overall change of the UO2 swelling strain is the sum of ∆εsolid and ∆εgas. The UO2
creep mechanisms are dislocation-glide controlled plasticity at low temperature, power-law creep
and diffusional creep. The parameters for the UO2 creep mechanisms were taken from the
deformation-mechanism map for UO2 given by Frost and Ashby [9]. The equations of creep
mechanisms are in Appendix 5. A.
5.3 The evolution of contact force and gap size in the GTRF problem
The insufficient support between the spacer grid and the fuel rod is one of the root causes
of the GTRF problem. Additionally, after the support relaxing to zero, the gap size between the
grid and fuel rod is an important parameter to analyze the vibration behavior of the fuel rod and
100
to calculate the wear damage on the cladding surface [58]. Therefore, the evolution of the contact
force and gap size in the 3-cycle operation of PWRs under the quasi-static state is analyzed in
this chapter.
5.3.1 Boundary conditions
A simplified two-dimensional model of a single cell was considered, with symmetry
planes, along which sliding can occur (Figure 5-1). The complete two-dimensional model is
assumed to be symmetric about the horizontal and the axis which is 45° off the horizontal.
Therefore, as shown in Figure 5-1, only one eighth of a complete model is simulated. An
assumed misfit between the cladding and grid, associated with assembly, was established at a
reference temperature of 300 K. This was done by imposing a displacement on the constrained
surfaces of the grid (Figure 5-1). In this analysis, zero displacement was placed on the
constrained surfaces of the grid, so the grid and cladding was just in contact at a reference
temperature of 300 K. The simulation lasts 1.5×10⁸ s (about 4.75 years), which consists of 3
cycles. Each cycle lasts 5×10⁷ s. The thermal boundary conditions for the problem were
established assuming that the linear heat rate in the fuel was constant at 20 W/mm for cycle 1,
17.5 W/mm for cycle 2, and 15 W/mm for cycle 3 [50], and that the outer surface of the cladding
was constant at 600 K, corresponding to the temperature of the coolant. The temperature-
dependent thermal conductivities and the specific heat for the zircaloy and fuel were taken from
MATPRO models [51].
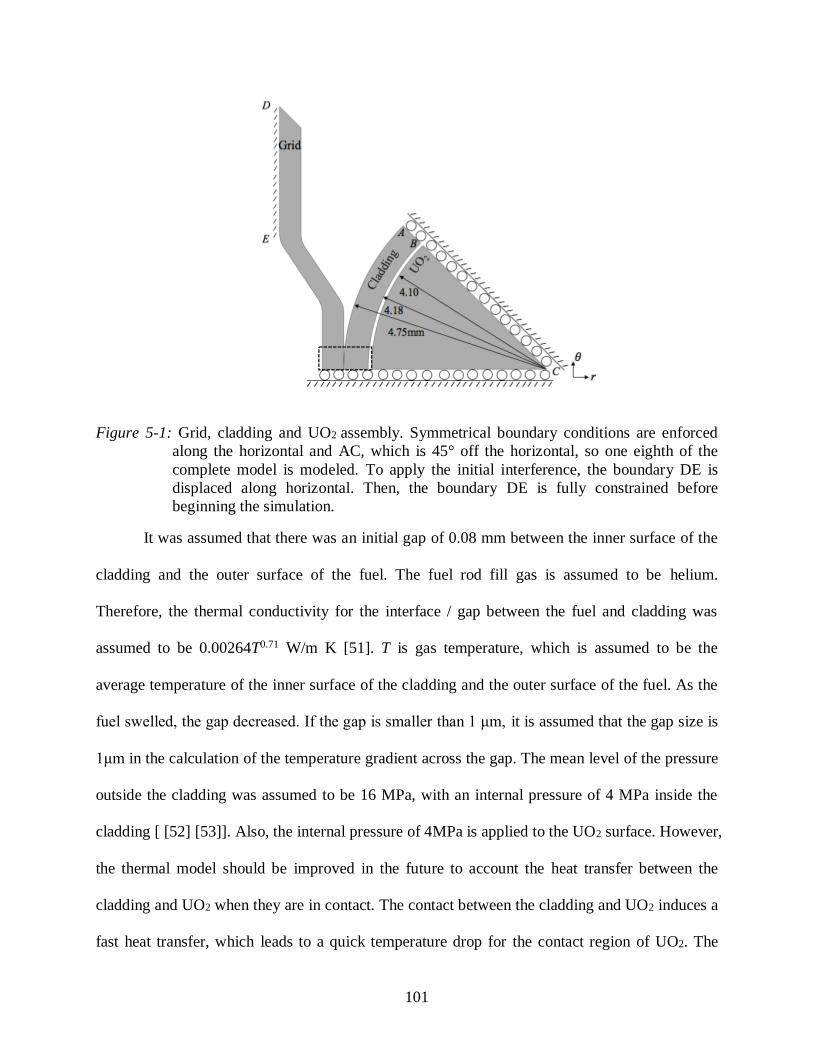
101
Figure 5-1: Grid, cladding and UO2 assembly. Symmetrical boundary conditions are enforced
along the horizontal and AC, which is 45° off the horizontal, so one eighth of the
complete model is modeled. To apply the initial interference, the boundary DE is
displaced along horizontal. Then, the boundary DE is fully constrained before
beginning the simulation.
It was assumed that there was an initial gap of 0.08 mm between the inner surface of the
cladding and the outer surface of the fuel. The fuel rod fill gas is assumed to be helium.
Therefore, the thermal conductivity for the interface / gap between the fuel and cladding was
assumed to be 0.00264T0.71 W/m K [51]. T is gas temperature, which is assumed to be the
average temperature of the inner surface of the cladding and the outer surface of the fuel. As the
fuel swelled, the gap decreased. If the gap is smaller than 1 μm, it is assumed that the gap size is
1μm in the calculation of the temperature gradient across the gap. The mean level of the pressure
outside the cladding was assumed to be 16 MPa, with an internal pressure of 4 MPa inside the
cladding [ [52] [53]]. Also, the internal pressure of 4MPa is applied to the UO2 surface. However,
the thermal model should be improved in the future to account the heat transfer between the
cladding and UO2 when they are in contact. The contact between the cladding and UO2 induces a
fast heat transfer, which leads to a quick temperature drop for the contact region of UO2. The

102
temperature drop will cause the separation of the cladding and UO2 instantaneously. The
cladding and UO2 will retouch by UO2 swelling and cladding creep-down. This oscillating
behavior of the potential contact region between cladding and UO2 should be simulated with an
improved thermal model.
5.3.2 Evolution of hydride distribution, contact force and gap size
Water and zirconium reacts on the cladding surface and produces hydrogen. Hydrogen
diffuses into cladding and react with zirconium to produce hydride. The hydrogen flux, H on the
cladding surface is assumed to be
H=H0 (1-F), [5.7]
where F is the hydride volume fraction on the cladding surface and H0 is the hydrogen uptake
rate for fresh zircaloy. H0 is estimated to be 1.7×10⁻⁸ mol/m2 s [106]. The effect of oxide is not
considered in this chapter.
Figure 5-2 shows the evolution of the hydride volume fraction distribution during the
three cycles and the evolution of hydride rim thickness. The hydride has a uniform distribution
along the circumferential direction, and the hydride distribution along AB in Figure 5-1 is plotted
in Figure 5-2. The hydride starts to form at about 3.7×10⁷s. The temperature distribution is linear
along the radial direction of the cladding with the cold surface at the outer surface, and the
hydrogen pickup occurs on the outer surface. Therefore, as indicated by Figure 5-2 (a), hydride
rim forms around the outer surface of the cladding. The thickness of hydride rim reaches the
plateau at about 7.0×10⁷s. After 7.0×10⁷s, only the local hydride volume fraction has an obvious
increase but not the hydride rim thickness. It indicates that the hydrogen flux at the interface
between the regions with and without hydride is nearly zero after 7.0×10⁷s. Figure 5-2 (b)

103
indicates that the hydride rim thickness at the end of the three cycles is about 0.12 mm. The
formation of the hydride rim on the cladding surface is observed in both irradiated cladding [107]
and non-irradiated cladding [108]. However, more experimental data are needed to demonstrate
the dependence of the hydride rim thickness on the time. Hydride is known for its effect on
material embrittlement, and hydride rim on the cladding surface can induce cladding failure
under reactivity-initiated accident (RIA) [105]. The current model can be used to estimate the
hydride rim thickness at different environments.
(a)
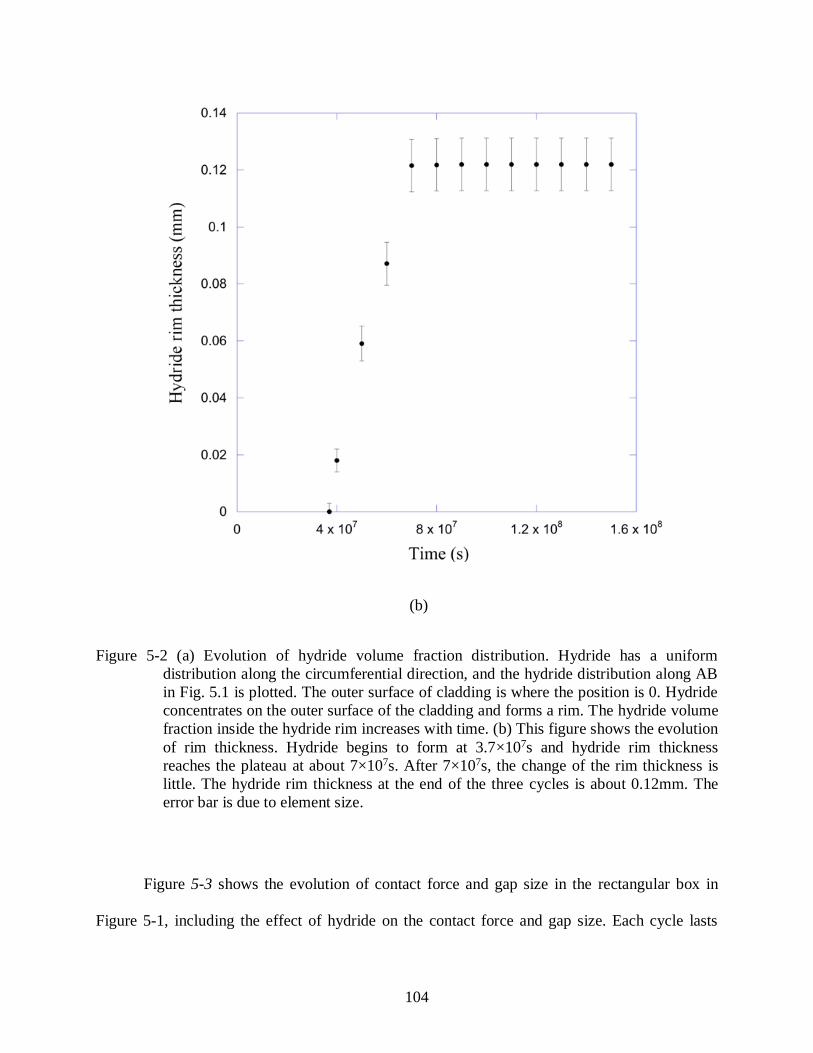
104
(b)
Figure 5-2 (a) Evolution of hydride volume fraction distribution. Hydride has a uniform
distribution along the circumferential direction, and the hydride distribution along AB
in Fig. 5.1 is plotted. The outer surface of cladding is where the position is 0. Hydride
concentrates on the outer surface of the cladding and forms a rim. The hydride volume
fraction inside the hydride rim increases with time. (b) This figure shows the evolution
of rim thickness. Hydride begins to form at 3.7×10⁷s and hydride rim thickness
reaches the plateau at about 7×10⁷s. After 7×10⁷s, the change of the rim thickness is
little. The hydride rim thickness at the end of the three cycles is about 0.12mm. The
error bar is due to element size.
Figure 5-3 shows the evolution of contact force and gap size in the rectangular box in
Figure 5-1, including the effect of hydride on the contact force and gap size. Each cycle lasts
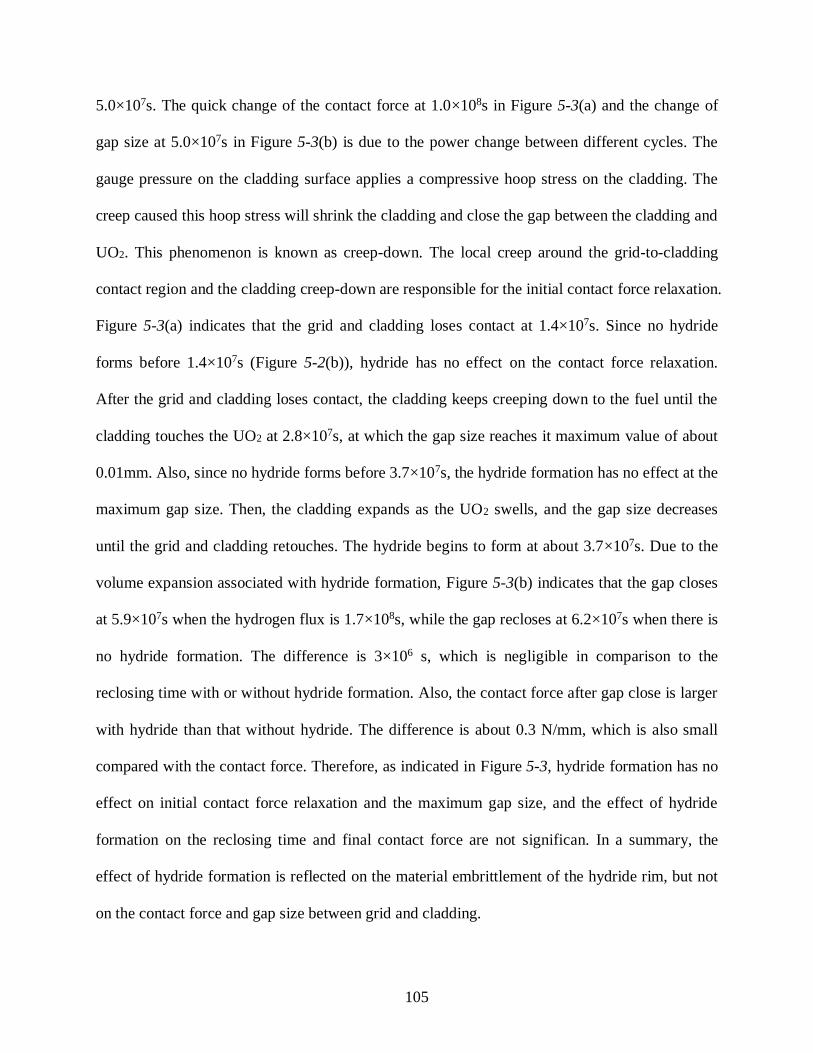
105
5.0×10⁷s. The quick change of the contact force at 1.0×10⁸s in Figure 5-3(a) and the change of
gap size at 5.0×10⁷s in Figure 5-3(b) is due to the power change between different cycles. The
gauge pressure on the cladding surface applies a compressive hoop stress on the cladding. The
creep caused this hoop stress will shrink the cladding and close the gap between the cladding and
UO2. This phenomenon is known as creep-down. The local creep around the grid-to-cladding
contact region and the cladding creep-down are responsible for the initial contact force relaxation.
Figure 5-3(a) indicates that the grid and cladding loses contact at 1.4×10⁷s. Since no hydride
forms before 1.4×10⁷s (Figure 5-2(b)), hydride has no effect on the contact force relaxation.
After the grid and cladding loses contact, the cladding keeps creeping down to the fuel until the
cladding touches the UO2 at 2.8×10⁷s, at which the gap size reaches it maximum value of about
0.01mm. Also, since no hydride forms before 3.7×10⁷s, the hydride formation has no effect at the
maximum gap size. Then, the cladding expands as the UO2 swells, and the gap size decreases
until the grid and cladding retouches. The hydride begins to form at about 3.7×10⁷s. Due to the
volume expansion associated with hydride formation, Figure 5-3(b) indicates that the gap closes
at 5.9×10⁷s when the hydrogen flux is 1.7×10⁸s, while the gap recloses at 6.2×10⁷s when there is
no hydride formation. The difference is 3×10⁶ s, which is negligible in comparison to the
reclosing time with or without hydride formation. Also, the contact force after gap close is larger
with hydride than that without hydride. The difference is about 0.3 N/mm, which is also small
compared with the contact force. Therefore, as indicated in Figure 5-3, hydride formation has no
effect on initial contact force relaxation and the maximum gap size, and the effect of hydride
formation on the reclosing time and final contact force are not significan. In a summary, the
effect of hydride formation is reflected on the material embrittlement of the hydride rim, but not
on the contact force and gap size between grid and cladding.
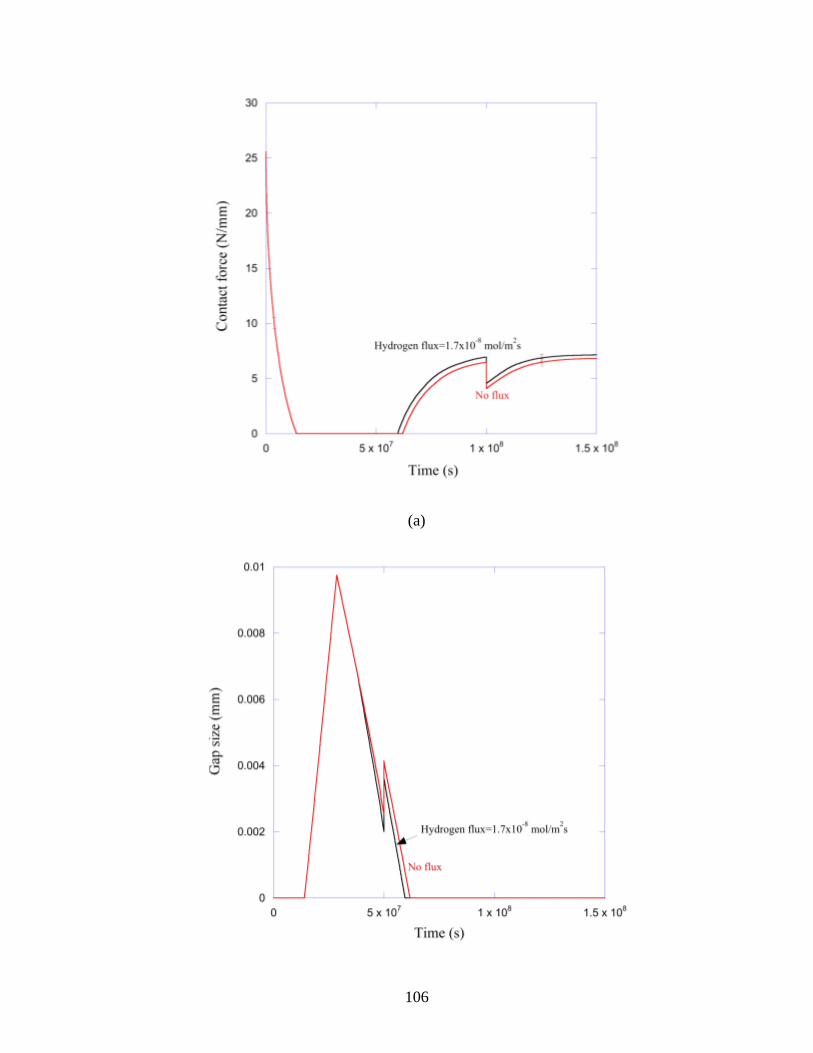
106
(a)
107
(b)
Figure 5-3: Effects of hydride on the contact force and gap size between the grid and cladding.
Since hydride begins to form at 3.7×10⁷s when hydrogen flux is 1.7×10⁻⁸ mol/m2s.
Before 3.7×10⁷s, there is no difference for contact force and gap size with or without
hydrogen flux. After 3.7×10⁷s, the volume expansion associated with hydride
accelerates the gap closing, and increases contact force after gap closing. However,
the effect is not significant. (a) The evolution of contact force between the grid and
cladding. The initial contact force relaxes to zero at about 1.4 ×10⁷s, which is due to
the local creep relaxation and the creep-down of cladding. (b) The evolution of gap
size between grid and cladding. When the cladding creep-down to the UO2
completely, the gap reaches the maximum size of about 0.01 mm at about 2.9 ×10⁷s.
Then, the gap close is caused by UO2 swelling. The gap recloses at 5.9×10⁷s when
the hydrogen flux is 1.7×10⁸s, while the gap recloses at 6.2×10⁷s when there is no
hydrogen flux.
5.4 Conclusion
By integrating the hydride formation, creep, thermal expansion and swelling in the
current model, the evolution of hydride volume fraction distribution in the cladding, contact
force and gap size between the cladding the grid are evaluated in this chapter Hydride begins to
form a rim on the cladding outer surface at 3.7×10⁷ s, and the rim thickness reaches the plateau
of 0.12mm at 7.0×10⁷s. After 7.0×10⁷s, the hydride volume fraction inside the 0.12mm rim will
increases with time, but the rim thickness almost stay the same. Without considering the fluid-
induced vibration, the initial contact force relaxation is caused by the local creep in the contact
region and the creep-down of the cladding onto the fuel. After the contact force relaxing to zero,
a gap forms between the grid and fuel rod. The gap size keeps increasing as the cladding creeps
down to the fuel completely. The gap size reaches the maximum when the cladding touches the
fuel rod. Then, gap size decreases as a result of the UO2 swelling until the cladding retouches the
grid. The simulation result indicates that the contact force relaxes to zero before Cycle 1 ends at
1.4×10⁷s and the gap size reaches its maximum value of about 0.1mm at 2.8×10⁷s. Hydride
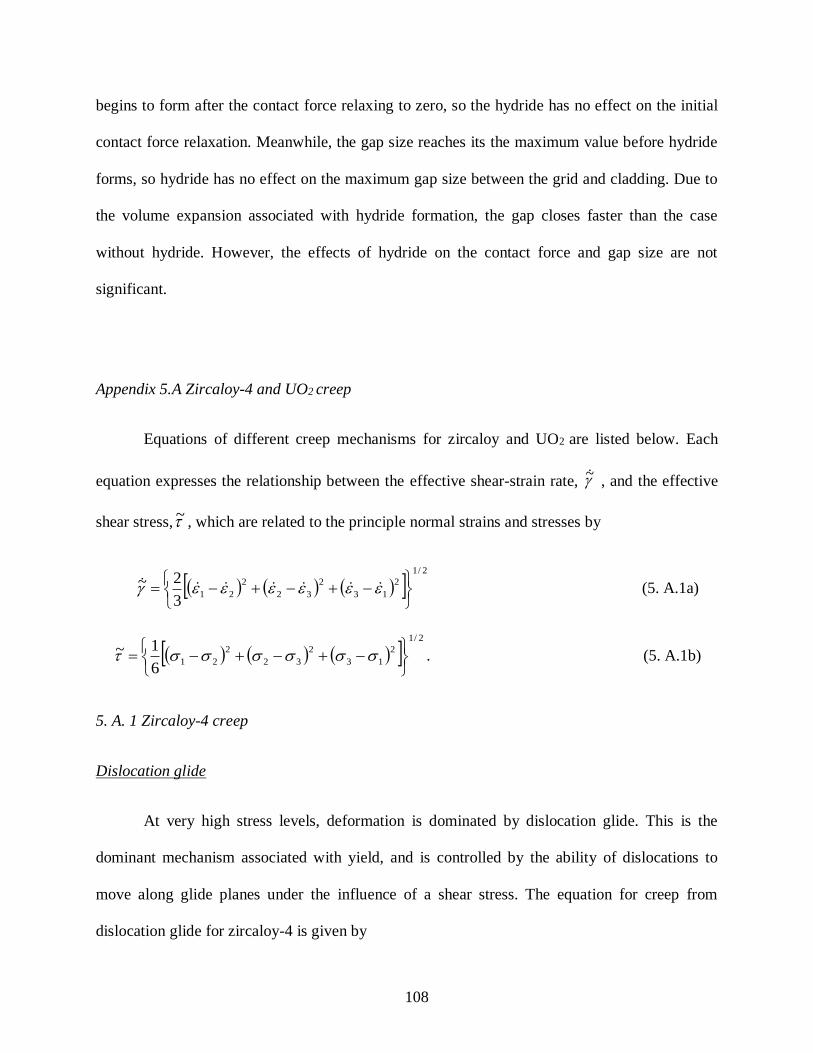
108
begins to form after the contact force relaxing to zero, so the hydride has no effect on the initial
contact force relaxation. Meanwhile, the gap size reaches its the maximum value before hydride
forms, so hydride has no effect on the maximum gap size between the grid and cladding. Due to
the volume expansion associated with hydride formation, the gap closes faster than the case
without hydride. However, the effects of hydride on the contact force and gap size are not
significant.
Appendix 5.A Zircaloy-4 and UO2 creep
Equations of different creep mechanisms for zircaloy and UO2 are listed below. Each
equation expresses the relationship between the effective shear-strain rate, ~ , and the effective
shear stress,~ , which are related to the principle normal strains and stresses by
2/1
2
13
2
32
2
213
2~
(5. A.1a)
2/1
2
13
2
32
2
216
1~
. (5. A.1b)
5. A. 1 Zircaloy-4 creep
Dislocation glide
At very high stress levels, deformation is dominated by dislocation glide. This is the
dominant mechanism associated with yield, and is controlled by the ability of dislocations to
move along glide planes under the influence of a shear stress. The equation for creep from
dislocation glide for zircaloy-4 is given by
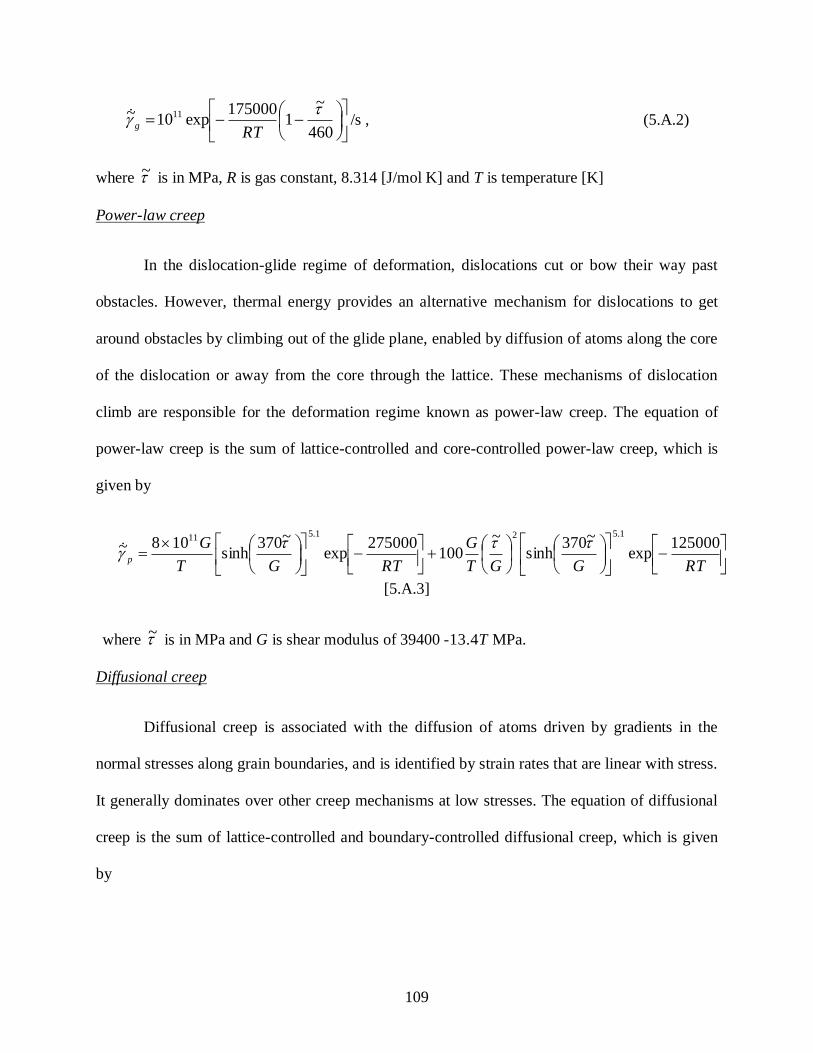
109
460
~1
175000exp10~ 11
RT
g /s , (5.A.2)
where ~ is in MPa, R is gas constant, 8.314 [J/mol K] and T is temperature [K]
Power-law creep
In the dislocation-glide regime of deformation, dislocations cut or bow their way past
obstacles. However, thermal energy provides an alternative mechanism for dislocations to get
around obstacles by climbing out of the glide plane, enabled by diffusion of atoms along the core
of the dislocation or away from the core through the lattice. These mechanisms of dislocation
climb are responsible for the deformation regime known as power-law creep. The equation of
power-law creep is the sum of lattice-controlled and core-controlled power-law creep, which is
given by
RTGGT
G
RTGT
Gp
125000exp
~370sinh
~100
275000exp
~370sinh
108~1.521.511
[5.A.3]
where ~ is in MPa and G is shear modulus of 39400 -13.4T MPa.
Diffusional creep
Diffusional creep is associated with the diffusion of atoms driven by gradients in the
normal stresses along grain boundaries, and is identified by strain rates that are linear with stress.
It generally dominates over other creep mechanisms at low stresses. The equation of diffusional
creep is the sum of lattice-controlled and boundary-controlled diffusional creep, which is given
by
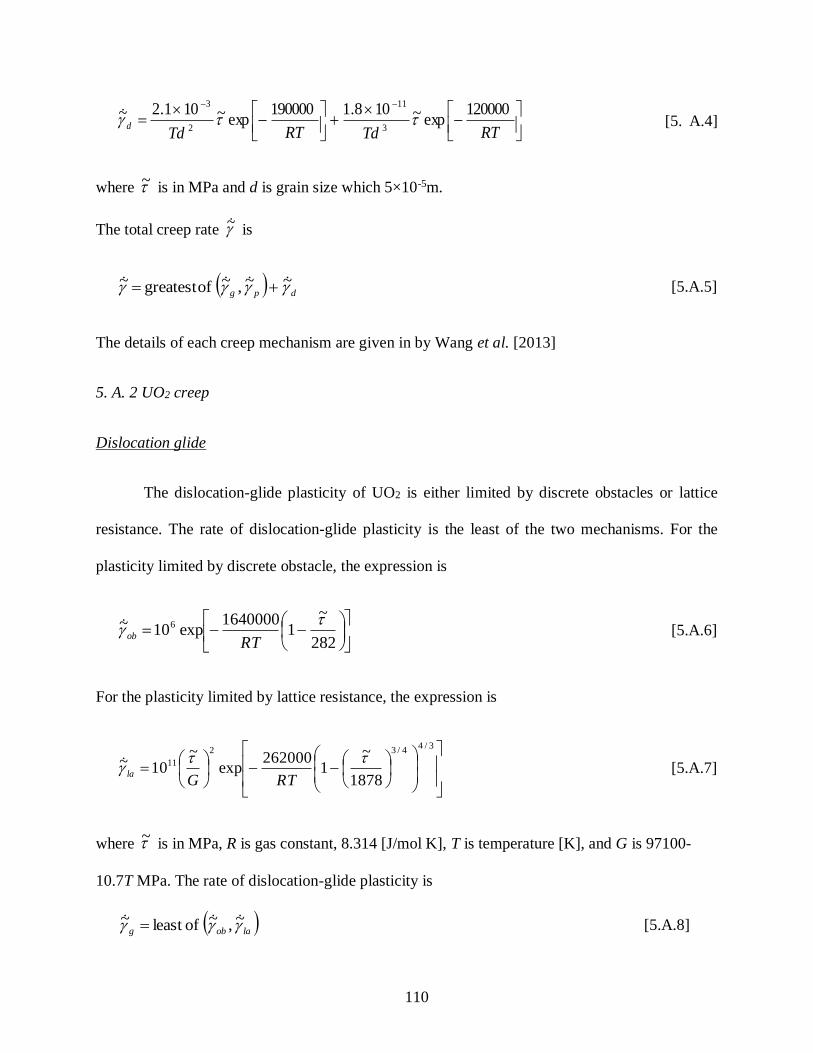
110
RTTdRTTdd
120000exp~108.1190000
exp~101.2~3
11
2
3
[5. A.4]
where ~ is in MPa and d is grain size which 5×10⁻⁵m.
The total creep rate ~ is
dpg ~~,~ ofgreatest ~ [5.A.5]
The details of each creep mechanism are given in by Wang et al. [2013]
5. A. 2 UO2 creep
Dislocation glide
The dislocation-glide plasticity of UO2 is either limited by discrete obstacles or lattice
resistance. The rate of dislocation-glide plasticity is the least of the two mechanisms. For the
plasticity limited by discrete obstacle, the expression is
282
~1
1640000exp10~ 6
RT
ob [5.A.6]
For the plasticity limited by lattice resistance, the expression is
3/44/32
11
1878
~1
262000exp
~10~
RTG
la [5.A.7]
where ~ is in MPa, R is gas constant, 8.314 [J/mol K], T is temperature [K], and G is 97100-
10.7T MPa. The rate of dislocation-glide plasticity is
laobg ~,~ ofleast ~ [5.A.8]
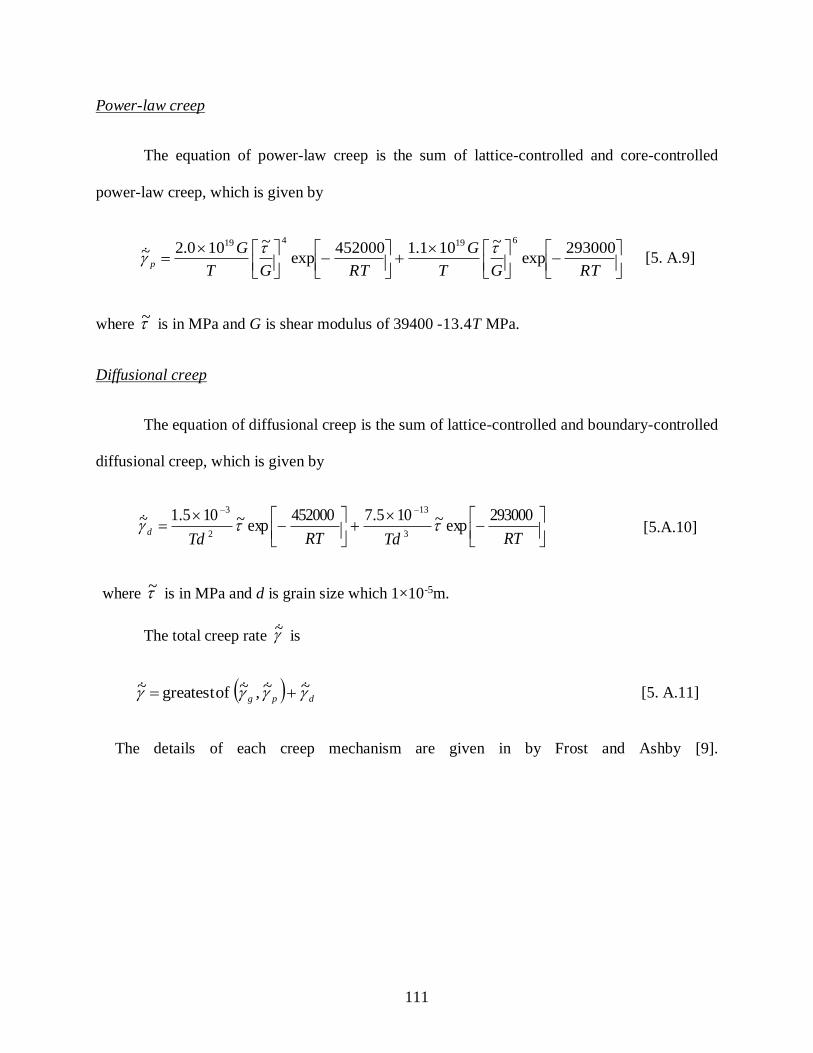
111
Power-law creep
The equation of power-law creep is the sum of lattice-controlled and core-controlled
power-law creep, which is given by
RTGT
G
RTGT
Gp
293000exp
~101.1452000exp
~100.2~619419
[5. A.9]
where ~ is in MPa and G is shear modulus of 39400 -13.4T MPa.
Diffusional creep
The equation of diffusional creep is the sum of lattice-controlled and boundary-controlled
diffusional creep, which is given by
RTTdRTTdd
293000exp~105.7452000
exp~105.1~3
13
2
3
[5.A.10]
where ~ is in MPa and d is grain size which 1×10⁻⁵m.
The total creep rate ~ is
dpg ~~,~ ofgreatest ~ [5. A.11]
The details of each creep mechanism are given in by Frost and Ashby [9].

112
Chapter 6 Conclusions
Grid-to-rod fretting (GTRF) problem is a challenging problem for the nuclear reactor
design. Insufficient grid-to-rod support is a root cause to the grid-to-rod fretting (GTRF) problem.
Creep, wear and corrosion contribute to this insufficient grid-to-rod support. Therefore, the three
material behaviors are either studied individually or coupled together to research their effects on
the contact force relaxation and gap formation between the grid and cladding.
For the structure used in the pressurized-water reactor, creep contributes to the contact
force relaxation by local creep at the contacts and creep-down of the cladding to the fuel. The
mechanisms of creep for zircaloy-4 have been studied for many years. By re-analyzing the
available experimental data, a deformation mechanism map has been developed for unirradiated
zircaloy-4. This has then been used in illustrative examples of the multi-mechanism creep model.
The consistency of all the experimental data for zircaloy-4 over four decades indicates that
effects of microstructure and texture are reasonably small in the absence of radiation. However,
there are clearly missing areas of experimental data that would be required for a more
comprehensive model. In particular, the data for the diffusional creep that operates at low
stresses are too limited to build an accurate model from. Meanwhile, additional models need to
be developed that would link the effects of radiation to creep, including radiation growth,
radiation creep, and changes in microstructure.

113
In addition to creep, wear is also responsible for the relaxation of the contact force
between the grid and cladding, and a model has been developed to couple the two mechanisms.
The two processes occur at different time scales. Wear is associated with fluid-induced
vibrations at relatively high frequencies, so the time increment of any wear simulation needs to
be fairly small. However, creep occurs over relatively long time scales, and a time increment
based on the vibration frequency is not efficient for creep simulation. Therefore, an optimization
method had to be developed to couple the two mechanisms in a fashion that combines an
acceptable level of both efficiency and accuracy. This was done by developing an effective cycle,
with a varying period that depended on keeping the changes in normal contact pressure constant
within some acceptable limit. By coupling the two mechanisms, simulations were conducted
assuming different friction coefficients, excitation pressures, wear coefficients and initial misfits
to explore how the different parameters affect both the wear profile and the time at which the
grid and cladding lose contact. The simulations indicate that two stages exist during the
relaxation of the contact force: partial slip and full slip. When partial slip occurs, the dominant
relaxation mechanism is creep. During this regime, the wear scar propagates across the contact,
and there is a transition to full-slip. Once full-slip occurs across the entire interface, and the
contact forces are relatively low, the creation of a wear scar becomes the dominant relaxation
mechanism. In this regime, reducing the wear coefficient and the amplitude of excitation force
delays the formation of a gap between the grid and cladding. This model is also applied to study
the effects of wear coefficient, frictional coefficient, amplitude of the excitation pressure, initial
interference and gap on the contact force relaxation and wear profile evolution.
The hydride formation in the zircaloy cladding is associated with local volume expansion
and material degradation, which can affect the contact stress or gap size between the grid and
114
cladding. This engineering problem consists of physical phenomena at different length scales. A
multi-scale model that properly links the lower length scale and the engineering length scale is
critical to generate efficient and accurate simulation results. Hydride nucleation and
formation/dissolution are simulated with the phase-field model. The structure deformation and
stress evolution associated with hydride formation is simulated with finite element analysis at the
continuum level. Therefore, a multiscale mode is constructed to bridge the simulations at
different length scale. The multi-scale model has been validated by comparison with the
experimental data, and has been used to investigate hydride formation around a stressed notch.
The results demonstrated that the multi-scale model is a useful tool to investigate delayed
hydride cracking and the effect of hydride formation on the contact force relaxation and gap
formation. Then, this multi-scale model is used to study the hydride distribution, hydride
thickness in the cladding over the three-cycle operation and the effect of hydride formation on
contact force and gap size. Hydride begins to form a rim on the cladding outer surface at 3.7×10⁷
s, and the rim thickness reaches plateau of 0.12mm at 7.0×10⁷s. After 7.0×10⁷s, the hydride
volume fraction inside the 0.12mm rim will increases with time, but the rim thickness almost
stay the same. Without considering the fluid-induced vibration, the initial contact force
relaxation is caused by the local creep in the contact region and the creep-down of the cladding
onto the fuel. After the contact force relaxes to zero, a gap forms between the grid and fuel rod.
The gap size keeps increasing as the cladding creeps down to the fuel completely. The gap size
reaches the maximum when the cladding touches the fuel rod. Then, gap size decreases as a
result of the UO2 swelling until the cladding retouches the grid. The simulation result indicates
that the contact force relaxes to zero before Cycle 1 ends at 1.4×10⁷s and the gap size reaches its
maximum value of about 0.1mm at 2.8×10⁷s. Hydride begins to form after the contact force
115
relaxing to zero, so the hydride has no effect on the initial contact force relaxation. Meanwhile,
the gap size reaches its the maximum value before hydride forms, so hydride has no effect on the
maximum gap size between the grid and cladding. Due to the volume expansion associated with
hydride formation, the gap closes faster than the case without hydride. However, the effects of
hydride on the contact force and gap size are not significant.
The work presented in this dissertation provides the material model for zircaloy creep, the
algorithm to couple creep and wear and the multi-scale model for hydride formation. These
models can be used to explore the effect of different material behaviors on the overall structural
behavior. In future, additional models should be constructed to study the effect of radiation on
creep and the effect of radiation on the structure deformation, like irradiation growth. Meanwhile,
the effect of oxide, which is another product during the corrosion, on the structural deformation
and contact stress evolution should be explored.

116
Bibliography
[1] K. T. Kim, "Applicability of out-of-pile fretting wear tests to in-reactor fretting wear-
induced failure time prediction," Journal of Nuclear Materials, vol. 433, pp. 364-371,
2013.
[2] Z. Hu, "The onset and propagation of GTRF wear," Ph.D. Thesis, University of
Michigan, 2015.
[3] K. T. Kim, "A study on the grid-to-rod fretting wear-induced fuel failure observed in
the 16x16 KOFA fuel," Nuclear Engineering and Design, vol. 240, pp. 756-762, 2010.
[4] H. Wang, Z. Hu, W. Lu and M. Thouless, "A mechanism-based framework for the
numerical analysis of creep in zircaloy-4," Journal of Nuclear Materials, vol. 433, pp.
188-198, 2013.
[5] K.-T. Kim and J.-M. Suh, "Impact of nuclear fuel assembly design on grid-to-rod
fretting wear," Journal of Nuclear Science and Technology, vol. 46, pp. 149-157, 2009.
[6] E. Zuzek, J. P. Abriata, A. San-Martin and F. D. Manchester, "The H-Zr (hydrogen-
zirconium) system," Bulletin of Alloy Phase Diagrams, vol. 11, pp. 385-395, 1990.
[7] J. B. Bai, C. Prioul and D. Francois, "Hydride embrittlement in Zircaloy-4 plate. Part I.
Influence of microstructure on the hydride embrittlement in Zircaloy-4 at 20 degree C
and 350 degree C," Metallurgical and Materials Transaction A, vol. 25, pp. 1185-
1197, 1994.
[8] R. N. Singh, P. Stahle, A. R. Massih and A. A. Shmakov, "Temperature dependence of
misfit strains of delta-hydrides of zirconium," Journal of Alloys and Compounds, vol.
436, pp. 150-154, 2007.
[9] H. J. Frost and M. F. Ashby, Deformation mechanism maps: the plasticity and creep of
metals and ceramics, OxFord: Pergamon, 1982.
[10] M. L. Saux, J. Besson, S. Carassou, C. Poussard and X. Averty, "A Model to Describe
the Anisotropic Viscoplastic Mechanical Behavior of Fresh and Irradiated Zircaloy-4
Fuel Claddings under RIA Loading Conditions," Journal of Nuclear Materials, vol.
378, pp. 60-69, 2008.
[11] M. D. Thouless, J. Gupta and M. E. Harper, "Stress Development and Relaxation in
Copper Films During Thermal Cycling," Journal of Materials Research, vol. 8, pp.
1845-1852, 1993.
[12] D. B. Knorr and M. R. Notis, "Deformation Mechanism Mapping of Zr and Zircaloy-
2," Journal of Nuclear Materials, vol. 56, pp. 18-24, 1975.
[13] P. M. Sargent and M. F. Ashby, "Deformation maps for Titanium and Zirconium,"
Scripta Metallurgica, vol. 16, pp. 1415-1422, 1982.
[14] D. Kaddour, S. Frechinet, A. F. Gourgues, J. C. Brachet, L. Portier and A. Pineau,
"Experimental Determination of Creep Properties of Zirconium Alloys together with
Phase Transformation," Scripta Materialia, vol. 51, pp. 515-519, 2004.
[15] J. L. Derep, S. Ibrahim, R. Rouby and G. Fantozzi, "Deformation Behavior of Zircaloy-

117
4 between 77 and 900K," Acta Metall, vol. 28, pp. 607-619, 1980.
[16] R. Raj and M. F. Ashby, "On Grain Boundary Sliding and Diffusional Creep,"
Metallurgical Transactions, vol. 2, pp. 1113-1127, 1971.
[17] F. R. N. Nabarro, "Deformation of Crystals by the Motion of Single Ions," Bristol
Conference on Strength of Solides, pp. 75-90, 1948.
[18] C. Herring, "Diffusional Viscosity of a Polycrystalline Solid," Journal of Applied
Physics, vol. 21, pp. 437-445, 1950.
[19] R. L. Coble, "A Model for Boundary Diffusion Controlled Creep in Polycrystalline
Materials," Journal of Applied Physics, vol. 34, pp. 1679-1682, 1963.
[20] B. V. Tanikella and K. L. Murty, "Transitions in Biaxial Creep of Zircaloy-4 Tubing,"
in The 2nd Asia-Pacific Symp. Advances in Engineering Plasticity and its Application,
Beijing, 1994.
[21] Y. Wang, "Mechanical Anisotropy of Zircaloy-4: Temperature and Strain Rate
Effects," North Carolina State University, 1998.
[22] I. M. Bernstein, "Diffusiona creep in zirconium and certain zirconium alloys,"
Transactions of the Metallurgical Society of AIME, vol. 239, pp. 1518-1522, 1967.
[23] J. Novotny, J. Fiala and J. Cadek, "Harper-Dorn Creep in Alpha-Zirconium," Acta
metall., vol. 33, pp. 905-911, 1985.
[24] J. Fiala and J. Cadek, "Creep in Zirconium at Low Stresses and Temperature from 748
to 973K," Materials Science and Engineering, vol. 75, pp. 117-126, 1985.
[25] N. Prasad, G. Malakindaiah and P. R. Rao, "Low Stress Creep Behavior of Zircaloy-2
vis-a-vis Zirconium," Scripta Metallurgica, vol. 26, pp. 541-543, 1992.
[26] T. A. Hayes, M. E. Kassner and R. S. Rosen, "Steady-state Creep of alpha-Zirconium
at Temperatures up to 850 degree C," Metallurgical and materials transactions. A,
Physical metallurgy and materials science, vol. 33, pp. 337-343, 2002.
[27] T. A. Hayes and M. E. Kassner, "Creep of zirconium and zirconium alloys,"
Metallurgical and Materials Transactions A, vol. 37, pp. 2389-2396, 2006.
[28] C. C. Busby and L. S. White, "Some High Temperature Mechanical Properties of
Internally Pressurized Zircaloy-4 Tubing," Westinghouse Electric Corporation,
Pittsburgh, 1976.
[29] H. E. Rosinger, P. C. Bera and W. R. Clendening, "Steady-State Creep of Zircaloy-4
Fuel Cladding from 940 to 1873 K," Journal of Nuclear Materials, vol. 82, pp. 286-
297, 1979.
[30] A. M. Garde, H. M. Chung and T. F. Kassner, "Micrograin Superplasticity in Zircaloy
at 850 degree C," Acta Metall., vol. 26, pp. 153-166, 1997.
[31] S. I. Hong, W. S. Ryu and C. S. Rim, "Elongation Minimum and Strain Rate
Sensitivity Minimum of Zircaloy-4," Journal of Nuclear Materials, vol. 116, pp. 314-
316, 1983.
[32] J. K. Yi, H. B. Park, G. S. Park and B. W. Lee, "Yielding and Dynamic Strain Aging
Behavior of Zircaloy-4 tube," Journal of Nuclear Materials, vol. 189, pp. 353-361,
1992.
[33] K. W. Lee, S. K. Kim, K. T. Kim and S. I. Hong, "Ductility and Strain Rate Sensitivity
118
of Zircaloy-4 Nuclear Fuel Claddings," Journal of Nuclear Materials, vol. 295, pp. 21-
26, 2001.
[34] "Allegheny Technologies," [Online]. Available: Reactor grad zirconium alloys for
nuclear waste disposal http://www.atimetals.com/businesses/business-
units/wahchang/products/Documents/Zr% 20nuke%20waste%20disposal.pdf.
[Accessed 19 April 2012].
[35] S. G. Popov, V. K. Ivanov, J. J. Carbajo and G. L. Yoder, "Thermophysical Properties
of MOX and UO2 Fuels Including the Effects of Irradiation," Oak Ridge National
Laboratory, 2000.
[36] J. K. Fink, M. G. Chasanov and L. Leibowitz, "Thermophysical Properties of Uranium
Dioxide," Journal of Nuclear Materials, vol. 102, pp. 17-25, 1981.
[37] K. T. Kim, "The study on grid-to-rod fretting wear models for PWR fuel," Nuclear
Engineering and Design, vol. 239, pp. 2820-2824, 2009.
[38] Y. H. Lee and H. K. Kim, "Fretting wear behavior of a nuclear fuel rod under a
simulated primary coolant condition," Wear, vol. 301, pp. 569-574, 2013.
[39] C. M. Churchman and D. A. Hills, "General results for complete contacts subject to
oscillatory shear," Journal of the Mechanics and Physics of Solids, vol. 54, pp. 1186-
1205, 2006.
[40] K. T. Kim and J. M. Suh, "Development of an advanced PWR fuel for OPR1000s in
Korea," Nuclear Engineering and Design, vol. 238, pp. 2606-2613, 2008.
[41] P. R. Rubiolo and M. Young, "On the factors affecting the fretting-wear risk of PWR
fuel assemblies," Nuclear Engineering and Design, vol. 239, pp. 68-79, 2009.
[42] K. T. Kim and J. M. Suh, "Development of an advanced PWR fuel for OPR1000s in
Korea," Nuclear Engineering and Design, vol. 238, pp. 2606-2613, 2008.
[43] Z. Hu, W. Lu, M. D. Thouless and J. R. Barber, "Simulation of wear evolution using
fictitious eigenstrains," Tribology International, vol. 82, pp. 191-194, 2015.
[44] P. R. Rubiolo and M. Young, "On the factors affecting the fretting-wear risk of PWR
fuel assemblies," Nuclear Engineering and Design, vol. 239, pp. 68-79, 2009.
[45] J. Yan, K. Yuan, E. Tatli and Z. Karoutas, "A new method to predict grid-to-rod
fretting in a PWR fuel assembly inlet region," Nuclear Engineering and Design, vol.
241, pp. 2974-2982, 2011.
[46] Z. Hu, H. Wang, M. D. Thouless and W. Lu, manuscript in preparation, 2016.
[47] S. Hu, J. Murray, H. Weiland, Z. Liu and L. Chen, "Thermodynamic description and
growth kinetics of stoichiometric precipitates in the phase-field approach," CALPHAD,
vol. 31, pp. 303-312, 2007.
[48] "ABAQUS user's and theory manuals, Version 6.11," Simulia, Dassault system, 2011.
[49] T. E. Fischer, M. P. Anderson, S. Jahanmir and R. Salher, "Friction and wear of tough
and brittle zirconia in nitrogen, air, water, hexadecane, and hexadecane containing
stearic acid," Wear, vol. 24, pp. 133-148, 1988.
[50] A. Romano, C. Shuffler, H. Garkischcm, D. Olander and N. Todreas, "Fuel
performance analysis for PWR cores," Nuclear Engineering and Design, vol. 239, pp.
1481-1488, 2009.

119
[51] C. M. Allison, G. A. Berna, R. Chambers, E. W. Coryell, K. L. Davis, D. L. Hagrman,
N. L. Hampton, J. K. Hohorst, R. E. Mason, M. McComas, K. A. McNeil, R. Miller, C.
Olsen, G. A. Reymann and L. Siefken, "SCDAP/RELAP5/MOD3.1 Code manual
Volume IV: MATPRO -- A library of materials properties for light-water-reactor
accident analysis (MATPRO)," 1993.
[52] A. B. Johnson, E. R. Gilbert and R. J. Guenther, "Behavior of spent nuclear fuel and
storage system components in dry interim storage," Prepared for the U.S. Department
of Energy under contact DE-AC06-76RLO 1830, Pacific Northwest Laboratory, 1982.
[53] A. Johnson and E. R. Gilbert, "Technical basis for storage of Zircaloy-clad spent fuel in
inert gases," PNL-4835 Prepared for the U. S. Department of Energy under contract
DE-AC06-76RLO 1830, Pacific Northwest Laboratory, 1983.
[54] J. Bakosi, M. A. Christon, R. B. Lowrie, L. A. Pritchett-sheats and R. R. Nourgaliev,
"Large-eddy simulations of turbulent flow for grid-to-rod fretting in nuclear reactors,"
Nuclear Engineering and Design, vol. 262, pp. 544-561, 2013.
[55] J. F. Archard, "Contact and rubbing of flat surfaces," Journal of Applied Physics, vol.
24, pp. 981-988, 1953.
[56] N. J. Fisher, M. K. Weckwerth, D. A. E. Grandison and B. M. Cotnam, "Fretting-wear
of zirconium alloys," Nuclear Engineering and Design, vol. 213, pp. 79-90, 2002.
[57] K. H. Cho, T. H. Kim and S. S. Kim, "Fretting wear characteristics of Zircaloy-4 tube,"
Wear, vol. 219, pp. 3-7, 1998.
[58] P. J. Blau, "A multi-stage wear model for grid-to-rod fretting of nuclear fuel rods,"
Wear, vol. 313, pp. 89-96, 2014.
[59] J. R. Barber, Elasticity, Netherlands: Springer, 2010.
[60] I. G. Goryacheva, P. T. Rajeev and T. N. Farris, "Wear in partial slip contact," Journal
of Tribology, vol. 123, pp. 848-856, 2001.
[61] Z. Hu, W. Lu and M. D. Thouless, "Slip and Wear at a Corner with Coulomb Friction
and an Interfacial Strength," Wear, Vols. 338-339, pp. 242-251, 2015.
[62] Z. Hu, W. Lu, M. Thouless and J. R. Barber, "Effect of plastic deformation on the
evolution of wear and local stress fields in fretting," International Journal of Solids &
Structures, vol. 82, pp. 1-8, 2016.
[63] C. Paulin, S. Fouvry and C. Meunier, "Finite element modelling of fretting wear
surface evolution: Application to a Ti–6A1–4V contact," Wear, vol. 264, pp. 26-36,
2008.
[64] J. J. Kearns and C. R. Woods, "Effect of texture, grain size, and cold work on the
precipitation of oriented hydrides in zircaloy tubing and plate," Journal of Nuclear
Materials, vol. 20, pp. 241-261, 1966.
[65] M. L. Vanderglas and Y. J. Kim, "Stresses Due to Volumetric Expansion of Zirconium
Hydride Inclusions," International Journal of Pressure Vessels and Piping, vol. 22, pp.
177-196, 1986.
[66] R. Dutton, K. Nuttall, M. P. Puls and L. A. Simpson, "Mechanisms of hydrogen
induced delayed cracking in hydride forming materials," Metallurgical Transactions A,
vol. 8, pp. 1553-1562, 1977.
[67] M. P. Puls, The effect of hydrogen and hydrides on the integrity of zirconium alloy
120
components delayed hydride cracking, Springer, ISBN: 978-1-4771-4194-5, 2012.
[68] R. Singh, R. Kishore, T. K. Sinha and B. P. Kashyap, "Hydride blister formation in Zr–
2.5wt%Nb pressure tube alloy," Journal of Nuclear Materials, vol. 301, pp. 153-164,
2002.
[69] L. O. Jernkvist, "Multi-field modelling of hydride forming metals. Part II: Application
to fracture," Computational materials science, vol. 85, pp. 383-401, 2014.
[70] F. Nagase and T. Fuketa, "Behavior of pre-hydrided zircaloy-4 cladding under
simulated LOCA conditions," Journal of Nuclear Science and Technology, vol. 42, pp.
209-218, 2005.
[71] R. N. Singh, R. Kishore, S. S. Singh, T. K. Sinha and B. P. Kashyap, "Stress-
reorientation of hydrides and hydride embrittlement of Zr–2.5 wt% Nb pressure tube
alloy," Journal of Nuclear Materials, vol. 325, pp. 26-33, 2004.
[72] M. Aomi, T. Baba, T. Miyashita, K. Kamimura, T. Yasuda, Y. Shinohara and T.
Takeda, "Evaluation of Hydride Reorientation Behavior and Mechanical Properties for
High-Burnup Fuel-Cladding Tubes in Interim Dry Storage," Journal of ASTM
International, vol. 5, pp. 651-673, 2008.
[73] X. Q. Ma, S. Q. Shi, C. H. Woo and L. Q. Chen, "The phase field model for hydrogen
diffusion and γ-hydride precipitation in zirconium under non-uniformly applied stress,"
Mechanics of Materials, vol. 38, pp. 3-10, 2006.
[74] X. H. Guo, S. Q. Shi, Q. M. Zhang and X. Q. Ma, "An elastoplastic phase-field model
for the evolution of hydride precipitation in zirconium. Part I: Smooth specimen,"
Journal of Nuclear Materials, vol. 378, pp. 110-119, 2008.
[75] X. H. Guo, S. Q. Shi, Q. M. Zhang and X. Q. Ma, "An elastoplastic phase-field model
for the evolution of hydride precipitation in zirconium. Part II: Specimen with flaws,"
Journal of Nuclear Materials, vol. 378, pp. 120-125, 2008.
[76] L. O. Jernkvist and A. R. Massih, "Multi-field modelling of hydride forming metals.
Part I: Model formulation and validation," Computational materials science, vol. 85,
pp. 363-382, 2014.
[77] B. F. Kammenzind, B. M. Berquist and R. Bajaj, "The long-range migration of
hydrogen through Zircaloy in response to tensile and compressive stress gradients,"
Zirconium in the nuclear industry: Twelfth international symposium, ASTM STP1354,
pp. 196-233, 2000.
[78] A. G. Varias and A. R. Massih, "Hydride-induced embrittlement and fracture in metals-
effects of stress and temperature distribution," Journal of the Mechanics and Physics of
Solids, vol. 50, pp. 1469-1510, 2002.
[79] M. F. Horstemeyer, Multiscale Modeling: A Review, Practical Aspects of
Computational Chemistry: Methods, Concepts and Applications, ISBN 978-90-481-
2687-3, 2009, pp. 87-135.
[80] V. Vaithyanathan, C. Wolverton and L. Q. Chen, "Multiscale modeling of θ
precipitation in Al–Cu binary alloys," Acta Materialia, vol. 52, pp. 2973-2987, 2004.
[81] P. M. Ajavan, L. S. Schadler and P. V. Braun, Nanocomposite science and technology,
Wiley-VCH Verlag, ISBN 3-527-30359-6, 2006.
[82] M. Meier-Schellersheim, I. D. C. Fraser and F. Klauschen, "Multi-scale modeling in
121
cell biology," Wiley interdisciplinary reviews: system biology and medicine, vol. 1, pp.
4-14, 2009.
[83] J. Simmons, C. Shen and Y. Wang, "Phase field modeling of simultaneous nucleation
and growth by explicitly incorporating nucleation events," Scripta Materialia, vol. 43,
pp. 935-942, 2000.
[84] K. Une and S. Ishimoto, "Dissolution and precipitation behavior of hydrides in
zircaloy-2 and high fe zircaloy," Journal of Nuclear Materials, vol. 322, pp. 66-72,
2003.
[85] A. McMinn, E. C. Darby and J. S. Schofield, "The terminal solid solubility of hydrogen
in zirconium alloys," ASTM special technical publication, vol. 1354, pp. 173-195,
2000.
[86] K. B. Colas, A. T. Motta, J. D. Almer, M. Daymond, M. Kerr, A. Banchik, P. Vizcaino
and J. Santisteban, "In situ study of hydride precipitation kinetics and re-orientation in
Zircaloy using synchrotron radiation," Acta Materialia, vol. 58, pp. 6575-6583, 2010.
[87] A. Jokisaari, "Multiphysics phase field modeling of hydrogen diffusion and δ-hydride
precipitation in α-zirconium," Doctoral thesis, 2015.
[88] D. Gaston, C. Newman, G. Hansen and D. Lebrun-Grandie, "MOOSE: A parallel
computational framework for coupled systems of nonlinear equations," Nuclear
Engineering and Design, vol. 239, pp. 1768-1778, 2009.
[89] N. Saunders and A. P. Miodownik, CALPHAD (Calculation of Phase Diagrams): A
comprehensive guide, vol. 1, Elsevier, 1998.
[90] A. A. Wheeer, W. J. Boettinger and G. B. McFadden, "Phase-field model for
isothermal phase transitions in binary alloys," Physical Review A, vol. 45, pp. 7424-
7439, 1992.
[91] J. W. Cahn, "On spinodal decomposition," Acta metallurgica, vol. 9, pp. 795-801,
1961.
[92] S. M. Allen and J. W. Cahn, "A microscopic theory for antiphase boundary motion and
its application to antiphase domain coarsening," Acta Metallurgica, vol. 27, pp. 1085-
1095, 1979.
[93] N. Dupin, I. Ansara, C. Servant, C. Toffolon, C. Lemaignan and J. Brachet, "A
thermodynamic database for zirconium alloys," Journal of Nuclear Materials, vol. 275,
pp. 287-295, 1999.
[94] S. Q. Shi, "The effect of external stress on hydride precipitation temperature in
zirconium for a given hydrogen concentration in solid solution," Scripta Materialia,
vol. 41, pp. 1151-1121, 1999.
[95] M. P. Puls, Hydrogen-induced delayed hydride cracking: 1. strain energy effects on
hydrogen solubility, Tech. Rep. AECL-6302, Atomic Energy of Canada Limited, 1978.
[96] O. Zanellato, M. Preuss, J.-Y. Buffiere, F. Ribeiro, A. Steuwer, J. Desquines, J.
Andrieux and B. Krebs, "Synchrotron diffraction study of dissolution and precipitation
kinetics of hydrides in Zircaloy-4," Journal of Nuclear Materials, vol. 420, pp. 537-
547, 2012.
[97] F. S. Ham, "Stress-assisted precipitation on dislocations," Journal of Applied Physics,
vol. 30, pp. 915-926, 1959.
122
[98] A. Sawatzky, "Hydrogen in Zircaloy-2: its distribution and heat of transport," Journal
of Nuclear Materials, vol. 2, pp. 321-328, 1960.
[99] G. P. Marino, "A numerical calculation of the redistribution of an interstitial solute in a
thermal gradient," Nuclear Science and Engineering, vol. 49, pp. 93-98, 1972.
[100] A. G. Varias and A. R. Massih, "Simulation of hydrogen embrittlement in zirconium
alloys under stress and temperature gradients," Journal of Nuclear Materials, vol. 279,
pp. 273-285, 2000.
[101] R. L. Eadie, K. Tashiro, D. Harrington and M. Leger, "The determination of the partial
molar volume of hydrogen in zirconium in a simple stress gradient using comparative
microcalorimetry," Scripta Metallurgica Materialia, vol. 26, pp. 231-236, 1992.
[102] S. Q. Shi, "Diffusion-controlled hydride growth near crack tip in zirconium under
temperature transients," Journal of Nuclear Materials, vol. 275, pp. 318-323, 1999.
[103] A. Sawatzky, "The diffusion and solubility of hydrogen in the alpha-phase of zircaloy-
2," Journal of Nuclear Materials, vol. 2, pp. 62-68, 1960.
[104] K. T. Kim and J. M. Suh, "Impact of nuclear fuel assembly design on Grid-to-Rod
Fretting wear," Journal of Nuclear Science and Technology, vol. 46, pp. 149-157,
2009.
[105] F. Nagase and T. Fuketa, "Investigation of hydride rim effect on failure of zircaloy-4
cladding with tude burst test," Jouranal of Nuclear Science and Technology, vol. 42,
pp. 59-65, 2005.
[106] A. Couet, A. T. Motta and R. J. Comstock, "Hydrogen pickup measurements in
zirconium alloys: Relation to oxidation kinetics," Journal of Nuclear Materials, vol.
451, pp. 1-13, 2014.
[107] M. Billone, Y. Yan, T. Burtseva and R. Daum, "Cladding Embrittlement During
Postulated Loss-of-Coolant Accidents," 2008.
[108] R. Shimskey, B. Hanson and P. MacFarlan, "Optimization of Hydride Rim Formation
in Unirradiated Zr-4 Cladding," 2013.
[109] F. Povolo and A. J. Marzocca, "Creep of Cold-Worked Zry-4 at 673 K," Journal of
Nuclear Materials, vol. 97, pp. 323-332, 1981.
[110] A. T. Donaldson and R. C. Ecob, "A Transition Stress in the Creep of an Alpha Phase
Zirconium Alloy at High Temperature," Scripta Metall., vol. 19, pp. 1313-1318, 1985.
[111] S. Y. Lee, K. Kim and S. I. Hong, "Circumferential Creep Properties of StressRelieved
Zircaloy-4 and Zr–Nb–Sn–Fe Cladding Tubes," Journal of Nuclear Materials, vol.
392, pp. 63-69, 2009.
[112] Y. Matsuo, "Thermal Creep of Zircaloy-4 Cladding under Internal Pressure," Journal
of Nuclear Science and Technology, vol. 24, pp. 111-119, 1987.
[113] M. Mayuzumi and T. Onchi, "Creep Deformation and Rupture Properties of
Unirradiated Zircaloy-4 Nuclear Fuel Cladding Tube at Temperature of 727 to 875K,"
Journal of Nuclear Materials, vol. 175, pp. 135-142, 1990.
[114] R. W. Balluffi, S. Allen and W. C. Carter, Kinetics of Materials, John Wiley & Sons,
2005.
[115] J. D. Cox, D. D. Wagman and V. A. Medvedev, CODATA: Key Values for
Thermodynamics, New York: Hemisphere Publishing Corporation, 1989.

123
[116] A. T. Dinsdale, "Sgte data for pure elements," CALPHAD, vol. 15, pp. 317-425, 1991.
[117] A. G. Khachaturyan, "Theory of structural transformations in solids," Courier
Corporation, 2008.
[118] S. R. MacEwen, C. E. Coleman and C. E. Ells, "Dilation of hcp zirconium by
interstitial deuterium," Acta Metallurgica, vol. 33, pp. 753-757, 1985.
[119] H. Peisl, Lattice strains due to hydrogen in metals, vol. 28, G. Alefeld and J. Voelkl,
Eds., Hydrogen in Metals I, Topics in Applied Physics, Springer Berlin Heidelberg,
1978, pp. 53-74.