numerical modelling of flow and transport processes in a calciner for
TRANSCRIPT

1 (2007) 81–95www.elsevier.com/locate/powtec
Powder Technology 17
Numerical modelling of flow and transport processesin a calciner for cement production☆
D.K. Fidaros, C.A. Baxevanou, C.D. Dritselis, N.S. Vlachos⁎
Department of Mechanical and Industrial Engineering, University of Thessaly, Athens Avenue, 38334 Volos, Greece
Received 19 October 2005; received in revised form 1 September 2006; accepted 7 September 2006Available online 29 November 2006
Abstract
Controlling the calcination process in industrial cement kilns is of particular importance because it affects fuel consumption, pollutant emissionand the final cement quality. Therefore, understanding the mechanisms of flow and transport phenomena in the calciner is important for efficientcement production. The main physico-chemical processes taking place in the calciner are coal combustion and the strongly endothermiccalcination reaction of the raw materials. In this paper a numerical model and a parametric study are presented of the flow and transport processestaking place in an industrial calciner. The numerical model is based on the solution of the Navier–Stokes equations for the gas flow, and onLagrangean dynamics for the discrete particles. All necessary mathematical models were developed and incorporated into a computational fluiddynamics model with the influence of turbulence simulated by a two-equation (k–ε) model. Distributions of fluid velocities, temperatures andconcentrations of the reactants and products as well as the trajectories of particles and their interaction with the gas phase are calculated. Theresults of the present parametric study allow estimations to be made and conclusions to be drawn that help in the optimization of a given calciner.© 2006 Elsevier B.V. All rights reserved.
Keywords: CFD; Coal combustion; Calcination; Calciner modeling; Cement production
1. Introduction
The main processes of cement production include raw-mixpreheating and calcination, clinker formation and cooling toachieve a crystalographic structure that meets the required ce-ment specifications. After cooling, the clinker is fed into grind-ing or finish mills and is mixed with plaster and amelioratingadditives. The mills consume a very large amount of the totalenergy required for cement production.
The raw-mix consists mainly of pulverized calcium carbon-ate and silicon dioxide. During its heating/drying at tempera-tures from 100 °C to 500 °C the moisture evaporates and at 850to 890 °C the endothermous calcination reaction begins, whereCaCO3 is converted into CaO and CO2. The activation energyfor the calcination is provided by the combustion heat of thefuel.
☆ Dedicated to the late Professor Shao-Lee Soo, for his pioneering work inmultiphase dynamics.⁎ Corresponding author. Tel.: +30 2421074094; fax: +30 2421074085.E-mail address: [email protected] (N.S. Vlachos).
0032-5910/$ - see front matter © 2006 Elsevier B.V. All rights reserved.doi:10.1016/j.powtec.2006.09.011
Dry heating of raw-mix in vertical suspension preheaters (seeFig. 1) is mostly used, where calcination also takes place. Theinnovation in the entire pyroprocess in modern cement plants isthe use of an additional calcining vessel, in which the raw-mixundergoes calcination to a level of 90 to 95%. In this way, thecalcined raw-mix enters the rotary kiln at a higher temperature,thus reducing the energy demand and the thermal load on thekiln. After being heated to the appropriate temperature, it entersthe calciner together with the fuel and the hot tertiary air, Fig. 2.The combustion heat released by the fuel causes calcination ofthe raw-mix according to the chemical reaction:
CaCO3 Y1160 K
CaOþ CO2 þ 178 kJ=mol ð1ÞThe high fineness of the raw-mix and the good turbulent
mixing cause uniform and fast coal combustion and calcinationreactions. The products of the calciner are fed to the last cyclonethat feeds the rotary kiln. The placement of calcination outsidethe cement kiln results in better quality of CaO and energysavings. For example, in the Olympus plant of AGET Herculesin Greece calcination takes roughly 60% of the total heat

Fig. 1. Schematic of cement production.
Fig. 2. Calciner device.
82 D.K. Fidaros et al. / Powder Technology 171 (2007) 81–95
absorbed in the system, while 35% is spent for preheating and5% for clinkering [1]. This ratio of 60:40 is reversed in the casewhere the calcination is taking place inside the rotary kiln. Inaddition, the good mixing of fuel, air and raw-mix in the calcinerresults to faster calcination with good efficiency at relatively lowtemperatures.
The advantages of using calcination devices are: a) Theaddition of a burner in the calciner increases the capacity of therotary kiln in comparison to using simple preheaters, b) Thereduction of thermal load and the increased rotational speed ofthe kiln (to achieve better mixing at increased capacity) extendsthe lifetime of the firebricks and, thus, the operational life of thekiln, c) The reduction of energy demand and the minimal calci-nation in the kiln reduce considerably the exhaust gases and thekiln heat losses to the environment because the exhaust gasesabsorb most of the radiation, d) The combustion at medium–lowtemperatures (b1400 °C) in the kiln reduces the production ofNOx, although combustion control and kiln burner design is stillsignificant, e) The lower temperature required in the calcinerallows the use of fuels with relatively low thermal capacity(usually bituminous coal), f) The reduction of the thermal load ofthe rotary kiln decreases the condensing of vapours (SO3, Na, Kand Cl) in the combustion area. However, the volatile cycle isstill a concern because now it will take place in the preheater/precalciner tower itself as opposed to the kiln), and g) Thereduced calcification percentage in the rotary kiln, decreases itsthermal load and improves its functional stability, as the kilnburners are now used only for clinkering.
Calciners have become essential devices in cement produc-tion but have also disadvantages: a) The lower temperatures ofthe exhaust gases may cause condensation of volatile alkalis,
while the higher rotational speeds can increase the quantity ofalkaline dust in the kiln, b) Reduction of NOx emissions is notcommon in all cement production systems using calciners,mainly due to geometric and operational differences, as well asto different quality and quantity of raw-mix and fuels, and c)The utilisation of fuels with low energy value, although eco-nomically advantageous, requires particular attention in order toavoid undesirable emissions of polluting and erroding gases.
From the above, it becomes apparent that control of cal-cination is important because it affects fuel consumption,pollutant emissions and the final cement quality. Therefore,understanding the mechanisms of flow and transport phenom-ena in the calciner may contribute to more efficient productionand better quality of cement.
Recently, calciners have been studied with different geom-etries and operational conditions in 2D and 3DCFD simulations.Huanpeng et al [2] studied the influence of various physicalparameters on the dynamics of gas–solid two-phase flow in aprecalciner using kinetic theory of granular flow to represent thetransport properties of the solid phase in a 2Dmodel. Hu et al. [3]used a 3D model for a dual combustor and precalciner using aEulerian frame for the gas phase and a Lagrangean one for thesolid phase in order to predict the burn-out and the decompo-sition ratio during the simultaneous injection of two types of coaland raw material into the device. Iliuta et al. [4] investigated theinfluence of operating conditions on the level of calcination,burn-out and NOx emissions of an in-line low NOx calciner, andmade a sensitivity analysis of their model with respect to aero-dynamic and combustion/calcination parameters.
In the present work a numerical model is described for the flowand transport processes taking place in an industrial calciner. Themodel is based on the solution of the Navier–Stokes equations for

83D.K. Fidaros et al. / Powder Technology 171 (2007) 81–95
the gas flow and on Lagrangean dynamics for the discreteparticles, using a commercial CFD code. All necessary flow, heatand mass transfer and chemical reaction models are presentedwith the influence of turbulence simulated by a two-equation(k–ε) model. Limited available measurements from the Olympuscement plant of AGET Hercules are used to verify the model.
2. Mathematical models
2.1. Gaseous phase
The general form of the time-averaged transport equation formomentum, heat and mass of the gases is:
A
AtðqUÞ þ A
AxðqUUÞ þ 1
rA
ArðqrVUÞ þ 1
rA
AhqWrAUAh
� �
¼ A
AxCU
AUAx
� �þ 1
rA
ArCUr
AUAr
� �þ 1
rA
AhCU
1rAUAh
� �þ SU
ð2Þ
where U, V,W are the time-averaged velocities in the axial, radialand circumferential direction, respectively, ΓΦ the transportcoefficient, and Φ any time-averaged transported fluid property.
2.2. Particle dynamics
The particle trajectories are calculated from their corre-sponding motion equation:
dUp
dt¼ FDðU−UpÞ þ gi
qp−qqp
þ f i ð3Þ
where, the subscript “p” denotes particle.For spherical particles, FD in the drag force term is:
FD ¼ 3lCDRe4qpDp2
ð4Þ
where the drag coefficient is calculated from:
CD ¼ a1 þ a2Re
þ a3Re2
ð5Þ
and α1, α2 and α3 are constants proposed by Morsi andAlexander [5].
The additional force term fi in Eq. (3) may be due to pressuregradients, thermophoretic, Brownian or Saffman lift forces.
2.3. Particle size distribution
The particle sizes follow a Rosin–Rammler distribution:
MD ¼ e−½ðD=D̄oÞn� ð6Þwhere n is calculated from:
n ¼ lnðlnMDÞlnðD=D̄Þ ð7Þ
Each size interval is represented by an average diameter forwhich the trajectory calculations are performed.
2.4. Particle heat transfer
Particle heat transfer is due to convection, radiation and de-volatilization, as follows:
Tpðt þΔtÞ ¼h ApTl þ dmp
dt hfg þ ApeprH4R
h Ap þ ApeprT3p
þ TpðtÞ−h ApTl þ dmp
dt hfg þ ApeprH4R
h Ap þ ApeprT3p
0@
1A
� e−ApðhþeprTep Þ
mpCpt
ð8Þ
2.5. Devolatilization modelThe devolatilization model of Kobayashi [6] is used:
R1 ¼ A1expE1
RTp
� �; ð9aÞ
R2 ¼ A2expE2
RTp
� �ð9bÞ
where, R1 and R2 are competitive volatilization rates at differenttemperature ranges. These yield an expression for devolatiliza-tion:
mvðtÞmpo−mash
¼Z t
0ða1R1 þ a2R2Þexp
Z t
0ðR1 þ R2Þdt
� �dt ð10Þ
The Kobayashi model requires known kinetic parameters(A1, E1) and (A2, E2) and the contribution of the two reactionsvia the factors a1 and a2. More specifically A1=2.0e+07 s−1
and A2=1.0e+07 s−1 are the pre-exponential factors, andE1=1.046e+05 J/mol and E2 =1.67e+05 J/mol are theactivation energies. It is recommended that the value of a1should be equal to the fraction of volatiles that is determined bythe proximate analysis, because this rate represents the volatileevaporation at low temperatures. The value of a2 should beequal to 1, as it expresses the contribution of the evaporationrate of volatiles at very high temperatures.
2.6. Surface/coal combustion models
After devolatilization is completed, there starts the surfacechemical reaction of the coal particle which may be modelled asfollows:
2.6.1. Diffusion modelThe reaction rate is determined by the diffusion of the gas
oxidant into the particle surface:
dmp
dt¼ −4pDp Dim
moTpqgSbðTp þ TlÞ ð11Þ
In this model the particle diameter is assumed constant and,as its mass decreases, the active density decreases resulting in
84 D.K. Fidaros et al. / Powder Technology 171 (2007) 81–95
a more porous particle. Eq. (11) proposed by Baum andStreet [7] ignores the contribution of kinetics to the surfacereaction.
2.6.2. Kinetic/diffusion modelThe reaction rate is determined by the diffusion of gas
oxidant into the particle surface or by the reaction kinetics. Themodel proposed by Baum and Street [7] and Field [8] is used, inwhich the diffusion rate is:
R1 ¼ C1½ðTp þ TlÞ=2�0:75
Dpð12Þ
and the kinetics rate:
R2 ¼ C2exp −ERTp
� �ð13Þ
The kinetics rate incorporates the effects of chemical reactionin the internal surface of a coal particle and the epidermicdiffusion. The rates R1 and R2 are combined to give thecombustion rate of the coal (char) particle.
dmp
dt¼ −pD2
pP0R1R2
R1 þ R2ð14Þ
The particle size is kept constant, until a significant reductionin its mass leads to a new size estimation.
2.7. Particle radiation
The radiation from the coal particles into the gas isincorporated via the P-1 model [9–10]:
jdðCjGÞ þ 4p arT4
pþ Ep
� �−½aþ ap�G ¼ 0 ð15Þ
where, Ep and αp are calculated from:
Ep ¼ limVY0
XNn¼1
epnApn
rT4pn
pVð16aÞ
ap ¼ limVY0
XNn¼1
epnApn
Vð16bÞ
The quantity Γ in Eq. (15) is:
C ¼ 13½aþ ap þ rp� ð17Þ
and σp is calculated from:
rp ¼ limVY0
XNn¼1
ð1−fpnÞð1−epnÞApn
Vð18Þ
The calculation of σp is repeated in the entire trajectory for nparticles. Then, the source term that is introduced into theenergy equation is:
−jqr ¼ −4p arT4
pþ Ep
� �þ ½aþ ap�G ð19Þ
2.8. Chemical reaction models
The present modelling of mixture fraction [11,12] with themethod of probability density function (mixture fraction/PDF)requires the solution of transport equations for one or twoconservative scalar properties. The effect of turbulence is alsoconsidered. The method of mixture fraction with PDF has beendeveloped specifically for turbulent chemically reacting flowsimulations. The chemical reaction is determined by turbulentmixing, which controls the limits of the kinetic rates. The PDFmethod offers many advantages compared to the method offinite reaction rate. The method of mixture fraction allows theexplicit intermediate calculation of chemical compound form-ing and the interlacing of turbulence and chemistry. The methodis economic, because it does not require the solution of a largenumber of transport equations for each chemical species. More-over, it allows precise determination of auxiliary variables suchas density, and it does not use average values, in contrast to themethod of finite reaction rate.
For a binary system such as fuel and oxidant, the mixturefraction can be formulated in terms of elemental mass fractions:
f ¼ Zk−ZkOZkF−ZkO
ð20Þ
The value of f is calculated from the solution of a time-averaged transport equation:
A
Atðq f̄ Þ þ A
Axiðqui f̄ Þ ¼ A
Axi
ltrt
A f̄Axi
� �þ Sm ð21Þ
The source term Sm is present only when particle masstransport to the gaseous phase takes place.
Simultaneously with the solution of Eq. (21), a conservativeequation for the variance of mixture fraction, f̄ V2, describing theinteraction between chemistry and turbulence, is solved:
A
Atðq f̄ V2Þ þ A
Axiðqui f̄ V2Þ ¼ A
Axi
ltrt
A f̄ V2
Axi
!
þ CgltAf̄Axi
!2
−Cdqekf̄ V2 ð22Þ
where, σt, Cg and Gd are constants equal to 0.7, 2.86 and 2.6,respectively.
2.8.1. Coal reaction mechanismsCoal combustion — The most important physico-chemical
change in the coal particle during heating is thermal frag-mentation (pyrolysis) at high temperatures. During this stage an
85D.K. Fidaros et al. / Powder Technology 171 (2007) 81–95
important loss of weight occurs, because of dissolution ofvolatile matter, the quantity and composition of which dependon the ingredients of coal, its grain size and temperature. Duringdissolution of volatiles, a number of parallel reactions occur,with chemical combinations of reacting components or evenspecies such as, for example, CH4, CHOH, C2H6, H2, and S2.After devolatization leading to production of water vapour, CO,CO2 etc, a series of progressive reactions of char and de-volatization gases take place as follows [1,13–23]:
Heterogeneous reactions
CðsÞ þ O2ðgÞ⇒CO2ðgÞ ð23aÞ
2CðsÞ þ O2ðgÞ⇒2COðgÞ ð23bÞ
CðsÞ þ 2H2ðgÞ⇒CH4ðgÞ ð23cÞ
CðsÞ þ CO2ðgÞ⇒2COðgÞ ð23dÞ
CðsÞ þ H2OðgÞ⇒COðgÞ þ H2ðgÞ ð23eÞHomogeneous reactions
2COðgÞ þ O2ðgÞ⇒2CO2ðgÞ ð24aÞ
COðgÞ þ H2OðgÞ⇒CO2ðgÞ þ H2ðgÞ ð24bÞ
COðgÞ þ 3H2ðgÞ⇒CH4ðgÞ þ H2OðgÞ ð24cÞ
CH4ðgÞ þ 2O2ðgÞ⇒CO2ðgÞ þ 2H2OðgÞ ð24dÞ
HCðgÞ þ 1:5O2ðgÞ⇒CO2ðgÞ þ H2OðgÞ ð24eÞThe decomposition and polymerization reactions of the
superior and unsaturated hydrocarbons are also added:
Superior HCðgÞYfragmentation
Inferior HCðgÞ þ CðsÞ
Unsaturated HCðgÞYSaturated HCðgÞ
Unsaturated HCðgÞ þ H2ðgÞYPolymerization
Superior HCðgÞ
Pyrolysis — As temperature increases, the humidity and thegases enclosed in the coal particles are released. The largerpercentage of the non-chemically combined water is evaporatedat temperatures below 105 °C while the chemically combined attemperatures exceeding 350 °C. At pyrolysis temperatures,certain types of coal melt, forming an intermediate product
called metaplast. With the increase of temperature the metaplastis split, shaping the basic volatile products and semicoke,causing the coal particles to swell. This is described by a factorthat depends on the composition of volatiles and the heatingrate. The increase of particle volume does not influence theactivity of pyrolysis, while the semicoke formed initially, isdecomposed as temperature increases.
The rate of thermal decomposition increases with increasingtemperature up to a maximum value. Many researchers (forexample, [15,17,23]) have found that pyrolysis ends around 850to 1000 °C, while its duration is limited to a few secondsdepending on the particle size. After the volatiles have beenreleased, the remaining solid (char) still retains a small per-centage of volatiles (∼1.5%) like H2 and N2, requiring a tem-perature near 2000 °C to be removed completely.
Experiments show that the determination of volatiles in coalis demanding and time-consuming. Many measurements ofvolatiles based on the ASTM standard, present large differencesin the percentage of volatiles depending on the rate of tem-perature increase and on the experimental method [10,15,16,18,19]. The solid remains of the particles formed during thermaldecomposition are mainly fixed carbon, with high porosity andlarge internal surface, and the inorganic part is ash. The tem-perature varies between 1200 and 1800 °C causing ash melting.The composition and the nature of ash as well as its properties(melting point, viscosity, etc) depend to a large extent on thepyrolysis conditions.
In cases where the gaseous phase consists mainly of air, thepyrolysis and the combustion of char proceed simultaneously.However, in general, char combustion follows pyrolysis, withonly a very small time overlap. In ordinary coal particles, volatilestend to be emitted in concentrated but randomly distributed jetsfrom their surface. The larger jets reject volatiles during thermaldecomposition while smaller jets begin and end during thisperiod.When the gaseous phase is hot enough and rich in oxygen,the jets of volatiles ignite to form jet flames. In relatively largeparticles, the emission and combustion of volatiles can keep thechar surface free of oxygen. When the surface of hot char isaccessed by oxygen, there begins a heterogeneous combustionreaction with longer duration, lasting 15 to 20 times than thethermal decomposition of volatiles, depending on its evolutionand combustion conditions [21–29].
The heating rate of coal particles depends on their size andcontact with the thermal source. For example, the heating rate ofcoal powder by a surrounding flame is 1000 °C/s, but when theflame is from powder coal particles, the rate may increase to10000 °C/s. The pyrolysis results in a number of products withlarge differences in molecular weight, from gaseous hydrogenup to heavy organic species (tar). The data provided by exper-iments concerning rapid pyrolysis is not sufficient to determinethe composition and distribution of intermediate products forvarious coals [30–32].
Thus, the mathematical models developed for devolatiliza-tion are based on the initial coal particle composition. Manyresearchers, assume that the coal is considerably homogeneous,so it is possible to be assumed as a heated mass and alteredgradually from volatiles–char–ash to char–ash and finally to

86 D.K. Fidaros et al. / Powder Technology 171 (2007) 81–95
ash. From tables of ultimate analyses of coal and pet coke [1,2], itappears that the main components of volatiles are CO, CH, H2O,and H2. Given that the atmosphere of the calciner is oxidant andassuming that all these components react with oxygen, the mainreactions considered as taking place are:
CO þ 1=2O2→CO2–283:2kJ=mol ð25aÞ
H2 þ 1=2O2→H2O–242kJ=mol ð25bÞ
CH4 þ 2O2→CO2 þ 2H2O–802:86kJ=mol ð25cÞ
Char combustion— The mechanism of char combustion hasbeen investigated more than pyrolysis, without definitiveanswers to questions concerning the quantitative origin ofsome constituents after the end of transformation. Qualitatively,however, it has been modelled satisfactorily by various mathe-matical models. These were developed in order to describe thesolid coal combustion and have found important application inreactions of porous solids with gases.
Two simple mathematical models describe the reaction ofcoal grain with oxygen: the simple film and the double filmmodel. In the first model the oxygen is diffused via a constantboundary layer in the surface of the char particle, where it reactsto form CO and CO2. The CO is then diffused in the well-mixedenvironment. In the second model, char reacts with CO2 and notwith oxygen, in order to produce CO that is burned in a thinflame inside the boundary layer. The CO reacts with oxygeninside the boundary layer, and thus the oxygen never approachesthe char surface. Small particles (b100 μm) are considered toburn according to the first model and larger (up to N2 mm)according to the second. However, the two models constituteonly the two extreme cases of char combustion and cannot,therefore, establish a general theory [29–36].
The real mechanism of combustion is more complicated,because of many factors involved such as particle size, localtemperature, local oxygen concentration and reaction controllingmechanism. Generally, the oxygen and CO are readily availableon the coal surface and can, therefore, react simultaneously withcoal and also between each other. The situation becomes morecomplex when the char porosity is taken into consideration(intrinsic model).
A more complex model proposed by Essenhigh [37] describesbetter the above processes. In this model the distribution oftemperature and concentrations are extended to the center of theparticle. The more usual diffusion controlled combustion of COcan be extremely fast, consuming all the local oxygen before itreaches the char surface and reacting only with CO2. In thechemically controlled combustion of CO2 and O2, these haveequal probability to react with the char surface. Moreover, ex-perimental data by Field [8] and Borghi [38] showed that thereaction of char–CO2 is very slow in comparisonwith the reactionof char–O2. Therefore, the latter can be considered as the mainreaction on the char surface when the essential quantity of oxygenis available. However, the presence of CO2 cannot be ignored and,thus, there always exists the probability of parallel reactions[26,27,29–31]. Based on a comparative analysis of existing data
for coal combustion and on the constitution and granulometry ofparticles (average char diameter ≪100 μm), the selected modelfor these particles was that of the kinetic/limited diffusion rate.This is similar to that of shrinking-reactant particle core adopted inthe general theory of surface heterogeneous chemical reaction.The diffusion coefficientDim of oxidant in the porous char used inthe present model was 5.0e–05 m2/s.
2.8.2. Calcination mechanismsThe calcination of limestone particles includes several stages,
with each one imposing different chemical kinetics rates: a) Heattransfer from the gases to the particle surface and from it to thereaction interface, b) thermal decomposition of CaCO3 in thereaction interface, c) mass flux of CO2 from the reaction in-terface to the gases.
For small limestone particles moving in high temperaturesgases, the internal and external heat and mass transfer rates arehigh. Specifically, for particles with diameter between 1 and90 μm and gas temperatures between 748 and 1273 K, Borgwardt[39] has reported that the calcination is chemically controlled andits rate is proportional to the surface area of the particle asdetermined by the BET method (nitrogen absorption at 77 K).Because, the limestone microstructure is not completely crystalicand has a diverse form of porosity, the surface determined by theBET method, is the sum of the porous surfaces accessed bynitrogen. Under these conditions, the calcination happens on thetotal available surface, giving pseudo-volumetric characteristicsto the reaction.
From the analysis of calcination data of high finenesslimestone in isothermal reactors, it is concluded that, for a betterdescription of the reaction evolution, the model of shrinking coreshould be selected, with the size diameter raised to the power 0.6.The value of the exponent (b1) is explained by the fact that thecalcination proceeds radially to the particle core, withoutinhomogeneities in the reaction interface. When the raw-mixparticles are small, the reaction interface of the calcination is noteasy to determine. The internal thermal gradients and the partialpressure of CO2 are also difficult to estimate. For these reasons,most calcination models of high fineness particles consider thatthe surface temperature is equal to the gas temperature,neglecting the internal thermal gradients [40].
The decomposition reaction of CaCO3 is strongly endother-mic. Its thermodynamic state is defined by the reaction enthalpyΔH and the equilibrium pressure PCO2,eq,:
PCO2;eq ¼ exp −ΔHRT
þΔSR
� �ð26Þ
These values depend on temperature and are influenced by thenature of limestone, its degree of cleanliness and mainly by itsstructural mesh. The lower the degree of cleanliness of rawmaterial, the lower is the reaction enthalpy. Also, the function oftemperature–equilibrium pressure PCO2,eq= f(T) develops tolower temperatures because of the chemical kinetics of therecently formed CaO and the impurities in the reactionenvironment. The values of reaction enthalpies provided by theopen literature [40–46] for the present endothermic reactions
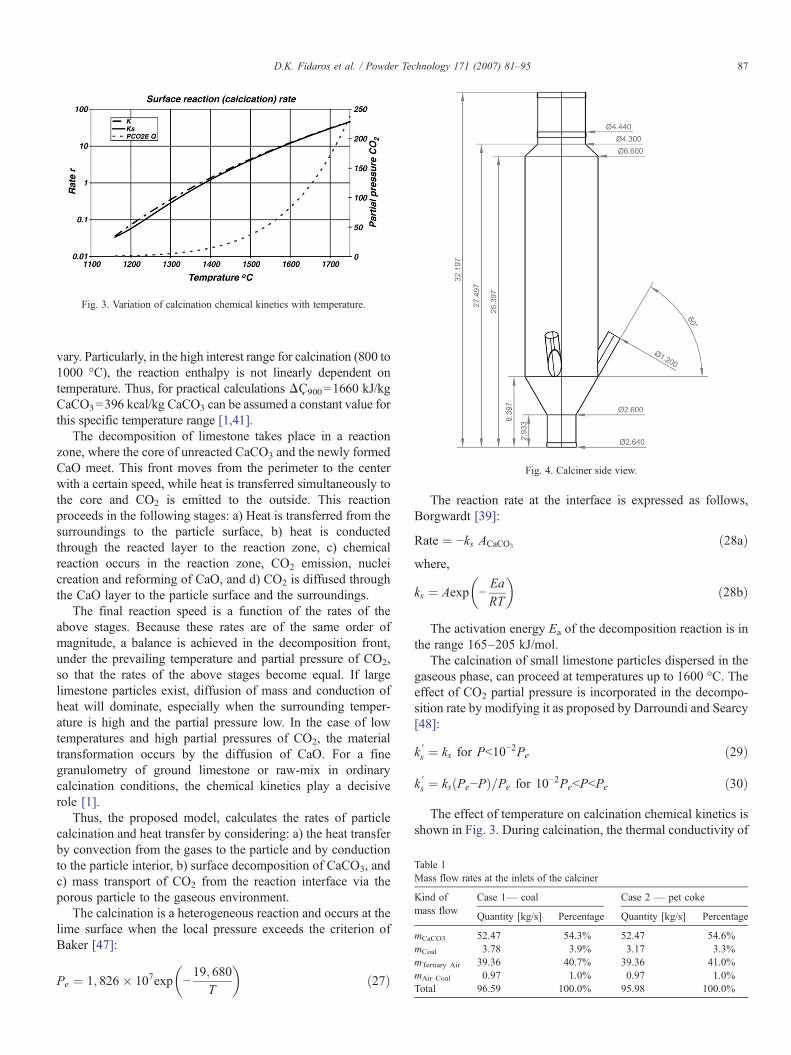
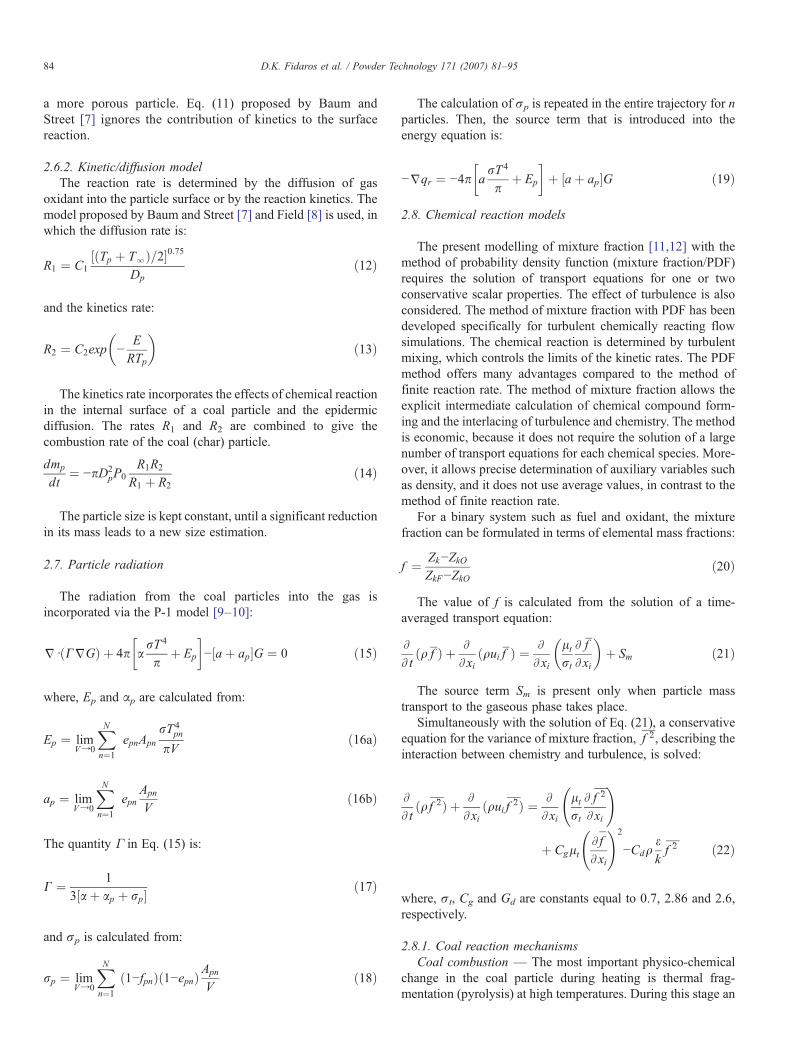
Fig. 3. Variation of calcination chemical kinetics with temperature.
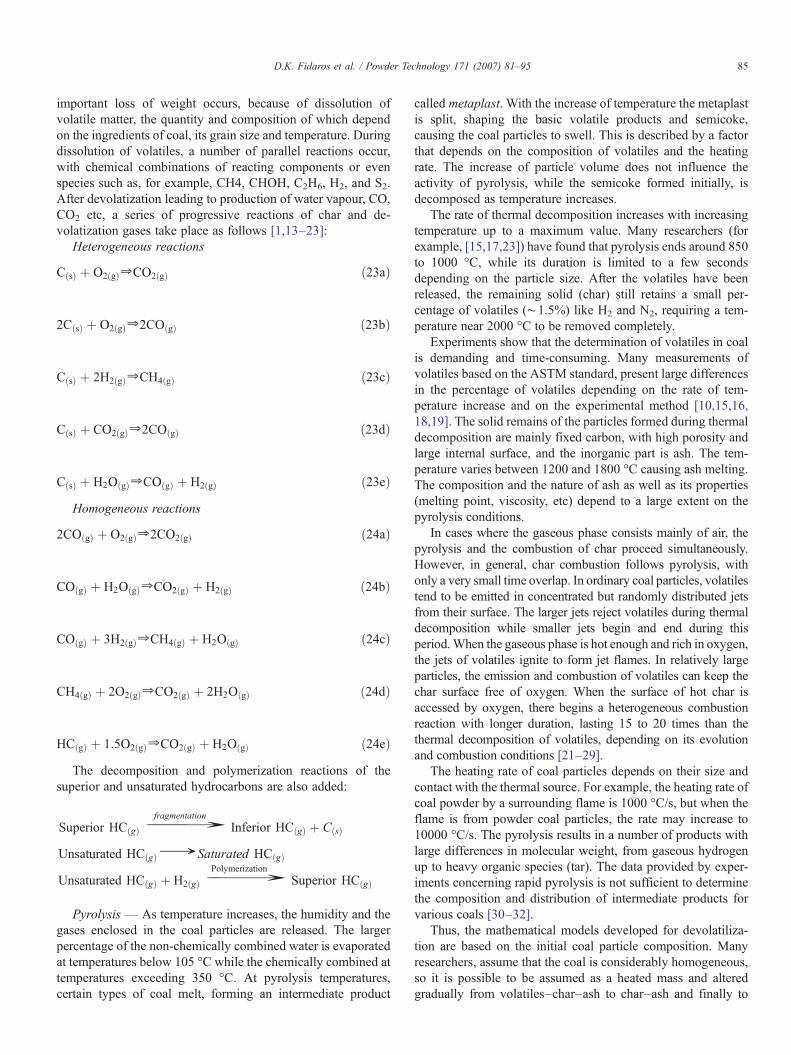
Fig. 4. Calciner side view.
Table 1Mass flow rates at the inlets of the calciner
Kind ofmass flow
Case 1— coal Case 2 — pet coke
Quantity [kg/s] Percentage Quantity [kg/s] Percentage
mCaCO3 52.47 54.3% 52.47 54.6%mCoal 3.78 3.9% 3.17 3.3%mTertiary Air 39.36 40.7% 39.36 41.0%mAir Coal 0.97 1.0% 0.97 1.0%Total 96.59 100.0% 95.98 100.0%
87D.K. Fidaros et al. / Powder Technology 171 (2007) 81–95
vary. Particularly, in the high interest range for calcination (800 to1000 °C), the reaction enthalpy is not linearly dependent ontemperature. Thus, for practical calculations ΔÇ900=1660 kJ/kgCaCO3=396 kcal/kg CaCO3 can be assumed a constant value forthis specific temperature range [1,41].
The decomposition of limestone takes place in a reactionzone, where the core of unreacted CaCO3 and the newly formedCaO meet. This front moves from the perimeter to the centerwith a certain speed, while heat is transferred simultaneously tothe core and CO2 is emitted to the outside. This reactionproceeds in the following stages: a) Heat is transferred from thesurroundings to the particle surface, b) heat is conductedthrough the reacted layer to the reaction zone, c) chemicalreaction occurs in the reaction zone, CO2 emission, nucleicreation and reforming of CaO, and d) CO2 is diffused throughthe CaO layer to the particle surface and the surroundings.
The final reaction speed is a function of the rates of theabove stages. Because these rates are of the same order ofmagnitude, a balance is achieved in the decomposition front,under the prevailing temperature and partial pressure of CO2,so that the rates of the above stages become equal. If largelimestone particles exist, diffusion of mass and conduction ofheat will dominate, especially when the surrounding temper-ature is high and the partial pressure low. In the case of lowtemperatures and high partial pressures of CO2, the materialtransformation occurs by the diffusion of CaO. For a finegranulometry of ground limestone or raw-mix in ordinarycalcination conditions, the chemical kinetics play a decisiverole [1].
Thus, the proposed model, calculates the rates of particlecalcination and heat transfer by considering: a) the heat transferby convection from the gases to the particle and by conductionto the particle interior, b) surface decomposition of CaCO3, andc) mass transport of CO2 from the reaction interface via theporous particle to the gaseous environment.
The calcination is a heterogeneous reaction and occurs at thelime surface when the local pressure exceeds the criterion ofBaker [47]:
Pe ¼ 1; 826� 107exp −19; 680
T
� �ð27Þ
The reaction rate at the interface is expressed as follows,Borgwardt [39]:
Rate ¼ −ks ACaCO3 ð28aÞwhere,
ks ¼ Aexp −EaRT
� �ð28bÞ
The activation energy Ea of the decomposition reaction is inthe range 165–205 kJ/mol.
The calcination of small limestone particles dispersed in thegaseous phase, can proceed at temperatures up to 1600 °C. Theeffect of CO2 partial pressure is incorporated in the decompo-sition rate by modifying it as proposed by Darroundi and Searcy[48]:
k Vs ¼ ks for Pb10
−2Pe ð29Þ
k Vs ¼ ksðPe−PÞ=Pe for 10
−2PebPbPe ð30Þ
The effect of temperature on calcination chemical kinetics isshown in Fig. 3. During calcination, the thermal conductivity of

Table 2Ultimate analysis for the solid feeds
Components Case 1— coal Case 2 — pet coke
As used (%) Dry basis (%) As used (%) Dry basis (%)
Humidity 1.45 0.0 1.45 0.0Volatiles 27.70 28.11 13.21 13.40Ash 12.05 12.23 0.14 0.14Fix carbon 55.80 56.62 81.70 82.90Total 97.00 96.96 96.50 96.44
88 D.K. Fidaros et al. / Powder Technology 171 (2007) 81–95
lime depends on the state of the solid material and differs con-siderably for non-calcinated, partially calcinated or fullycalcinated particles. This is mainly due to the different structure,but also to the change of the specific surface area. In the reactionregion, the thermal conductivity of the particle is a linearfunction of specific surface area and temperature. Thus, thethermal conductivity of CaCO3 was 1.646W/(m.K) and of CaO0.860 W/(m.K). The mass fraction of CO2 is determined from adiffusion equation assuming a spherical particle.
3. Computational details
3.1. Calciner geometry
The modeled calciner, Fig. 4, consists of a cylindrical and aconical section having three kinds of inlets at the bottom partand an outlet at the top, from where the products such ascalcined raw-mix, CO2, and other gases exit. Raw-mix is fedinto the calciner via two 0.6 m diameter pipes inclined at 60°to the horizontal. The tertiary air enters axially from the bottomvia a concentric 2.6 m diameter duct and the coal is fed at thelower conical part via two 0.2 m pipes at 30° to the horizontal.
Fig. 5. Velocity distribution in vertical symmetr
The physico-chemical processes take place in the main volumeof the calciner, consisting of a 6.6 m diameter cylinder with20 m height. The upper conical part has 1.1 m height and leadsto a cylindrical part with 4.3 m diameter and 5 m height. Thetotal calciner volume is 850 m3. The coal entries are at 2.4 mheight from the start of the cone and at 2.68 m from thecalciner axis.
The computational domain consists of a hybrid mesh of67.104 cells. Because of symmetry, the calculations were carriedout for one half of the calciner using the FLUENT code. Twofuels (coal and pet coke) were considered and the total rate ofmass (raw-mix, coal and air) fed into the three kinds of inlets wasaproximately 100 kg/s. As shown in Table 1, the larger per-centage of mass rate is that of CaCO3, followed by tertiary air,coal and finally the coal feeding air.
The Rossin–Rammler distribution of the raw-mix size hadan average value of d=16.6 μm and a spread parameter ofn=0.822, while the coal had d=34.5 μm and n=1.248. Theanalysis of the raw meal and coal particles is given in Table 2.The tertiary air entered with a velocity 24 m/s, coal with 11.5 m/sand the raw-mix with 1.5 m/s. The coal was fed pneumaticallywhile the raw-mix entered by gravity.
All the geometric data and the initial and boundary conditionswere supplied by Olympus plant of AGET Hercules in Volos,Greece.
4. Results and discussion
4.1. Case 1 (Good quality coal)
Fig. 5 shows the calculated velocity distribution of the gaseousphase for Case 1 (good quality coal) in two vertical diametral
y plane (left) and at 90° (right) for Case 1.
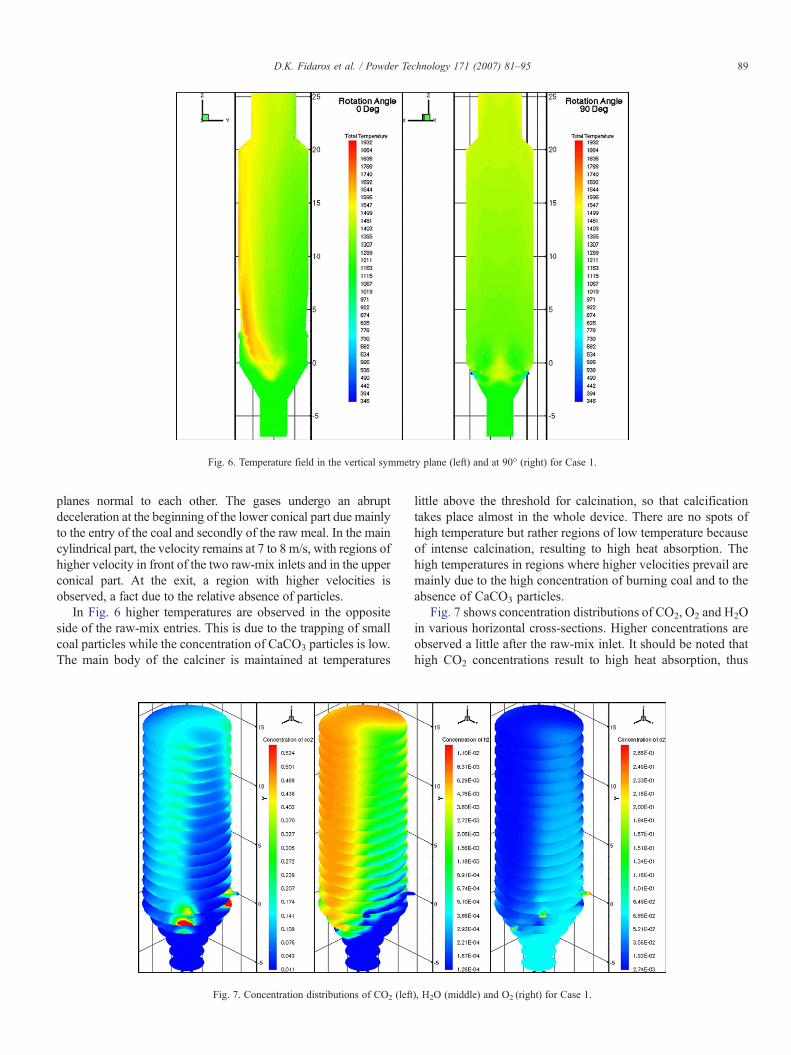
Fig. 6. Temperature field in the vertical symmetry plane (left) and at 90° (right) for Case 1.
89D.K. Fidaros et al. / Powder Technology 171 (2007) 81–95
planes normal to each other. The gases undergo an abruptdeceleration at the beginning of the lower conical part due mainlyto the entry of the coal and secondly of the raw meal. In the maincylindrical part, the velocity remains at 7 to 8 m/s, with regions ofhigher velocity in front of the two raw-mix inlets and in the upperconical part. At the exit, a region with higher velocities isobserved, a fact due to the relative absence of particles.
In Fig. 6 higher temperatures are observed in the oppositeside of the raw-mix entries. This is due to the trapping of smallcoal particles while the concentration of CaCO3 particles is low.The main body of the calciner is maintained at temperatures
Fig. 7. Concentration distributions of CO2 (left
little above the threshold for calcination, so that calcificationtakes place almost in the whole device. There are no spots ofhigh temperature but rather regions of low temperature becauseof intense calcination, resulting to high heat absorption. Thehigh temperatures in regions where higher velocities prevail aremainly due to the high concentration of burning coal and to theabsence of CaCO3 particles.
Fig. 7 shows concentration distributions of CO2, O2 and H2Oin various horizontal cross-sections. Higher concentrations areobserved a little after the raw-mix inlet. It should be noted thathigh CO2 concentrations result to high heat absorption, thus
), H2O (middle) and O2 (right) for Case 1.
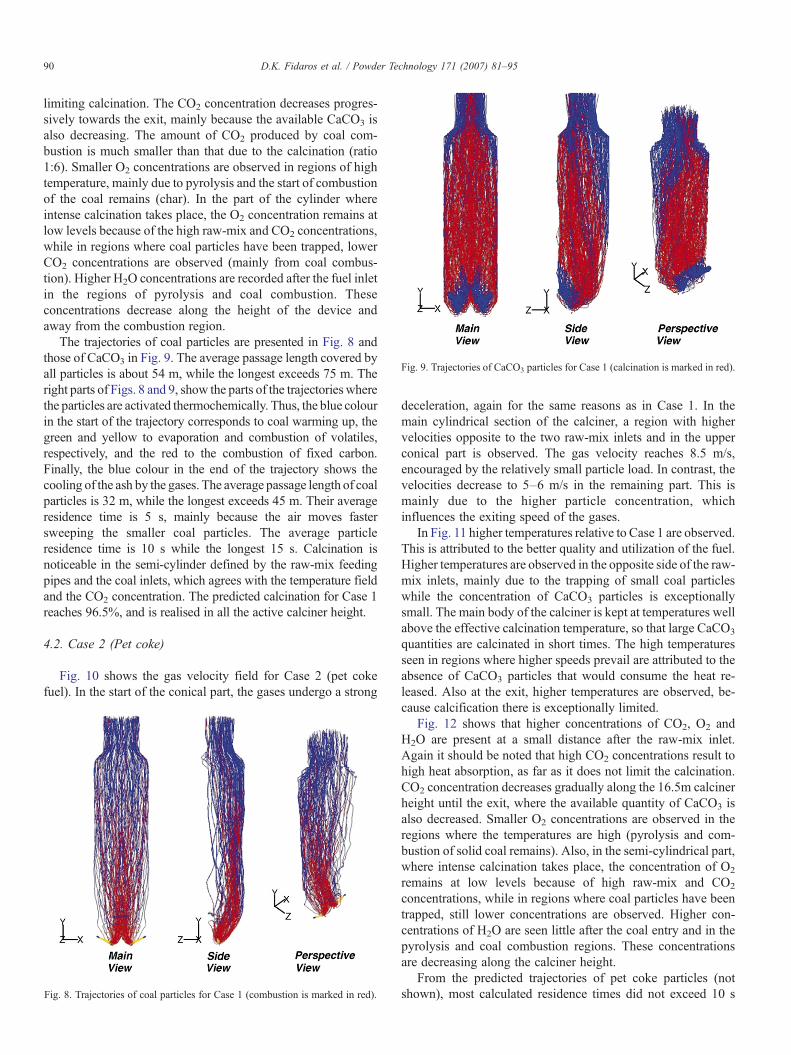
Fig. 9. Trajectories of CaCO3 particles for Case 1 (calcination is marked in red).
90 D.K. Fidaros et al. / Powder Technology 171 (2007) 81–95
limiting calcination. The CO2 concentration decreases progres-sively towards the exit, mainly because the available CaCO3 isalso decreasing. The amount of CO2 produced by coal com-bustion is much smaller than that due to the calcination (ratio1:6). Smaller O2 concentrations are observed in regions of hightemperature, mainly due to pyrolysis and the start of combustionof the coal remains (char). In the part of the cylinder whereintense calcination takes place, the O2 concentration remains atlow levels because of the high raw-mix and CO2 concentrations,while in regions where coal particles have been trapped, lowerCO2 concentrations are observed (mainly from coal combus-tion). Higher H2O concentrations are recorded after the fuel inletin the regions of pyrolysis and coal combustion. Theseconcentrations decrease along the height of the device andaway from the combustion region.
The trajectories of coal particles are presented in Fig. 8 andthose of CaCO3 in Fig. 9. The average passage length covered byall particles is about 54 m, while the longest exceeds 75 m. Theright parts of Figs. 8 and 9, show the parts of the trajectories wherethe particles are activated thermochemically. Thus, the blue colourin the start of the trajectory corresponds to coal warming up, thegreen and yellow to evaporation and combustion of volatiles,respectively, and the red to the combustion of fixed carbon.Finally, the blue colour in the end of the trajectory shows thecooling of the ash by the gases. The average passage length of coalparticles is 32 m, while the longest exceeds 45 m. Their averageresidence time is 5 s, mainly because the air moves fastersweeping the smaller coal particles. The average particleresidence time is 10 s while the longest 15 s. Calcination isnoticeable in the semi-cylinder defined by the raw-mix feedingpipes and the coal inlets, which agrees with the temperature fieldand the CO2 concentration. The predicted calcination for Case 1reaches 96.5%, and is realised in all the active calciner height.
4.2. Case 2 (Pet coke)
Fig. 10 shows the gas velocity field for Case 2 (pet cokefuel). In the start of the conical part, the gases undergo a strong
Fig. 8. Trajectories of coal particles for Case 1 (combustion is marked in red).
deceleration, again for the same reasons as in Case 1. In themain cylindrical section of the calciner, a region with highervelocities opposite to the two raw-mix inlets and in the upperconical part is observed. The gas velocity reaches 8.5 m/s,encouraged by the relatively small particle load. In contrast, thevelocities decrease to 5–6 m/s in the remaining part. This ismainly due to the higher particle concentration, whichinfluences the exiting speed of the gases.
In Fig. 11 higher temperatures relative to Case 1 are observed.This is attributed to the better quality and utilization of the fuel.Higher temperatures are observed in the opposite side of the raw-mix inlets, mainly due to the trapping of small coal particleswhile the concentration of CaCO3 particles is exceptionallysmall. The main body of the calciner is kept at temperatures wellabove the effective calcination temperature, so that large CaCO3
quantities are calcinated in short times. The high temperaturesseen in regions where higher speeds prevail are attributed to theabsence of CaCO3 particles that would consume the heat re-leased. Also at the exit, higher temperatures are observed, be-cause calcification there is exceptionally limited.
Fig. 12 shows that higher concentrations of CO2, O2 andH2O are present at a small distance after the raw-mix inlet.Again it should be noted that high CO2 concentrations result tohigh heat absorption, as far as it does not limit the calcination.CO2 concentration decreases gradually along the 16.5m calcinerheight until the exit, where the available quantity of CaCO3 isalso decreased. Smaller O2 concentrations are observed in theregions where the temperatures are high (pyrolysis and com-bustion of solid coal remains). Also, in the semi-cylindrical part,where intense calcination takes place, the concentration of O2
remains at low levels because of high raw-mix and CO2
concentrations, while in regions where coal particles have beentrapped, still lower concentrations are observed. Higher con-centrations of H2O are seen little after the coal entry and in thepyrolysis and coal combustion regions. These concentrationsare decreasing along the calciner height.
From the predicted trajectories of pet coke particles (notshown), most calculated residence times did not exceed 10 s
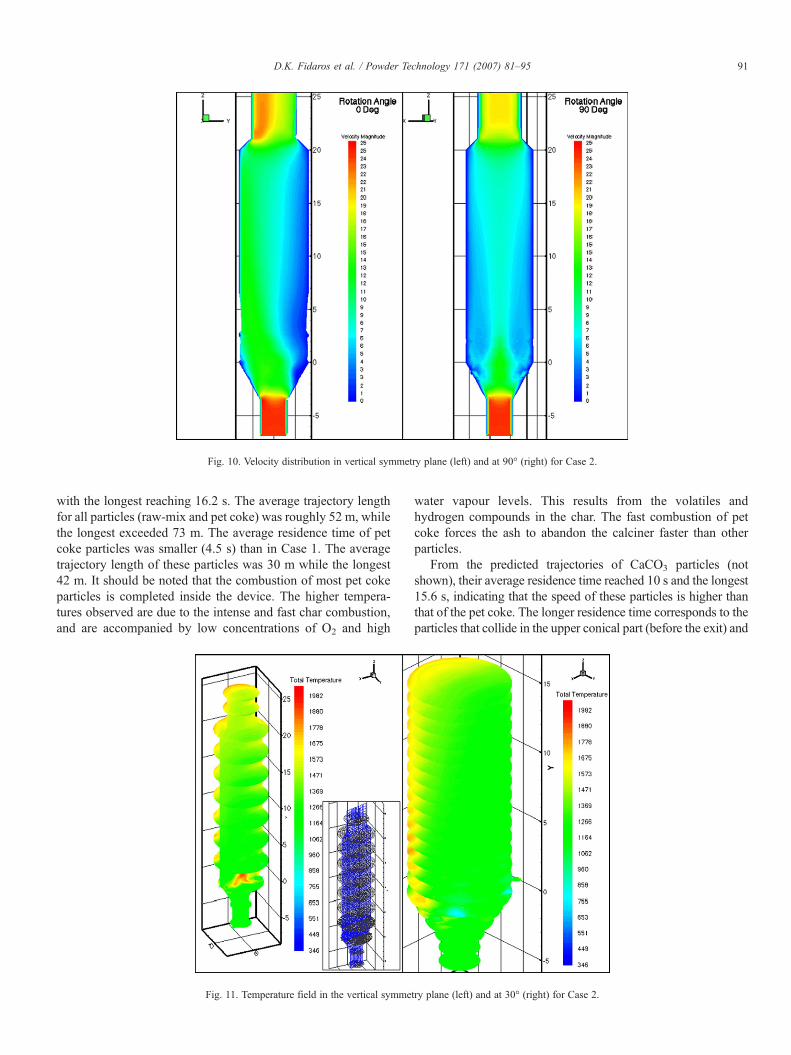
Fig. 10. Velocity distribution in vertical symmetry plane (left) and at 90° (right) for Case 2.
91D.K. Fidaros et al. / Powder Technology 171 (2007) 81–95
with the longest reaching 16.2 s. The average trajectory lengthfor all particles (raw-mix and pet coke) was roughly 52 m, whilethe longest exceeded 73 m. The average residence time of petcoke particles was smaller (4.5 s) than in Case 1. The averagetrajectory length of these particles was 30 m while the longest42 m. It should be noted that the combustion of most pet cokeparticles is completed inside the device. The higher tempera-tures observed are due to the intense and fast char combustion,and are accompanied by low concentrations of O2 and high
Fig. 11. Temperature field in the vertical symme
water vapour levels. This results from the volatiles andhydrogen compounds in the char. The fast combustion of petcoke forces the ash to abandon the calciner faster than otherparticles.
From the predicted trajectories of CaCO3 particles (notshown), their average residence time reached 10 s and the longest15.6 s, indicating that the speed of these particles is higher thanthat of the pet coke. The longer residence time corresponds to theparticles that collide in the upper conical part (before the exit) and
try plane (left) and at 30° (right) for Case 2.
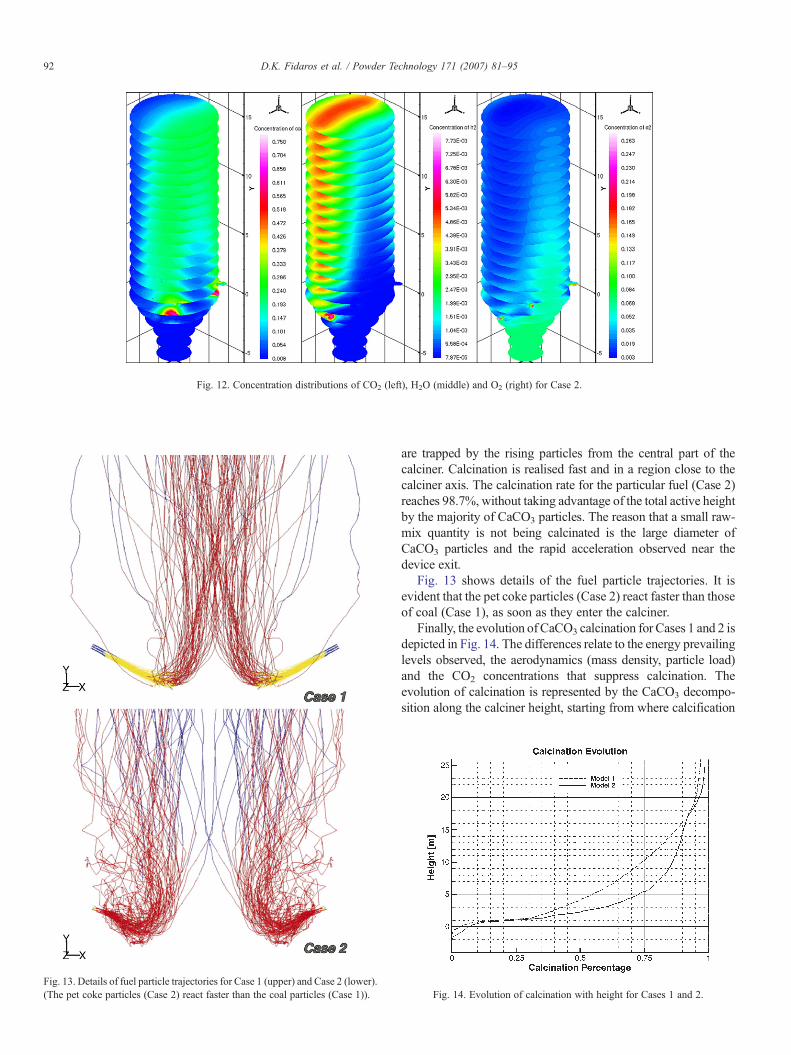
Fig. 12. Concentration distributions of CO2 (left), H2O (middle) and O2 (right) for Case 2.
Fig. 13. Details of fuel particle trajectories for Case 1 (upper) and Case 2 (lower).(The pet coke particles (Case 2) react faster than the coal particles (Case 1)).
92 D.K. Fidaros et al. / Powder Technology 171 (2007) 81–95
are trapped by the rising particles from the central part of thecalciner. Calcination is realised fast and in a region close to thecalciner axis. The calcination rate for the particular fuel (Case 2)reaches 98.7%, without taking advantage of the total active heightby the majority of CaCO3 particles. The reason that a small raw-mix quantity is not being calcinated is the large diameter ofCaCO3 particles and the rapid acceleration observed near thedevice exit.
Fig. 13 shows details of the fuel particle trajectories. It isevident that the pet coke particles (Case 2) react faster than thoseof coal (Case 1), as soon as they enter the calciner.
Finally, the evolution of CaCO3 calcination for Cases 1 and 2 isdepicted in Fig. 14. The differences relate to the energy prevailinglevels observed, the aerodynamics (mass density, particle load)and the CO2 concentrations that suppress calcination. Theevolution of calcination is represented by the CaCO3 decompo-sition along the calciner height, starting from where calcification
Fig. 14. Evolution of calcination with height for Cases 1 and 2.

93D.K. Fidaros et al. / Powder Technology 171 (2007) 81–95
is initiated until the device exit. The active calcination height forCase 1 is approximately 27.5 m. An amount of 50% of CaCO3 iscalcinated in the first 6 m, while the calcification rate is stabilizedto lower values for the next 16 m and is reduced in the last part,where gas acceleration is also observed.
The active calcination height for Case 2 is also 27.5 m withdifferences observed mainly in the evolution of the calcification.An amount of 70% of CaCO3 is calcinated in the first 7.5 m,while the calcination rate gradually decreases with height. In thelast 5 m, the calcination rate decreases further, due mainly to theincreasing gas speed, despite the fact that the temperature is wellabove the calcination threshold. Fig. 14 shows also thesuppressive role of increased CO2 concentration, which is ofgreat importance for the performance of the calciner. In theregion defined by the lower conical part and the raw-mix inlets,the temperature should be maintained at a specific range in orderto avoid locally high CaCO3 production. This is related to theCO2 partial pressure that constitutes the basic controllingparameter of calcification.
Although there are no detailed measurements to comparewith the present numerical results, it should be noted that themodel is capable to predict the range of gas temperatures (850–900 °C) and the asymmetric distribution of the particles (coaland raw-mix) in the exit of the calciner, as observed in theOlympus cement plant. In Case 1 (coal fuel), the velocities atthe exit of the calciner are in the same range as those measured(17–21 m/s) with higher values observed in regions of highertemperatures. There were no data available to compare thenumerical results for Case 2 (pet coke fuel).
5. Conclusions
A numerical model was presented for the prediction of thevelocity, temperature and concentration fields of gases and ofparticle trajectories in an industrial low NOx calciner for cementproduction. Models were also included for radiation, chemicalreactions and turbulence effects. From the results of the param-etric study the following main conclusions can be drawn:
The small recirculation region observed near the raw-mix andtertiary air inlets, increases the active length of the device and theparticle residence time. The rapid calcination near the raw-mix inletproduces high local CO2 concentrations, which limits calcination.
Higher temperatures are observed near the coal inlet wherecombustion of volatiles occurs. The high temperature regionsobserved along the calciner are due to coal particles with orbitsthat are not intermingled with the raw-mix, suggesting that moreattention should be paid to its granulometry than to that of coal.
The high unevenness of the Rossin–Rammler particle dis-tribution used is mainly responsible for the small percentage ofthe non-calcinated CaCO3. Despite the energy surplus observed(more in Case 2 than Case 1) calcination could not be completedbecause of the high CO2 concentration released immediatelyafter the entry.
The upper conical part of the calciner causes an accelerationof the gases and particles, which reduces calcination. Theresulting high temperatures can cause problems of thermalstresses, and can lead to erosive by-products from SiO2
chemical activation and NOx formation. Small recirculationsare also formed and act as a bumper wall for the particles,resulting to local high temperatures and erosion of the walls.
Finally, the model was capable to predict the range of velo-cities and gas temperatures and the asymmetric distributions inthe calciner exit, as observed in the Olympus cement plant ofAGET Hercules.
NomenclatureA pre-exponential factorApn area of projection of n-particleAp area of projection of a particleACaCO3 CaCO3 concentrationa1, a2 devolatilization coefficients or evaporation factorsCD drag coefficientC1,2 constantsDp particle diameterD0 size constantDim diffusion coefficient of the oxidantd diameterD̄ mean diameterE, Ea activation energyEp equivalent particle brightnessepn brightness of the nth particleFD coefficient for drag force termfi additional forcefpn scattering factor of nth particlef mixture fractionG incident radiationgi gravitational accelerationhfg evaporation latent heath thermal convection coefficientk thermal conductivitykS surface reaction rateMD mass fraction of particles with diameter larger than Dmv(t) sum of volatiles evaporated up to time tmpo initial particle massmash mass of ash in the particlemo local fraction of gas oxidantmp particle massN total number of particles in a volume Vn size distribution parameterP pressurePe local pressureP0 partial pressure of oxidant in the gas environment of
particlePCO2,eq equilibrium partial CO2 pressureqr radiation fluxR universal gas constantRe Reynolds numberR1 surface reaction rateR2 surface devolatilization rateSb stoichiometric coefficient of the reactionSm source termT temperatureTp particle temperatureTpn temperature of n-particle

94 D.K. Fidaros et al. / Powder Technology 171 (2007) 81–95
t timeU gas velocityUp particle velocityU,V,W time-averaged axial, radial and circumferential
velocitieszk mass fraction for the chemical element kzKF mass fraction for fuel streamzKO mass fraction for the oxidizer streamΔS change of grammolecular entropyΔH reaction enthalpy
Greek lettersα absorption gas factorαp equivalent absorption factorΓΦ transport coefficientεp particle brightnessΘR particle temperature produced by the intensity of
thermal radiationμ gas molecular viscosityμt turbulent viscosityρp particle mass densityρg gas densityσ Boltzmann's constantσp particle scattering equivalent factorΦ time-averaged transported fluid property
Acknowledgements
This work was partially supported by the General Secretariatfor Research and Technology of Greece and the cementcompany AGET Hercules (EPET-II/96SYN121). The authorswish to thank Dr. I. Marinos and Mr. T. Pissias of AGET for thedata and for useful discussions.
References
[1] E. Kolyfetis, C.G. Vagenas, Mathematical modeling of separate lineprecalciner, ZKG International 2 (1988) 559–563.
[2] L. Huanpeng, L. Wentie, Z. Jianxiang, J. Ding, Z. Xiujian, L. Huilin,Numerical study of gas–solid flow in a precalciner using kinetic theory ofgranular flow, Chemical Engineering Journal 102 (2004) 151–160.
[3] Z. Hu, J. Lu, L. Huang, S. Wang, Numerical simulation study on gas–solidtwo-phase flow in pre-calciner, Communications in Nonlinear Science &Numerical Simulation 11 (3) (2006) 440–451.
[4] I. Iliuta, K. Dam-Johansen, A. Jensen, L.S. Jensen, Modelling of in-line-low-NOx calciners — a parametric study, Chemical Engineering Science57 (2002) 789–903.
[5] S.A. Morsi, A.J. Alexander, An investigation of particle trajectories in two-phase flow systems, Journal of Fluid Mechanics 55 (1972) 193–208.
[6] H. Kobayashi, J.B. Howard, A.F. Sarofim, Coal devolatilization at hightemperatures, Proc. 16th Intl Symposium on Combustion, The CombustionInstitute, 1976, pp. 411–425.
[7] M.M. Baum, P.J. Street, Predicting the combustion behavior of coal particles,Combustion Science and Technology 3 (1971) 231–243.
[8] M.A. Field, Rate of combustion of size-graded fractions of char from alow rank coal between 1200K–2000K, Combustion and Flame 13 (1969)237–252.
[9] S.S. Sazhin, E.M. Sazhina, O. Faltsi-Saravelou, P. Wild, The P-1 model forthermal radiation transfer advantages and limitations, Fuel 75 (3) (1996)289–294.
[10] M.Q. Brewster, T. Kunitomo, The optical constants of coal, char andlimestone, ASME Journal of Heat Transfer 106 (1984) 678–683.
[11] Y.R. Shivatahnu, G.M. Faeth, Generalized state relationships for scalarproperties in non-premixed hydrocarbon/air flames, Combustion andFlame 82 (1990) 211–230.
[12] W.P. Jones, J.H. Whitelaw, Calculations methods for reacting turbulentflows: a review, Combustion and Flame 48 (1982) 1–26.
[13] R.A. Srinivasan, S. Sriramulu, S. Kulasekaran, P.K. Agarwal, Mathemat-ical modeling of fluidized bed combustion— 2: combustion of gases, Fuel77 (1998) 1033–1049.
[14] R.L. Backreedy, R. Habib, J.M. Jones, M. Pourkashanian, A. Williams, Anextended coal combustion model, Fuel 78 (1999) 1745–1754.
[15] F. Winter, M.E. Prah, H. Hofbauer, Temperatures in a fuel particle burningin a fluidized bed: the effect of drying, devolatilitazion and charcombustion, Combustion and Flame 108 (1997) 302–314.
[16] A.S Hull, P.K. Agarwal, Estimation of kinetic rate parameters for coalcombustion from measurements of the ignition temperature, Fuel 77 (1998)1051–1058.
[17] L.D. Smoot, International research center's activities in coal combustion,Progress in Energy and Combustion Science 24 (1998) 409–501.
[18] L. Huilin, Z. Guangbo, C. Rushan, C. Yongjin, D. Gidaspow, A coalcombustion model for fluidized bed boilers, Fuel 79 (2000) 165–172.
[19] L. Huilin, Z. Gungbo, B. Rushan, Y. Lidan, Q. Yukun, Modeling of coalcombustion in a 25-MW FBC power plant, Energy 24 (1999) 199–208.
[20] H.H. Liakos, K.N. Theologos, A.G. Boudouvis, N.C. Markatos, Pulverizedcoal char combustion: the effect of particle size on burner performance,Applied Thermal Engineering 18 (1998) 981–989.
[21] W. Sujanti, D. Zhang, A laboratory study of spontaneous combustion ofcoal: the influence of inorganic matter and reactor size, Fuel 78 (1999)549–556.
[22] C.N. Eastwick, S.J. Pickering, A. Aroussi, Comparisons of two com-mercial computational fluid dynamics codes in modeling pulverized coalcombustion for a 2,5 MW burner, Applied Mathematical Modeling 23(1999) 437–446.
[23] L. Armesto, J.L. Merino, Characterization of some coal combustion solidresidues, Fuel 78 (1999) 613–618.
[24] M.S. Khan, S.M. Zubair, M.O. Budair, A.K. Sheikh, A. Quddus, Foulingresistance model for prediction of CaCO3 scaling in AISI 316 tubes,International Journal of Heat and Mass Transfer 32 (1996) 73–79.
[25] J.R. Fan, X.H. Liang, Q.S. Xu, X.Y. Zhang, K.F. Cen, Numerical simulationof the flow and combustion processes in a three-dimensional, W-shapedboiler furnace, Energy 22 (1997) 847–857.
[26] J.K. Fink, Pyrolysis and combustion of polymer wastes in combination withmetallurgical processes and the cement industry, Analytical and AppliedPyrolysis 51 (1999) 239–252.
[27] P. Basu, Combustion of coal in circulating fluidized-bed boilers: a review,Chemical Engineering Science 54 (1999) 5547–5557.
[28] F.C. Lockwood, T. Mahmud, M.A. Yehia, Simulation of pulverized coal testfurnace performance, Fuel 77 (1998) 1329–1337.
[29] R.G. Bautista-Margulis, R.G. Siddall, L.Y. Manzanares-Papayanopoulos,Combustion modeling of coal volatiles in the freeboard of a calorimetricbed combustor, Fuel 75 (1996) 1737–1742.
[30] C.A. Gurgel, J. Saastamoinen, J.A. Carvalho, M. Aho, Overlapping of thedevolatilization and char combustion stages in the burning of the coal par-ticles, Combustion and Flame 116 (1999) 567–579.
[31] W.B. Fu, B.L. Zhang, S.M. Zheng, A relationship between the kineticparameters of char combustion and the coal's properties, Combustion andFlame 109 (1997) 587–598.
[32] T. Gentzis, F. Goodarzi, C.N. Koykoyzas, A.E. Foscolos, Petrology,mineralogy and geochemistry of lignites from Crete, Greece, Coal Geology30 (1996) 131–150.
[33] J. Zhang, S. Nieh, Comprehensive modeling of pulverized coal combustionin a vortex combustor, Fuel 76 (1997) 123–131.
[34] L. Reh, Challenges of circulating fluid-bed reactors in energy and rawmaterials industries, Chemical Engineering Science 54 (1999) 5359–5368.
[35] H. Wang, J.N. Harb, Modeling of ash deposition in large-scale combustionfacilities burning pulverized coal, Progress in Energy and CombustionScience 23 (1997) 267–282.

95D.K. Fidaros et al. / Powder Technology 171 (2007) 81–95
[36] I.E. Sarris, O. Giannopoulos, D. Fidaros, N.S. Vlachos, Modelling coalcombustion in a rotary cement kiln, 3rd National Congress on ComputationalMechanics, Volos 24–26 (June 1999) 665–672.
[37] R.H. Essenhigh, in: M.A. Elliot (Ed.), Chemistry of coal utilization, SecondSupplementary Volume, Wiley, New York, 1981, pp. 1153–1178.
[38] G. Borghi, A.F. Sarofim, J.M. Beer, 70thAIChEAnnualMeeting, NewYork,vol. 34c, Nov. 1977, pp. 14–17.
[39] R.H. Borgwardt, Calcination kinetics and surface area of dispersed limestoneparticles, AIChE Journal 31 (1) (1985) 103–111.
[40] F. Acke, I. Panay, Activation energy of calcination by means of a temperatureprogrammed reaction technique, Thermochimica Acta 300 (1997) 73–76.
[41] V.L. Boris, Mechanism of thermal decomposition of alkaline-earthcarbonates, Thermochimica Acta 303 (1997) 161–170.
[42] A.K. Galwey, M.E. Brown, Arrhenius parameters and compensationbehavior in solid-state decompositions, Thermochimica Acta 300 (1997)107–115.
[43] F. Acke, I. Panas, Activation energy of calcination by means of a temperatureprogrammed reaction technique, Thermochimica Acta 306 (1997) 73–76.
[44] J. Khinast, G.F. Krammer, C. Brunner, G. Staudinger, Decomposition oflimestone: the influence of CO2 particle size on the reaction rate, ChemicalEngineering Science 51 (1996) 623–634.
[45] N. Hu, A.W. Scaroni, Calcination of pulverized limestone particles underfurnace injection conditions, Fuel 75 (1996) 177–186.
[46] S.V. Krishnan, S.V. Sotirchos, Effective diffusivitty changes duringcalcination, carbonation, recalcination and sulfation of limestones,Chemical Engineering Science 49 (1991) 1195–1208.
[47] E.H. Baker, Calcium oxide-carbon dioxide system in the pressure range1–300 atmospheres, Journal of Chemical Society (London) (1962) 464–470.
[48] T.Darroudi, A.W. Searcy, Effect of CO2 pressure on the rate of decompositionof calcite, Journal of Physical Chemistry 85 (26) (1981) 3971–3974.