numerical simulation of shear wall in concrack … · figure 5 geometry of test specimen, side...
TRANSCRIPT

NUMERICAL SIMULATION OF SHEAR
VLADIMIR CERVENKA
Cervenka Consulting, Na Hrebenkach 55, 1500 Praha 5, Czech Republice-mail:
Key words: Nonlinear finite element analysis
Abstract: The paper presents results of numerical simulation of shear wall test made within the CONCRACK bench mark project organized by French Monotonic load test is simulated by computer codtests as well as follow-up analysis
1 INTRODUCTION
The CONCRACK bench mark by French research project CEOS was devoted to cracking phenomenon in reinforced concrete structures. Several real scale specimens were produced and tested to failure, whereas a detail measurements of load, deformations and cracking were recordedAuthors participated in a predictionmark study of experimental behavior of shear wall under monotonic loadingmodels used by authors for simulationshear wall behavior were based on representations. The paper describes the models and results of analysis and aspects of model uncertainties involved in prediction and follow-up phases of resistance verification.
2 NUMERICAL MODELS
Numerical simulation was made by software ATENA developed by authors [1]. In following the material model as well as the finite element representation used in analysis are briefly described.
2.1 Material models
Concrete is simulated by ATENA’s fracture-plastic material model, which the cracking and compressive behavior in interaction. Here we mention
VIII International Conference on Fracture Mechanics of Concrete and Concrete Structures
Vladimir Cervenka, Jan Cervenka
1
SIMULATION OF SHEAR WALL IN CONCRACK BENCHMARK
VLADIMIR CERVENKA , JAN CERENKA
Cervenka Consulting, Na Hrebenkach 55, 1500 Praha 5, Czech Republicmail: [email protected]
Nonlinear finite element analysis, Cracking, Smeared crack model
The paper presents results of numerical simulation of shear wall test made within the CONCRACK bench mark project organized by French national research program CEOS.
test is simulated by computer code ATENA. Results of predictions performed prior s are shown.
The CONCRACK bench mark organized CEOS was devoted
to cracking phenomenon in reinforced Several real scale
specimens were produced and tested to failure, whereas a detail measurements of load, deformations and cracking were recorded.
prediction bench of experimental behavior of shear
wall under monotonic loading. Numerical simulation of the
based on 2D and 3D representations. The paper describes the
and aspects of in prediction and
of resistance verification.
Numerical simulation was made by software ATENA developed by authors [1]. In
wing the material model as well as the used in analysis
is simulated by ATENA’s plastic material model, which treats
the cracking and compressive behavior in mention briefly some
features of the constitutito presented analysis. More dfound in [2].
For crack propagation a crack band model based on fracture mechanics is used as illustrated in Figure 1, where band size. Crack band is further effect of crack orientation with respect to element [2].
Figure 1: Tensile softening
The compressive behavior is modeled by plasticity with yield function due to MenetreWillam shown in Figure
Figure 2: Yield function due to Menetre
International Conference on Fracture Mechanics of Concrete and Concrete Structures
FraMCoS-8 Vladimir Cervenka, Jan Cervenka
WALL IN CONCRACK
Cervenka Consulting, Na Hrebenkach 55, 1500 Praha 5, Czech Republic
Smeared crack model, Fracture
The paper presents results of numerical simulation of shear wall test made within the national research program CEOS.
e ATENA. Results of predictions performed prior
tive modeling relevant to presented analysis. More details can be
For crack propagation a crack band model based on fracture mechanics is used as
, where Lt is the crack Crack band is further modified for
effect of crack orientation with respect to finite
Tensile softening.
The compressive behavior is modeled by plasticity with yield function due to Menetre-
Figure 2.
: Yield function due to Menetre-Willam..
Vladimir Cervenka, Jan Cervenka
2
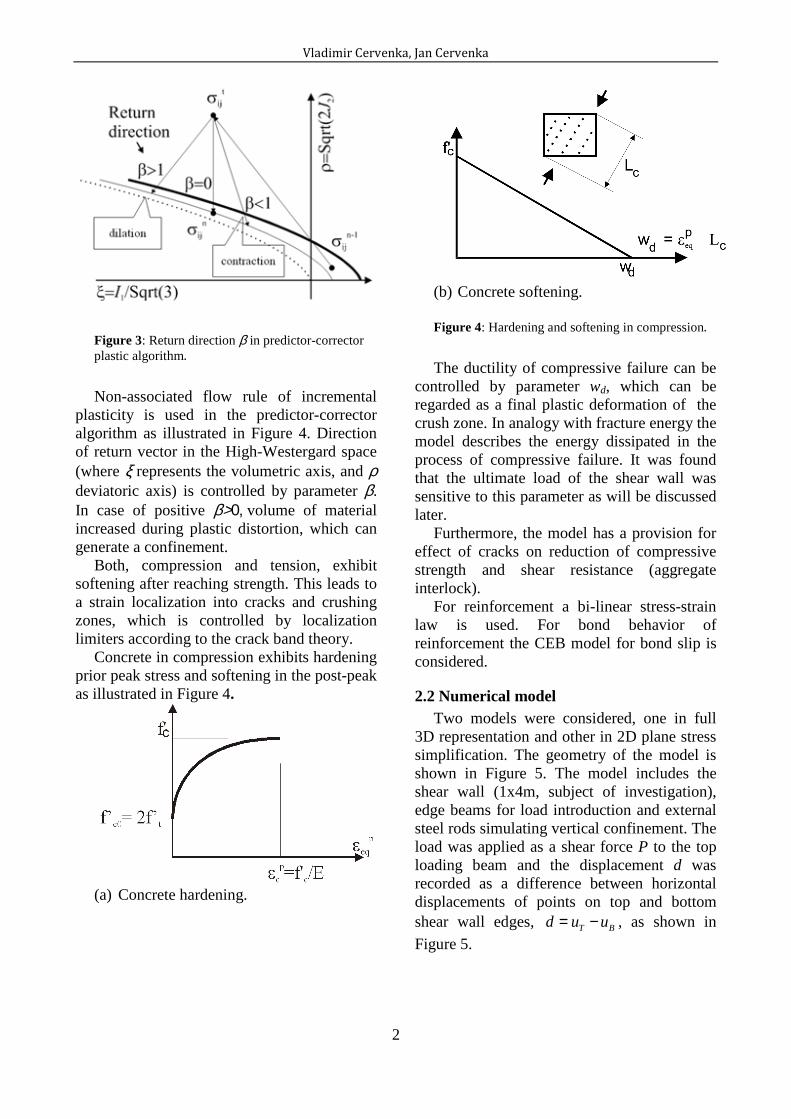
Figure 3: Return direction β in predictor-corrector plastic algorithm.
Non-associated flow rule of incremental plasticity is used in the predictor-corrector algorithm as illustrated in Figure 4. Direction of return vector in the High-Westergard space (where ξ represents the volumetric axis, and ρ deviatoric axis) is controlled by parameter β. In case of positive β>0, volume of material increased during plastic distortion, which can generate a confinement.
Both, compression and tension, exhibit softening after reaching strength. This leads to a strain localization into cracks and crushing zones, which is controlled by localization limiters according to the crack band theory.
Concrete in compression exhibits hardening prior peak stress and softening in the post-peak as illustrated in Figure 4.
(a) Concrete hardening.
(b) Concrete softening.
Figure 4: Hardening and softening in compression.
The ductility of compressive failure can be controlled by parameter wd, which can be regarded as a final plastic deformation of the crush zone. In analogy with fracture energy the model describes the energy dissipated in the process of compressive failure. It was found that the ultimate load of the shear wall was sensitive to this parameter as will be discussed later.
Furthermore, the model has a provision for effect of cracks on reduction of compressive strength and shear resistance (aggregate interlock).
For reinforcement a bi-linear stress-strain law is used. For bond behavior of reinforcement the CEB model for bond slip is considered.
2.2 Numerical model Two models were considered, one in full
3D representation and other in 2D plane stress simplification. The geometry of the model is shown in Figure 5. The model includes the shear wall (1x4m, subject of investigation), edge beams for load introduction and external steel rods simulating vertical confinement. The load was applied as a shear force P to the top loading beam and the displacement d was recorded as a difference between horizontal displacements of points on top and bottom shear wall edges, T Bd u u= − , as shown in
Figure 5.
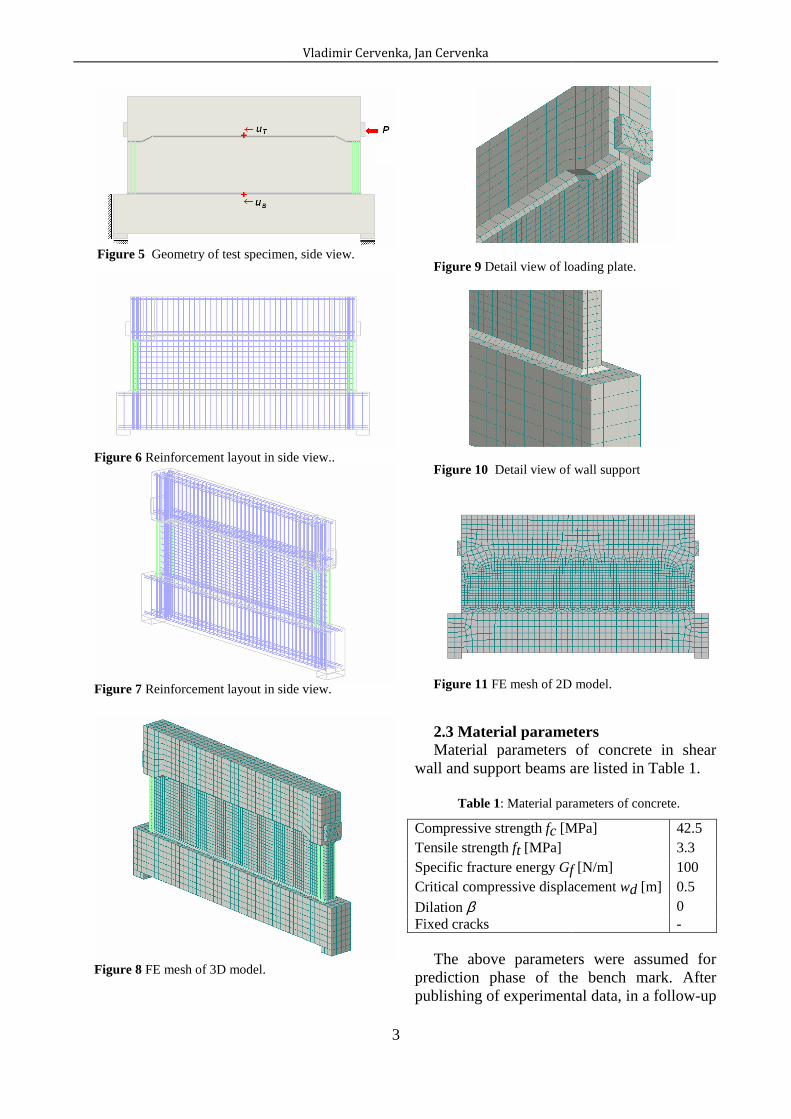
Figure 5 Geometry of test specimen, side view.
Figure 6 Reinforcement layout in side view..
Figure 7 Reinforcement layout in side view.
Figure 8 FE mesh of 3D model.
Vladimir Cervenka, Jan Cervenka
3
Geometry of test specimen, side view.
layout in side view..
layout in side view.
Figure 9 Detail view of loading plate.
Figure 10 Detail view of wall support
Figure 11 FE mesh of 2D model 2.3 Material parametersMaterial parameters of concrete in shear
wall and support beams are listed in Table 1.
Table 1: Material parameters of concrete.
Compressive strength fc [MPa]Tensile strength ft [MPa] Specific fracture energy GfCritical compressive displacement
Dilation β Fixed cracks
The above parameters were assumed for
prediction phase of the publishing of experimental data,
Detail view of loading plate.
Detail view of wall support
D model.
2.3 Material parameters Material parameters of concrete in shear
are listed in Table 1.
Material parameters of concrete.
[MPa] 42.5 3.3
f [N/m] 100 Critical compressive displacement wd [m] 0.5
0 -
parameters were assumed for the bench mark. After ental data, in a follow-up
analysis, different parameters for wd and β were used in order to better capture the ultimate load.
Reinforcement yield strength was fy=554 MPa. In the bond stressaccording to CEB formula the peak point (bond strength) was considered as 8.9 MPa.
2.4 Loading and solution Loading was applied by prescribed
displacement and the loading force was found as a reaction at the loading point. solution was done by Newtonmethod with tangent predictor and with line search. Equation solver was iterative. Residual error tolerance was 0.001 and maximum number of iterations 80.
3 RESULTS
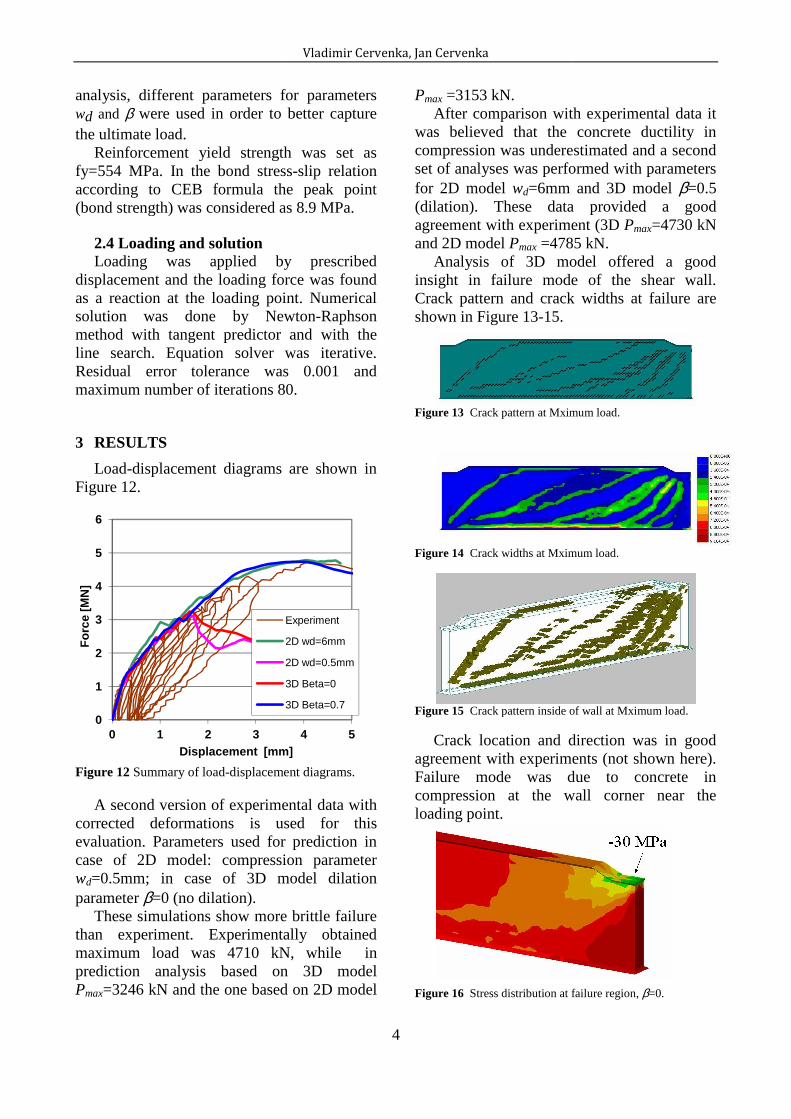
Load-displacement diagrams are shown in Figure 12.
Figure 12 Summary of load-displacement diagrams.
A second version of experimental datacorrected deformations is used for this evaluation. Parameters used for case of 2D model: compression parametwd=0.5mm; in case of 3D modelparameter β=0 (no dilation).
These simulations show more brittle failure than experiment. Experimentally obtained maximum load was 4710 kN, whprediction analysis based on Pmax=3246 kN and the one based on
0
1
2
3
4
5
6
0 1 2 3
Fo
rce
[MN
]
Displacement [mm]
Experiment
2D wd=6mm
2D wd=0.5mm
3D Beta=0
3D Beta=0.7
Vladimir Cervenka, Jan Cervenka
4
for parameters were used in order to better capture
Reinforcement yield strength was set as fy=554 MPa. In the bond stress-slip relation according to CEB formula the peak point (bond strength) was considered as 8.9 MPa.
Loading was applied by prescribed loading force was found
the loading point. Numerical solution was done by Newton-Raphson method with tangent predictor and with the line search. Equation solver was iterative. Residual error tolerance was 0.001 and maximum number of iterations 80.
displacement diagrams are shown in
displacement diagrams.
xperimental data with used for this
prediction in compression parameter
3D model dilation
show more brittle failure Experimentally obtained
N, while in based on 3D model
the one based on 2D model
Pmax =3153 kN. After comparison with experimental data it
was believed that the compression was underestimated and a second set of analyses was performed for 2D model wd=6mm and 3D model (dilation). These data provided a good agreement with experiment (3D and 2D model Pmax =4785 kN.
Analysis of 3D model offered a good insight in failure mode of the shear wall. Crack pattern and crack widths shown in Figure 13-15.
Figure 13 Crack pattern at Mximum load.
Figure 14 Crack widths at Mximum load.
Figure 15 Crack pattern inside of wall
Crack location and directionagreement with experimentsFailure mode was due to concrete in compression at the wall corner near loading point.
Figure 16 Stress distribution at failure regi
4 5Displacement [mm]
Experiment
2D wd=6mm
2D wd=0.5mm
3D Beta=0
3D Beta=0.7
After comparison with experimental data it the concrete ductility in
compression was underestimated and a second set of analyses was performed with parameters
=6mm and 3D model β=0.5 These data provided a good
agreement with experiment (3D Pmax=4730 kN =4785 kN.
Analysis of 3D model offered a good insight in failure mode of the shear wall.
and crack widths at failure are
Crack pattern at Mximum load.
at Mximum load.
Crack pattern inside of wall at Mximum load.
location and direction was in good agreement with experiments (not shown here). Failure mode was due to concrete in compression at the wall corner near the
Stress distribution at failure region, β=0.
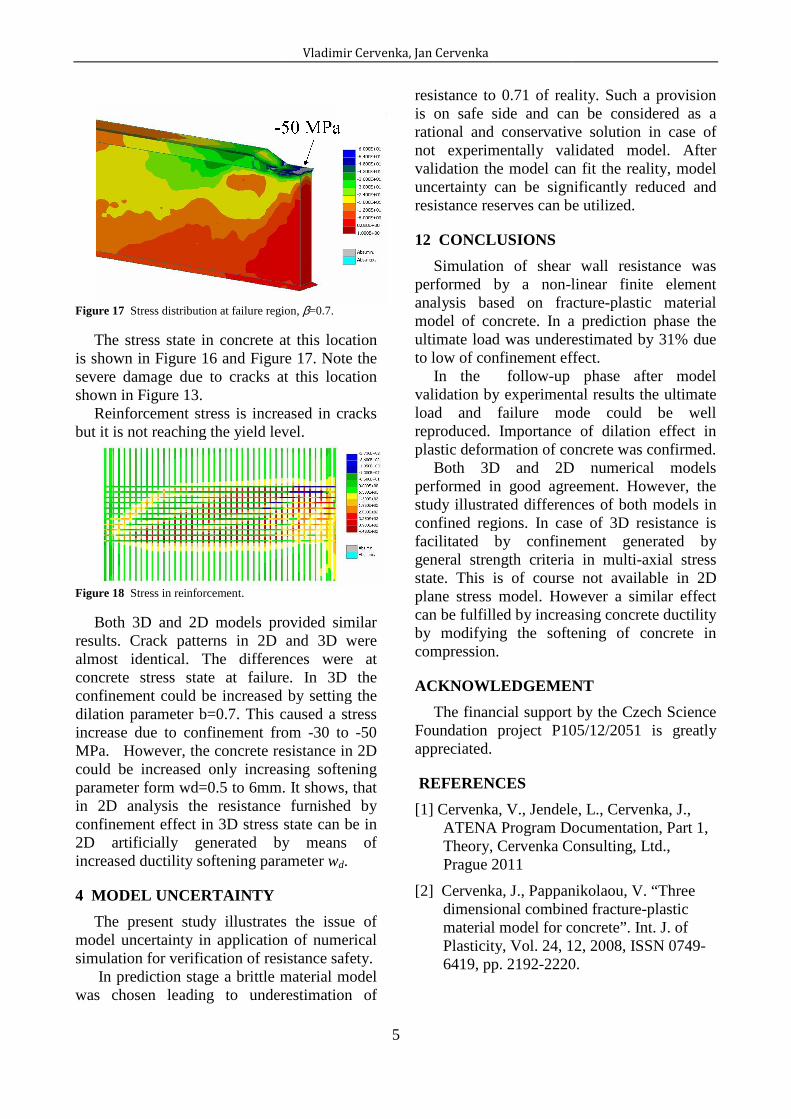
Figure 17 Stress distribution at failure regio
The stress state in concrete atis shown in Figure 16 and Figure severe damage due to cracks at this shown in Figure 13.
Reinforcement stress is increased in cracks but it is not reaching the yield level
Figure 18 Stress in reinforcement.
Both 3D and 2D models provided similar results. Crack patterns in 2D and 3D were almost identical. The differences were at concrete stress state at failureconfinement could be increased by setting the dilation parameter b=0.7. This caused increase due to confinement fromMPa. However, the concrete resistance could be increased only increasing softparameter form wd=0.5 to 6mm. in 2D analysis the resistance confinement effect in 3D stress state2D artificially generated by means of increased ductility softening parameter
4 MODEL UNCERTAINTY
The present study illustrates model uncertainty in application of numericalsimulation for verification of resi
In prediction stage a brittle material model was chosen leading to underestima
Vladimir Cervenka, Jan Cervenka
5
on, β=0.7.
at this location Figure 17. Note the
at this location
increased in cracks reaching the yield level.
Both 3D and 2D models provided similar Crack patterns in 2D and 3D were
The differences were at failure. In 3D the
confinement could be increased by setting the parameter b=0.7. This caused a stress
from -30 to -50 resistance in 2D
increased only increasing softening It shows, that
stance furnished by in 3D stress state can be in
by means of softening parameter wd.
present study illustrates the issue of model uncertainty in application of numerical
istance safety. material model
leading to underestimation of
resistance to 0.71 of reality. Such is on safe side and can be considered rational and conservativenot experimentally validated modelvalidation the model can fit the realityuncertainty can be signifresistance reserves can be utilized.
12 CONCLUSIONS
Simulation of shear wall resistance was performed by a non-linear finite element analysis based on fractumodel of concrete. In a ultimate load was underestimated by 31% due to low of confinement effect.
In the follow-up phase validation by experimental results the ultimate load and failure mode reproduced. Importance of dilation effect in plastic deformation of co
Both 3D and 2D performed in good agreementstudy illustrated differences ofconfined regions. In case of 3D resistance is facilitated by confinement general strength criteriastate. This is of course not plane stress model. Howcan be fulfilled by increasing concretby modifying the softening of concrete in compression.
ACKNOWLEDGEMENT
The financial support Foundation project P105/12/2051appreciated.
REFERENCES
[1] Cervenka, V., Jendele, L., Cervenka, J., ATENA Program Documentation, Part 1, Theory, Cervenka Consulting, LtdPrague 2011
[2] Cervenka, J., Pappanikolaou, V. dimensional combined fracturematerial model for concrete”.Plasticity, Vol. 24, 12, 2008, ISSN 07496419, pp. 2192-2220.
to 0.71 of reality. Such a provision is on safe side and can be considered as a ational and conservative solution in case of
experimentally validated model. After can fit the reality, model
nificantly reduced and resistance reserves can be utilized.
Simulation of shear wall resistance was linear finite element
analysis based on fracture-plastic material a prediction phase the
ultimate load was underestimated by 31% due ent effect.
up phase after model validation by experimental results the ultimate
and failure mode could be well Importance of dilation effect in
deformation of concrete was confirmed. 3D and 2D numerical models
performed in good agreement. However, the nces of both models in
regions. In case of 3D resistance is facilitated by confinement generated by
a in multi-axial stress f course not available in 2D
However a similar effect fulfilled by increasing concrete ductility
by modifying the softening of concrete in
ACKNOWLEDGEMENT
financial support by the Czech Science P105/12/2051 is greatly
Cervenka, V., Jendele, L., Cervenka, J., ATENA Program Documentation, Part 1,
, Cervenka Consulting, Ltd.,
a, J., Pappanikolaou, V. “Three dimensional combined fracture-plastic material model for concrete”. Int. J. of Plasticity, Vol. 24, 12, 2008, ISSN 0749-
2220.