numerical thermal-hydaulics study on sodium-water …
TRANSCRIPT

1
NUMERICAL THERMAL-HYDAULICS STUDY ON SODIUM-WATER REACTION PHENOMENA
Takashi Takata and Akira Yamaguchi Japan Nuclear Cycle Development Institute, Japan
Abstract
A new computational program SERAPHIM (Sodium-watEr Reaction Analysis: PHysics of Interdisciplinary Multi-phase flow) is developed to investigate the Sodium-Water Reaction (SWR) phenomena based on parallel computation technology. A compressible three-fluid (liquid water, liquid sodium and mixture gas) and one-pressure model is adopted for multi-phase calculation. The Highly Simplified Maker And Cell (HSMAC) method considering with compressibility is implemented as the numerical solution. The Message-Passing Interface (MPI) is used for the parallel computation. Two types of reactions are considered for the SWR modeling; one is a surface reaction and the other is a gas phase reaction. The surface reaction model assumes that liquid sodium reacts with water vapor on the surface of liquid sodium. An analogy of heat transfer and mass transfer is applied in this model. Reaction heating vaporizes liquid sodium resulting in the gas phase reaction. The ab initio molecular orbital method is applied to investigate the reaction mechanism and evaluate the reaction rate described by the Arrhenius law. A performance of parallel computation is tested on the cluster-PC (16CPUs) system. The execution time becomes 17.1 times faster in case of 16 CPUs. It seems promising that the SERAPHIM code is practicable for large-scale analysis of the SWR phenomena. Three-dimensional SWR analyses are also carried out to investigate the characteristics of the thermal-hydraulics with the SWR and an influence of initial pressure (0.2MPa and 0.6MPa) on an early stage of the SWR phenomenon. As a result, distribution of a gas region, in which water vapor or product of the SWR such as hydrogen and sodium hydroxide exits, velocity and high temperature region differs by 0.2MPa and 0.6MPa conditions. However, the maximum gas temperature has an upper bounding and is almost constant both in the analyses. The reason of the upper bounding is attributed to the fact that a hydrogen gas covers up a liquid-gas interface and thus suppresses the SWR. Sodium hydroxide is a dominant species of the gas at the high temperature region in each case. Heat capacity (=ρCp) of sodium hydroxide is not influenced by pressure resulting in the same value of maximum gas temperature.

2
Introduction In a liquid sodium cooled fast reactor, a chemical reactivity of sodium with water or oxygen is one of the most essential issue in safety concerning of the plant integrity. A sodium-water reaction (SWR) occurs when water or water vapor leaks from a heat transfer tube in a steam generator. It was reported that pressurized water jet stream reacts with sodium to produce hydrogen, sodium hydroxide and sodium oxide according to the following chemical reactions [1]:
2 21/ 2Na H O NaOH H+ → + (1)
2 2 22Na H O Na O H+ → + (2) When the reaction jet and the heated zone due to chemical reaction attach to an adjacent tube, the adjacent tube possibly fails by an erosion of the tube wall (designated as wastage) and/or a deterioration of mechanical strength at high temperature. Even in a small leakage where the reaction jet and the heated zone do not extend to an adjacent tube, the leakage can eventually enlarge to a size that allows the adjacent tube to be damaged [2]. Hence, an evaluation of the thermal-hydraulic characteristics with the SWR process, such as the jet and heated zone development, is a great concern in the steam generator integrity to avoid a secondary failure of adjacent tube as well as a development of fast and sensitive detection system. As concerns investigations of the thermal-hydraulic characteristics, the maximum temperature and the temperature distribution were evaluated based on experiments in the previous works. For instance, the water leakage test that models the steam generator of the prototype fast breeder reactor MONJU [3] was conducted. The maximum temperature of 1,100-1,200ºC was measured under the water leakage rate up to 4.5kg/s. When the leakage rate is 7-15kg/s, 1,140-1,250ºC was obtained. In the Large Leak Test Rig (LLTR) experiment [4], 2,000-2,500F (1,149-1,371ºC) of instantaneous maximum temperature was reported. For investigating the thermal-hydraulic characteristics, mock-up sodium experiments are available if we accept the economical cost of sodium loop operation. However, it is noted that a number of parameter tests would be needed to depict the whole picture of the SWR accident spectrum. On the other hand, numerical quantification of the SWR phenomena is an alternative and less costly way as an approach to the SWR study. With regard to numerical studies, Mori et al [5] developed CHAMPAGNE code based on a full-implicit method. However, the reaction rate of the SWR is simply defined [6] as:
2
1 2a ac S H Om k C C= (3)
where m and C are the reaction rate and the molar concentration, respectively. Subscripts S and H2O represent the liquid sodium and the water vapor. kc, a1 and a2 are constants and are estimated from an experimental result. These empirical constants should be modified for other different conditions and Eq. (3) cannot be a generic correlation applicable to the SWR phenomena. Therefore, development of a mechanistic modeling of the SWR is necessary to investigate the thermal-hydraulic and chemical characteristics in detail. In the present paper, a computer code SERAPHIM (Sodium-watEr Reaction Analysis: Physics of Interdisciplinary Multi-phase flow) based on the semi-implicit method of the Highly Simplified Marker

3
And Cell (HSMAC) [7] is developed to deal with the coupling of thermal-hydraulics and chemical reaction in a comprehensive manner. For multi-phase and multi-component calculation, a compressible three-fluid (liquid water, liquid sodium and mixture gas) and one-pressure model is adopted. The Message Passing Interface (MPI) method is applied to a parallel computation. As concerns the SWR modeling, two types of reaction mechanism are considered and implemented to the SERAPHIM code. One is a surface reaction and the other is a gas-phase reaction. The surface reaction model is assumed that water vapor directly react with liquid sodium. After the liquid sodium is heated up enough by the surface reaction to vaporize, the water vapor reacts with the sodium gas. This is designated as the gas-phase reaction.
Numerical Method Inside a steam generator of LMFR, liquid water, water vapor and liquid sodium exist as a working fluid in a normal operation. When a heat transfer tube fails, high pressurized water or water vapor leaks from the tube and sodium hydroxide, sodium oxide and hydrogen gas are produced due to the SWR as shown in Eqs. (1) and (2). Hence, a compressible three-fluid (liquid water, liquid sodium and mixture gas) and one-pressure model is adopted in the numerical method of multi-phase flow. The following six species are considered as the gas component; Na(g), H2O(g), H2(g), NaOH(g), NaOH(sl) and Na2O(sl). (g) and (sl) means the gas phase and solid/liquid aerosol, respectively. A gas phase of sodium oxide Na2O(g) is not taken into account because it has never been detected in previous experiments. Solid/liquid aerosols dispersed in the mixture gas are treated as particles that are considered in estimating a density and specific heat of the mixture gas. As liquid water vaporizes instantaneously due to the depressurization and is heated up at the liquid sodium surface by the SWR, it is assumed that liquid-phase water cannot reach to the liquid sodium. The gas phase conservation equations of mass, momentum, energy and mass transfer are shown in the following:
( ) ( )G G G G G eG cG eS cS sfGt
α ρ α ρ∂
+ ∇ ⋅ = Γ − Γ + Γ − Γ +∂
u (4)
( ) ( )
( ) ( )
G G G G G G G G G G G G sf G
eS S c G pS G H eH H c G pH G H wG G
p Gt
f f f
α ρ α ρ α α α ρ∂
+ ∇ ⋅ = − ∇ + ∇ ⋅ + −∂
+Γ − Γ − − + Γ − Γ − − −
u u u g u
u u u u u u u u u
ττ (5)
2
( ) ( ) ( )
( ) ( )( ) ( )
( )
G G G G G G G G G G G G G
eS S S cS Na eH H H c H H O
G S G S G H G H sf gs
G
Dh h p T
t Dth i hy h i hy
H T T H T T S SD
Dt t
α ρ α ρ α α α λ
α α
∂+ ∇ ⋅ = + Φ + ∇ ⋅ ∇
∂+Γ + − Γ + Γ + − Γ− − − − + +
∂= + ⋅∇
∂
u
u
(6)
( ) ( ) ( )g g J g g J g g m J J ec J sf J gs JY Y D Yt
α ρ α ρ α ρ γ γ∂
+ ∇ ⋅ = ∇ ⋅ ∇ + Γ + +∂ gu (7)
where α, ρ, u, Γe, Γc and G are the volume fraction, the density, the velocity vector, the total evaporation rate which is the summation of the evaporation rate of the liquid sodium and water, the total condensation rate and the mass generation rate due to the surface reaction, respectively. p, ττ, g, fp and fw are the kinetic pressure, the viscous stress tensor, the gravity vector, the interfacial friction coefficient

4
and the friction coefficient on the wall, respectively. h, Φ, λ, i, hy and S are the enthalpy, the dissipation function, the thermal conductivity, the latent heat, the enthalpy of gas component and the chemical reaction heat source due to the SWR, respectively. Y, Dm and Γec are the mass fraction, the effective binary diffusivity and the mass generation rate to evaporation and condensation, respectively. Subscripts G, H and S mean the gas mixture, the liquid water and the liquid sodium, respectively. Subscripts J, sf and gs represent the gas component, the surface reaction and the gas-phase reaction. With regard to the equation of state in the gas phase, Modified Benedict-Webb-Rubin equation [8] is applied to consider a compressibility of gas with high numerical accuracy. The HSMAC method is implemented for a compressible multi-phase flow analysis. In the HSMAC method, the pressure and velocity field are updated so that a divergence of total mass vanishes. The extension scheme of the HSMAC method to a compressible multi-phase flow is described as follows. The divergence D is defined as a summation of each phase’s volume fraction differentiated by time [9] as follows:
m
m
Dt
α∂= −
∂∑ (8)
where subscript m means the fluid type (G, H or S). The divergence D is also calculated by substituting Eq. (4) into Eq. (8). A residual of divergence ε is defined as the subtraction of a predictor D* from a subsequent divergence Dn+1 and is obtained by:
1 * * 1
1 ** 1 *
( 0)
1
n n
nn n n n n n nm mm m m m m m m mn
m m
D D D D
Dt t
ε
ρ ρε α ρ α α ρ α
ρ
+ +
++
= − = − =
∂ ∂ = − = + ∇ ⋅ − − ∇ ⋅ ∂ ∂ ∑ u u
Q
(9)
where superscript * means the predictor. n and n+1 mean the current and subsequent time step.
m tρ∂ ∂ in Eq. (9) is estimated from the equation of state. Then Eq. (9) is rewritten as:
( )
*
1 *
1 * 1 * 1 *
1
( , , )
n n nn n nm m m m Gn n n
m mm m m m G G
n n n n nm m m m m mn
m m
n n nm m m
T Tp p M MD
t t t
p p p T T T M M M
α α δ αδ δρ ρ ρ ρ ρ ρ
ρ α ρ αρ
δ δ δ
+
+ + +
∂∂ ∂− = + +
∂ ∆ ∂ ∆ ∂ ∆
+ ∇ ⋅ − ∇ ⋅
= − = − = −
∑ ∑
∑ u u (10)
M means the average molecular weight of the gas phase. With regard to the conservation equation of momentum, only pressure term is treated implicitly and another terms are treated explicitly in the semi-implicit method. In the HSMAC method, the pressure is treated explicitly in the calculation of the velocity predictor *
mu , while it is treated implicitly in the
estimation of the subsequent velocity n+1mu . Using the residual value of pressure δp, the velocity
predictor *mu and the subsequent velocity n+1
mu , the conservation equation of momentum can be simplified as:
5
1 *
1 *( )
nn n n n n n mm m m m m m m n
m
nm m
tt p or p
αρ α ρ α α δ δ δ
ρ
δ
+
+
∆− = − ∆ ∇ = − ∇
= −
m
m
u u u
u u u
(11)
Multiplying the divergence operator to Eq. (11), one obtains the following equation.
1 * 2( )n nm m m m m m m t pρ α ρ α α δ+∇ ⋅ − = − ∆ ∇u u (12)
The central differences approximation and the superdiagonal angle approximation [7] are implemented with regard to the Laplacian in Eq. (12). Eq. (12) is finally rewritten as:
1 *2
12n n n n n n
m m m m m m mk k
t px
ρ α ρ α α δ+∇ ⋅ − ∇ ⋅ = ∆∆∑u u (13)
where k is the spatial coordinates. Substituting Eq. (13) to Eq. (10), the residual value of pressure δp is obtained as:
* *
2
*
1 12
nnmn
m km m k
n nn nm m m Gn n
m m m G G
Dp
pt
t x
T T M M
t t
ρ
ρ
εδ ω
αρ ρ
α δ α δε
ρ ρ ρ ρ
+= −
∂ + ∆ ∆ ∂ ∆
∂ ∂= +
∂ ∆ ∂ ∆
∑ ∑
∑
(14)
where ω is the relaxation factor and *
ρε is the additional residual due to a compressibility. The
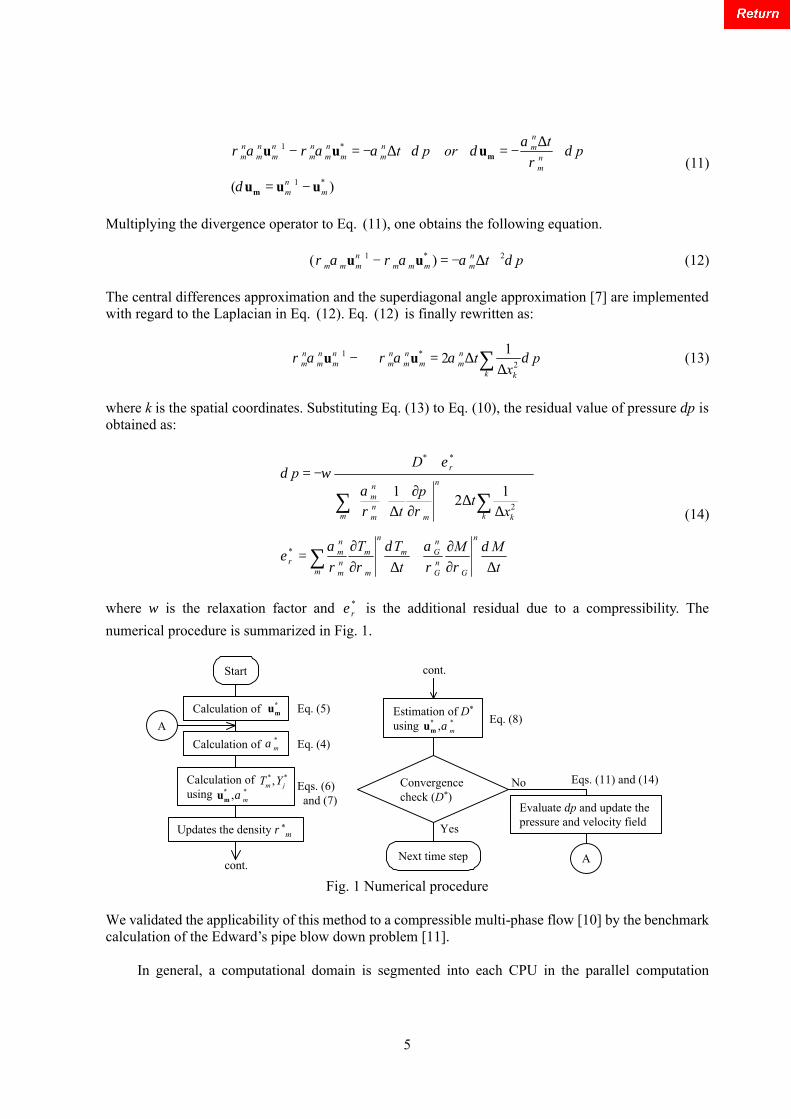
numerical procedure is summarized in Fig. 1.
Calculation of *mu Eq. (5) Estimation of D*
using *, mα*mu
Calculation of *mα Eq. (4)
Convergencecheck (D*)
Calculation of using *, mα*
mu
* *,m jT Y
A
Start
Next time step
Yes
A
No
Evaluate δp and update the pressure and velocity field
Eqs. (6)and (7)
Updates the density ρ*m
Eq. (8)
Eqs. (11) and (14)
cont.
cont.
Fig. 1 Numerical procedure
We validated the applicability of this method to a compressible multi-phase flow [10] by the benchmark calculation of the Edward’s pipe blow down problem [11]. In general, a computational domain is segmented into each CPU in the parallel computation

6
procedure. In case of the matrix solver method, it is difficult that the solution result of the total matrix coincides completely with that of no-parallel computation and that each CPU load is shared equally. Because a message-passing during the calculation of each matrix solver is not effective and the CPU load depends not only on the domain size but also on the characteristic of the matrix. As seen in Eq. (14), the HSMAC method is not needed a matrix solver for the Poisson equation of pressure. In addition, only the residual value of the pressure δp that is calculated independently at each computational cell is necessary to update another values such as * * *, ,m m mTαu and *
JY depicted in Fig. 1. Therefore, an effective message-passing during the iteration can be achieved without difficulty. In addition, because of no matrix solver in the HSMAC method, the CPU load depends only on the domain size of each CPU. Hence, one can easily obtain an even load in each CPU. Consequently, the HSMAC method is suitable for parallel computation. In the present study, the Message-Passing Interface (MPI) method is applied. The segmentation of the computational domain in each CPU is automatically set in the program. The memory needed for the computation is also segmented to each CPU to apply a large-scale calculation even in a scarce resource.
SWR Modeling In a steam generator, pressurized water or water vapor leaks into liquid sodium from a failed heat transfer tube. When water leaks from the failed heat transfer tube, it vaporizes almost instantaneously due to depressurization. Therefore, the water is assumed to exist in gas phase in the SWR modeling. On the other hand, the sodium reacts in the liquid phase in the beginning when it is not heated up enough by the chemical reaction. After sodium vaporizes continuously and large amount of sodium vapor is emitted, it might reacts in gas phase. Accordingly, water vapor reacts both with liquid sodium and sodium gas. Hence, two reaction modes, i.e. surface reaction and gas-phase reaction, are taken into account in the present study. The schema of each reaction model is depicted in Fig. 2.
H2O
Na
NaOH
H2
Sodium liquid surface
H2O
Na H2
NaOH
(a) Surface reaction (b) Gas-phase reaction Fig.2 Schema of the reaction model
Surface Reaction Model As seen in Fig. 2(a), the surface reaction is assumed that water vapor reacts with liquid sodium at the gas-liquid interface. In the reaction between strong alkalis and water, the following considerations are generally applied [12]. A chemical reaction rate at a liquid surface is sufficiently higher than a mass diffusion rate of water vapor toward the liquid surface. A number of water molecules approach and surround a single sodium molecule and remove it away from sodium liquid surface. Reaction heat tends to be allocated to the reaction products rather than the liquid sodium. It is because that the sodium is a

7
monatomic molecule and has narrow energy level intervals. Therefore, the energy cannot be transferred efficiently from the viewpoint of kinetics and electronic excitation. Since the chemical reaction is sufficiently high, the surface reaction rate γsf is controlled by the mass flow rate of the water vapor toward the liquid sodium and is given as:
2
2 2
H OG m Ssf H O G H O
D ASh Y
l V
ργ = (15)
where, Sh and l are the Sherwood number and the characteristics length, respectively. As and V are the contact area where the surface reaction takes place and the volume of each computational cell, respectively. The Sherwood number ShG is estimated from the analogy of heat and mass transfers. It is considered that a flow condition near the interface becomes a turbulent state energized by the pressurized water jet stream. Accordingly, ShG is expressed as:
2 31 b bG G GSh b Re Sc= × × (16)
where Re is the Reynolds number and Sc is the Schmidt number. Here, empirical constants b1,b2 and b3 are used. One can represent the Schmidt number Sc with the Lewis number Le and the Prandtl number Pr as follows:
2 3 31 ( )b b bG G GSh b Re Le Pr Le Nu= × × × = (17)
G
pG G m
ScLe
Pr C D
λρ
= = (18)
GG
G
H lNu
λ= (19)
Cp and Nu are the specific heat and the Nusselt number, respectively. HG is the heat transfer coefficient. Substituting Eqs. (17) and (19) into Eq. (15), the reaction rate is obtained by:
2 2
3 1b Gsf H O S H O
pG
HLe a Y
Cγ −= (20)
where as is the interfacial area density between the liquid sodium and the gas mixture (=AS/V). Using the stoichiometric coefficient ist which corresponds to a proportion of sodium compounds in the surface reaction, one evaluates the consumption rates of sodium (reactant) and the generation rate of the products as follows:
2
2
For reactant:
product:
sf S st S sf H O
sf j st j sf H O
i
i
γ γ
γ γ
= −
= (21)
Gas-Phase Reaction Model After the liquid sodium is heated up enough by the surface reaction and evaporates vigorously, sodium molecules react with water molecules frequently. This reaction is designated as the gas-phase reaction depicted in Fig. 2(b). As concerns the chemical reaction between sodium and water in the gas

8
phase, the reaction mechanism and reaction rate are not fully understood. Hence, the reaction mechanism and the reaction rate are investigated based on an ab initio molecular orbital (MO) method. A commercial program, Gaussian94 [13], is employed. Figure 3 shows potential energy levels at each state in the gas-phase reaction. Taking over the custom in chemical engineering society, [kcal/mol] unit is applied to the potential energy. As seen in Fig. 3, the energy barrier that is needed to initiate a reaction is estimated to be 48 and 58kcal/mol in the process of sodium hydroxide generation. On the other hand, 78kcal/mol or more energy activation is needed in the process of sodium oxide generation. It is found from the present investigation that the sodium hydroxide is a major product in the SWR. Okano [14] numerically evaluates a composition of the SWR in a theoretical adiabatic temperature condition based on the Gibbs free energy minimization method and reported that the sodium hydroxide is the major product. The present result is consistent with the thermodynamic analysis. Another important finding is that a hydration of sodium is exothermic (H2O…Na complex and H2O…Na2 complex in Fig. 3), while the other reactions are all endothermic. Hence, only the hydration energy can be the trigger of initiating the SWR. The reason why the SWR observed in an experiment is exothermic is explained by the assumption that hydrogen monatomic exists in some reaction and every sodium compound is a gas state in the MO method. Considering the production energy of hydrogen molecule and latent heat of sodium compounds, it turns the reaction to be exothermic.
Fig.3 Potential energy level at each state in the gas-phase SWR
If a transition state is found in the reaction path, the rate constant of the reaction k(T), which is described in the form of the Arrhenius law, is evaluated by the transition state theory [15] as:
0
( ) expBA
A B B
k T Q Ek T N
h Q Q k T
≠ ≠ ∆=
(22)
where NA, kB and h0 are the Avogadro constant, the Boltzmann constant and the Planck’s constant, respectively. Q is the grand partition function of internal degree of freedom at a transition state. QA and QB are the grand partition functions of reactants’ internal degree of freedom. ∆E and T are the potential energy difference between primitive and transition state and the temperature respectively. Here, Q , QA, QB and ∆E are obtained by the MO analysis. The capture theory [16] is adopted in the situation where no transition state appears in the reaction. With regard to the reaction between a dipole and an induced dipole molecule, one obtains the rate

9
constant as:
13
16
12
6
2
60
( ) 8.56 ( )
4
B
A B
Ck T k T
C
µ
µ απε
=
≈
(23)
where µ, µA and αB are the reduced mass, the dipole moment and the polarizability of induced dipole, respectively and are evaluated from the MO analysis. ε0 is the electric constant. In the present study, the following reaction equations are taken into account as the gas-phase reaction.
2 21/ 2Na H O NaOH H+ → + (24)
2 22 2 2Na H O NaOH H+ → + (25)
2 2 22Na H O Na O H+ → + (26)
2 21/ 2Na NaOH Na O H+ → + (27) Equation (24) assumes that a single H2O...Na complex releases a hydrogen atom. Two H2O...Na complexes collide and produce two sodium hydroxide and one hydrogen molecule in Eq. (25).
Numerical Examples of the SWR Three-dimensional SWR analyses at an early stage of the water vapor leakage (up to 100ms) are carried out to estimate a performance of parallel computation and to investigate a characteristic of thermal- hydraulics coupled with the chemical reaction and an influence of initial pressure on the SWR phenomena.
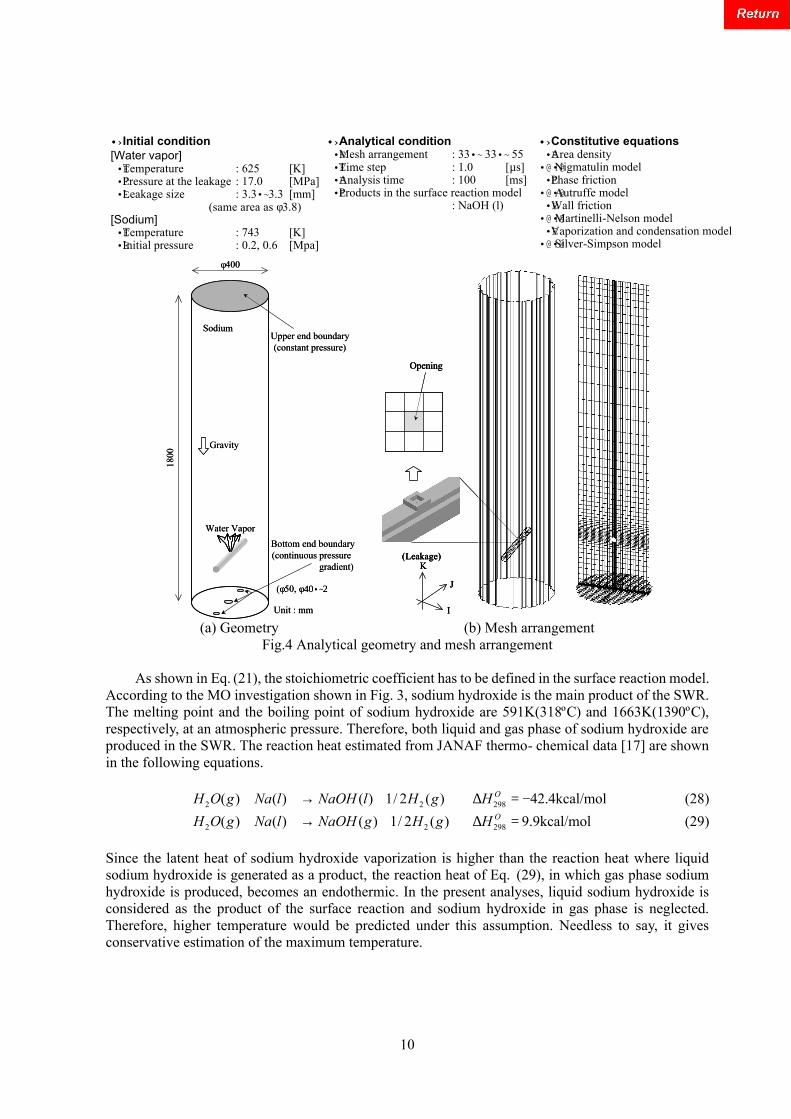
Analytical Conditions The analytical region is a cylindrical vessel of φ400mm and 1800mm height. Figure 4(a) shows the analytical geometry. A heat transfer tube of φ31.8mm is implemented at 300mm height from the bottom of the vessel. Opening of φ3.8mm is placed on upper side of the tube surface. Water vapor blows upward through the opening. Structural mesh arrangement divided into 33(I)*33(J)*57(K) is adopted in the Cartesian coordinates as shown in Fig. 4(b). Total computational cell number is approximately 60000. Boundary conditions of sodium flow are given at both upper and bottom end of the geometry, as seen in Fig. 4(a). A constant pressure (initial pressure) boundary is applied at the whole top end of the geometry. In the performance test of parallel computation, the initial pressure is set to 0.2MPa. In addition to 0.2MPa (Case 1), 0.6MPa (Case 2) is selected as the initial pressure value in the investigation of the SWR phenomena. Some part of the bottom end depicted in Fig. 4(a) is treated as a continuous pressure gradient boundary. With regard to the water vapor leakage, one assumes a constant pressure of 17MPa at the opening and the outflow velocity of the water vapor is calculated in the SERAPHIM code using the pressure boundary condition. Table 1 summarizes the analytical conditions and constitutive equations that are applied in the multi-phase analysis with the multi-fluid model.
Table 1 Analytical condition in the SWR analysis
10
•›Initial condition[Water vapor]•ETemperature : 625 [K]•EPressure at the leakage : 17.0 [MPa]•ELeakage size : 3.3•~3.3 [mm]
(same area as φ3.8)[Sodium]•ETemperature : 743 [K]•EInitial pressure : 0.2, 0.6 [Mpa]
•›Constitutive equations•EArea density•@•@Nigmatulin model•EPhase friction•@•@Autruffe model•EWall friction•@•@Martinelli-Nelson model•EVaporization and condensation model•@•@Silver-Simpson model
•›Analytical condition•EMesh arrangement : 33•~33•~55 •ETime step : 1.0 [µs]•EAnalysis time : 100 [ms]•EProducts in the surface reaction model
: NaOH (l)
φ400
1800
Water Vapor
SodiumUpper end boundary(constant pressure)
Bottom end boundary(continuous pressure
gradient)
Gravity
(φ50, φ40•~2)
Unit : mm
φ400
1800
Water Vapor
SodiumUpper end boundary(constant pressure)
Bottom end boundary(continuous pressure
gradient)
Gravity
(φ50, φ40•~2)
Unit : mm
(Leakage)
Opening
I
J
K(Leakage)
Opening
(Leakage)
Opening
I
J
K
I
J
K
(a) Geometry (b) Mesh arrangement
Fig.4 Analytical geometry and mesh arrangement As shown in Eq. (21), the stoichiometric coefficient has to be defined in the surface reaction model. According to the MO investigation shown in Fig. 3, sodium hydroxide is the main product of the SWR. The melting point and the boiling point of sodium hydroxide are 591K(318ºC) and 1663K(1390ºC), respectively, at an atmospheric pressure. Therefore, both liquid and gas phase of sodium hydroxide are produced in the SWR. The reaction heat estimated from JANAF thermo- chemical data [17] are shown in the following equations. 2 2 298( ) ( ) ( ) 1/ 2 ( ) 42.4kcal/molOH O g Na l NaOH l H g H+ → + ∆ = − (28)
2 2 298( ) ( ) ( ) 1/ 2 ( ) 9.9kcal/molOH O g Na l NaOH g H g H+ → + ∆ = (29) Since the latent heat of sodium hydroxide vaporization is higher than the reaction heat where liquid sodium hydroxide is generated as a product, the reaction heat of Eq. (29), in which gas phase sodium hydroxide is produced, becomes an endothermic. In the present analyses, liquid sodium hydroxide is considered as the product of the surface reaction and sodium hydroxide in gas phase is neglected. Therefore, higher temperature would be predicted under this assumption. Needless to say, it gives conservative estimation of the maximum temperature.

11
Performance of Parallel Computation In the performance test of the parallel computation, the initial pressure value is set to 0.2MPa. A PC-cluster system with 16CPUs is used for the test. A computing time except I/O process is measured three times on each test using SECNDS function implemented in the FORTRAN. Then, the average time of three times computations is defined as an execution time. Table 2 shows the specifications of the PC-cluster system and Figure 5 shows the test result.
Table 2 PC-cluster specifications
•ECPU spec : Pentium ® IV 2.2GHz•ENumber of CPU : 16•EMemory size : 1GB (512KB cash)•ENet work : 1Gbps LAN•EOS : LINUX•ECompiler : PGI FORTRAN
0
2
4
6
8
10
12
14
16
18
0 2 4 6 8 10 12 14 16 18Number of CPU [-]
Fig. 5 Performance of parallel computation
Horizontal bar on the symbol and a dashed line in Fig. 5 represents the error bar and the ideal acceleration, respectively. As seen in Fig. 5, in 8CPUs condition, the execution time is 8.8 times as fast as that of 1CPU case. The execution time becomes 17.1 times faster in case of 16CPUs. It is obvious that the SERAPHIM code demonstrates a good performance through the tests even in the small-scale analysis (total number of computational cell is approximately 60000). It seems promising that the SERAPHIM code is practicable for large-scale SWR analysis without difficulty.
Numerical Investigation of the SWR Figure 6 shows the iso-surface where the gas volume fraction is 0.1 and the distributions of the gas volume fraction on the iso-surface at I-, J- and L-sections after 100ms duration. The L-coordinate represents a 45-degree skewed direction against I- and J-axes. As shown in Fig. 6, the evolution of the gas region is quite variant in each case. The gas region develops in all directions from the opening in Case 1 (0.2MPa, Fig. 6(a)). On the other hand, the gas region develops upward rather than horizontally in Case 2 (0.6MPa, Fig. 6(b)). Since gas volume shrinks due to compressibility as pressure increases, the total gas volume in Case 2 is smaller than in Case 1. Therefore, the horizontal gas extension is suppressed in Case 2. As seen in Fig. 6, the gas volume fraction is high in the skewed direction (L-section) rather than in the vertical section against the tube axis direction (I-section) both in the analyses. Figure 7 depicts the velocity field of the liquid sodium at 100ms. As the water vapor blows upward, liquid sodium flows into the analytical region through the bottom end boundary. As seen in Fig.7, the liquid sodium collides with the bottom of the bluff tube at the center and is separated on both sides. Therefore, the liquid sodium sweeps away the gas phase in the I-section.

12
(a) Case 1 (0.2MPa) (b) Case 2 (0.6MPa)
Fig. 6 Distribution of gas volume fraction at 100ms
(a) Case 1 (0.2MPa) (b) Case 2 (0.6MPa)
Fig. 7 Velocity field in liquid sodium phase at 100ms Figures 8 and 9 show the temperature distribution of the gas phase and the gas maximum temperature transient courses, respectively. As concerns the temperature distribution, the same tendency as the gas volume fraction is obtained. The high temperature region develops vertically upward when the initial pressure rises. From the viewpoint of avoiding a secondary tube failure that possibly takes place after the reaction zone attaches to an adjacent tube, it may be said that a low pressure of liquid sodium is desirable as an operating condition in a steam generator. As seen in Fig. 9, the maximum value of the gas temperature seems to be limited below 1400ºC during the transient both in the analyses, although the development of the gas region and the high temperature region quite differs. The reason of the ceiling of the maximum temperature is described as follows. Figure 10 shows the result of the volume fraction distribution of hydrogen gas (Case 1). The high concentration region of hydrogen gas exists near the interface of the liquid sodium and the gas region as can be seen from the comparison of Figs. 6 and 10. Consequently, the concentration of water vapor becomes lower at the interface and the SWR rate is declining. This results in the upper bounding in the temperature during the transient as shown in Fig. 9.
( •F1 0 m /s)
I J
K
4 5•‹
L
L
K

13
(a) Case 1 (0.2MPa) (b) Case 2 (0.6MPa)
Fig. 8 Distribution of gas temperature at 100ms
200
400
600
800
1000
1200
1400
1600
0 20 40 60 80 100Time [ms]
: Case 1 (0.2MPa): Case 2 (0.6MPa)
Fig. 9 Maximum gas temperature transient Fig. 10 Distribution of hydrogen gas at 100ms (Case 1, 0.2MPa) Let us consider the reason why the maximum gas temperature makes no difference regardless of the initial pressure. Figure 11 shows the distributions of the gas temperature versus the reaction heat per unit volume. The high reaction heat region is limited just upper side of the water vapor leakage and the high temperature region exists in the downstream of the reaction heat zone both in cases. The maximum value of the reaction heat per unit volume is just higher in Case 2 than in Case 1. However, the difference of the reaction heat in each analysis is obscure compared with the initial pressure difference. As heat capacity of gas (=ρCp) is proportional to pressure in general, the maximum temperature in Case 2 should be lower than in Case 1. In the SWR, sodium hydroxide in solid/liquid aerosol as well as hydrogen gas is produced. Figure 12 shows the distributions of the gas temperature versus the mass fraction of the sodium hydroxide. From the viewpoint of mass fraction, sodium hydroxide is a dominant species of the gas at high temperature zone in each case as shown in Fig. 12. The heat capacity of sodium hydroxide in aerosol state is not influenced by the pressure. Accordingly, almost the same value of maximum temperature is predicted regardless of the initial pressure difference.
I J
K
4 5•‹
L
L
K
I J
K
4 5•‹
L
L
K

14
(a) Case 1 (0.2MPa) (b) Case 2 (0.6MPa)
Fig. 11 Distribution of gas temperature versus reaction heat per unit volume at 100ms
(a) Case 1 (0.2MPa) (b) Case 2 (0.6MPa)
Fig. 12 Distribution of gas temperature versus mass fraction of sodium hydroxide at 100ms
Conclusion A new computational program SERAPHIM (Sodium-watEr Reaction Analysis: PHysics of Interdisciplinary Multi-phase flow) is developed to investigate the SWR phenomena based on parallel computation technology. A compressible three-fluid (liquid water, liquid sodium and mixture gas) and one-pressure model is adopted for multi-phase calculation using the HSMAC method. Two types of reactions are considered for the SWR and are implemented to the SERAPHIM code; one is the surface reaction and the other is the gas phase reaction. The surface reaction model assumes that liquid sodium reacts with water vapor on the surface of liquid sodium. An analogy of heat transfer and mass transfer is applied to estimate the reaction rate. The gas-phase reaction designates a phenomenon where water vapor reacts with sodium gas because of the vaporization of liquid sodium by the surface reaction. The ab initio molecular orbital method is applied to investigate the reaction mechanism and to estimate the reaction rate described by the Arrhenius low. Three-dimensional SWR analyses are carried out to estimate a performance of parallel computation and to investigate a characteristic of thermal-hydraulics coupled with the chemical reaction process and an influence of initial pressure on the SWR phenomena. In the performance test, the SERAPHIM code demonstrates a good performance even in a small-scale analysis of 60000 computational cells. It seems promising that the SERAPHIM code is practicable for large-scale SWR analysis without difficulty. The initial pressure affects the flow field, the development of the gas region and the distribution of the high temperature region. However, the maximum value of the gas temperature has an upper bounding of approximately 1400ºC and is almost constant regardless of the initial pressure. The reason of the upper bounding is explained as follows. The hydrogen gas covers up the
L
K
L
K

15
liquid-gas interface because the hydrogen gas is produced most intensively at the interface due to the surface reaction. Consequently, the concentration of the water vapor at the interface decreases and the SWR declines. This results in the upper bounding of the maximum gas temperature. With respect to the pressure independency of the maximum gas temperature, sodium hydroxide is a dominant species of the gas at the high temperature zone in terms of the mass fraction. Heat capacity of sodium hydroxide is not influenced by pressure resulting in almost the same value of maximum gas temperature. [1] R. N. Newman, A. R. Pugh and C. A. Smith, “Liquid Alkali Metals / Explosive interaction between sodium and water, and material wastage in the vicinity of leaks in sodium water heat exchanges”, The British Nuclear Energy Society, London, 85-91, 1973.
[2] H. H. Neely and C. E. Boardman, “Status of U. S. Studies of Failures and Failure Propagation in Steam Generators”, Proceeding of the IAEA/IWGFR Specialists’ Meeting on Steam Generator Failure and Failure Propagation Experience, Aix-en-Provence, France, 1990.
[3] H. Tanabe, Y. Wada, K. Hamada et al., “The Development and Application of Overheating Failure Model of FBR Steam Generator Tubes”, PNC TN9410 98-029, Japan Nuclear Cycle Development Institute (JNC), 1998, [in Japanese].
[4] C. E. Boardman and M. Hui, H. H. Neely, “Test Results of Sodium-water Reaction Testing in Near Prototypical LMR Steam Generator”, Proceeding of the IAEA/IWGFR Specialists’ Meeting on Steam Generator Failure and Failure Propagation Experience, Aix-en-Provence, France, 1990.
[5] T. Morii and Y. Ogawa, “Development and Application of a Fully Implicit Fluid Dynamics Code for Multiphase Flow”, Nuclear Technology, 115, 333-341, 1996.
[6] N. Yoshioka, M. Kishida and Y. Yamada, “Analyses for Experiment on Sodium-Water Reaction Temperature by the CHAMPAGNE code”, JNC TN9440 2000-013, Japan Nuclear Cycle Development Institute (JNC), 2000, [in Japanese].
[7] C.W. Hirt, B.D. Nichols and N.C. Romero, “SOLA-A Numerical Solution Algorithm for Transient Fluid Flow”, LA-5852, (LASL), April 1975.
[8] M. Benedict, G. B. Webb and L.C. Rubin, “An Empirical Equation for Thermodynamic Properties of Light Hydro-carbons and Their Mixtures”, Journal of Chemical Physics, 8, 344, 1940.
[9] Y. Matsumoto and Y. Murai, “Numerical Simulation of Bubble Plume in a Tank with Free Surface”, Transaction of the Japan Society of Mechanical Engineering B, 61, 588, 2818, 1995, [in Japanese].
[10] T. Takata and A. Yamaguchi, “Computational Study on Multi-Phase Reacting Flow of Sodium-Water Reaction in Liquid Metal Fast Reactor”, Proceeding of Third Japan-Korea Symposium on Nuclear Thermal Hydraulics and Safety (NTHAS3), Kyeongju, Korea, Oct. 13-16, p.128-134, 2002.
[11] A.R.Edwards and T.P.O'Brien, “Studies of phenomena connected with the depressurization of water reactors”, Journal of British Nuclear Energy Society, 9, 125-135, 1970.
[12] U. Nagashima, personal communication [13] Gaussian, Inc., Carnegie Office Park, Building 6, Suite 230 Carnegie, PA 15106 USA [14] Y. Okano and A. Yamaguchi, “Numerical Simulations Study on Sodium-Water Reaction. (4) Theoretical Adiabatic Temperature of Sodium-Water Reaction Zone”, 2001 Annual Meeting of AESJ, I4, 2001, [in Japanese].
[15] M. J. Pilling, “Reaction Kinetics”, Clarendon Press, Oxford, 1974. [16] E. Herbst, “Atomic Molecular and Optical Physics Reference Book”, G. Drake (New York : AIP), 429, 1996.
[17] M. W. Chase, Jr., C. A. Davies, J. R. Downey, Jr., et al., JANAF Thermochemical Tables Third Edition Part II, Cr-Zr, American Institute of Physics, Inc., New York, 1243-1245 (1986).