nurturing a culture of value-based care for lasting results
TRANSCRIPT

Nurturing A Culture of Value-Based Care
for Lasting ResultsR. Lawrence Moss, MD
President and Chief Executive OfficerNemours Children’s Health System


My Goals as CEO of Nemours
1. Raise awareness of the POWER of investing in children’s health
2. Transform the way America pays for children’s health
3. Fundamentally change and expand our country’s definition of health in children
1.
2.
3.

Nemours Children’s Health System
A leading multi-state, multi-site children’s health system Commitment to all aspects of children’s health Enduring legacy of Alfred I. duPont Academic pediatric system fully-committed to the
tripartite mission of clinical care, research and education
By the Numbers1.8 million Unique patients/annual encounters874 Employed physicians8,000 Employees3,800 Trainees1.7 million Annual Revenue

One premise:Investing in children’s health is the single most powerful means to insure a healthy generation of Americans and a robust economy.
One action:We must transform our definition of child health and the way we pay for it to leverage this power.

We spend $3.5 trillion annually (18% of America’s GDP)on healthcare.
Almost every penny goes toward paying for the opposite of what we want – HEALTH
Instead of health we pay for volume and complexity
We are getting exactly what we are paying for.

Paying for Volume and Complexity Rather Than Health
United States
OECD Average
MRI exams 97.7 per 1,000 population 46.3 per 1,000 population
CT scanners 40.7 per million population 22.6 per million population
CT exams 265.0 per 100,000 population 123.8 per 1,000 population
Tonsillectomy 254.4 per 100,000 population 130.1 per 100,000 population
Coronary bypass 79.0 per 100,000 population 47.3 per 100,000 population
Knee replacements 226.0 per 100,000 population 121.6 per 100,000 population

Although the United States spends more on health care than other developed countries, its health outcomes are generally not any better
SOURCE: Organization for Economic Cooperation and Development, OECD Health statistics 2019, July 2019. NOTES: Data are not available for all countries for all metrics. Data are for 2017 or latest available. ©2019 Peter G. Peterson Foundation

What comprises health?Degree of Influence in Shaping the Health of Populations
The Case For More Active Policy Attention To Health Promotion: J. Michael McGinnis;; Pamela Williams-Russo and James R. Knickman

The conditions in which people are born, grow, live, work and age.
Shaped by the distribution of money, power and resources at global, national and local levels.
Responsible for most health disparities.
The Social Determinants of HealthWhy they matter - ESPECIALLY to Children

The conditions in which people are born, grow, live, work and age.
Shaped by the distribution of money, power and resources at global, national and local levels.
Responsible for most health disparities.
The Social Determinants of HealthWhy they matter - ESPECIALLY to Children

Lack of Education Links Directly to High Risk of Death

The Most Powerful Intervention to Promote Health:STAY IN SCHOOL

The conditions in which people are born, grow, live, work and age.
Shaped by the distribution of money, power and resources at global, national and local levels.
Responsible for most health disparities.
The Social Determinants of HealthWhy they matter - ESPECIALLY to Children

Impact of Food Insecurity on Health Outcomes
0
0.5
1
1.5
2
2.5
3
3.5
Fair or Poor Health Behavioral Problems Devleopmental Delays Stomach Aches Headaches Colds
Food Insecure Young Children Face Increased Chances of Various Health Risks
Food Secure Food Insecure
The Children’s Defense Fund, The Early Childhood Hunger Imperative (Jan. 2016)

The conditions in which people are born, grow, live, work and age.
Shaped by the distribution of money, power and resources at global, national and local levels.
Responsible for most health disparities.
The Social Determinants of HealthWhy they matter - ESPECIALLY to Children

Weinreb et al Pediatrics 102:1998
ED utilization in 1 year: 38% v. 19% Hospitalization for acute disease in 1 year:
11% v. 5% Children in fair or poor health: 12% v. 6% Acute illness symptoms in one month 50% v. 35% Insurance coverage (Medicaid) 99% v. 99%
Housing Status Directly Impacts Child HealthHousing status is an independent variable that correlates with health indices in kids: homeless v. low income

The conditions in which people are born, grow, live, work and age.
Shaped by the distribution of money, power and resources at global, national and local levels.
Responsible for most health disparities.
The Social Determinants of HealthWhy they matter - ESPECIALLY to Children

Your ZIP CODE shouldn’t predict how long you live, BUT IT DOES.
STOCKTON95202Life Expectancy
73IRVINE92606Life Expectancy
88Source: The California Endowment

The conditions in which people are born, grow, live, work and age.
Shaped by the distribution of money, power and resources at global, national and local levels.
Responsible for most health disparities.
The Social Determinants of HealthWhy they matter - ESPECIALLY to Children
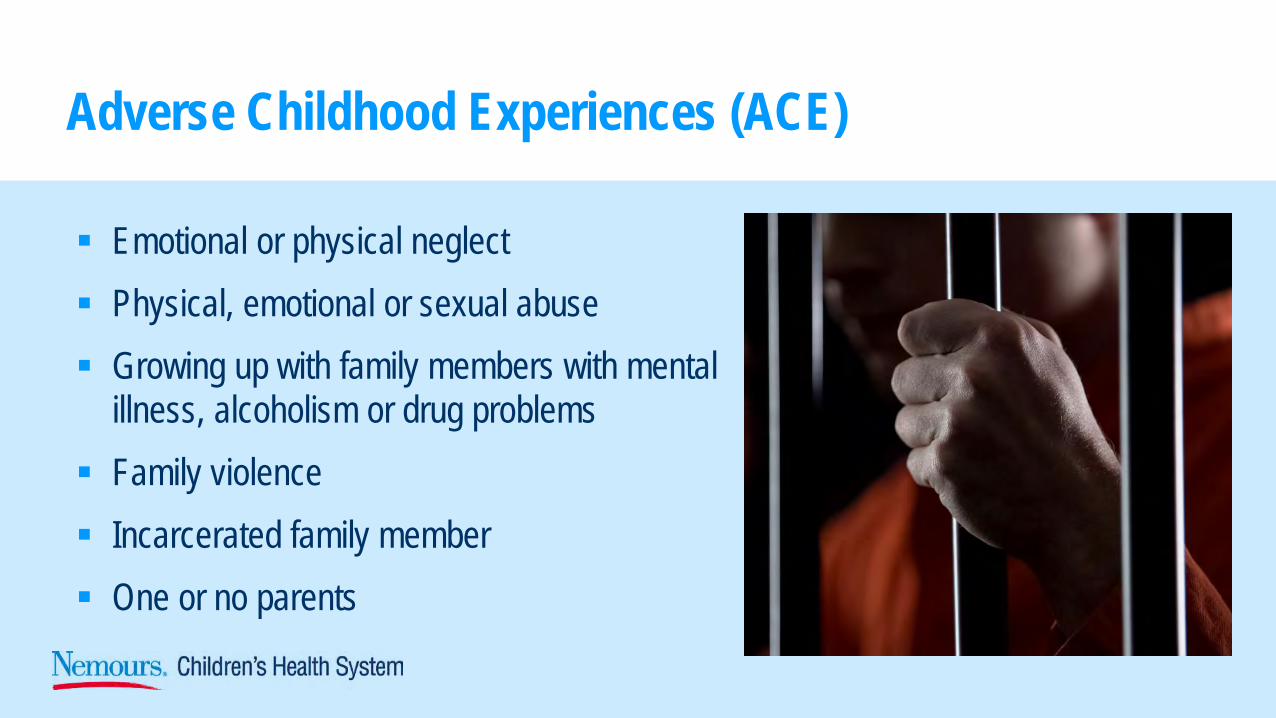
Adverse Childhood Experiences (ACE)
Emotional or physical neglect Physical, emotional or sexual abuse Growing up with family members with mental
illness, alcoholism or drug problems Family violence Incarcerated family member One or no parents

Adverse Childhood Experiences (ACE) Study
Center for Disease Control and Kaiser Permanente Collaboration Ten-year study involving 17,000 people Looked at effects of adverse childhood experiences (trauma)
over the lifespan Largest study ever done on the subject 67% of kids had at least one, 25% had at least two

ACE Study FindingsCompared with people with no ACEs, those with four or more ACEs were:
Twice as likely to smoke Seven times as likely to be alcoholics Six times as likely to have had sex before age 15 Twice as likely to have cancer or heart disease Twelve times more likely to have attempted suicide Men with six or more ACEs were 46 times more likely to have injected drugs
than men with no history of adverse childhood experiences
Source: Adverse Childhood Experiences (ACE) Study. Information available at http://www.cdc.gov/ace/index.htm

Impact of ACEs Over the LifespanNeurological, biological, psychological and social
Changes in brain neurobiology;
Social, emotional & cognitive impairment;
Adoption of risk behaviors (i.e. violence, smoking, substance abuse, self harm, etc.)
Severe and persistent health and social problems resulting in early death
Felitti et al, 1998

Source: Adverse Economic Costs of ACEs in Alaska. Prepared for the Alaska Mental Health Board and the Advisory Board on Alcoholism and Drug Abuse. Available at: http://dhss.alaska.gov/abada/ace-ak/Pages/default.aspx
Health Costs of Adverse Childhood Experiences(in 1/400th of the country!)

Spending on CHILD HEALTH provides the largest lever to impact future generations
TODAY 10-20 YEARS
7%Children
93%Adults
Total Health Care Spending

Does investing in SDOH work?Rigorous, randomized, peer-reviewed, and Nobel Prize
winning work says yes
Abecedarian Preschool Project (RCT)Campbell et al Science 343:2014
WIC Program reduces infant mortalityKhanani et al Am J Pub Health 2015
MEND Program for obesity (RCT)Sacher et al Obesity 2010
Source: James Heckman, Nobel Laureate Economics

Abecedarian Preschool ProjectA social experiment based upon early intellectual stimulation in early childhood
Preschool (Birth – 5)
Two meals and a snack daily
Periodic medical checkups
Primary pediatric care (both well and ill-care)
Health behaviors and lifestyle
Campbell et al Science 343:2014

Lower systolic blood pressure v. control (126 v. 143mmHg)
Less likely to be stage one hypertensive or pre hypertensive
0% exhibited metabolic syndrome v. 25% of a controls
Higher levels of HDL “good cholesterol” (53 v. 42mg/dl)
Lower incidence of severe obesity (11 v. 37%)
Health Outcomes 30 Years LaterAll Changes Statistically Significant at Age 35
James Heckman, Nobel Laureate Economics
Campbell et al Science 343:2014

More likely to engage in regular physical exercise
Less likely to smoke at early age
More likely to eat nutritious food at age 21
Less likely to be overweight in childhood
Less likely to start drinking alcohol before age 17
Behavioral Outcomes 30 Years LaterAll Changes Statistically Significant at Age 35
Source: James Heckman, Nobel Laureate Economics

Increased high school graduation rate
Less likely to be convicted of a crime or incarcerated
Higher median annual income compared to controls
13% return on investment per annum
Two generation effect
Economic Outcomes 30 Years LaterAll Changes Statistically Significant at Age 35
Source: James Heckman, Nobel Laureate Economics
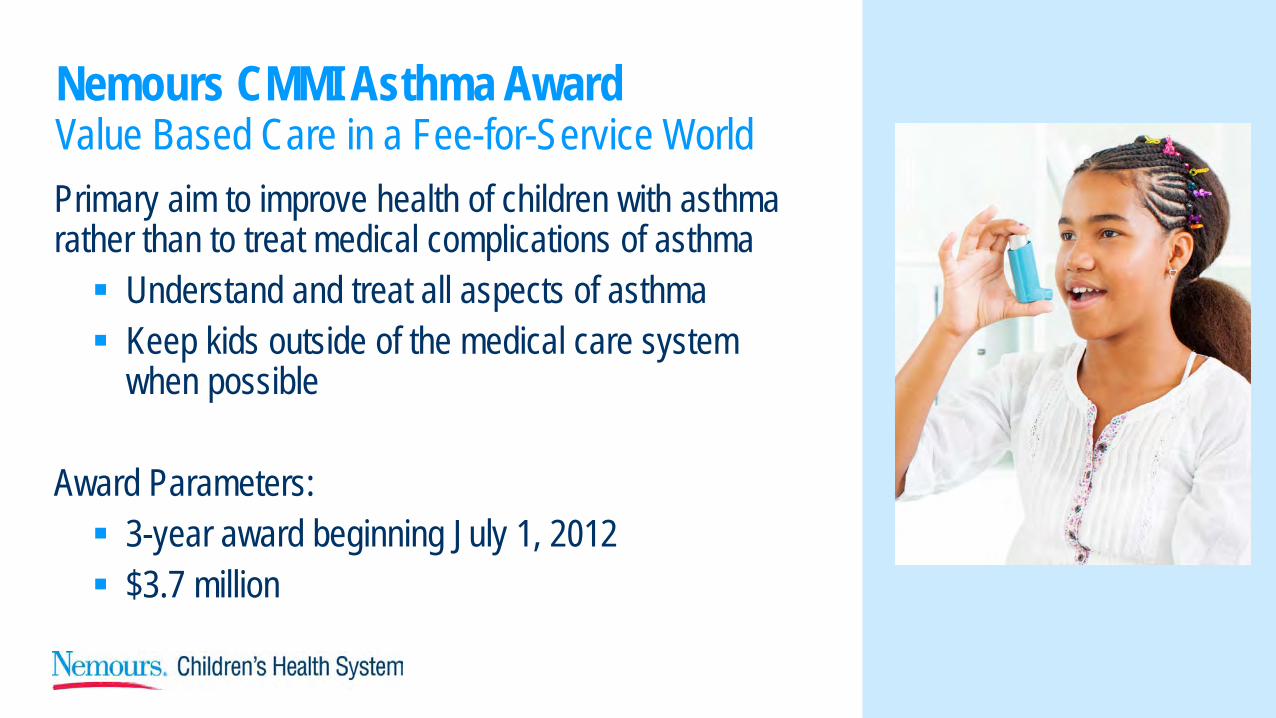
Primary aim to improve health of children with asthma rather than to treat medical complications of asthma Understand and treat all aspects of asthma Keep kids outside of the medical care system
when possible
Award Parameters: 3-year award beginning July 1, 2012 $3.7 million
Nemours CMMI Asthma AwardValue Based Care in a Fee-for-Service World

Navigator/Integrator Approach
Navigator Workforce –Patient Level Link between clinic and home – discovery Case management of non-medical
issues/concerns Home environmental assessments Reinforcement of asthma education
Integrator Workforce –Community Level Link between clinic and community Facilitated partnerships with key
stakeholders (HUD, ALA, DPH, etc.) Community engagement and
mobilization Focus on upstream determinants of
health

Patient Based Results (Internal Data)
Changes to drug formulary – metered dose inhaler. 11,805 children impacted.
Smoke-Free Wilmington Ordinance – 19,224 children impacted
Reducing school bus idling in Wilmington – 14,029 children impacted.
Community Based Results

These interventions work. When we invest in health we get health.Not a single new drug or innovative medical intervention The acuity level and complexity of care markedly decreased
Partnerships – communities, social service agencies, government, schools etc.
These efforts will only be sustainable when financial incentives are aligned Investing in SDOH is a cost to the health system with no financial return The better the investment works the greater the cost
Lessons Learned from “Pay for Health” in a “Pay for Sickness” World

Nemours Value-Based Services Organization
PeopleAll teams under a single leadership structure – ALIGNMENTStructure enables culture
Processes“Your patients” are all of your patients. Not just the ones you are seeingAlign primary care with care coordination and management, CHWs
Technology, Data and AnalyticsSystems to find gaps in care, complex pts, pts under unique contractsIdentify candidates for care managementCompare medical complexity with “events”


Questions?
Children are the human capital of the next generation Impact on adult outcomes is evident as early as birth Massively reduce morbidity and costs in adulthood Poor workforce health costs $530 billion annually Employers pay $880 billion in healthcare costs
annually Households with poor child health have 20% lower
incomes and have $6000 less disposable income
Ill health and poor nutrition have a first-order impact … causing harm that is impossible or very difficult to reverse. In a world where cognitive skills are rising in value, this damage if widespread impairs a country’s economic potential far into the future. — World Bank
Healthy Economy = Investing In Children’s Health

Readiness with payers requires data quality and integrated workflow Ensure payers have the most current list of employed/contracted/affiliated providers
AND clinic locations including provider NPI, not just the payer ID Contractually clear processes for changes, updates AND a turnaround times Ability to share provider data with the payer’s quality program
Patient rosters — the right age patients (relevant to pediatrics), right market area? Format that integrates with your EHR/patient records system is optimal How are updates handled when a patient wants to see a different PCP or lives outside
of your region, or does not reply after multiple attempts to contact?
What risk scoring model/stratification model does the payer use? Integration with in-house models is most efficient for providers and payers
Aligning Readiness With Data

Mutual glide path development to accept financial risk between Nemours and select payersRecognition of spend related to SDoHPediatric quality measures
Recently selected to participate in the Advancing Health Equity: Leading Care, Payment, and Systems Transformation. Three way partnership with a AmeriHealth Caritas Delaware, DMMA and Nemours. Designed to determine effective ways to align and leverage payment and quality
improvement activities to improve health equity.
Partnering with Payers

There’s No Code For This.