nutricia infant nutrition ltd castleview, macroom, co. cork · page 4 section c: control &...
TRANSCRIPT

Environmental Lynch
Nutricia Infant Nutrition Ltd
Castleview, Macroom, Co. Cork
Application Form and supporting information
submitted to the Environmental Protection Agency for
Review of IPPC licence, Reg. No. P0792-02
Matthew Lynch
February 2012
For
insp
ectio
n pur
pose
s only
.
Conse
nt of
copy
right
owne
r req
uired
for a
ny ot
her u
se.
EPA Export 22-02-2012:04:06:38

Introduction
Integrated Pollution Prevention and Control
(IPPC)/Waste Licensing
Review Form and Guidance
Note
for the purposes of
EC Environmental Objectives (Surface Waters) Regulations
2009
Environmental Protection Agency
P.O. Box 3000, Johnstown Castle Estate, Co. Wexford
Lo Call: 1890 335599 Telephone: 053-9160600 Fax: 053-9160699
Web: www.epa.ie Email: [email protected]
EPA Reg. No: (Office use only)
For
insp
ectio
n pur
pose
s only
.
Conse
nt of
copy
right
owne
r req
uired
for a
ny ot
her u
se.
EPA Export 22-02-2012:04:06:38

Contents
INTRODUCTION
This Form is for the purposes of a review of an IPPC/Waste Licence in order to ensure that all authorisations under the EPA Act 1992 to 2007 and the Waste
Management Acts 1996 to 2010 having discharges liable to cause water pollution are in compliance with the EC Environmental Objectives (Surface Waters)
Regulations 2009. While every effort has been made to ensure the accuracy of the material
contained in the Review Form, the EPA assumes no responsibility and gives no guarantees, undertakings and warranties concerning the accuracy, completeness
or up-to-date nature of the information provided herein and does not accept any liability whatsoever arising from any errors or omissions.
The Review Form and all supporting information shall be submitted to the Headquarters of the Agency in a format of a signed original, one hardcopy and
two copies on CD-Rom. In cases where an Environmental Impact Statement (EIS) is required in support of the Review Form, a signed original, one hardcopy plus 16 copies (or 18 copies if the activity is within Energy sector) on CD-Rom
shall be submitted.
All pages, including maps/drawings/plans, shall be no larger than A3 size. All files on CD-Rom shall be submitted in searchable PDF format and be no larger
than 10MB each in size. All CD-Roms shall be labelled with the Licensee’s name, Licence Register Number, address of the activity and name of the file (i.e. Review Form).
For
insp
ectio
n pur
pose
s only
.
Conse
nt of
copy
right
owne
r req
uired
for a
ny ot
her u
se.
EPA Export 22-02-2012:04:06:38
Introduction
CONTENTS
SECTION A: GENERAL........................................................... 1
SECTION B: EMISSIONS ...................................................... 3
SECTION C: CONTROL & MONITORING ................................ 4
SECTION D: EXISTING ENVIRONMENT & IMPACT OF THE
ACTIVITY .........................................................6
SECTION E: STATUTORY REQUIREMENTS ............................ 8
SECTION F: APPROVED ADJUSTMENTS & CONDITIONS ....... 9
SECTION G: DECLARATION ... ERROR! BOOKMARK NOT DEFINED.
ANNEX 1: TABLES/ATTACHMENTS ..................................... 11
For
insp
ectio
n pur
pose
s only
.
Conse
nt of
copy
right
owne
r req
uired
for a
ny ot
her u
se.
EPA Export 22-02-2012:04:06:38

For
insp
ectio
n pur
pose
s only
.
Conse
nt of
copy
right
owne
r req
uired
for a
ny ot
her u
se.
EPA Export 22-02-2012:04:06:38

Page 1
SECTION A: GENERAL
A.1 Licensee
Name*: Nutricia Infant Nutrition Ltd
Address: Castleview
Macroom
Co. Cork
Tel: 026 41302
Fax: 026 42223
e-mail: [email protected]
* This should be the name of the Licensee which is current on the date this IPPC/Waste
Licence Review Form is lodged with the Agency. It should be the name of the legal entity
(which can be a limited company or a sole trader). A trading/business name is not
acceptable.
Name and Address for Correspondence
Only documentation submitted by the Licensee and by the nominated person will be deemed to
have come from the Licensee.
Name: As above
Address:
Tel:
Fax:
e-mail:
Address of registered or principal office of Body Corporate (if applicable)
Address: 70, Sir John Rogerson’s Quay
Dublin 2
Company
Register
No.
384474
Tel: As above
Fax: As above
e-mail: As above
For
insp
ectio
n pur
pose
s only
.
Conse
nt of
copy
right
owne
r req
uired
for a
ny ot
her u
se.
EPA Export 22-02-2012:04:06:38

Page 2
A.2 Location of Activity
Name: Nutricia Infant Nutrition Ltd
Address*: Castleview
Macroom
Co. Cork
Tel: As above
Fax: As above
Contact Name: Michael Herlihy
Position: EHS Manager
e-mail: [email protected]
* Include any townland.
National Grid Reference
(12 digit 6E,6N) 134664E 69935N
Location maps (no larger than A3), appropriately scaled, with legible grid references should be enclosed in Attachment No A.2. The site boundary must be outlined on the map in red colour.
Geo-referenced digital drawing files (e.g. AutoCAD files) in Irish Grid projection of the site
boundary and overall site plan, including labelled emission points to surface water and
their monitoring and sampling locations, are also required.
For
insp
ectio
n pur
pose
s only
.
Conse
nt of
copy
right
owne
r req
uired
for a
ny ot
her u
se.
EPA Export 22-02-2012:04:06:38

Page 3
SECTION B: EMISSIONS
B.1 Emissions to Surface Waters &/or Ground
Describe the nature of emissions from the activity to receiving surface waters and/or
ground. Specify which of these emissions are process discharges and storm/surface water
discharges.
Tables B.1(i) and B.1(ii) should be completed.
The applicant should address in particular any emission point where the substances listed
in the Schedule of S.I. No. 394 of 2004 are emitted.
Please note that monitoring of the discharge(s) for the purposes of Table B.1(ii) shall be
undertaken for the list of parameters listed in Table D.1(i) as appropriate. Where other
relevant substances have been identified, during the Assessment of Impact on Receiving
Surface Water requested under Section D.1 of this Review Form, monitoring of the
discharge upstream and downstream for the relevant parameters shall also be included.
A summary list of the emission points, together with maps/drawings (no larger than A3)
and supporting documentation should be included as Attachment No B.1.
There is only one emission point from the activity to surface waters (SW-1). There is no
emission to ground waters. The emission point to surface waters is shown on the
attached location maps. The emissions consist mainly of treated wastewaters arising from
normal wash-downs of process equipment.
B.2 Tabular Data on Emission Points to surface water
Licensees should submit the following information for each emission point to surface
water:
Point Code Easting Northing Verified Emission
SW-1 135024E 70749N N All emissions
to waters
* SW = Surface Water
An individual record (i.e. row) is required for each emission point. Acceptable file formats
include Excel, Access or other upon agreement with the Agency.
For
insp
ectio
n pur
pose
s only
.
Conse
nt of
copy
right
owne
r req
uired
for a
ny ot
her u
se.
EPA Export 22-02-2012:04:06:38

Page 4
SECTION C: CONTROL & MONITORING
Describe the proposed technology and other techniques for preventing or,
where this is not possible, reducing emissions from the installation/facility.
C.1 Treatment, Abatement and Control Systems
An overview/summary of treatment/abatement systems for effluent emissions should be
included together with schematics as appropriate.
For each Surface Water Emission Point identified complete Table C.1(i).
Supporting information should form Attachment No C.1.
An overview of effluent treatment/abatement systems, along with a detailed
account of improvements and upgrades to the WWTP in recent years is given in
Attachment No. C.1
Normal operation and variations for start-up and shutdown should be described.
Anticipated malfunctions and known problems associated with the treatment should be
highlighted.
Proposed monitoring to be undertaken for influent(s) to treatment plant, and in-
treatment monitoring required for the management of the treatment plant should be
detailed.
C.2 Monitoring and Sampling Points
Identify monitoring and sampling points and outline proposals for monitoring emissions to
surface water bodies.
Table C.2(i) should be completed (where relevant) for emissions to surface water.
Where ambient environment monitoring is carried out or proposed, Table C.2(ii) should
be completed as relevant for each environmental medium and at least 12 samples should
be taken at regular intervals.
Include details of monitoring/sampling locations and methods.
Supporting information should form Attachment No C.2.
Monitoring has been carried out on an ongoing basis at the only emission
point (SW-1) in accordance with licence conditions. Details of ambient
monitoring are given in Table C.2 (ii), Table D.1 (i) and Section D (dealing
with the assessment of the Assimilative Capacity of the river).
For
insp
ectio
n pur
pose
s only
.
Conse
nt of
copy
right
owne
r req
uired
for a
ny ot
her u
se.
EPA Export 22-02-2012:04:06:38

Page 5
C.3 Tabular Data on Monitoring and Sampling Points
Licensees should submit the following information for each monitoring and sampling
point:
Point Code Point Type Easting Northing Verified Pollutant
SW-1 M
=Monitoring
S
=Sampling
(both)
135024E
70749N N = GPS
not used
List of
parameters
as per
Licence
Conditions
An individual record (i.e. row) is required for each monitoring and sampling point.
Acceptable file formats include Excel, Access or other upon agreement with the Agency.
Point source monitoring/sampling refers to monitoring from specific emission points (e.g.
from a wastewater treatment plant). Ambient monitoring includes monitoring of river
quality upstream/downstream of an effluent discharge.
For
insp
ectio
n pur
pose
s only
.
Conse
nt of
copy
right
owne
r req
uired
for a
ny ot
her u
se.
EPA Export 22-02-2012:04:06:39

Page 6
SECTION D: EXISTING ENVIRONMENT & IMPACT OF THE ACTIVITY
D.1 Assessment of Impact
Describe the existing environment in terms of water quality with particular reference to
environmental quality objectives and standards as specified in the EC Environmental
Objectives (Surface Waters) Regulations 2009 S.I. No. 272 of 2009. Table D.1(i) should
be completed as appropriate.
Indicate whether or not the activity complies with the requirements of the EC
Environmental Objectives (Surface Waters) Regulations 2009 S.I. No. 272 of 2009 and
the EC Environmental Objectives (Groundwater) Regulations 2010 S.I. No. 9 of 2010.
The Licensee should conduct an assessment of impact of discharge(s) from the
installation/facility on receiving surface water and/or groundwater. In undertaking this
assessment the Licensee shall have particular regard to substances used in the
manufacturing processes likely to result in discharges. The licensee shall have regard for
the environmental quality objectives and standards specified for protected areas and/or
the standards specified in the Schedules of the EC Environmental Objectives (Surface
Waters) Regulations 2009 S.I. No. 272 of 2009. When completing any assimilative
capacity calculations have regard to the Water Services Training Group ‘Guidance to
Applicant – Discharge to Surface Waters’ available at
http://www.wsntg.ie/publications/index.asp and other standard guidance.
If the process discharges are to coastal, transitional waters or lakes, the assessment may
require a modelling study. The modelling study shall include estimates on what the
resultant concentrations of the permitted substances in the receiving water body will be
upon discharge at the current licence limits.
Regardless of the receiving water body type, determine the maximum allowable
discharge concentrations to achieve compliance with the 95%ile good status limits. N.B.
If the discharge is to a water body that is already achieving high status, or if the
discharge is to waters draining to the surface water bodies identified under the First
Schedule of the EC Environmental Objectives (Freshwater Pearl Mussel) Regulations
2009, compliance must be with 95%ile high status limits.
State distance from the process discharges to a nearest downstream water dependent
Protected Area. Include the name and code of this Protected Area.
Full details of the assessment, including a copy of an Environmental Impact Statement if
it was required for the purposes of obtaining planning permission(s), should be submitted
as Attachment No D.1.1.
Where necessary, the Licensee should supply detailed information on the proposals to
comply with the requirements of the EC Environmental Objectives (Surface Waters)
Regulations 2009 S.I. No. 272 of 2009 including a detailed timeframe for any proposed
works in Attachment No D.1.2.
See Attachment No. D.1.1
For
insp
ectio
n pur
pose
s only
.
Conse
nt of
copy
right
owne
r req
uired
for a
ny ot
her u
se.
EPA Export 22-02-2012:04:06:39

Page 7
D.2 Environmental Considerations and Best Available Techniques (BAT)
Describe, in outline, the main alternatives, if any, to the proposals contained in the
Review Form.
Describe any environmental considerations which were made with respect to the use of
cleaner technologies, waste minimisation and raw material substitution.
Describe the measures proposed or in place to ensure that:
(a) the best available techniques are or will be used to prevent or eliminate or, where
that is not practicable, generally reduce an emission from the activity;
(b) no significant pollution is caused;
(c) waste production is avoided in accordance with Council Directive 75/442/EEC of 15
July 1975 on waste; where waste is produced, it is recovered or, where that is
technically and economically impossible, it is disposed of while avoiding or reducing
any impact on the environment;
(d) energy and other resources are used efficiently;
(e) the necessary measures are taken to prevent accidents and limit their
consequences; and,
(f) the necessary measures are taken upon definitive cessation of activities to avoid
any pollution risk and return the site of operation to a satisfactory state.
This section should present a statement on energy efficiency at the site to include, where
appropriate, an energy audit with reference to the EPA Guidance document on Energy
Audits. Licensees should have regard to Section 5 of the EPA Acts 1992 and 2003 in
selecting BAT and in particular the following:
• The use of low-waste technology;
• The use of less hazardous substances;
• The furthering of recovery and recycling of substances generated and used in
the process and of waste where appropriate;
• Comparable processes, facilities or methods of operation, which have been
tried with success on an industrial scale;
• Technological advances and changes in scientific knowledge and
understanding;
• The nature, effects and volume of the emissions concerned;
• The commissioning dates for new or existing facilities;
• The length of time needed to introduce the BAT;
• The consumption and nature of raw materials, including water, used in the
process and their energy efficiency;
• The need to prevent or reduce to a minimum the overall impact of the
emissions on the environment and the risks to it;
• The need to prevent accidents and to minimize the consequences for the
Environment; and,
• The information published by the Agency in the form of sectoral BAT
Guidance documents and the relevant BREF documents published by the EC
(available for download at http://eippcb.jrc.es/ and at www.epa.ie).
For
insp
ectio
n pur
pose
s only
.
Conse
nt of
copy
right
owne
r req
uired
for a
ny ot
her u
se.
EPA Export 22-02-2012:04:06:39

Page 8
Environmental Considerations and Best Available Techniques (BAT)
All activities on the Nutricia site follow best environmental practice and incorporate
BAT as defined in the EPA’s BAT Guidance Note for the Dairy Processing Sector. See
Attachment D.2 illustrating the implementations of BAT at the Nutricia site.
SECTION E: STATUTORY REQUIREMENTS
E.1 Best Environmental Practices – Compliance with Legislation
Demonstrate if the best environmental practices are in place for control of diffuse
emissions from the installation/facility as set out in the following legislation:
(a) a specification prepared by the Agency in accordance with Section 5 of the
Environmental Protection Agency Act 1992 as amended by Section 7 of the
Protection of the Environment Act 2003;
(b) the Urban Waste Water Treatment Regulations 2001 (S.I. No. 254 of 2001)
as amended by the Urban Waste Water Treatment (Amendment)
Regulations 2004 (S.I. No. 440 of 2004) or any future amendment thereof;
(c) the European Communities (Good Agricultural Practice for Protection of
Waters) Regulations 2009 (S.I. No. 101 of 2009) or any future amendment
thereof;
(d) the Local Government (Water Pollution) Act, 1977 (Control of Cadmium
Discharges) Regulations 1985 (S.I. No. 294 of 1985);
(e) the Local Government (Water Pollution) Act, 1977 (Control of
Hexachlorocyclohexane and Mercury Discharges) Regulations 1986 (S.I. No.
55 of 1986);
(f) the Local Government (Water Pollution) Acts, 1977 and 1990 (Control of
Carbon Tetrachloride, DDT and Pentachlorophenol Discharges) Regulations
1994 (S.I. No. 43 of 1994); and,
(g) measures or controls identified in a pollution reduction plan for the river
basin district prepared in accordance with Part V of the EC Environmental
Objectives (Surface Waters) Regulations 2009 S.I. No. 272 of 2009 for the
reduction of pollution by priority substances or the ceasing or phasing out of
emissions, discharges and losses of priority hazardous substances.
This Section requires the applicant to demonstrate if the best environmental practices
are in place for control of diffuse emissions from the installation/facility as set out in the
seven pieces of legislation and statutory specifications or measures listed in the
Guidance Note. Diffuse emissions, which typically arise from agricultural, mining or
forestry operations, do not arise in this case. All emissions arising here are from point
sources. The need to demonstrate best environmental practices for control of diffuse
emissions therefore does not arise.
For
insp
ectio
n pur
pose
s only
.
Conse
nt of
copy
right
owne
r req
uired
for a
ny ot
her u
se.
EPA Export 22-02-2012:04:06:39

Page 9
SECTION F: APPROVED ADJUSTMENTS & CONDITIONS
Where the Office of Environmental Enforcement (OEE) of the Agency has agreed any
variations or adjustments to the conditions of the existing licence, the licensee must
supply a schedule detailing these agreed variations and adjustments to the existing
licence conditions. An updated, scaled drawing of the site layout (no larger than A3)
providing visual information on such adjustments or variations where appropriate should
be included.
In the case of once-off assessments/ reports required under conditions of the existing
licence the licensee must supply a schedule detailing those assessments/ reports that
have been completed and agreed with the Office of Environmental Enforcement (OEE) or
as otherwise agreed.
Attachment No F1 shall include the schedule of variations and/or adjustments together
with the updated drawing.
Condition
No.
Existing
Condition
Proposed Wording
(where
appropriate)
OEE
Agreement
Reference
Description
Attachment No. F1 contains details of a Technical Amendment issued by EPA on 17
October 2011 amending the original (2007) IPPC licence.
For
insp
ectio
n pur
pose
s only
.
Conse
nt of
copy
right
owne
r req
uired
for a
ny ot
her u
se.
EPA Export 22-02-2012:04:06:39

Page 10
For
insp
ectio
n pur
pose
s only
.
Conse
nt of
copy
right
owne
r req
uired
for a
ny ot
her u
se.
EPA Export 22-02-2012:04:06:39

Page 11
ANNEX 1: TABLES/ATTACHMENTS
For
insp
ectio
n pur
pose
s only
.
Conse
nt of
copy
right
owne
r req
uired
for a
ny ot
her u
se.
EPA Export 22-02-2012:04:06:39

Page 12
TABLE B.1(i): EMISSIONS TO SURFACE WATERS (One page for each emission)
Emission Point:
Emission Point Ref. No.: SW-1
Source of Emission: All wastewater and surface waters from the site
Location : River Lee/Carrigadrohid Reservoir, opposite Coolcower House (see attached Map)
Grid Ref. (12 digit, 6E,6N): 135024E 70749N
Name of receiving waters: River Lee/Carrigadrohid Reservoir
Flow rate in receiving waters: N.A. m3.sec-1 Dry Weather Flow
0.86 m3.sec-1 95%ile flow
Emission Details:
(i) Volume to be emitted
Normal/day N.A. m3 Maximum/day 2,400 m3
Maximum rate/hour 100 m3
(ii) Period or periods during which emissions are made, or are to be made, including daily or seasonal variations (start-up /shutdown
to be included):
Periods of Emission (avg) 60 min/hr 24 hr/day 365 day/yr
For
insp
ectio
n pur
pose
s only
.
Conse
nt of
copy
right
owne
r req
uired
for a
ny ot
her u
se.
EPA Export 22-02-2012:04:06:39

Page 13
TABLE B.1(ii): EMISSIONS TO SURFACE WATERS - Characteristics of the emission (One table per emission point)
Emission Point Reference Number: SW-1
Parameter Prior to treatment As discharged % Efficiency
Max. hourly
average
(mg/l)
Max. daily
average
(mg/l)
kg/day kg/year Max. hourly
average
(mg/l)
Max. daily
average
(mg/l)
kg/day kg/year
BOD 15 36
COD 70 168
Suspended Solids 25 60
Orthophosphate 1.0 2.4
Total phosphorus 1.5 3.6
Total Oxidised
Nitrogen
15 36
Ammonia 2 4.8
Oils, fats & greases 10 24
Mineral oils 1 2.4
Note: Historical emission data are not relevant to the emissions that will arise when the current extension is completed, as provided for under the
existing licence. The above Table is therefore completed on the basis of anticipated emissions when the extension, which is currently under
construction, is fully operational. See also Attachment No. D.1.1 in respect of this.
For
insp
ectio
n pur
pose
s only
.
Conse
nt of
copy
right
owne
r req
uired
for a
ny ot
her u
se.
EPA Export 22-02-2012:04:06:39

Page 14
TABLE C.1(i): ABATEMENT/TREATMENT CONTROL
Emission Point Reference Number: SW-1
Control 1
parameter
Equipment 2 Equipment
maintenance
Equipment
calibration
Equipment
back-up
Monitoring to
be carried out 3
Monitoring
equipment
Monitoring
equipment
calibration
Flow Flow meters Yes Yes Yes Flow Flow meters Annual
calibration
Inlet COD Hach Lab
equipment
Yes Yes Yes COD Hach Annual
calibration
pH in balance
tank
pH meter Yes Yes Yes pH pH probes and
meters
Annual
calibration
Oxygen in
balance tank
and oxidation
ditch
DO probe &
meter
Yes Yes Yes DO DO probe &
meter
Annual
calibration
Flows through
the WWTP
plant
Pumps Yes Yes Duty and
standby pumps
Flows Flow meters Annual
calibration
Operation of
aerators
Aerators and
motors
Yes Yes Duty and
standby
equipment
Aerator depth
and speed of
rotation
Gauges and
meters
Annual
calibration
Phosphate
removal
Dosing pumps Yes Yes Duty and
standby
equipment
Total P Lab equipment Annual
calibration
MLSS Lab equipment Yes Yes Yes MLSS and SVI Lab equipment Annual
calibration
1 List the operating parameters of the treatment/abatement system which control its function. 2 List the equipment necessary for the proper function of the abatement/treatment system. 3 List the monitoring of the control parameter to be carried out.
For
insp
ectio
n pur
pose
s only
.
Conse
nt of
copy
right
owne
r req
uired
for a
ny ot
her u
se.
EPA Export 22-02-2012:04:06:39

Page 15
TABLE C.2(i): EMISSIONS MONITORING AND SAMPLING POINTS (One table per monitoring point)
Emission Point Reference Number: SW-1
Parameter Monitoring frequency Accessibility of Sampling
Points
Sampling method Analysis method/
technique
Flow
Continuous Good Flow meter with recorder Standard method
Temperature
Continuous Good On-line temperature
probe
Standard method
BOD
Weekly Good Standard method Standard method
COD
Daily Good Standard method Standard method
SS
Daily Good Standard method Standard method
Orthophosphate
Daily Good Standard method Standard method
Total P
Weekly Good Standard method Standard method
NH3-N
Daily Good Standard method Standard method
Total Nitrogen
Daily Good Standard method Standard method
OFG
Monthly Good Standard method Standard method
Mineral oils
Monthly Good Standard method Standard method
Toxicity
As required Good Standard method Standard method
For
insp
ectio
n pur
pose
s only
.
Conse
nt of
copy
right
owne
r req
uired
for a
ny ot
her u
se.
EPA Export 22-02-2012:04:06:39

Page 16 16
TABLE C.2(ii): AMBIENT ENVIRONMENT MONITORING AND SAMPLING POINTS (One table per monitoring point)
Monitoring Point Reference Number: N.A. (See Note below) _________
Parameter Monitoring frequency Accessibility of
Sampling point
Sampling method Analysis method/
technique
Note: There are no requirements in the licence for monitoring of phsico-chemical parameters in the receiving water. Such monitoring
has, however, been carried out from time to time and reported to EPA as required by the Agency, e.g. the Report by Malone O’Regan in
June 2010. See also the results of river water monitoring for the purpose of this licence review, in Attachment No. D.1.1.
For
insp
ectio
n pur
pose
s only
.
Conse
nt of
copy
right
owne
r req
uired
for a
ny ot
her u
se.
EPA Export 22-02-2012:04:06:39

Page 17 17
Table D.1(i) RECEIVING WATER SURFACE WATER QUALITY
Monitoring Point/Grid Reference: _____Lee Bridge (Upstream)____________________________
Parameter Results 1
(mg/l)
Sampling
method
(grab, drift
etc.)
Normal
Analytical
Range
Analysis
method/
technique
Date Date Date Date Date Date Date Date Date Date Date Date
pH
Temperature
Electrical
conductivity EC
Ammonia (as N)
Chemical oxygen
demand
Biochemical
oxygen demand
Dissolved oxygen
DO
Total Nitrogen
(as N)
Nitrite (as N)
Nitrate (as N)
Total Phosphorous
(as P)
OrthoPhosphate
(as P)
1 At least 12 samples should be taken at regular intervals.
Provide summary of the monitoring results: See note on previous Table and results in Attachment No. D.1.1.
For
insp
ectio
n pur
pose
s only
.
Conse
nt of
copy
right
owne
r req
uired
for a
ny ot
her u
se.
EPA Export 22-02-2012:04:06:39

Page 18
Attachment No. C.1
Description of wastewater treatment plant (WWTP) (extracted from AER prepared for Nutricia by Malone O’Regan and submitted to EPA March 2011)
WWTP layout and performance The main characteristics of the WWTP are summarised below: • The Nutricia WWTP is an extended aeration activated sludge plant with simultaneous nitrification and denitrification, i.e. both reactions taking place in the aeration tank. • A Dissolved Air Flotation (DAF) unit removes fat from the screened influent and the effluent discharges to the aerated balance tank. • The pH is adjusted in the balance tank and the effluent discharges to the oxidation ditch. • Ferric sulphate is dosed at a constant rate as a coagulant in order to remove Ortho-phosphates. • Tertiary sand filters polish the effluent before it is discharged to the river Lee. • The treatment plant performs well when dealing with organic loading from the production plant, as measured by effluent COD and Suspended Solids. • The influent to the WWTP is fluctuates significantly, both in terms of volumes and COD/Nutrient concentrations. • Washing events in the process area generate shock loads generally characterized by elevated volumes and high COD and Nitrogen concentrations in the influent. • At winter time (usually between November and January), a seasonal three months stoppage of some production processes results in a dramatic fall in COD loading to the treatment plant (as low as 100mg/l compared with typically 1000-2000mg/l)
Investigations and upgrades to the WWTP A significant amount of work, resources and investment has been expended to improve the performance of the onsite WWTP. In 2009 the following upgrades were implemented: • The anoxic area in the oxidation ditch was relocated from the east to the west section in order to enhance the denitrification process; • A tracking system for the usage of caustic and nitric acid in the balance tank was put in place in order to improve control of the consumption of these
For
insp
ectio
n pur
pose
s only
.
Conse
nt of
copy
right
owne
r req
uired
for a
ny ot
her u
se.
EPA Export 22-02-2012:04:06:39

Page 17 19
chemicals and the resulting pH values of the water pumped to the oxidation ditch; • Portable DO, ORP and pH meters were purchased in order to monitor these parameters at different locations at the WWTP, thus allowing an improved understanding of the behaviour of the plant at any time; • A second pump was installed in order to increase the recycling of activated sludge to the oxidation ditch. The rate of activated sludge recycling was therefore increased from 50 to 90-100m3/hr; • A 100m3 divert tank was commissioned in October 2009 to hold shock loads from washings and other process outputs resulting in more stable feeding to the balance tank and onwards to the oxidation ditch during high COD loading. The release of influent from the divert tank to the balance tank is now regulated by automatic control from the process building; • The concentration of Mixed Liquor Suspended Solids (MLSS) in the oxidation tank, which is an indicator of the bacterial population undertaking the carbon and nutrients removal, was increased from typically 2000-2500mg/l to 3000mg/l; • In order to compensate for the fall in COD loading occurring at winter time, as described above, a system of dosage of molasses was implemented in order to provide the carbon necessary to the nitrification/denitrification processes; • The pump transferring the effluent from the balance tank to the oxidation ditch was upgraded from a constant pumping rate to an adjustable speed setting. This allows the optimisation the treatment plant based on parameters such as the COD load in the influent and the mixing conditions in the balance tank; • Extensive testing was carried out between mid-August and mid-December 2009 in order to characterise the three main streams which compose the inlet to the WWTP and assess the efficiency of the divert tank in reducing the shock loads to the WWTP. Daily volumes and COD concentrations were recorded for each of the effluents from the milk intake & dairy, the preparation area and the evaporator. This investigation is on-going, but the results available to date indicate that the effluent from the preparation area represents only a small fraction of the load, while the contribution of effluent from the milk intake & dairy to the total load decreases drastically during the winter months. In addition, the load generated by the evaporator is very fluctuating, with significant peaks corresponding to the process washing events; and • In instances of elevated levels of COD in the influent, the cut off set point for DO was increased to 0.4 mg/l in the oxidation ditch in order to ensure that sufficient oxygen is available to the bacterial population. Following the implementation of the items listed above, improvements of the results achieved by the WWTP were recorded, together with a reduction of the COD shock loads to the plant. In 2010 further investment and resources were made available in order to further investigate and improve the performance of the WWTP. In 2010 the following upgrades/improvements were implemented: • The timings for the addition of caustic and acid were adjusted to allow a longer
For
insp
ectio
n pur
pose
s only
.
Conse
nt of
copy
right
owne
r req
uired
for a
ny ot
her u
se.
EPA Export 22-02-2012:04:06:39

Page 16 20
mixing time; • Inlet waste streams were analysed in order to identify sources of NH3, COD and TON as requested by the EPA; • A level control system was installed at the balance tank which ensures efficient mixing of caustic and/or nitric acid and also aids in the buffering process and reduces the risk of shock loads to the ditch; • The recirculation of wastewater through the oxidation ditch was further increased to 150m3 from 100m3 giving further opportunity for nitrification and denitrification; • A new variable speed drive for the oxidation ditch rotor was installed which eliminated interference with the pH signal which was occurring; • An assimilative capacity assessment was undertaken to determine the impact of the non-compliances on the existing water quality; • A dual pH control system was installed. There are now two probes installed in a recirculation tank. The probes are alarmed and will alarm if the pH differs by more than 0.5; • The target oxygen in the oxidation ditch was set as 0.8mg/l (up from 0.4mg/l); • Automation and interlocking of dosing pump. This measure ensures that if the circulation pump stops that the dosing pump also stops; • An additional control valve installed in the feed line from the bulk caustic tank to prevent leakage of caustic through the system; • Acid washes are carried out every two weeks to prevent a scale build up on the conductivity probe which can lead to inaccurate readings and overdosing of caustic; • A pH alarm was installed in the control room for the pH of the balance tank. If the pH goes above 9.5 for 1 hour an alarm will activate in the control room; • Nitrifying bacteria were added to the oxidation ditch; • CCTV was installed in the CIP rooms which allows production leaks to be detected quickly; and • The WWTP operator attended a 5 day wastewater treatment accredited course. In total, over the years 2008, 2009 and 2010 approximately €315,000 was invested in
upgrading and improving the performance of the WWTP. This has resulted in a very high
level of compliance with IPPC licence Conditions since June 2010.
For
insp
ectio
n pur
pose
s only
.
Conse
nt of
copy
right
owne
r req
uired
for a
ny ot
her u
se.
EPA Export 22-02-2012:04:06:39

Page 17 21
Attachment No. D.1.1
Section D. Existing environment and impact of the activity
D.1 Assessment of impact on receiving water
D.1.1 Introduction
This Section describes the existing surface water environment in terms of water quality, with
particular reference to the environmental quality standards specified in the European Communities
Environmental Objectives (Surface Waters) Regulations 2009 (SI No. 272 of 2009), presents an
assessment of the impact of discharges from the Nutricia plant at Macroom on the receiving water
and indicates whether or nor the activity complies with the Surface Waters Regulations.
D.1.2 Relevant river monitoring and wastewater discharge data
In order to assess the impact of the discharge from Nutrica on the receiving water (the River
Lee/Carrigadrohid Reservoir) a monitoring programme was carried out in the river upstream of the
outfall point as required by the Application form. The analyses were done at an accredited
laboratory. Table D.1.2.1 presents the results for the key parameters monitored:
Table D.1.2.1. Upstream monitoring results (at Lee Bridge)
Date BOD (mg/l) Total Ammonia
(mg/l as N)
Orthophosphate
(mg/l as P)
16/12/ 2011 1.73 0.020 0.006
20/12/2011 1.57 0.058 0.009
10/1/2012 1.57 0.016 <0.003
11/1/2012 1.50 0.017 <0.003
12/1/2012 1.30 0.020 <0.003
16/1/2012 1.30 0.022 0.003
17/1/2012 1.31 0.039 <0.003
18/1/2012 1.70 0.026 0.005
23/1/2012 1.39 0.022 0.004
24/1/2012 1.51 0.031 0.004
26/1/2012 1.65 0.030 0.006
Average 1.50 0.027 0.004
For
insp
ectio
n pur
pose
s only
.
Conse
nt of
copy
right
owne
r req
uired
for a
ny ot
her u
se.
EPA Export 22-02-2012:04:06:39
Page 16 22
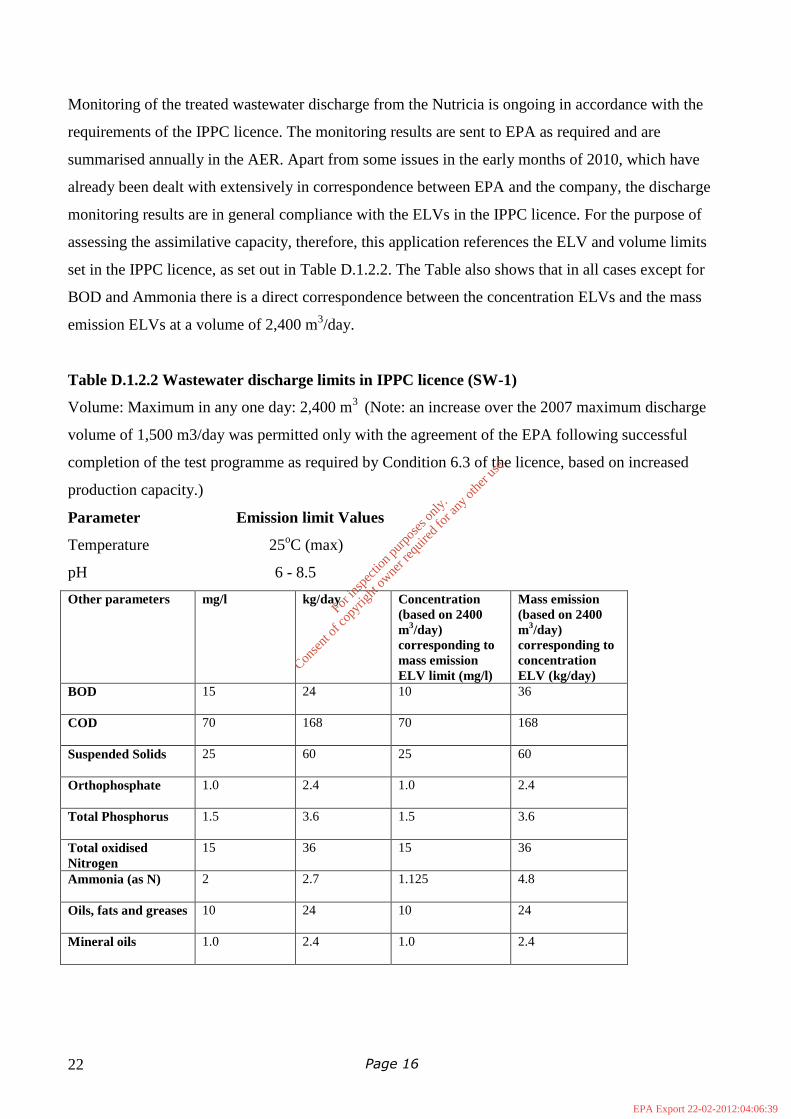
Monitoring of the treated wastewater discharge from the Nutricia is ongoing in accordance with the
requirements of the IPPC licence. The monitoring results are sent to EPA as required and are
summarised annually in the AER. Apart from some issues in the early months of 2010, which have
already been dealt with extensively in correspondence between EPA and the company, the discharge
monitoring results are in general compliance with the ELVs in the IPPC licence. For the purpose of
assessing the assimilative capacity, therefore, this application references the ELV and volume limits
set in the IPPC licence, as set out in Table D.1.2.2. The Table also shows that in all cases except for
BOD and Ammonia there is a direct correspondence between the concentration ELVs and the mass
emission ELVs at a volume of 2,400 m3/day.
Table D.1.2.2 Wastewater discharge limits in IPPC licence (SW-1)
Volume: Maximum in any one day: 2,400 m3
(Note: an increase over the 2007 maximum discharge
volume of 1,500 m3/day was permitted only with the agreement of the EPA following successful
completion of the test programme as required by Condition 6.3 of the licence, based on increased
production capacity.)
Parameter Emission limit Values
Temperature 25oC (max)
pH 6 - 8.5
Other parameters mg/l kg/day Concentration
(based on 2400
m3/day)
corresponding to
mass emission
ELV limit (mg/l)
Mass emission
(based on 2400
m3/day)
corresponding to
concentration
ELV (kg/day)
BOD
15 24 10 36
COD
70 168 70 168
Suspended Solids
25 60 25 60
Orthophosphate
1.0 2.4 1.0 2.4
Total Phosphorus
1.5 3.6 1.5 3.6
Total oxidised
Nitrogen
15 36 15 36
Ammonia (as N)
2 2.7 1.125 4.8
Oils, fats and greases
10 24 10 24
Mineral oils
1.0 2.4 1.0 2.4
For
insp
ectio
n pur
pose
s only
.
Conse
nt of
copy
right
owne
r req
uired
for a
ny ot
her u
se.
EPA Export 22-02-2012:04:06:39
Page 17 23
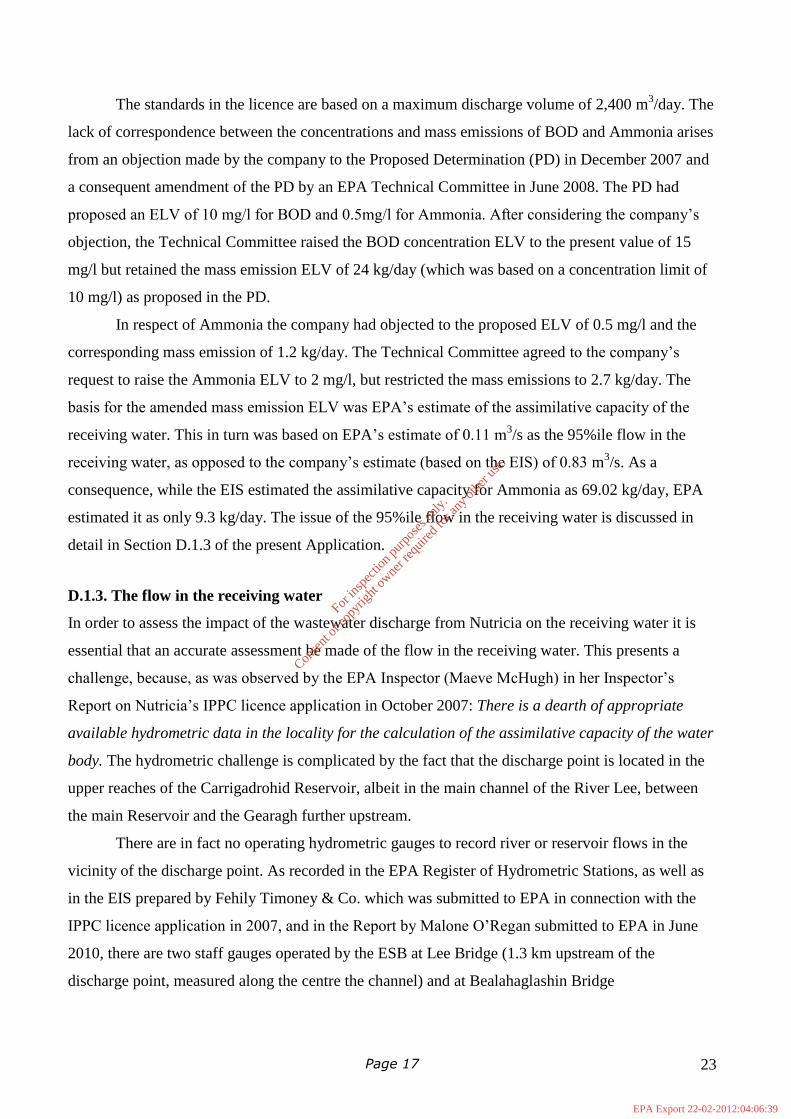
The standards in the licence are based on a maximum discharge volume of 2,400 m3/day. The
lack of correspondence between the concentrations and mass emissions of BOD and Ammonia arises
from an objection made by the company to the Proposed Determination (PD) in December 2007 and
a consequent amendment of the PD by an EPA Technical Committee in June 2008. The PD had
proposed an ELV of 10 mg/l for BOD and 0.5mg/l for Ammonia. After considering the company’s
objection, the Technical Committee raised the BOD concentration ELV to the present value of 15
mg/l but retained the mass emission ELV of 24 kg/day (which was based on a concentration limit of
10 mg/l) as proposed in the PD.
In respect of Ammonia the company had objected to the proposed ELV of 0.5 mg/l and the
corresponding mass emission of 1.2 kg/day. The Technical Committee agreed to the company’s
request to raise the Ammonia ELV to 2 mg/l, but restricted the mass emissions to 2.7 kg/day. The
basis for the amended mass emission ELV was EPA’s estimate of the assimilative capacity of the
receiving water. This in turn was based on EPA’s estimate of 0.11 m3/s as the 95%ile flow in the
receiving water, as opposed to the company’s estimate (based on the EIS) of 0.83 m3/s. As a
consequence, while the EIS estimated the assimilative capacity for Ammonia as 69.02 kg/day, EPA
estimated it as only 9.3 kg/day. The issue of the 95%ile flow in the receiving water is discussed in
detail in Section D.1.3 of the present Application.
D.1.3. The flow in the receiving water
In order to assess the impact of the wastewater discharge from Nutricia on the receiving water it is
essential that an accurate assessment be made of the flow in the receiving water. This presents a
challenge, because, as was observed by the EPA Inspector (Maeve McHugh) in her Inspector’s
Report on Nutricia’s IPPC licence application in October 2007: There is a dearth of appropriate
available hydrometric data in the locality for the calculation of the assimilative capacity of the water
body. The hydrometric challenge is complicated by the fact that the discharge point is located in the
upper reaches of the Carrigadrohid Reservoir, albeit in the main channel of the River Lee, between
the main Reservoir and the Gearagh further upstream.
There are in fact no operating hydrometric gauges to record river or reservoir flows in the
vicinity of the discharge point. As recorded in the EPA Register of Hydrometric Stations, as well as
in the EIS prepared by Fehily Timoney & Co. which was submitted to EPA in connection with the
IPPC licence application in 2007, and in the Report by Malone O’Regan submitted to EPA in June
2010, there are two staff gauges operated by the ESB at Lee Bridge (1.3 km upstream of the
discharge point, measured along the centre the channel) and at Bealahaglashin Bridge
For
insp
ectio
n pur
pose
s only
.
Conse
nt of
copy
right
owne
r req
uired
for a
ny ot
her u
se.
EPA Export 22-02-2012:04:06:39

Page 16 24
(0.75 km downstream, also measured along the centre the channel). But these record water levels
only. Neither of them records water flows.
The absence of local hydrometric data has led to a number of different approaches to
estimating river flows, with varying results. This submission will focus on the 95%ile flows, which
EPA requires to be used for assessing the assimilative capacity of the receiving water. The
submission will review briefly the approaches taken in previous documents, and the results arrived
at, in estimating the 95%ile flows. It will then set out the approach and results used in the present
application for review of the IPPC licence.
In the EIS prepared by Fehily Timoney in 2007 two methods were used to estimate the
95%ile flow at the discharge point. One of them, called Method 1, was eventually adopted, as being
the more conservative figure, for calculating the assimilative capacity for the Nutricia discharge. It
involved calculating the specific 95%ile flows (the 95%ile flows per square kilometre) at other
gauging stations in the River Lee catchment and outside it. An average value was taken from these
calculations to derive the 95%ile flow in the river at the Nutricia outfall. The gauging stations used
were at Ballymullen (Station No. 23012) and Inchigeela (Station No. 19043) both stated to be
upstream of the Nutricia outfall, and at Inniscarra (Station No. 19013) and Leemount (Station No.
19011) downstream of the outfall. (It should be clarified here that Ballymullen Station is not
upstream of the Nutricia outfall. It is on the other River Lee, near Tralee in Co. Kerry, but this does
not necessarily invalidate the use of its 95%ile flow per square kilometer for comparison purposes).
Fehily Timoney noted that the flows at Inniscarra and Leemount were regulated by the ESB, which
could affect the 95%ile flows recorded at those stations. They also noted that the 95%ile flow per
square kilometre at Inchigeela was much lower than the corresponding figures for the other three
stations (it was only about one fifth of the average of the other three) and for that reason they
excluded it from their calculations. The average 95%ile flow thus arrived at was 3.29 l/s/ km2. They
applied this to the catchment area at the Nutricia outfall, which they estimated as 252 km2. The
resulting estimated 95%ile flow at the outfall was 0.83 m3/s.
The EPA Inspector (Maeve McHugh) in her Report on Nutricia’s IPPC licence application in
October 2007 took a different approach to estimating the 95%ile flow at the outfall. She estimated it
on the basis of the data from the hydrometric stations at Coolcaum (Station No. 19023, catchment
area 29.9 km2) on the River Toon and at Inchigeela (Station No. 19043, catchment area 111.7 km
2)
on the River Lee, making an unspecified ‘adjustment’ of the resulting flow to take account the
additional ungauged area to the outfall. She took the 95%ile flow at Coolcaum as 0.005 m3/s and at
Inchigeela as 0.08 m3/s. It will be recalled that Fehily Timoney in the EIS had rejected the use of the
95%ile flow figure for Inchigeela as being anomalously low. The corresponding figure for Coolcaum
For
insp
ectio
n pur
pose
s only
.
Conse
nt of
copy
right
owne
r req
uired
for a
ny ot
her u
se.
EPA Export 22-02-2012:04:06:39

Page 17 25
is much lower still: it is only 0.167 l/s/km2, compared with 0.717 l/s/km
2 for Inchigeela. The
Coolcaum flow figure per square kilometer is therefore only about one twentieth of the
corresponding figures used in the EIS. This wide difference in data selection inevitable has a major
bearing on the resulting 95%ile flow estimated at the Nutricia outfall.
The EPA Inspector did not give details of her calculations, but it is assumed that in
‘adjusting’ the measured flows to allow for the larger catchment area at the outfall she used the same
flows per square kilometre as applied at the gauging stations she used. The figure she arrived at for
the 95%ile flow at the outfall was 0.11 m3/s, about one eighth of the 95%ile flow estimated by Fehily
Timoney. The main reasons for the very different results are the selection and processing of data
from different hydrometric stations with very different flows per unit area. The 95%ile flow
estimated by the EPA Inspector for the river at the Nutricia outfall corresponds to only 0.45 l/s/km2,
which is little more than one eighth of the 3.29 l/s/km2
estimated by Fehily Timoney at the same
location.
Malone O’Regan in their Report to EPA in June 2010 adopted the same approach as the EPA
inspector in calculating the 95%ile flow at the outfall. They used the data from the same two
hydrometric stations as EPA and scaled up the resulting flow for an area of 243 km2, which is the
catchment area to the Lee Bridge above the outfall. The figure Malone O’Regan arrived at for the
95%ile flow was 0.146 m3/s, very slightly higher than EPA’s figure.
This brief summary of previous work on the 95%ile flows at the Nutricia outfall highlights
the different approaches taken and the very different outputs arising from the selection of different
input flow data and methodologies for the calculations. It also highlights the need for a more
scientific and systematic methodology for deciding on the input flows to be used to estimate 95%ile
flows at ungauged locations such as the Nutricia outfall. Input flows need to be taken from river
catchments and river segments in those catchments which are sufficiently closely related to the
ungauged location in terms of such features as catchment area, topography, climatology (particularly
rainfall), subsoil permeability, slope, hydrogeology, soil characteristics, vegetation and land use and
other physical characteristics. In the present case, the input flow data used should be from a location
or locations whose characteristics are closely related to those of the Rivers Lee and Toon above the
Nutricia outfall. The challenge is to ensure this.
Fortunately, the methodology needed to ensure it is already available in the form of EPA’s
on-line Hydrotool ([email protected]), which was designed specifically for this purpose and is
extensively used in the implementation of River Basin Management Plans under the Water
Framework Directive. The Hydrotool was referenced by EPA as a source of river flow data for the
current review of IPPC licences (Presentation by Loretta Joyce, EPA, at public briefing on IPPC
For
insp
ectio
n pur
pose
s only
.
Conse
nt of
copy
right
owne
r req
uired
for a
ny ot
her u
se.
EPA Export 22-02-2012:04:06:39

Page 16 26
Licence reviews, May 2011). An extract from the EPA News of Autumn 2010 describes the main
features and applications of the Hydrotool.
Extract from EPA News, Autumn 2010
Estimation of flow for ungauged catchments
River flow data is essential in order to provide information for the assessment, development and
management of water resources and the water-related environment. Whilst Ireland has an extensive
hydrometric programme, with approximately 850 gauges, it is impractical to monitor every
waterbody. Consequently, there was a need to develop a method to predict flow characteristics for
catchments where flow for ungauged catchments – that is, those not directly monitored.
A procedure called “Region of Influence” has been applied to the estimation of river flows in
ungauged catchments in Ireland. The method is based on the similarity of the catchment
characteristics of sites where flow is monitored, to those of an unmonitored site and has been
prepared by the EPA in conjunction with the ESBI and Compass Informatics - as a web-based GIS
application. The application can be accessed at http://193.1.208.39/HydroTool
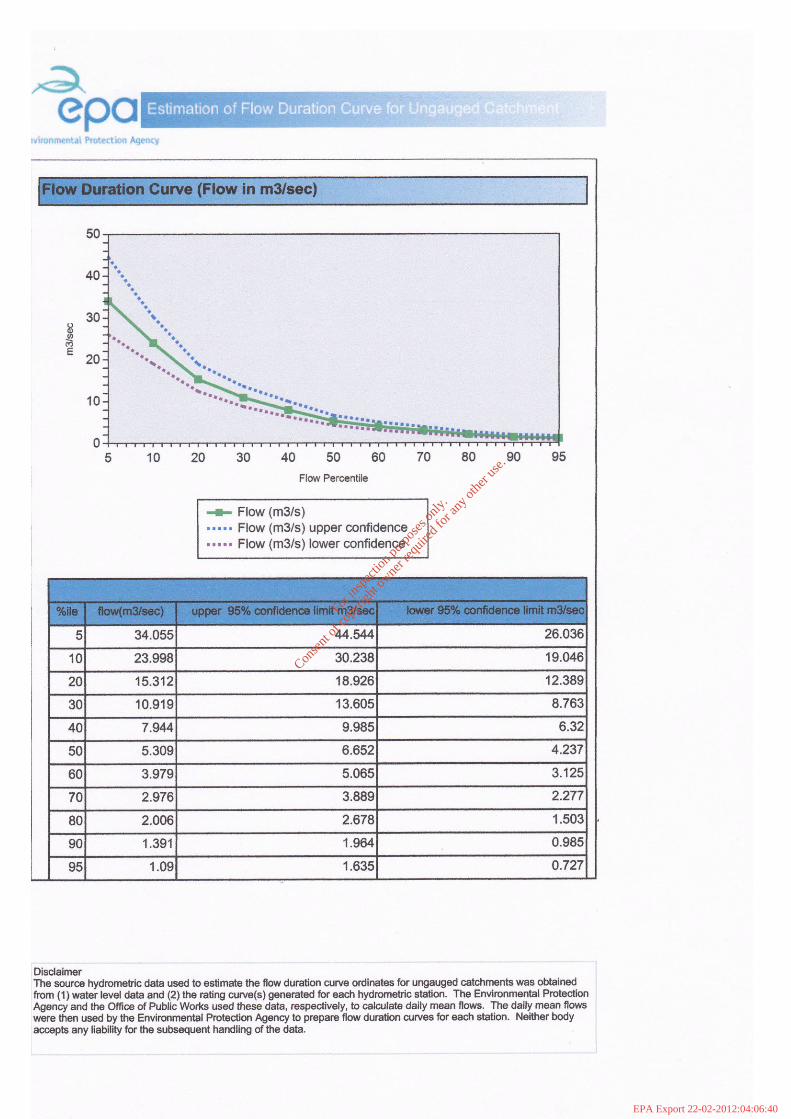
A summary of the flow regime of a catchment in the form of a flow duration curve (FDC) was
prepared from 145 hydrometric gauging stations (Local Authority/EPA and OPW hydrometric
stations) together with their catchment characteristics. These stations were chosen as they were
representative of a wide range of catchment types throughout the country. The FDC summarises
the flow regime of a river as a graphical plot of flow against the percentage of time that flow is
exceeded.
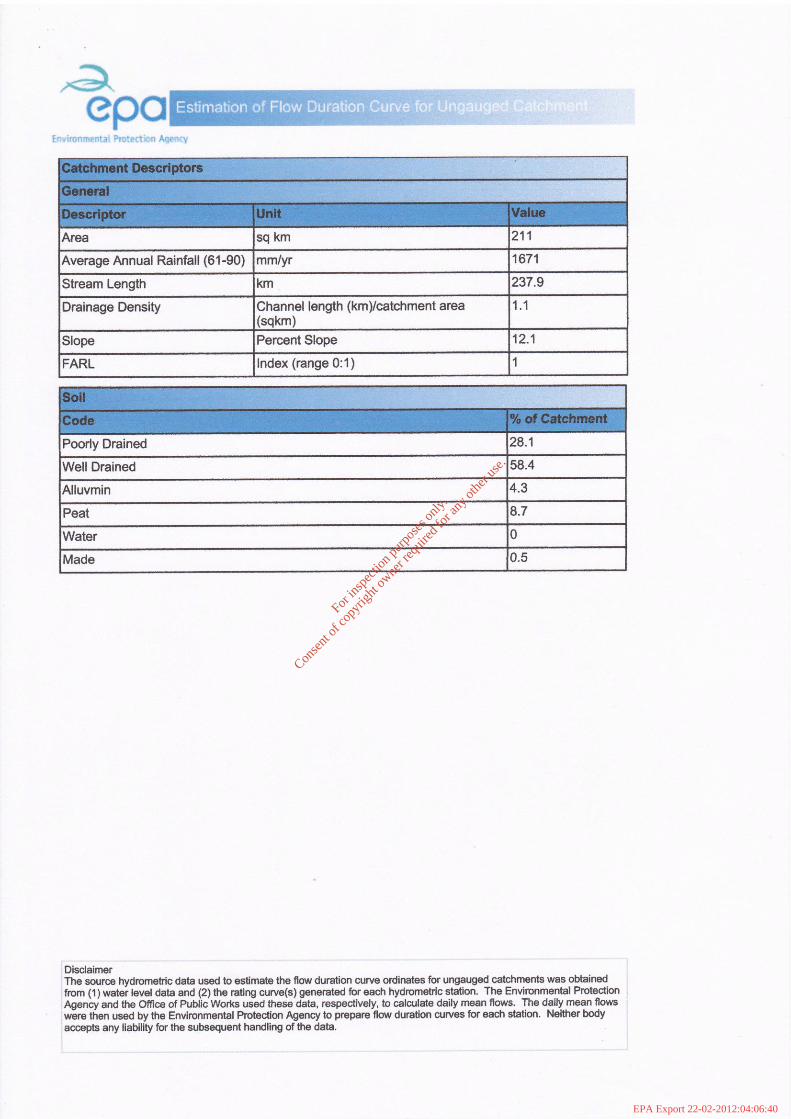
This application allows the user to select a target site of interest on a river, and to identify the
catchment boundary and characteristics such as catchment area, rainfall, stream length, drainage
density and slope (the average surface topographic slope across the catchment).
The database of catchment characteristics from the 145 master set of hydrometric gauging stations
is queried, and three representative stations are chosen from this master set, whose catchment
characteristics are ‘closest’ to the target site characteristics. The average FDC of this group of three
catchments is then calculated and applied to the ungauged catchment area. A seven page report is
generated that provides the user with catchment maps, catchment descriptors and the estimated
flow duration curve for the target site.
For
insp
ectio
n pur
pose
s only
.
Conse
nt of
copy
right
owne
r req
uired
for a
ny ot
her u
se.
EPA Export 22-02-2012:04:06:39
Page 17 27
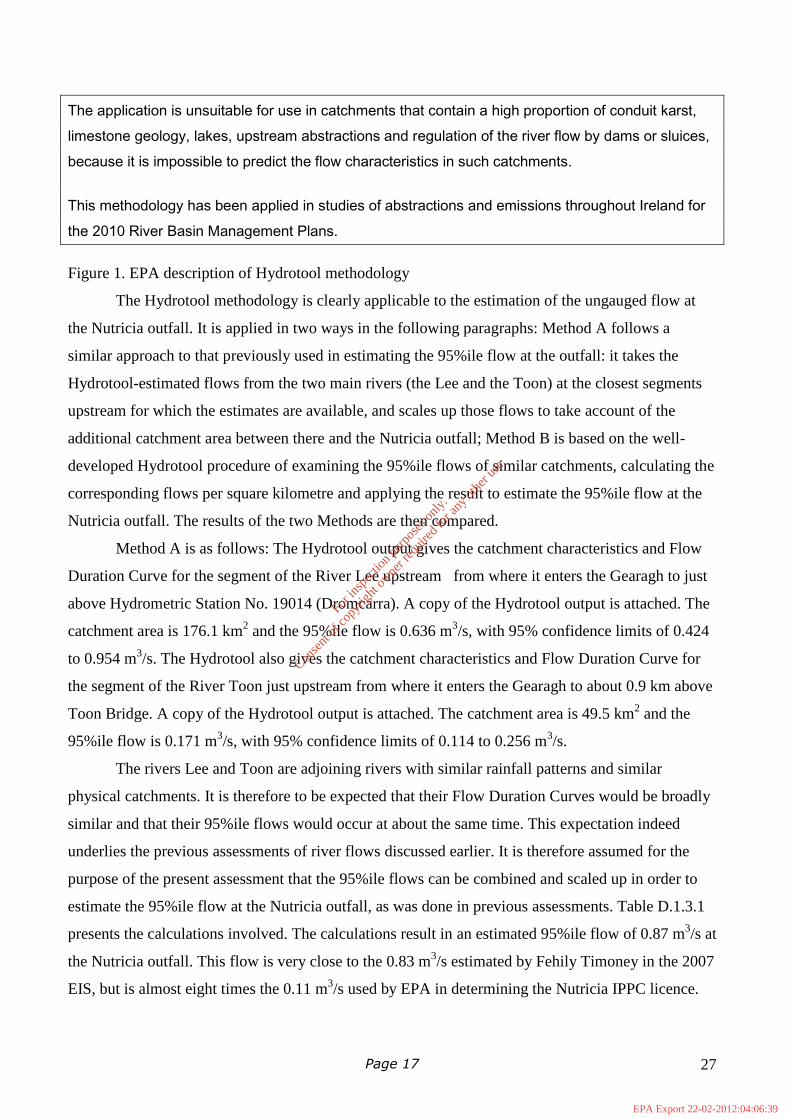
The application is unsuitable for use in catchments that contain a high proportion of conduit karst,
limestone geology, lakes, upstream abstractions and regulation of the river flow by dams or sluices,
because it is impossible to predict the flow characteristics in such catchments.
This methodology has been applied in studies of abstractions and emissions throughout Ireland for
the 2010 River Basin Management Plans.
Figure 1. EPA description of Hydrotool methodology
The Hydrotool methodology is clearly applicable to the estimation of the ungauged flow at
the Nutricia outfall. It is applied in two ways in the following paragraphs: Method A follows a
similar approach to that previously used in estimating the 95%ile flow at the outfall: it takes the
Hydrotool-estimated flows from the two main rivers (the Lee and the Toon) at the closest segments
upstream for which the estimates are available, and scales up those flows to take account of the
additional catchment area between there and the Nutricia outfall; Method B is based on the well-
developed Hydrotool procedure of examining the 95%ile flows of similar catchments, calculating the
corresponding flows per square kilometre and applying the result to estimate the 95%ile flow at the
Nutricia outfall. The results of the two Methods are then compared.
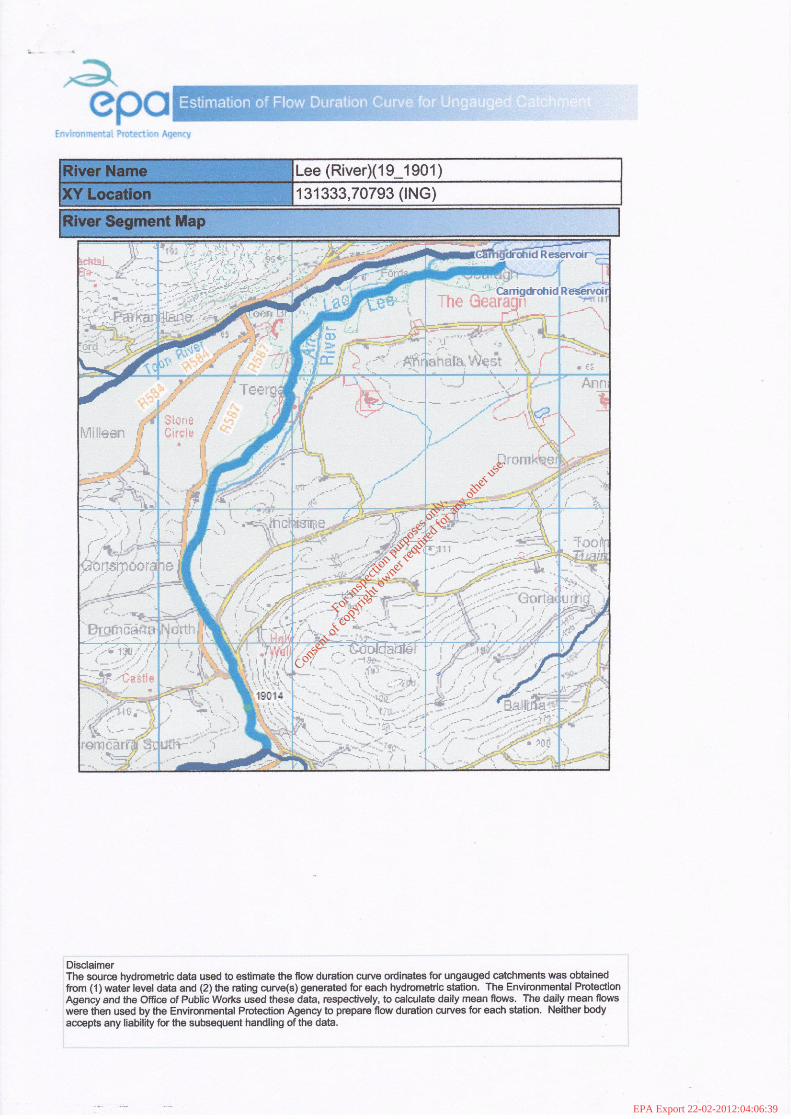
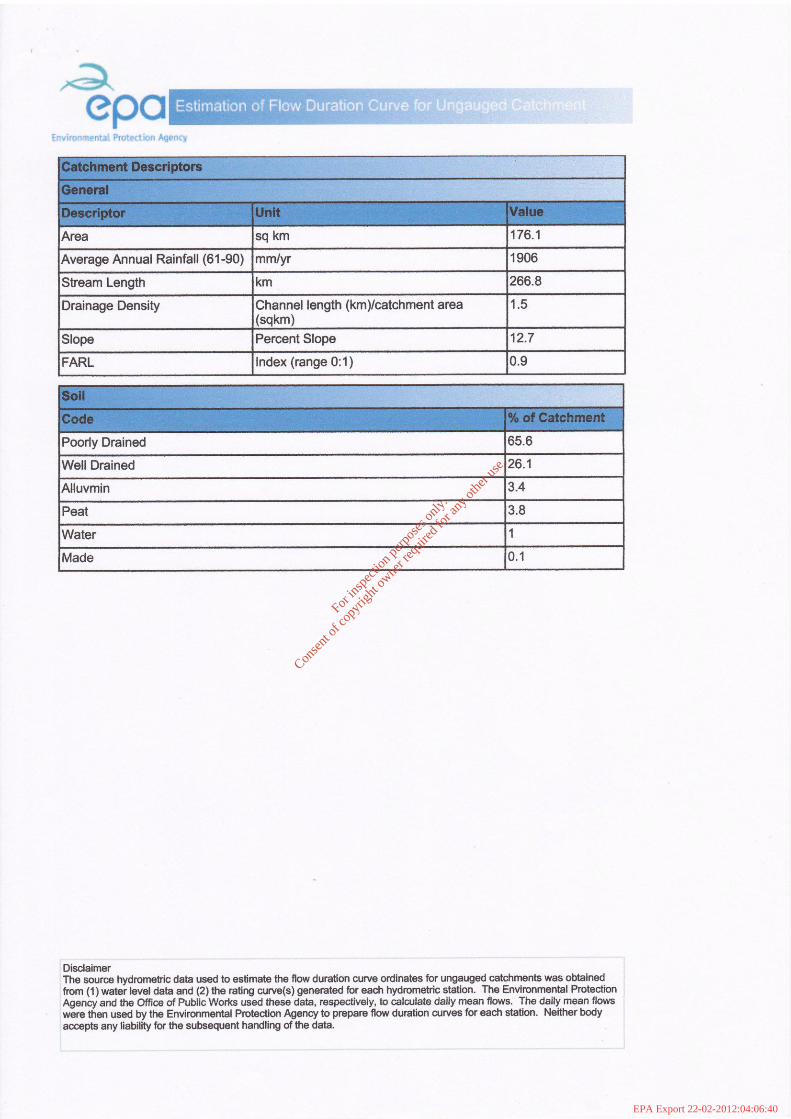
Method A is as follows: The Hydrotool output gives the catchment characteristics and Flow
Duration Curve for the segment of the River Lee upstream from where it enters the Gearagh to just
above Hydrometric Station No. 19014 (Dromcarra). A copy of the Hydrotool output is attached. The
catchment area is 176.1 km2 and the 95%ile flow is 0.636 m
3/s, with 95% confidence limits of 0.424
to 0.954 m3/s. The Hydrotool also gives the catchment characteristics and Flow Duration Curve for
the segment of the River Toon just upstream from where it enters the Gearagh to about 0.9 km above
Toon Bridge. A copy of the Hydrotool output is attached. The catchment area is 49.5 km2 and the
95%ile flow is 0.171 m3/s, with 95% confidence limits of 0.114 to 0.256 m
3/s.
The rivers Lee and Toon are adjoining rivers with similar rainfall patterns and similar
physical catchments. It is therefore to be expected that their Flow Duration Curves would be broadly
similar and that their 95%ile flows would occur at about the same time. This expectation indeed
underlies the previous assessments of river flows discussed earlier. It is therefore assumed for the
purpose of the present assessment that the 95%ile flows can be combined and scaled up in order to
estimate the 95%ile flow at the Nutricia outfall, as was done in previous assessments. Table D.1.3.1
presents the calculations involved. The calculations result in an estimated 95%ile flow of 0.87 m3/s at
the Nutricia outfall. This flow is very close to the 0.83 m3/s estimated by Fehily Timoney in the 2007
EIS, but is almost eight times the 0.11 m3/s used by EPA in determining the Nutricia IPPC licence.
For
insp
ectio
n pur
pose
s only
.
Conse
nt of
copy
right
owne
r req
uired
for a
ny ot
her u
se.
EPA Export 22-02-2012:04:06:39

Page 16 28
Table D.1.3.1 Calculation of 95%ile flow at Nutricia outfall
River segment Catchment area to
river segment (km2)
95%ile flow (m
3/s)
95%ile flow
per unit area
(l/s/km2)
River Lee entering
the Gearagh
176.1 0.636 3.612
River Toon entering
the Gearagh
49.5 0.171 3.455
Combined Rivers
Lee and Toon
entering the Gearagh
225.6 0.807 3.577(1)
River Lee -
Carrigadrohid
Reservoir at Nutricia
outfall
244.4(3)
0.874 3.577
(1) Weighted average flow per unit area
(2) The combined river catchment at Lee Bridge is 243 km
2 but there is an estimated further catchment area of 1.4 km
2
from Lee Bridge down to the outfall, bringing the total to 244.4 km2. The 2007 EIS was based on a total catchment area
of 252 km2 at the outfall, while EPA and Malone O’Regan’s calculations were based on the catchment area of 243 km
2 to
Lee Bridge.
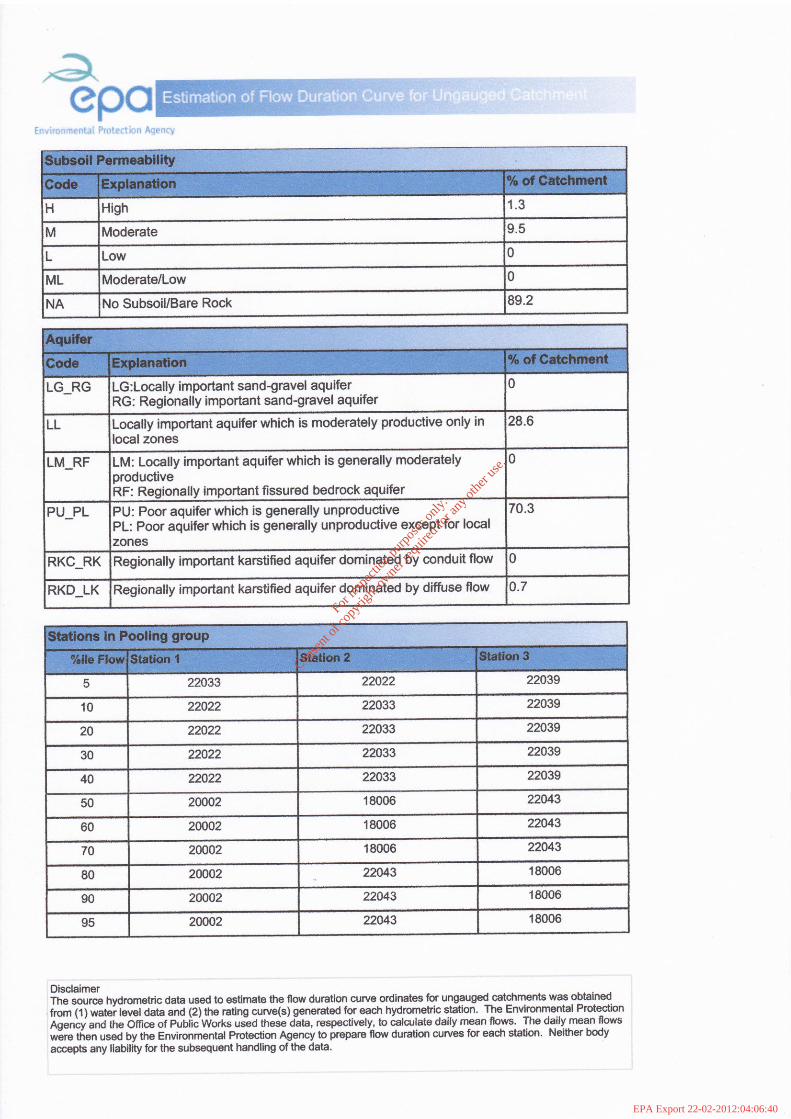
The second method of calculating the 95%ile flow at the Nutricia outfall, Method B, is also
based on the Hydrotool methodology. It involves examining the 95%ile flows of similar catchments,
calculating the flows per square kilometre in those catchments and applying the result to estimate the
95%ile flow at the Nutricia outfall. The first set of data to be considered is that used by EPA itself in
estimating the 95%ile flows for the Rivers Lee and Toon as discussed in Method A. The EPA input
data for the Hydrotool was drawn from a master set of 145 hydrometric stations where flow
measurements were considered well-established. A ‘Region of Influence’ approach, similar to that
used in the UK, was applied by EPA to choose catchments that were similar to the catchment to be
gauged. These ‘analogue’ catchments were chosen based on a weighted set of catchment descriptors
including rainfall, topography, soils, etc. The ‘analogue’ catchments are referred to in the Hydrotool
outputs as ‘Stations in Pooling Group’.
For the purpose of estimating the 95%ile flows for the segments of interest in the Rivers Lee
and Toon, EPA adopted the following Stations in the ‘pooling group’, their locations, catchment
areas and 95%ile flows as shown in Table D.1.3.2.
For
insp
ectio
n pur
pose
s only
.
Conse
nt of
copy
right
owne
r req
uired
for a
ny ot
her u
se.
EPA Export 22-02-2012:04:06:39

Page 17 29
Table D.1.3.2. Hydrometric Stations used by EPA in estimating 95%ile flows in the Rivers
Lee and Toon. Rivers
whose flow
is to be
estimated
Rivers used
as
‘analogues’
in ‘pooling
group’
Station
No.
Name and
location of
Station
Catchment
area to
Station(1)
(km2)
95%ile
flow (m
3/s)
(2)
95%ile
flow per
unit area
(l/s/km2)
Lee Newport
River
32012 Newport weir,
Co. Mayo
146.2 0.779 5.32
Lee River Flesk 22006 Flesk (Laune),
Co. Kerry
328.8 1.44 4.38
Lee River Finn 01042 Dreenan, Co.
Donegal
430.8 0.419 0.97
Toon Bandon
River
20002 Curranure, Co
Cork
423.7 0.8 1.89
Toon Stream 22043 Toormore
Bridge weir,
Co. Cork
3.4 NA NA
Toon River
Blackwater
18006 CSET (Sugar
factory)Mallow
1,054.8 3.5 3.32
Notes: (1) From EPA Register of Hydrometric Gauges in Ireland
(2) Source: EPA Summary of low flow statistics at selected hydrometric stations, June 2011.
It is apparent from the Table that none of the hydrometric stations in the ‘Pooling Group’ are
located within the catchments of the Rivers Lee or Toon. This suggests that the hydrometric stations
within the two river catchments themselves do not necessarily provide the most suitable data for
estimating the 95%ile flows in the segments of interest in those rivers. The nearest ‘analogue’ river
referred to is the River Bandon at Curranure, where the 95%ile flow is 1.89 l/s/km2. It is worth
noting that the EPA Inspector’s Report on Nutricia’s IPPC licence application in 2007 used the
median (50%ile) flow records from that hydrometric station to calculate the median flow at the
Nutricia outfall. If the Report had also used the 95%ile flow (1.89 l/s/km2) from the same Station to
calculate the 95%ile flow at the outfall, the result arrived at would have been four times greater, 0.46
m3/s instead of 0.11m
3/s.
The 95%ile values per unit area in the Table vary considerably, but the average value is 3.176
l/s/km2, which is not very different from the 3.577 l/s/km
2 arrived at using Method A, or from the
3.29 l/s/km2
arrived at in the EIS by Fehily Timoney, but is very different from the 0.45 l/s/km2 used
by EPA in estimating the 95%ile flow at the Nutricia outfall.
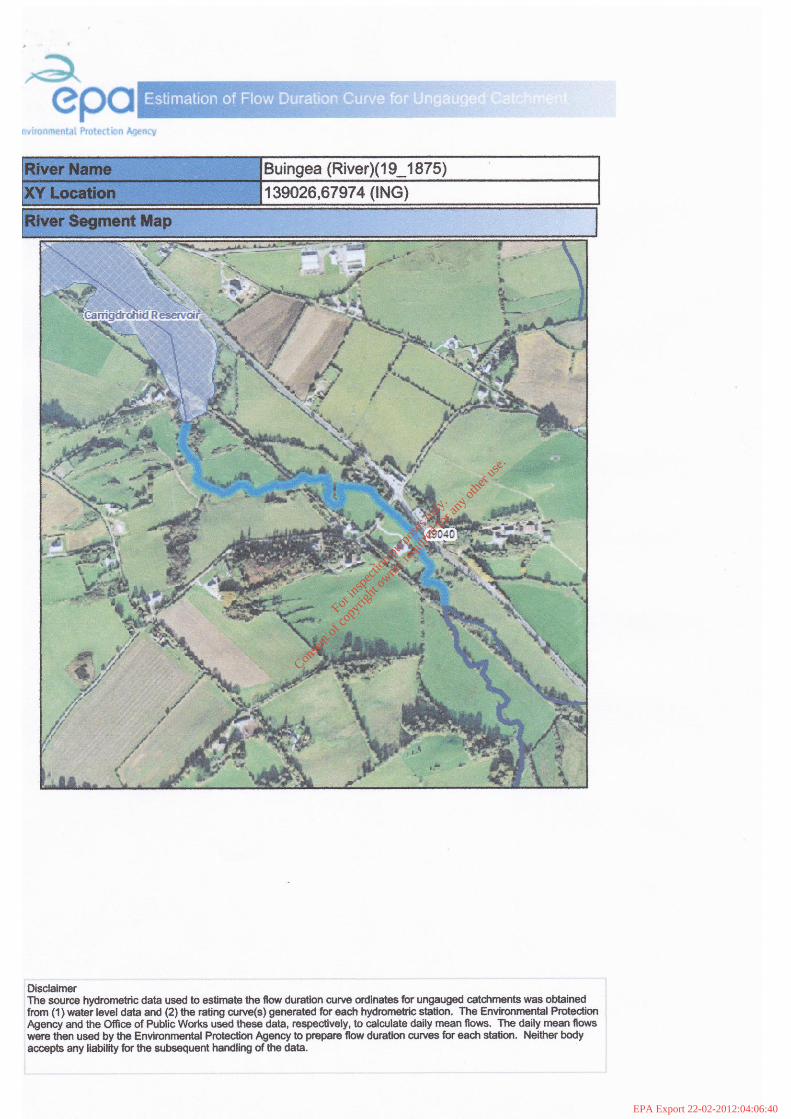
Before concluding with Method B it is worth comparing the 95%ile flow of two other rivers
close to the Rivers Lee and Toon, with catchment areas, rainfall and other physical characteristics
similar to those two rivers. They is the Sullane River, which flows roughly parallel to and just north
of the other two rivers and the Buingea River which flows into the Carrigadrohid Reservoir about 3.5
For
insp
ectio
n pur
pose
s only
.
Conse
nt of
copy
right
owne
r req
uired
for a
ny ot
her u
se.
EPA Export 22-02-2012:04:06:39

Page 16 30
km south-east of Bealahaglashin Bridge. The Hydrotool estimate (print-out attached) for the 95%ile
flow in the Sullane segment north of the Nutricia outfall is as follows:
Catchment area: 211 km2
95%ile flow: 1.09 m3/s
95%ile flow per unit area: 5.17 l/s/km2
This flow per unit area is at the upper end of the range of values in Table D.1.3.2. The Hydrotool
estimate (print-out attached) for the 95%ile flow in the Buingea River at its entry to the Reservoir is
as follows:
Catchment area: 28.9 km2
95%ile flow: 0.105 m3/s
95%ile flow per unit area: 3.63 l/s/km2
Taken together with all the other data and analysis in this submission, the flow figures for the Sullane
and Buingea, the two rivers nearest to the Lee and Toon, illustrate that by any appropriate analysis
the 95%ile flow calculated in the EPA Inspector’s Report for the Nutricia outfall is not supported by
the available EPA data.
The question then is what figure can be justified on the basis of the evidence. Nine sets of
relevant EPA estimates have been presented in the Tables and discussion of Methods A and B. The
results are remarkably consistent given their diverse origins (Table D.1.3.3).
Table D.1.3.3. Summary of 95%ile flows per unit area.
River segment 95%ile flow
per unit area
(l/s/km2)
River Lee entering the
Gearagh
3.612
River Toon entering the
Gearagh
3.455
Newport River 5.32
River Flesk 4.38
River Finn 0.97
Bandon River 1.89
River Blackwater 3.32
Sullane River 5.17
Buingea River 3.63
Mean value
3.53
For
insp
ectio
n pur
pose
s only
.
Conse
nt of
copy
right
owne
r req
uired
for a
ny ot
her u
se.
EPA Export 22-02-2012:04:06:39

Page 17 31
It is therefore proposed that the mean value from this data-set can be used with a high level of
confidence to calculate the 95%ile flow at the Nutricia outfall. The mean value from the data-set 3.53
l/s/km2. The catchment area at the outfall is 244.4 km
2. The estimated 95%ile flow at the outfall is
therefore 0.86 m3/s. This flow, which is very close to the 0.83 m
3/s used in the EIS but nearly eight
times that used by the EPA Inspector, will be used to calculate the assimilative capacity of the
Nutricia discharge in the present submission.
D.1.4. Assessment of assimilative capacity
The assimilative capacity of the receiving water at the discharge point is calculated using the
EPA-recommended method and the mass balance formula used in the Water Services Training
Group publication ‘Application for a Licence to Discharge to Surface Waters: Guidance to
Applicants, Appendix C – Assimilative Capacity and Mass Balance Calculations’.
The total assimilative capacity, expressed in kg/day, is the difference between the background
concentration in the river and the maximum permissible concentration at the 95%ile flow. The
formula used is:
Assimilative Capacity = (Cmax – Cbackground) * F95 * 86.4 kg/day
Where:
* is a multiplication sign
Cmax = maximum permissible concentration (mg/l)
Cbackground = background concentration (mean value) (mg/l)
F95 = the 95%ile flow in the river at the discharge point (m3/s)
To apply this formula to the Nutricia discharge, the maximum permissible concentrations
must be determined. These are the water quality standards for Good status set in the environmental
Objectives (Surface Waters) Regulations 2009. They are:
Parameter Water quality
objectives for
Good status (mg/l)
BOD ≤ 2.6 (95%ile)
Total Ammonia (as N) ≤ 0.140 (95%ile)
Orthophosphate) (as P) ≤ 0.075 (95%ile)
For
insp
ectio
n pur
pose
s only
.
Conse
nt of
copy
right
owne
r req
uired
for a
ny ot
her u
se.
EPA Export 22-02-2012:04:06:39

Page 16 32
The other required input to the formula is the background concentration of the relevant pollutants,
BOD, Ammonia and Orthophosphate, in the river just upstream of the outfall. They are given in
Table D.1.2.1 as follows:
BOD (mg/l) Total Ammonia
(mg/l as N)
Orthophosphate
(mg/l as P)
1.50 0.027 0.004
The assimilative capacity of the receiving water is therefore as follows:
BOD: (2.6 – 1.5) * 0.86 * 86.4 kg/day = 81.73 kg/day
Ammonia: (0.14 – 0.027) * 0.86 * 86.4 kg/day = 8.40 kg/day
Orthophosphate: (0.075 – 0.004) * 0.86 * 86.4 kg/day = 5.28 kg/day
These assimilative capacities may be compared with the ELVs in the IPPC licence as follows (Table
D.1.4.1):
Table D.1.4.1 Comparison of current ELVs and assimilative capacities
Parameters ELV
(mg/l)
ELV
(kg/day)
Assimilative
capacity
(kg/day)
Concentration
(based on 2400
m3/day)
corresponding to
mass emission ELV
limit (mg/l)
Mass emission
(based on 2400
m3/day)
corresponding
to
concentration
ELV (kg/day)
BOD
15 24 81.73 10 36
Ammonia (as N)
2.0 2.7 8.40 1.125 4.8
Orthophosphate
1.0 2.4 5.28 1.0 2.4
Based on Table D.1.4.1, the mass emission ELVs in the current IPPC licence represent the
allocation of the following percentages of the respective total available assimilative capacities:
BOD: 29%
Ammonia: 32%
Orthophosphate: 45%
These can be considered fairly conservative allocations of the available assimilative capacity
in the particular circumstances of the discharge from Nutricia. That discharge is the only significant
For
insp
ectio
n pur
pose
s only
.
Conse
nt of
copy
right
owne
r req
uired
for a
ny ot
her u
se.
EPA Export 22-02-2012:04:06:39
Page 17 33
one in the near vicinity, and there is a further considerable increase in river flow, which should
increase assimilative capacity, a short distance downstream where the River Lee is joined by the
Rivers Sullane and Buingea.
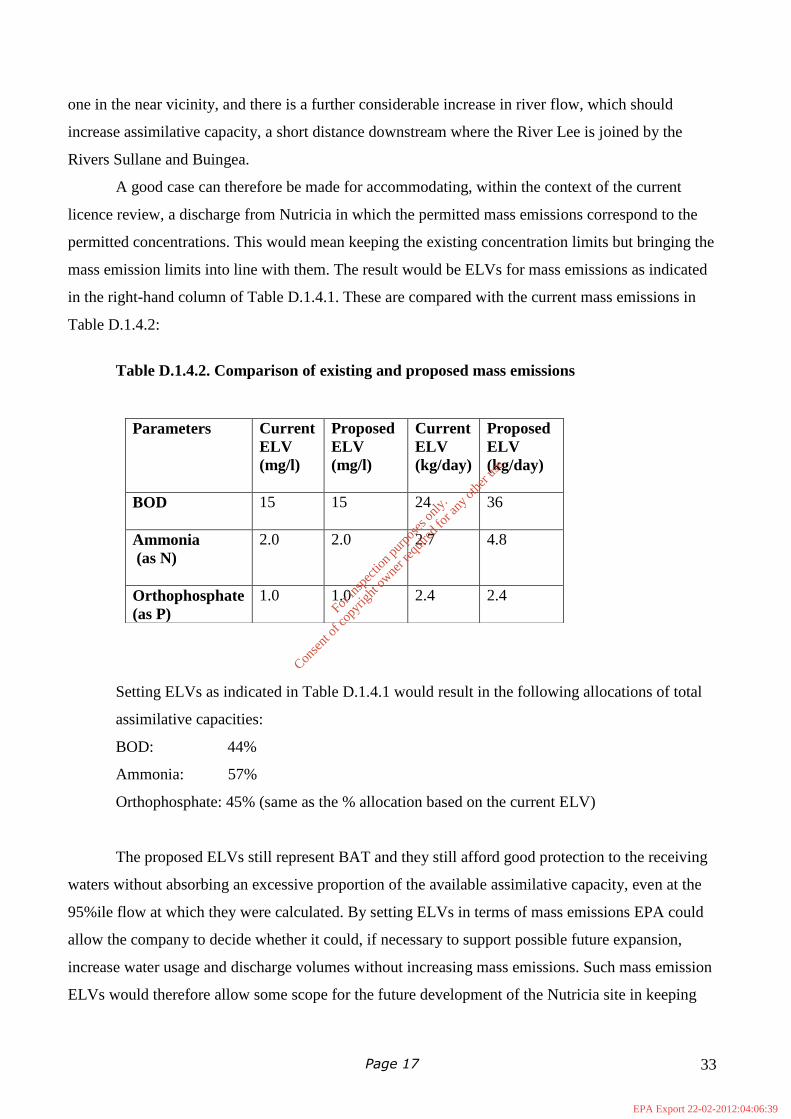
A good case can therefore be made for accommodating, within the context of the current
licence review, a discharge from Nutricia in which the permitted mass emissions correspond to the
permitted concentrations. This would mean keeping the existing concentration limits but bringing the
mass emission limits into line with them. The result would be ELVs for mass emissions as indicated
in the right-hand column of Table D.1.4.1. These are compared with the current mass emissions in
Table D.1.4.2:
Table D.1.4.2. Comparison of existing and proposed mass emissions
Setting ELVs as indicated in Table D.1.4.1 would result in the following allocations of total
assimilative capacities:
BOD: 44%
Ammonia: 57%
Orthophosphate: 45% (same as the % allocation based on the current ELV)
The proposed ELVs still represent BAT and they still afford good protection to the receiving
waters without absorbing an excessive proportion of the available assimilative capacity, even at the
95%ile flow at which they were calculated. By setting ELVs in terms of mass emissions EPA could
allow the company to decide whether it could, if necessary to support possible future expansion,
increase water usage and discharge volumes without increasing mass emissions. Such mass emission
ELVs would therefore allow some scope for the future development of the Nutricia site in keeping
Parameters Current
ELV
(mg/l)
Proposed
ELV
(mg/l)
Current
ELV
(kg/day)
Proposed
ELV
(kg/day)
BOD
15 15 24 36
Ammonia
(as N)
2.0 2.0 2.7 4.8
Orthophosphate
(as P)
1.0 1.0 2.4 2.4
For
insp
ectio
n pur
pose
s only
.
Conse
nt of
copy
right
owne
r req
uired
for a
ny ot
her u
se.
EPA Export 22-02-2012:04:06:39

Page 16 34
with national strategy for the development of the food industry as envisaged in Government policy
under Harvest 2020.
It is therefore suggested that EPA amend the current licence to bring the mass emissions
ELVs into line with the concentration ELVs as indicated above.
For
insp
ectio
n pur
pose
s only
.
Conse
nt of
copy
right
owne
r req
uired
for a
ny ot
her u
se.
EPA Export 22-02-2012:04:06:39

Page 17 35
Attachments to Section D.1.3.
EPA Hydrotool Outputs for Rivers Lee, Toon, Sullane and Buingea
For
insp
ectio
n pur
pose
s only
.
Conse
nt of
copy
right
owne
r req
uired
for a
ny ot
her u
se.
EPA Export 22-02-2012:04:06:39
Page 16 36
For
insp
ectio
n pur
pose
s only
.
Conse
nt of
copy
right
owne
r req
uired
for a
ny ot
her u
se.
EPA Export 22-02-2012:04:06:39

Page 17 37
For
insp
ectio
n pur
pose
s only
.
Conse
nt of
copy
right
owne
r req
uired
for a
ny ot
her u
se.
EPA Export 22-02-2012:04:06:40
Page 16 38
For
insp
ectio
n pur
pose
s only
.
Conse
nt of
copy
right
owne
r req
uired
for a
ny ot
her u
se.
EPA Export 22-02-2012:04:06:40

Page 17 39
For
insp
ectio
n pur
pose
s only
.
Conse
nt of
copy
right
owne
r req
uired
for a
ny ot
her u
se.
EPA Export 22-02-2012:04:06:40

Page 16 40
For
insp
ectio
n pur
pose
s only
.
Conse
nt of
copy
right
owne
r req
uired
for a
ny ot
her u
se.
EPA Export 22-02-2012:04:06:40

Page 17 41
For
insp
ectio
n pur
pose
s only
.
Conse
nt of
copy
right
owne
r req
uired
for a
ny ot
her u
se.
EPA Export 22-02-2012:04:06:40

Page 16 42
For
insp
ectio
n pur
pose
s only
.
Conse
nt of
copy
right
owne
r req
uired
for a
ny ot
her u
se.
EPA Export 22-02-2012:04:06:40
Page 17 43
For
insp
ectio
n pur
pose
s only
.
Conse
nt of
copy
right
owne
r req
uired
for a
ny ot
her u
se.
EPA Export 22-02-2012:04:06:40

Page 16 44
For
insp
ectio
n pur
pose
s only
.
Conse
nt of
copy
right
owne
r req
uired
for a
ny ot
her u
se.
EPA Export 22-02-2012:04:06:40
Page 17 45
For
insp
ectio
n pur
pose
s only
.
Conse
nt of
copy
right
owne
r req
uired
for a
ny ot
her u
se.
EPA Export 22-02-2012:04:06:40
Page 16 46
For
insp
ectio
n pur
pose
s only
.
Conse
nt of
copy
right
owne
r req
uired
for a
ny ot
her u
se.
EPA Export 22-02-2012:04:06:40
Page 17 47
For
insp
ectio
n pur
pose
s only
.
Conse
nt of
copy
right
owne
r req
uired
for a
ny ot
her u
se.
EPA Export 22-02-2012:04:06:40
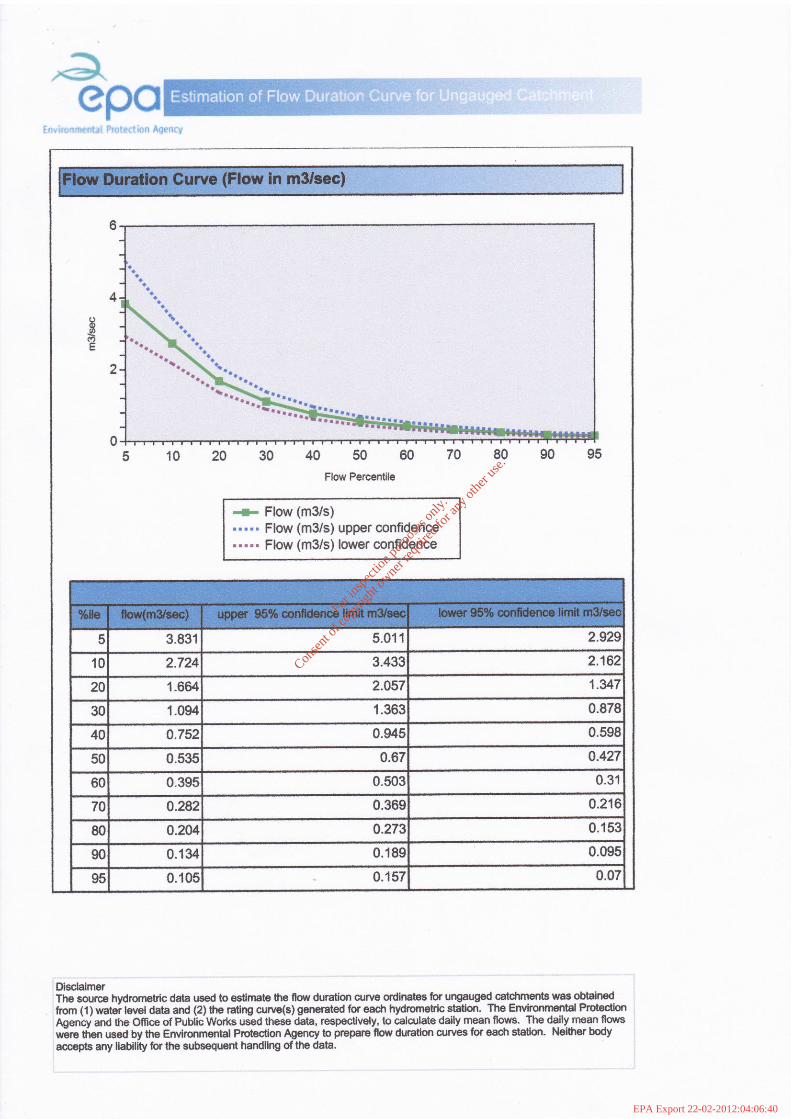
Page 16 48
For
insp
ectio
n pur
pose
s only
.
Conse
nt of
copy
right
owne
r req
uired
for a
ny ot
her u
se.
EPA Export 22-02-2012:04:06:40
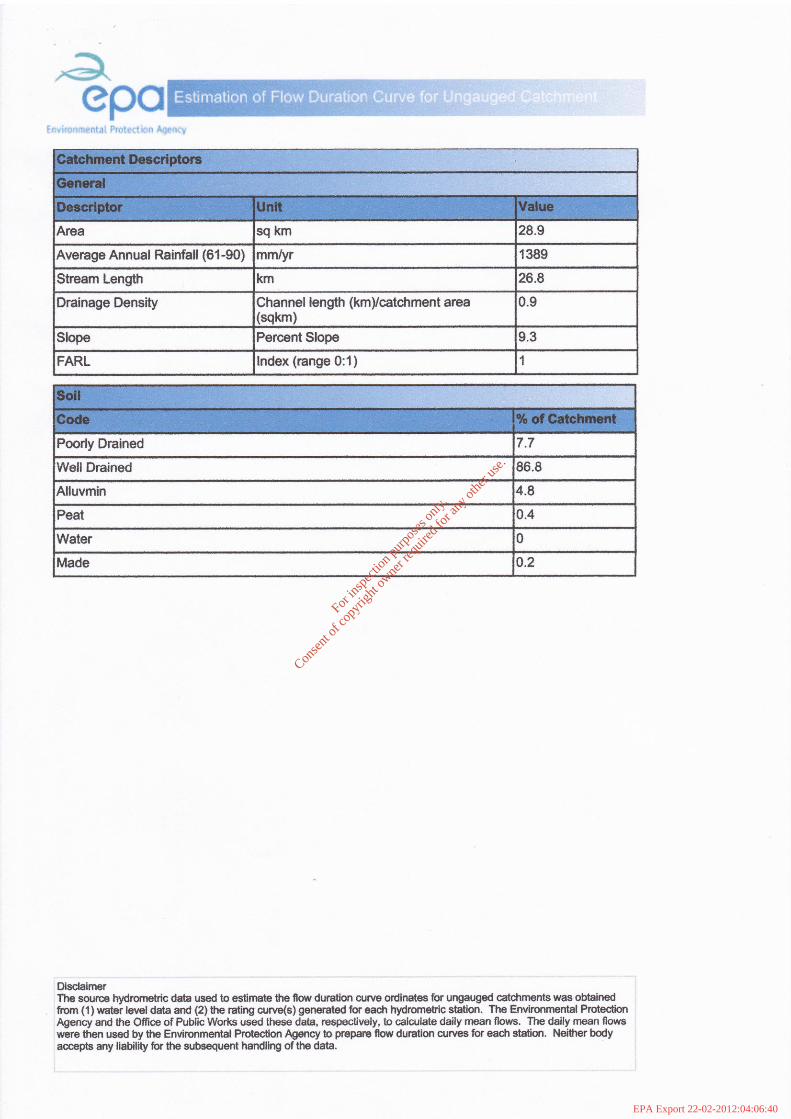
Page 17 49
For
insp
ectio
n pur
pose
s only
.
Conse
nt of
copy
right
owne
r req
uired
for a
ny ot
her u
se.
EPA Export 22-02-2012:04:06:40

Page 16 50
Attachment D.2. Implementation of BAT
For
insp
ectio
n pur
pose
s only
.
Conse
nt of
copy
right
owne
r req
uired
for a
ny ot
her u
se.
EPA Export 22-02-2012:04:06:40

Page 17 51
All aspects of BAT are in place on site. The following are some illustrations:
Generic Measures: Implement an environmental management system
ISO 14001:2004 implemented at Nutricia site
Waste minimisation, Raw Materials Use & Selection of Materials:
Substituted or reduced the use of materials, especially chemicals, to minimise the environmental
impact. Waste minimisation and good housekeeping programme in place. Processes optimised on an ongoing
basis to optimise inputs, handling, storage and effluent generation.
Water Use Management
Water use is monitored, metered and managed, reducing usage to a level consistent with best practice
for product quality and safety. Leaks and overflows are eliminated as soon as possible. CIP systems
are used to optimise water use. Cooling water is reused where possible. The results of water
conservation programmes are presented in the AERs
Energy Efficiency
Energy is a very significant cost element in the manufacturing process. There is therefore a very
strong focus on energy management and conservation. A comprehensive energy monitoring system
is in place. The AERs present annual details of consumption of electricity, heavy fuel oil and
propane. With the change-over from Heavy Fuel Oil to natural gas that focus on energy efficiency
will continue. Heat recovery systems are used on the spray dryer stack to pre-heat the air input and
on the evaporator. Other projects are in hand or planned.
For
insp
ectio
n pur
pose
s only
.
Conse
nt of
copy
right
owne
r req
uired
for a
ny ot
her u
se.
EPA Export 22-02-2012:04:06:40
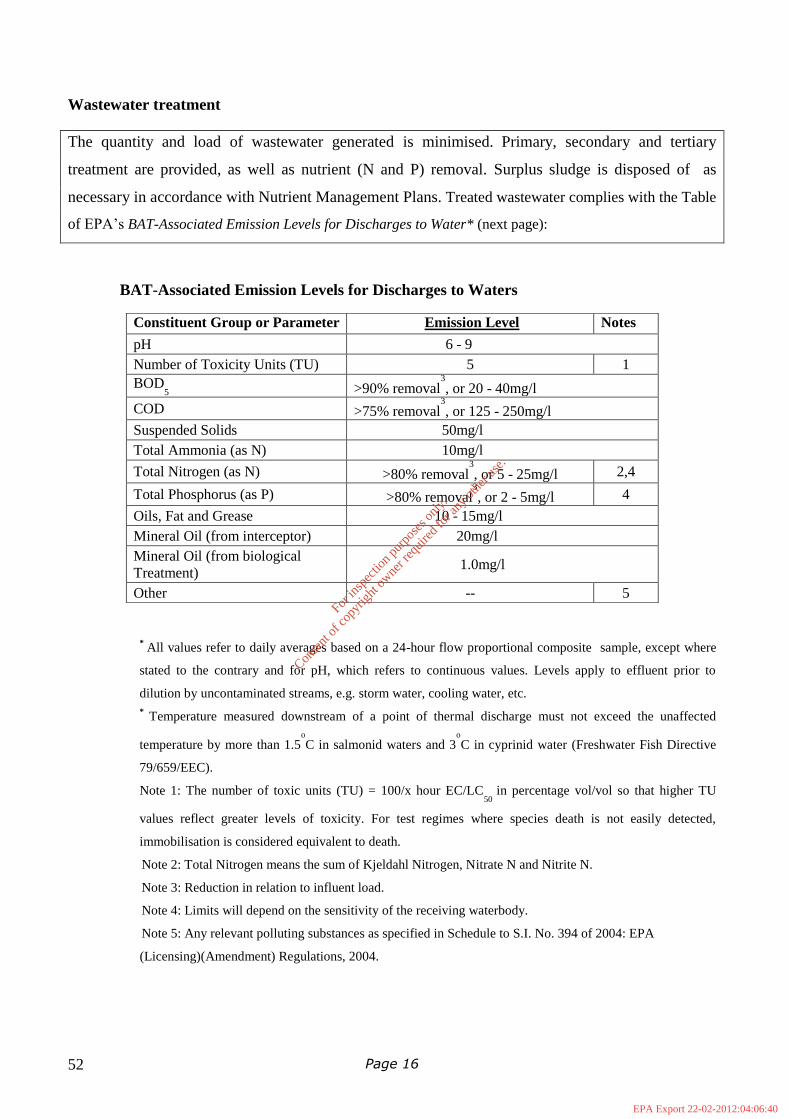
Page 16 52
Wastewater treatment
The quantity and load of wastewater generated is minimised. Primary, secondary and tertiary
treatment are provided, as well as nutrient (N and P) removal. Surplus sludge is disposed of as
necessary in accordance with Nutrient Management Plans. Treated wastewater complies with the Table
of EPA’s BAT-Associated Emission Levels for Discharges to Water* (next page):
BAT-Associated Emission Levels for Discharges to Waters
*
All values refer to daily averages based on a 24-hour flow proportional composite sample, except where
stated to the contrary and for pH, which refers to continuous values. Levels apply to effluent prior to
dilution by uncontaminated streams, e.g. storm water, cooling water, etc.
* Temperature measured downstream of a point of thermal discharge must not exceed the unaffected
temperature by more than 1.5o
C in salmonid waters and 3o
C in cyprinid water (Freshwater Fish Directive
79/659/EEC).
Note 1: The number of toxic units (TU) = 100/x hour EC/LC50
in percentage vol/vol so that higher TU
values reflect greater levels of toxicity. For test regimes where species death is not easily detected,
immobilisation is considered equivalent to death.
Note 2: Total Nitrogen means the sum of Kjeldahl Nitrogen, Nitrate N and Nitrite N.
Note 3: Reduction in relation to influent load.
Note 4: Limits will depend on the sensitivity of the receiving waterbody.
Note 5: Any relevant polluting substances as specified in Schedule to S.I. No. 394 of 2004: EPA
(Licensing)(Amendment) Regulations, 2004.
Constituent Group or Parameter Emission Level Notes
pH 6 - 9
Number of Toxicity Units (TU) 5 1
BOD5 >90% removal
3
, or 20 - 40mg/l
COD >75% removal3
, or 125 - 250mg/l
Suspended Solids 50mg/l
Total Ammonia (as N) 10mg/l
Total Nitrogen (as N) >80% removal3
, or 5 - 25mg/l 2,4
Total Phosphorus (as P) >80% removal3
, or 2 - 5mg/l 4
Oils, Fat and Grease 10 - 15mg/l
Mineral Oil (from interceptor) 20mg/l
Mineral Oil (from biological
Treatment) 1.0mg/l
Other -- 5
For
insp
ectio
n pur
pose
s only
.
Conse
nt of
copy
right
owne
r req
uired
for a
ny ot
her u
se.
EPA Export 22-02-2012:04:06:40

Page 17 53
Attachment No. A.2 Location maps
For
insp
ectio
n pur
pose
s only
.
Conse
nt of
copy
right
owne
r req
uired
for a
ny ot
her u
se.
EPA Export 22-02-2012:04:06:40

Page 16 54
For
insp
ectio
n pur
pose
s only
.
Conse
nt of
copy
right
owne
r req
uired
for a
ny ot
her u
se.
EPA Export 22-02-2012:04:06:40
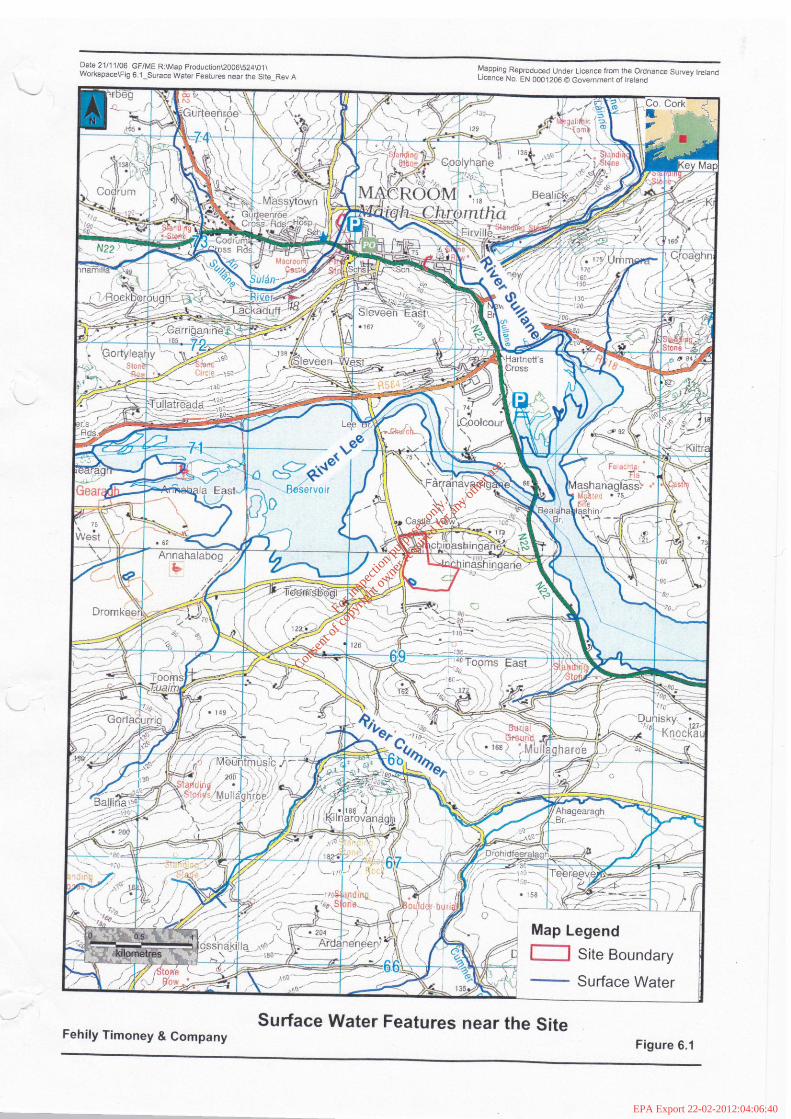
Page 17 55
For
insp
ectio
n pur
pose
s only
.
Conse
nt of
copy
right
owne
r req
uired
for a
ny ot
her u
se.
EPA Export 22-02-2012:04:06:40

Page 16 56
For
insp
ectio
n pur
pose
s only
.
Conse
nt of
copy
right
owne
r req
uired
for a
ny ot
her u
se.
EPA Export 22-02-2012:04:06:40

Page 17 57
Attachment No. F1. Technical Amendment issued by EPA on 17 October 2011
amending the original (2007) IPPC licence.
For
insp
ectio
n pur
pose
s only
.
Conse
nt of
copy
right
owne
r req
uired
for a
ny ot
her u
se.
EPA Export 22-02-2012:04:06:40

Page 16 58
For
insp
ectio
n pur
pose
s only
.
Conse
nt of
copy
right
owne
r req
uired
for a
ny ot
her u
se.
EPA Export 22-02-2012:04:06:40

Page 17 59
For
insp
ectio
n pur
pose
s only
.
Conse
nt of
copy
right
owne
r req
uired
for a
ny ot
her u
se.
EPA Export 22-02-2012:04:06:40
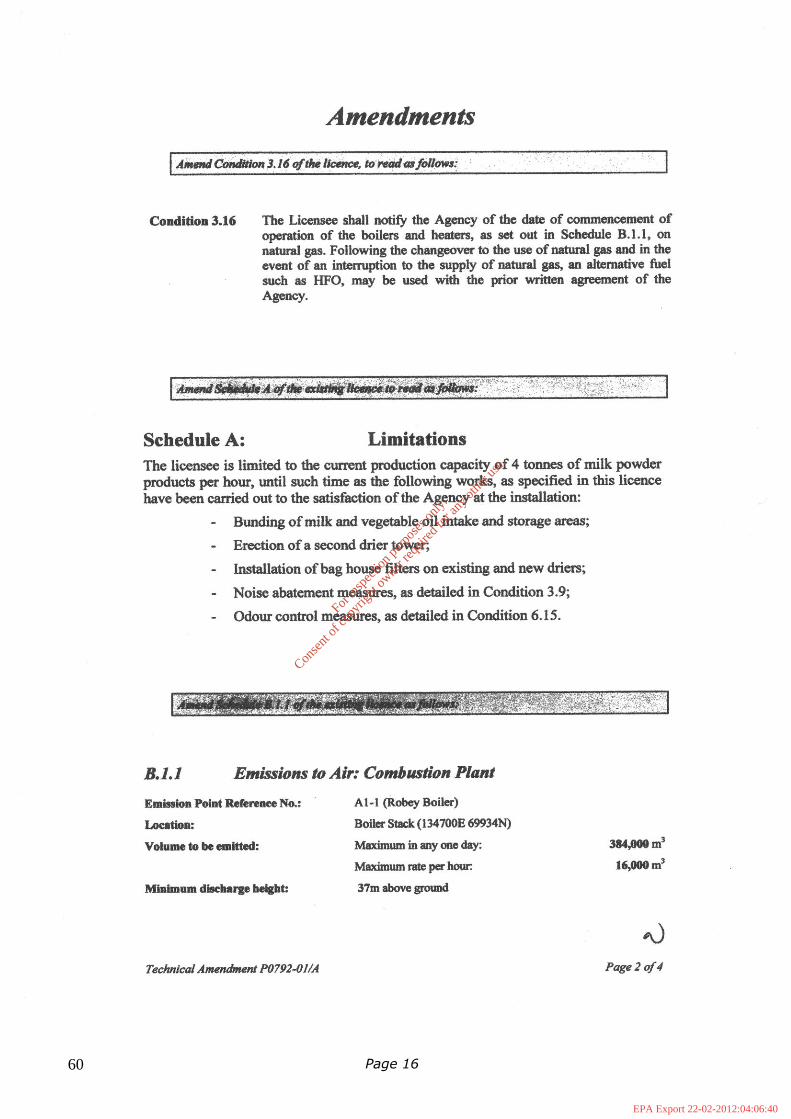
Page 16 60
For
insp
ectio
n pur
pose
s only
.
Conse
nt of
copy
right
owne
r req
uired
for a
ny ot
her u
se.
EPA Export 22-02-2012:04:06:40

Page 17 61
For
insp
ectio
n pur
pose
s only
.
Conse
nt of
copy
right
owne
r req
uired
for a
ny ot
her u
se.
EPA Export 22-02-2012:04:06:40

Page 16 62
For
insp
ectio
n pur
pose
s only
.
Conse
nt of
copy
right
owne
r req
uired
for a
ny ot
her u
se.
EPA Export 22-02-2012:04:06:40