nutrient application planning with snapplus for pastures ... · nutrient application planning for...
TRANSCRIPT

Nutrient Application Planning for Pastures with
SnapPlus
The Wisconsin P Index and
Laura Ward Good, UW-Madison Soil Science Department 2012

What’s ahead:
• Wisconsin P Index • P Index for pastures • UW-Extension pasture recommendations • Pasture nutrients in SnapPlus • Examples and questions

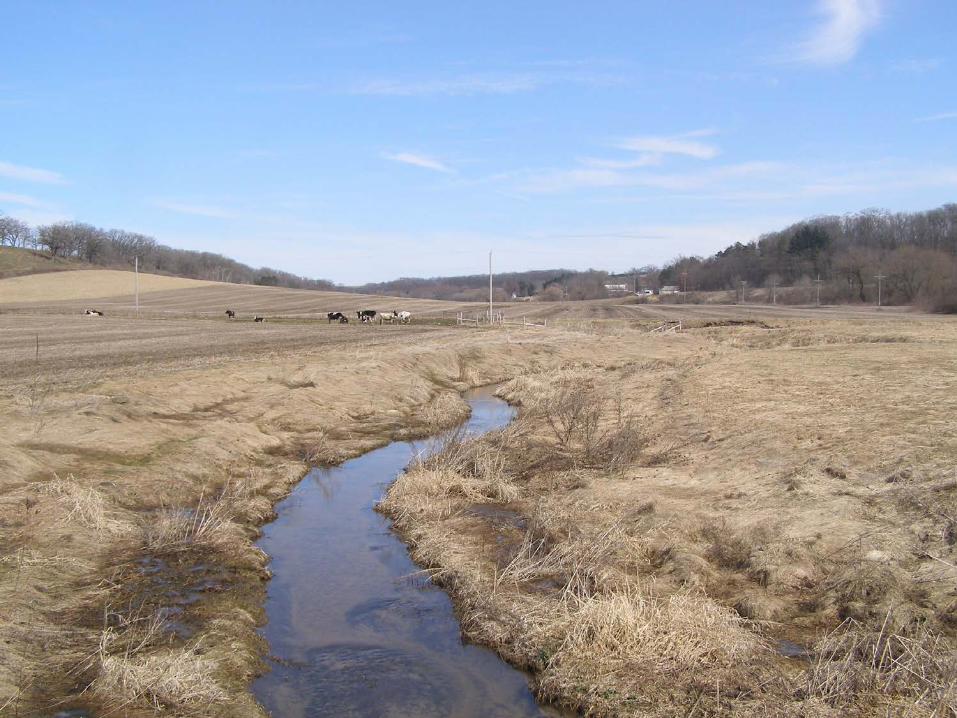
Field
Wisconsin P Index
Stream
Calculated as P lb/acre/year delivered, average assuming long term weather
County
Soil Test P and Organic Matter
Field Slope
Field Slope Length
Tillage
Rotation crops and yields
Manure Applications P Fertilizer
Applications Downfield Slope to Surface Water
Soil Type
Distance to
Surface Water
Soil Type
Data Inputs

Field
Stream
Calculated P lb/acre/year delivered with average weather
Dissolved P soil Dissolved P manure/fertilizer Eroded sediment P
Edge-of-Field Components

Field
Stream
Field-to-stream delivery ratio
RUSLE2 Erosion
P Index calculator
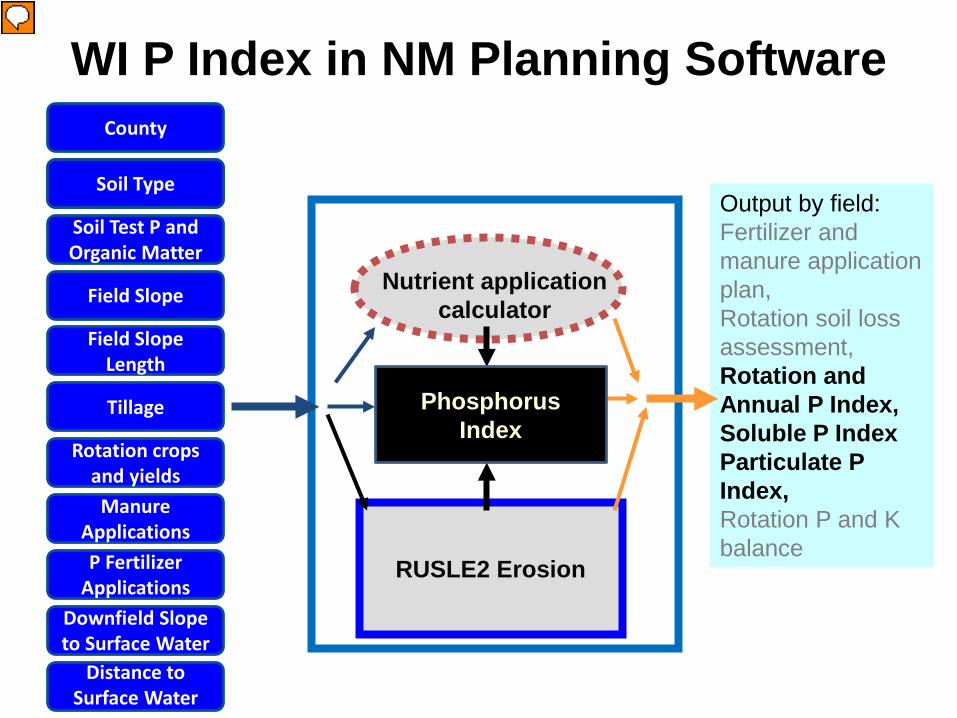
Output by field: Fertilizer and manure application plan, Rotation soil loss assessment, Rotation and Annual P Index, Soluble P Index Particulate P Index, Rotation P and K balance
Nutrient application calculator
County
Soil Test P and Organic Matter
Field Slope
Field Slope Length
Tillage
Rotation crops and yields
Manure Applications P Fertilizer
Applications Downfield Slope to Surface Water
Soil Type
Distance to
Surface Water
Soil Type
Phosphorus Index
WI P Index in NM Planning Software

Rotation Average WI P Index
Phosphorus Index
Relative indicator of the potential for runoff P from a given field to contaminate surface water (lbs P/ac/yr)
County
County
Soil Test P and Organic Matter
Field Slope
Field Slope Length
Tillage
Rotation crops and yields
Manure Applications
P Fertilizer Applications
Downfield Slope to Surface Water
Soil Type
Distance to Surface
Water
Soil Type

Phosphorus Index Equations
Dissolved P from soil Dissolved P from manure and fertilizer
Eroded sediment P
[P] x Transport = P delivered

Available P on Field Surface
Soil total P Soil soluble P
Manure & fertilizer soluble P
Soil Test P and Organic Matter
Tillage
Rotation crops and yields
Manure Applications
P Fertilizer Applications
Soil Type Soil Type
County
Soil Test P and Organic Matter
Field Slope
Field Slope Length
Tillage
Rotation crops and yields
Manure Applications
P Fertilizer Applications
Downfield Slope to Surface Water
Soil Type
Distance to Surface
Water
Soil Type

Field Transport Potential
Erosion - RUSLE2
County
Soil Test P and Organic Matter
Field Slope
Field Slope Length
Tillage
Rotation crops and yields
Manure Applications
Soil Type Soil Type
Weather databases
Frozen soil runoff
Rainfall runoff
County
Soil Test P and Organic Matter
Field Slope
Field Slope Length
Tillage
Rotation crops and yields
Manure Applications
P Fertilizer Applications
Downfield Slope to Surface Water
Soil Type
Distance to Surface
Water
Soil Type

What to Remember?
Soil P Manure on surface Runoff Erosion

P Index Varies with Management: Driftless Area Example
Fall chisel in 10,000 gal/acre dairy manure 5 T/a/yr erosion
No till, fall apply 10,000 gal/acre dairy manure 2 T/a/yr erosion
No till, winter apply 7,000 gal/acre dairy manure 2 T/a/yr erosion
Cs-Cs-Cs-As-A-A Soil test P = 70 ppm
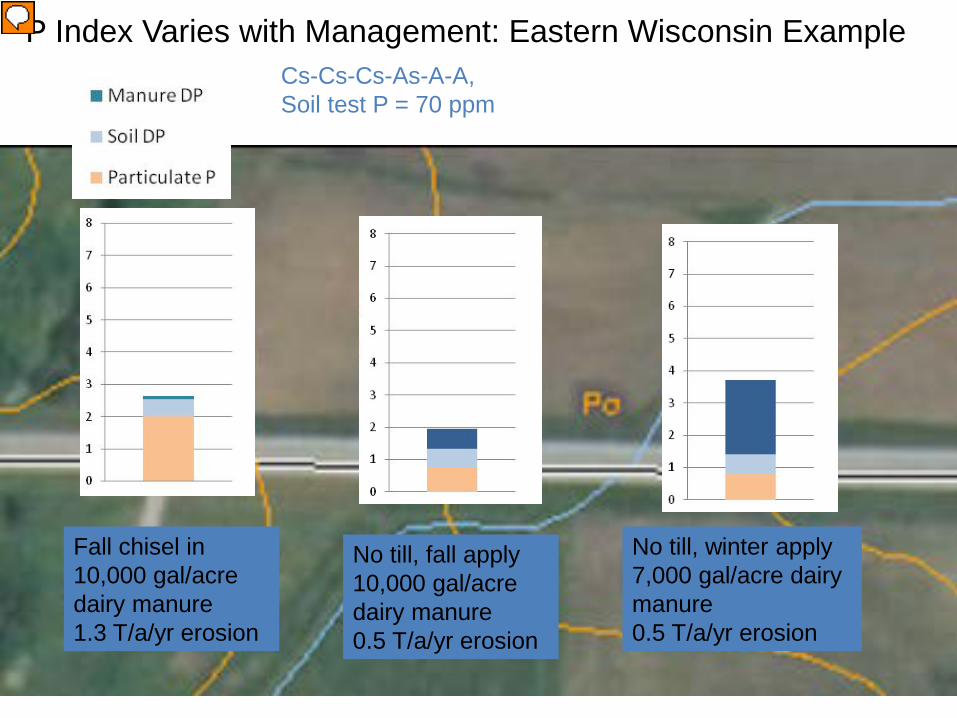
P Index Varies with Management: Eastern Wisconsin Example Cs-Cs-Cs-As-A-A, Soil test P = 70 ppm
Fall chisel in 10,000 gal/acre dairy manure 1.3 T/a/yr erosion
No till, fall apply 10,000 gal/acre dairy manure 0.5 T/a/yr erosion
No till, winter apply 7,000 gal/acre dairy manure 0.5 T/a/yr erosion
Manure Dissolved PSoil Dissolved PParticulate P
0
1
2
3
4
5
6
7
8
9
10
P In
dex
0
1
2
3
4
5
6
7
8
9
10
P In
dex

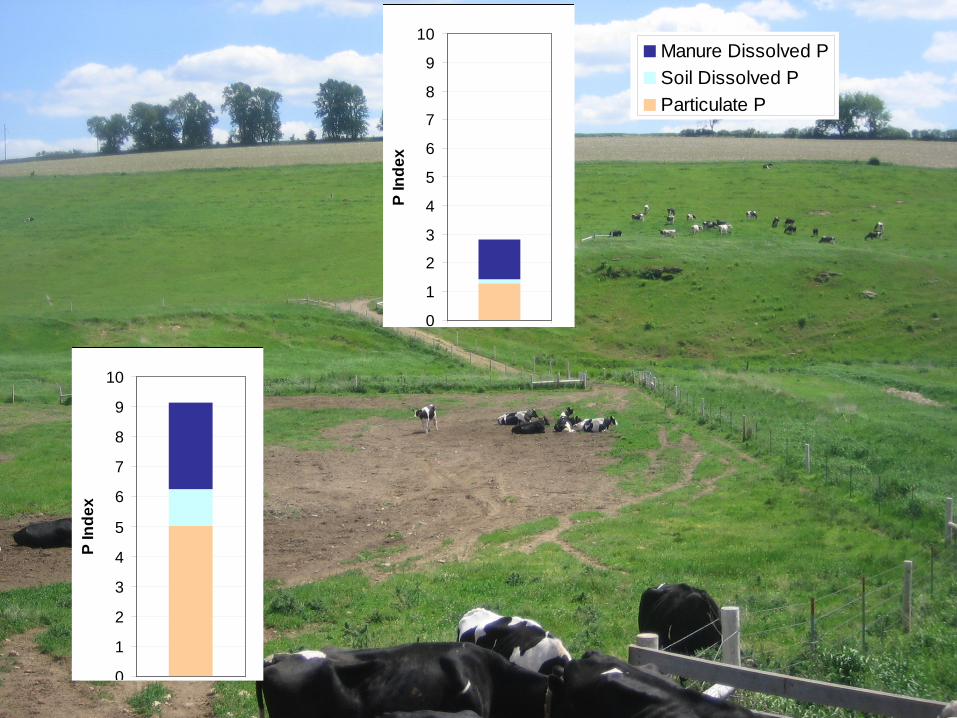
Runoff Monitoring on Pasture at Pioneer Farm, Platteville
0
0.5
1
1.5
2
2.5
Frozen Notfro en
Frozen Notfro en
Runo
ff (in
ches
)
0
0.2
0.4
0.6
0.8
1
1.2
Frozen Not Frozen NotPh
osph
orus
(lb/
acre
)
ParticulateDissolved
2004 2005 2004 2005
Majority of runoff P losses from pastures are dissolved P in snowmelt, rain on frozen soil

UW Extension Pasture Nutrient Recommendations
• Includes ALL nutrients recommended for yield of grass or grass + legumes
• Does not assume any nutrient return from urine or feces, so have to calculate return.
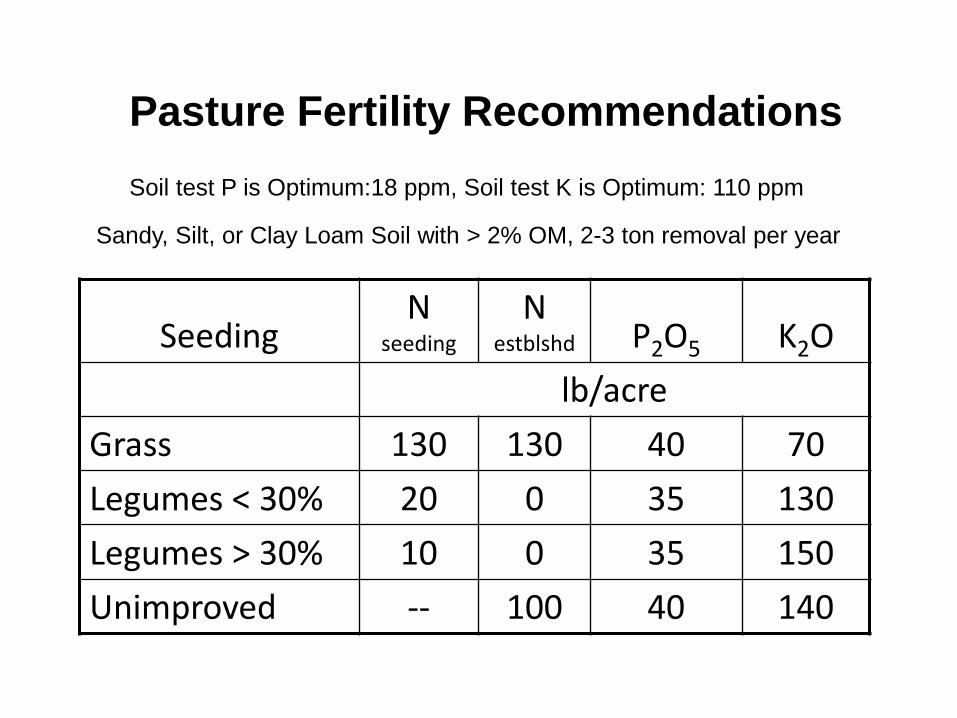
Seeding N
seeding N
estblshd P2O5 K2O lb/acre
Grass 130 130 40 70 Legumes < 30% 20 0 35 130 Legumes > 30% 10 0 35 150 Unimproved -- 100 40 140
Sandy, Silt, or Clay Loam Soil with > 2% OM, 2-3 ton removal per year
Soil test P is Optimum:18 ppm, Soil test K is Optimum: 110 ppm
Pasture Fertility Recommendations
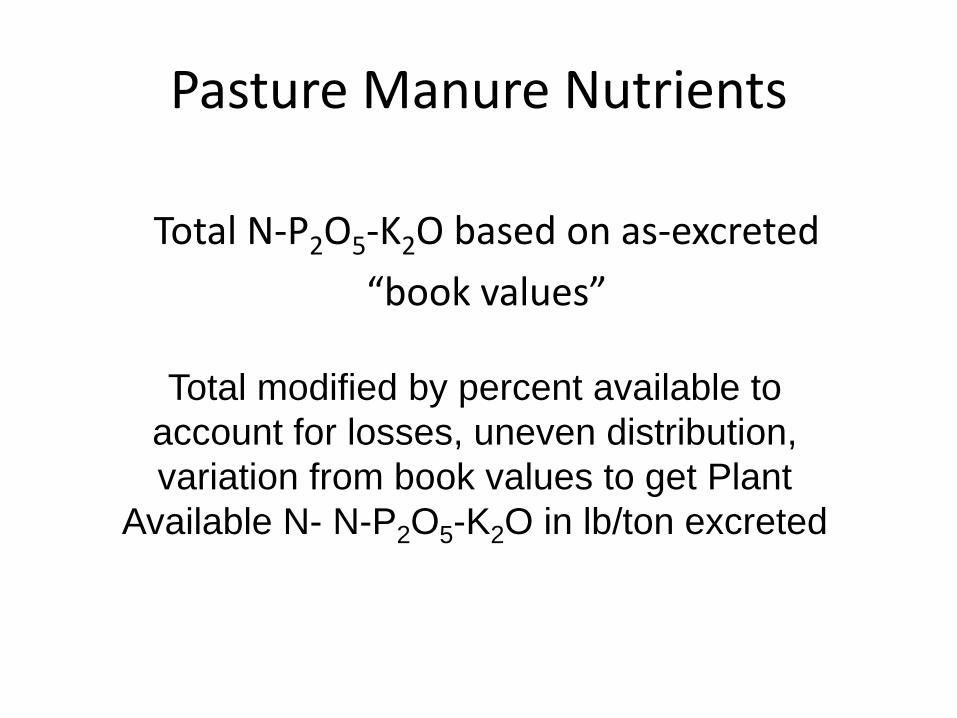
Pasture Manure Nutrients
Total N-P2O5-K2O based on as-excreted “book values”
Total modified by percent available to account for losses, uneven distribution, variation from book values to get Plant
Available N- N-P2O5-K2O in lb/ton excreted

Application rates based on estimated amount excreted for time in field
• Dairy lactating 1200 lb cow per acre for 180 days = 11 T/a = (33-50-77)
• Beef 1000 lb cow – 1 per acre for 180 days = 6 T/a = (24-40-54)

Seeding N seeding N
estblshd P2O5 K2O lb/acre
Grass 130 130 40 70
Legumes < 30% 20 0 35 65
Legumes > 30% 10 0 35 75
Unimproved -- 100 40 45
11 T/acre dairy (33-50-77) 6 T/a beef = (24-40-54)
Routine soil test program will ensure adequate P and K
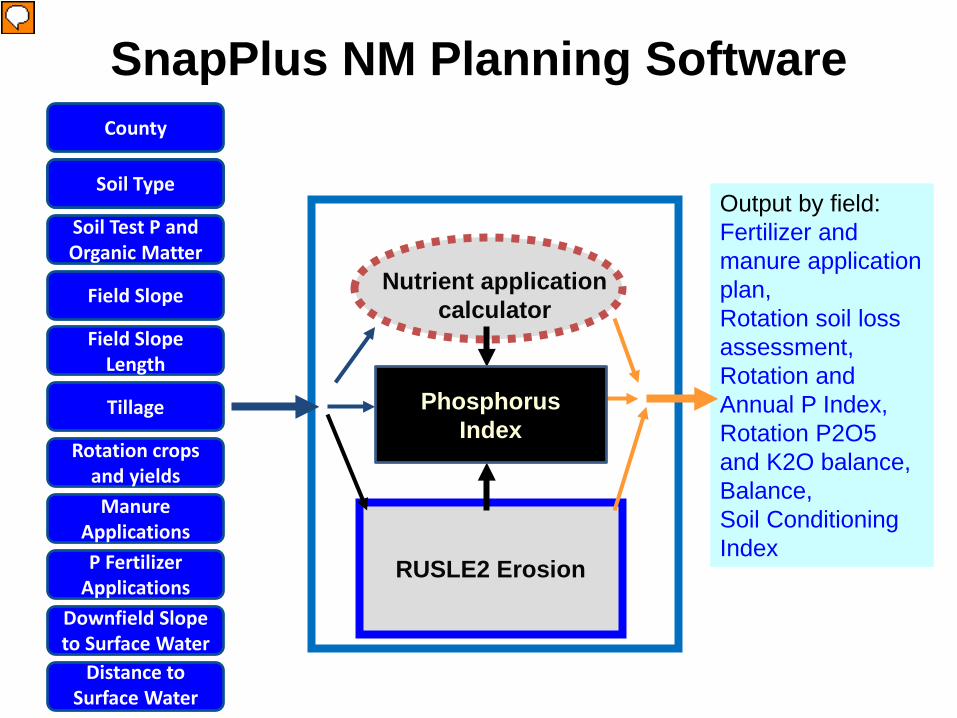
RUSLE2 Erosion
P Index calculator
Output by field: Fertilizer and manure application plan, Rotation soil loss assessment, Rotation and Annual P Index, Rotation P2O5 and K2O balance, Balance, Soil Conditioning Index
Nutrient application calculator
County
Soil Test P and Organic Matter
Field Slope
Field Slope Length
Tillage
Rotation crops and yields
Manure Applications P Fertilizer
Applications Downfield Slope to Surface Water
Soil Type
Distance to
Surface Water
Soil Type
Phosphorus Index
SnapPlus NM Planning Software


FARM SCREEN:
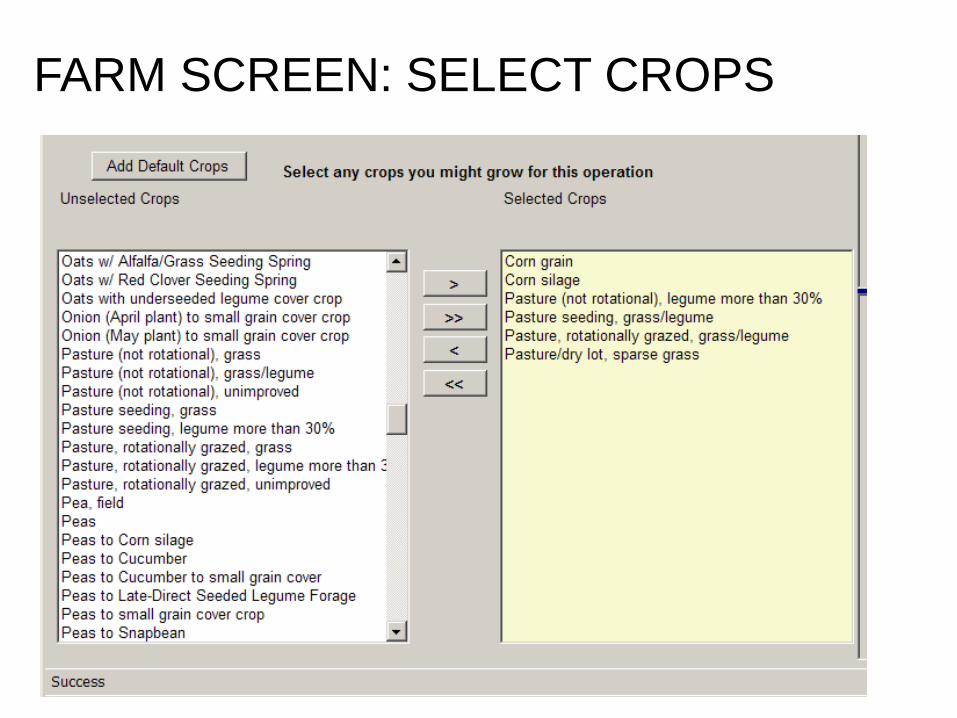
FARM SCREEN: SELECT CROPS

FIELD SCREEN:


FIELD SCREEN: Select soil and distance to water

SOIL TEST SCREEN

Nutrients Screen: Add manure types including grazing animal;s
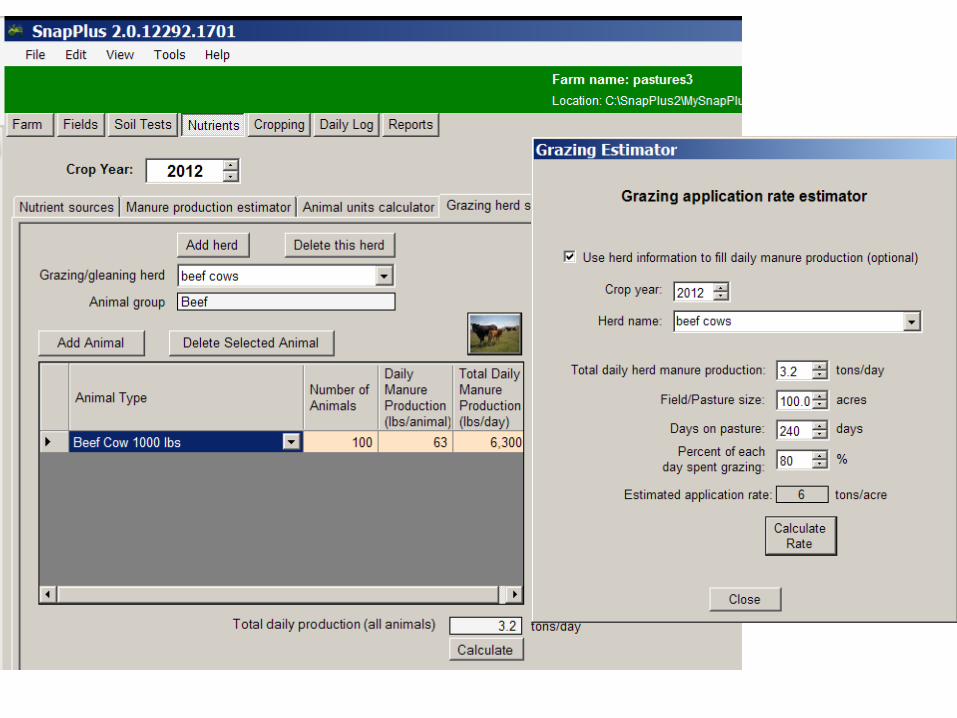

7 tons/acre Grazing Season
19 tons/acre Winter Season

Setting up the rotation in Rotation Editor
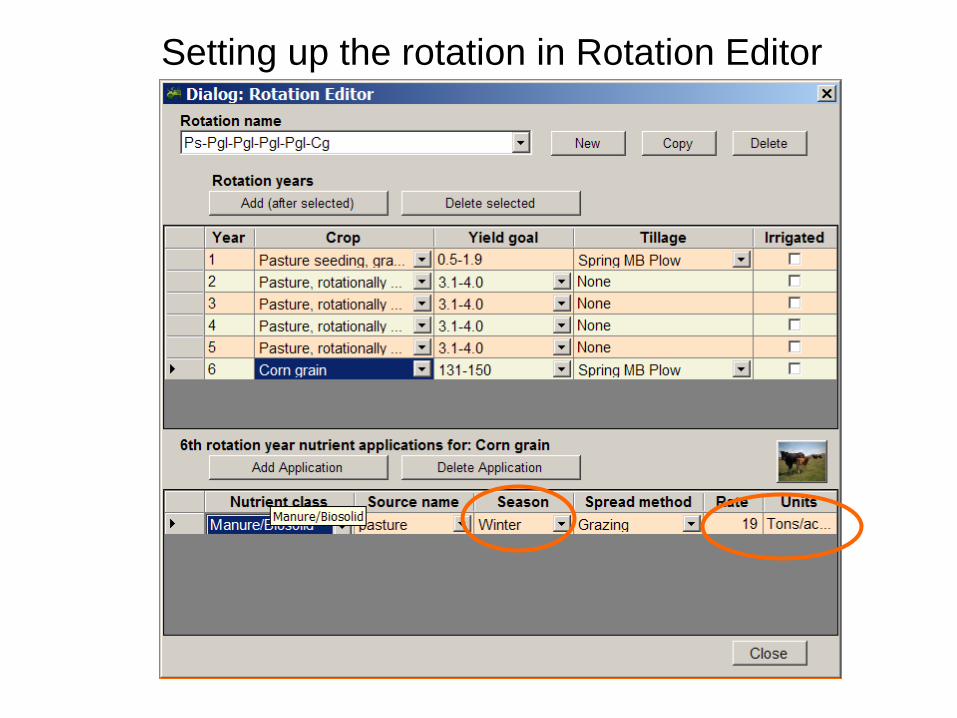
Setting up the rotation in Rotation Editor

Cropping Screen


Highest annual P Index is 5 in corn year
SCI is Soil Conditioning Index: Greater than 0 means building organic matter

Effect of changing soil test P or slope on rotation P Index
STP ppm
P Index
15 2
150 3
300 4
Slope Erosion T/a/yr
P Index
2% 0.2 1
4% 0.5 2
9% 1.1 2

Take home:
P Index are not likely to be high on managed pasture except for overwintering areas