nutrient density and the evolving nutrition profiling environment nutrient rich foods coalition: a...
TRANSCRIPT

Nutrient Density and the Evolving Nutrition Profiling Environment
Nutrient Rich Foods Coalition: A New Approach
2
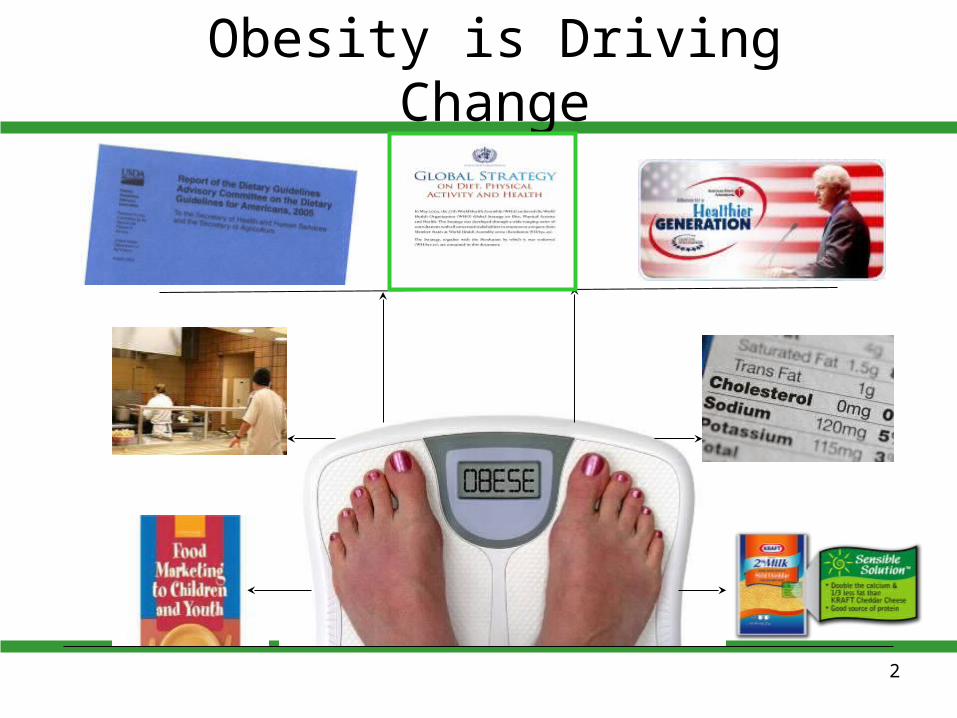
Obesity is Driving Change

Consumers Strive to Make Healthful Choices
4
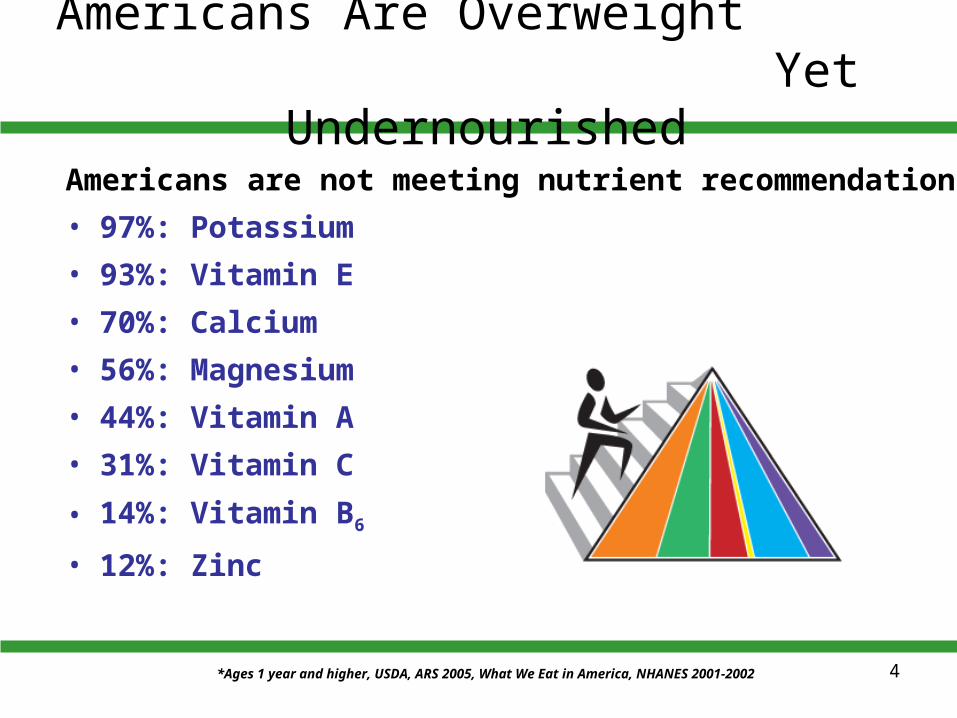
Americans Are Overweight Yet Undernourished
Americans are not meeting nutrient recommendations
• 97%: Potassium
• 93%: Vitamin E
• 70%: Calcium
• 56%: Magnesium
• 44%: Vitamin A
• 31%: Vitamin C
• 14%: Vitamin B6
• 12%: Zinc
*Ages 1 year and higher, USDA, ARS 2005, What We Eat in America, NHANES 2001-2002

55
Proliferation of Profiles

66
Nutrient Profiling at Retail
NUTRITIONThree-Star Snacks In Aisle FiveBy Anne Underwood
NOV 12, 2007 ISSUE
Overall Nutritional Quality Index (ONQI)
FDA Public HearingSeptember 10-11, 2007:Use of Symbols to Communicate
Nutrition Information,Consideration of Consumer Studies and Nutritional Criteria

7
Implication of the Stars

8
The Nutrient Rich Foods Approach
An evolution from being based on what to avoid …
To being based on what to include, and considering the “whole food” or total nutrient package …
A positive, common-sense approach to eating that emphasizes the total diet …

The Nutrient Rich Foods InitiativeWhat’s Best for Consumers?

10
Nutrient Rich Foods Coalition
Funded by The Beef Checkoff
11
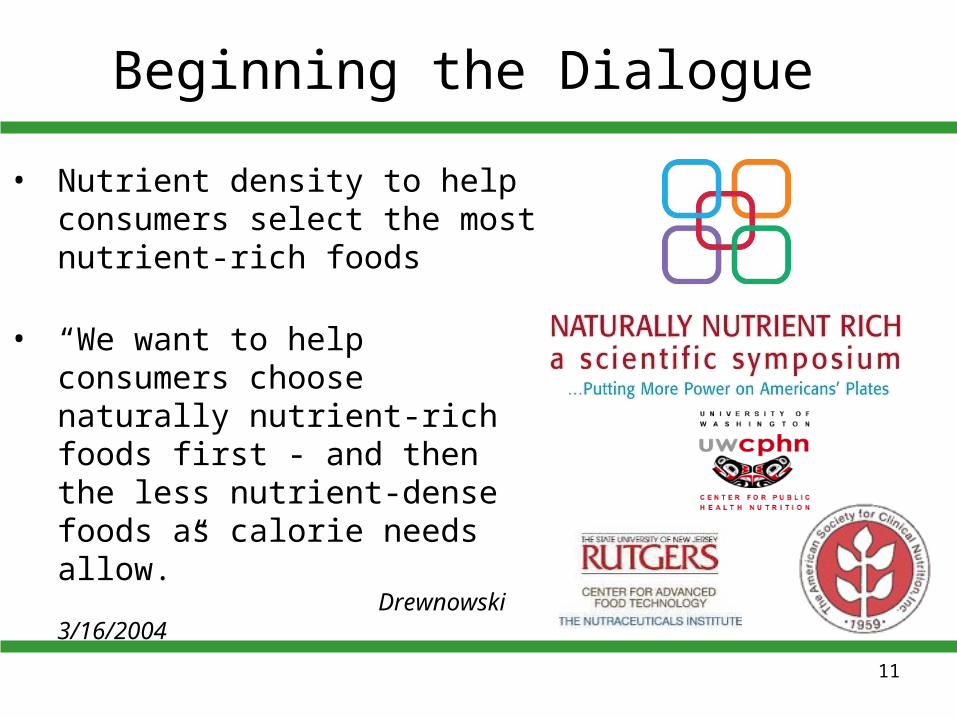
Beginning the Dialogue
• Nutrient density to help consumers select the most nutrient-rich foods
• “We want to help consumers choose naturally nutrient-rich foods first - and then the less nutrient-dense foods as calorie needs allow.”
Drewnowski 3/16/2004

12
Nutrient Density: Cornerstone of 2005 Dietary Guidelines for Americans
Choose the most nutritionally rich foods you can from each food
group each day.
Get the most nutrition out of your calories
Maximizing your nutrients -- making
calories count for you

• Develop a scientifically valid definition for "nutrient density” that could be useful on the food label
• Determine what criteria are necessary for foods to meet this definition
Dietary Guidelines Advisory Committee Call-to-Action
Overall Theme of 2005 DGAC Technical Report: Importance of
Nutrient-Rich Diets
13

14
Scientific Advisory Committee•Adam Drewnowski, PhD, University of Washington•Victor Fulgoni, PhD, Nutrition Impact, LLC•Robert Heaney, MD, FACP, FAIN, Creighton University•Eileen Kennedy, PhD, Tufts University•Janet King, PhD, University of California, Berkeley & Davis•Nancy Krebs, MD, University of Colorado•Paul LaChance, PhD, Rutgers University•Esther Myers, PhD, RD, American Dietetic Association
NRF Coalition Advisory Committees
Consumer Communications & Nutrition Behavior Committee
•Jane Andrews, MS, RD, Wegmans•Robert McKinnon, YellowBrick Road•Amy Mobley, PhD, RD, Purdue University •Laura Peracchio, PhD, University of Milwaukee •Connie Diekman, MEd, RD, LD, FADA, Washington University St. Louis•Kathleen Zelman, MPH, RD, nutrition consultant

Building the Nutrient Rich Foods System

16
NRF Coalition Vision
The Nutrient Rich Foods approach is a scientifically proven, consumer-tested system that is widely accepted and makes it easy for people to build and enjoy healthier diets by getting the most nutrition from their calories.

• Objective - based on accepted nutrition science and labeling practices
• Simple – based on published daily values and meaningful amounts of food
• Balanced – based on nutrients to encourage and on nutrients to limit
• Validated – against measures of a healthful diet
• Transparent – based on published algorithms and open-source data
• Consumer-driven – likely to guide better food choices and more healthful diets
17
Nutrient Profiling Criteria
Drewnowski, Fulgoni. Nutr Rev 2008

18
The Nutrient Rich Foods Index is the only index that meets all 6 criteria:
• Objective - based on 2005 Dietary Guidelines; 2005 MyPyramid and other expert panel data
• Simple – based on percent Daily Values and reference amounts (RACC) published by the FDA
• Balanced – based on nutrients to encourage and nutrients to limit
• Validated – against 2005 Healthy Eating Index (HEI)
• Transparent – algorithms published in peer-review journals; based on FNDDS and SR-20 data from USDA
• Consumer-driven – research on helping consumers to build healthier diets is in progress
Drewnowski, Fulgoni. Nutr Rev 2008

Objective and Simple
Select Nutrients to Encourage:
• The 2005 Dietary Guidelines sevenFiber, vitamins A, C, E, Ca, K, Mg
• The Food and Drug Administration six– FDA defines “healthy” foods as those that contain
>10% DV of protein, fiber, vitamins A, C, Ca, Fe
• Additional special population needs– Zn, Fe, folate, vitamins D, B12
19

Objective and Simple
Select Nutrients to Limit:• The 2005 Dietary Guidelines five
– Saturated fat, trans fat, cholesterol, added sugar, and sodium
• The Food and Drug Administration four– FDA disqualifies foods from health claims if they contain fat,
saturated fat, cholesterol or sodium above specified amounts
• The European Union five– Article 4 lists total fat, saturated fat, trans fat, sugar, and sodium
• The French three– AFSSA uses saturated fat, added sugar, and sodium
20
21
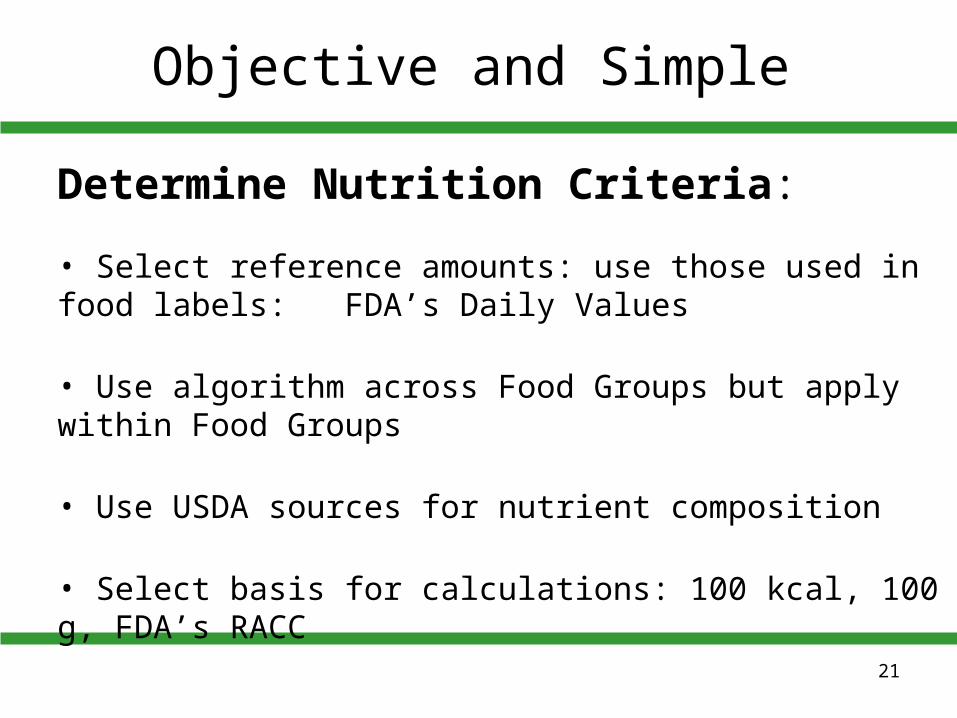
Determine Nutrition Criteria:
• Select reference amounts: use those used in food labels: FDA’s Daily Values
• Use algorithm across Food Groups but apply within Food Groups
• Use USDA sources for nutrient composition
• Select basis for calculations: 100 kcal, 100 g, FDA’s RACC
Objective and Simple

NRF RACC-based scores:
• Consistent with US labeling regulations (100g EU)
• Scores/serving (RACC) more relevant to consumers
• RACC-based scores rank foods similarly to 100 kcal
• Consistent with the nutrient density definition
22
Objective and Simple

Balanced
Create Algorithm:• The total score balances nutrients to encourage
and nutrients to limit
• Calculate % Daily Value for nutrients to encourage (capped at 100%DV/100 kcal or RACC)
• Subtract same for saturated fat, added sugars and sodium
23
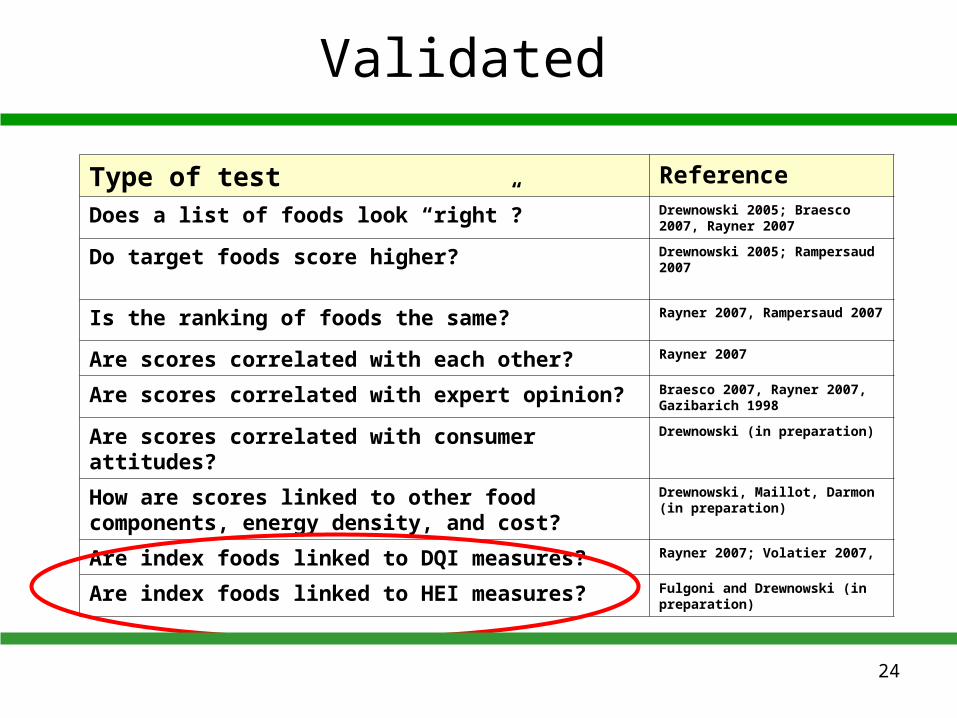
Type of test Reference
Does a list of foods look “right”? Drewnowski 2005; Braesco 2007, Rayner 2007
Do target foods score higher? Drewnowski 2005; Rampersaud 2007
Is the ranking of foods the same? Rayner 2007, Rampersaud 2007
Are scores correlated with each other? Rayner 2007
Are scores correlated with expert opinion? Braesco 2007, Rayner 2007, Gazibarich 1998
Are scores correlated with consumer attitudes?
Drewnowski (in preparation)
How are scores linked to other food components, energy density, and cost?
Drewnowski, Maillot, Darmon (in preparation)
Are index foods linked to DQI measures? Rayner 2007; Volatier 2007,
Are index foods linked to HEI measures? Fulgoni and Drewnowski (in preparation)
Validated
24

Validated
• Family of NRF Indices have been validated against objective measures of a healthy diet – Measure of diet quality (Healthy Eating Index)– Body Mass Index – Blood pressure– Cholesterol levels
• Validation identified NRF 9.3 to be consumer tested
Protein, Fiber, Vitamin A, C, E, Calcium, Magnesium. Iron, Potassium Saturated Fat, Sodium and Added Sugars
25

Component Points Std. for max. score Std. for min. scoreTotal Fruit (includes 100% juice) 5 ≥0.8 cup equiv. per 1,000 kcal No Fruit
Whole Fruit (not juice) 5 ≥0.4 cup equiv. per 1,000 kcal No Whole Fruit
Total Vegetables 5 ≥1.1 cup equiv. per 1,000 kcal No vegetables
Dark Green and OrangeVegetables and Legumes
5 ≥0.4 cup equiv. per 1,000 kcal No Dark Green or Orange Vegetables and Legumes
Total Grains 5 ≥3.0 oz equiv. per 1,000 kcal No Grains
Whole Grains 5 ≥1.5 oz equiv. per 1,000 kcal No Whole Grains
Milk 10 ≥1.3 cup equiv. per 1,000 kcal No Milk
Meat and Beans 10 ≥2.5 oz equiv. per 1,000 kcal No Meat or Beans
Oils 10 ≥12 grams per 1,000 kcal No Oil
Saturated Fat 10 ≤7% of energy ≥15% of energy
Sodium 10 ≤0.7 gram per 1,000 kcal ≥2.0 g per 1,000 kcal
Calories from Solid Fat, Alcohol,and Added Sugar (SoFAAS)
20 ≤20% of energy ≥50% of energy
Healthy Eating Index 2005
2626

Sept/Oct ‘07 Jan ‘08
Additional Articles in Development …
Feb ‘08
2008
Transparent
27

Making the NRF Approach Relevant to Consumers

29
Making it Relevant for Consumers I
• Talked to consumers about nutrient density and what it means to them to
– Determine which messages resonate
– Understand the right ways to communicate nutrient density concepts

30
Making it Relevant for Consumers I
• Consumers want to get more nutrients in their diets …
• But they don’t know how to – Overwhelmed – Tend to give up on
nutrients/nutrition– Tools
• “Dense” means heavy or stupid“I don’t know
how to shop for nutrient-dense
foods.”-- Consumer,
Denver

“Take small steps, so someone might not be overwhelmed … They can do a little bit at a time.”
-- Consumer, Denver
Headlines Must Empathize and Empower
• Take Small Steps for a Healthier You– Get more nutrition out of your calories by choosing the most
nutritionally rich foods from each food group each day• Recognized that healthy eating can be difficult … made the goal
seem less intimidating and less challenging• Gave them permission to make changes a little bit at a time• Avoid “calories,” which can intimidate consumers
31

“If you follow these rules forthese food groups, you’re
going to live well.”-- Consumer, Chicago
“I like how they point out non-fat, lowfat, lean and whole … and that you’re going to be satisfied.”
-- Consumer, Denver
Headlines Must Deliver A Strong Consumer Benefit
• Live Well– Enjoy nutrient-rich foods from all five food groups including fruits,
vegetables, nonfat and lowfat dairy, lean meats, and whole grains
• Spoke to their primary goals related to food and health: taste and general well-being
• Liked messages that emphasized the health benefits of all food groups
32

33
Making it Relevant for Consumers II
• Consumer research to bring index application to life for consumers
• Application will be where consumers interact with food
• User-driven design– Consumer-driven brand/design– Educational tools– Total diet translation– Diets/menus/recipes– Expanded web site

Supporting the Research: Influencer & Consumer
Communications

35
Health Professional/ScientistBriefings & Symposia
EB 2008: NRF Scientific Forum
and PIC Symposium

36
Resources
www.NutrientRichFoods.org
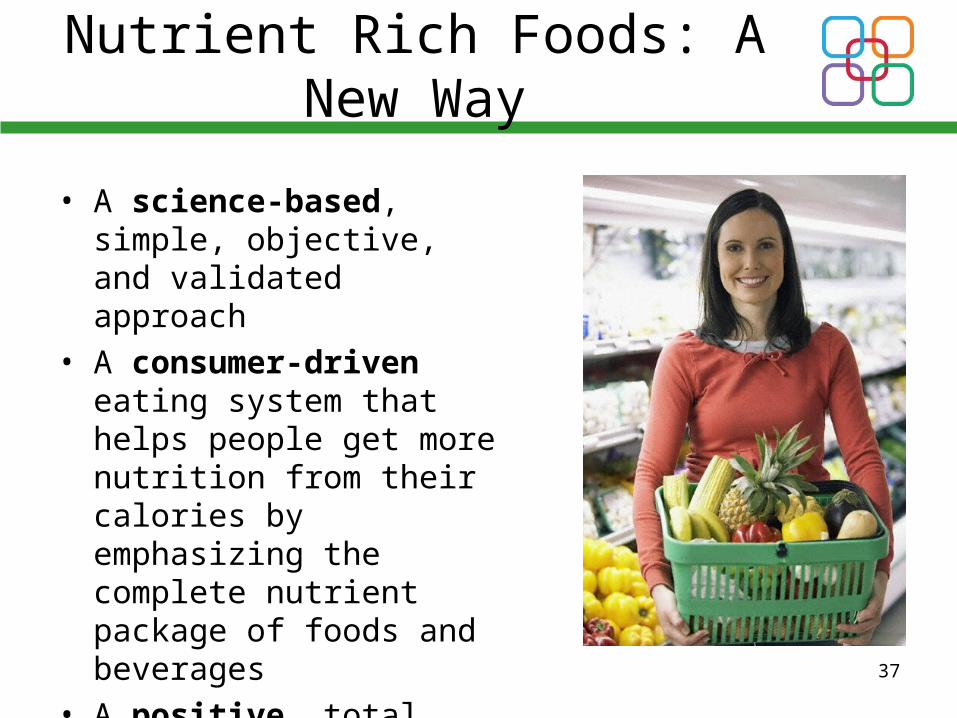
• A science-based, simple, objective, and validated approach
• A consumer-driven eating system that helps people get more nutrition from their calories by emphasizing the complete nutrient package of foods and beverages
• A positive, total food / total diet approach
Nutrient Rich Foods: A New Way
37