nutrients and photoinhibition as controls on lake …
TRANSCRIPT
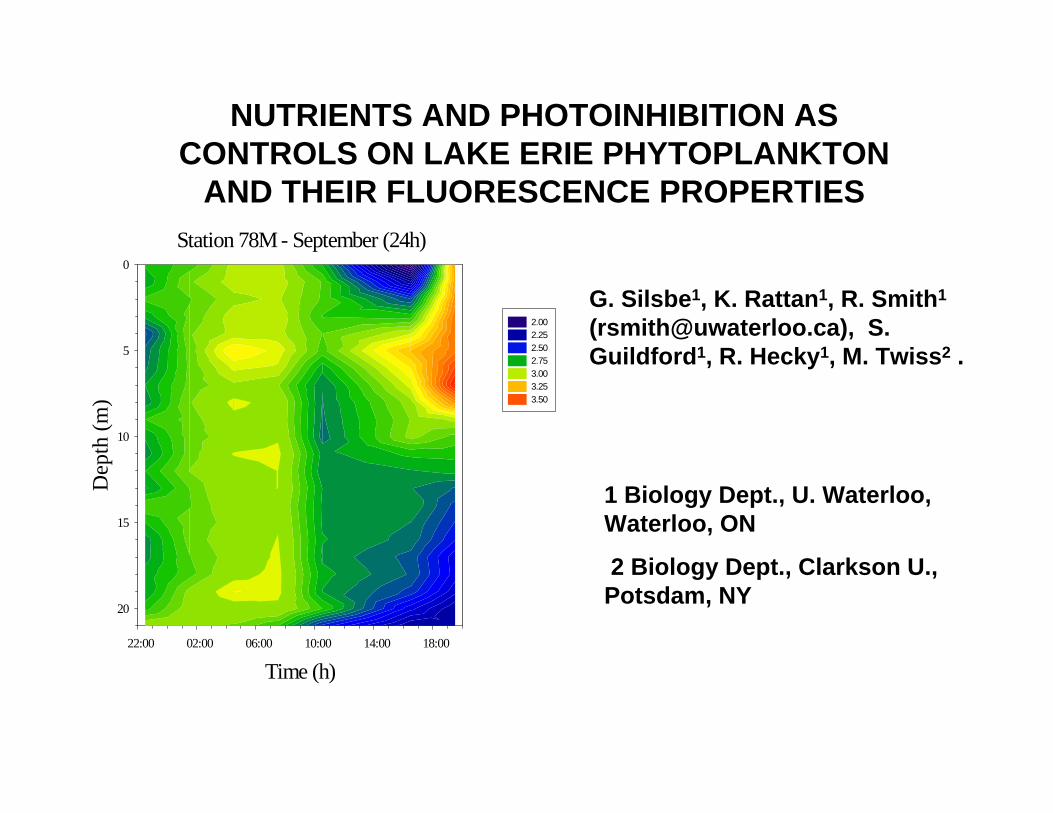
NUTRIENTS AND PHOTOINHIBITION AS CONTROLS ON LAKE ERIE PHYTOPLANKTON
AND THEIR FLUORESCENCE PROPERTIES
G. Silsbe1, K. Rattan1, R. Smith1
([email protected]), S. Guildford1, R. Hecky1, M. Twiss2 .
1 Biology Dept., U. Waterloo, Waterloo, ON
2 Biology Dept., Clarkson U., Potsdam, NY
Station 78M - September (24h)
Time (h) 22:00 02:00 06:00 10:00 14:00 18:00
Dep
th (m
)
0
5
10
15
20
2.00 2.25 2.50 2.75 3.00 3.25 3.50
Purpose
• Identify nature and scope of nutrient limitation of phytoplankton
• Assess fluorescence methods as means of characterizing nutrient status, physiological condition, and productivity
• Assess vertical structure and photoinhibitionas influences on surface layer phytoplankton characteristics

The NT/IFYLE Project – Study Sites
June 2005
May 2005 July 2005
September 2005
83 Wo 82 Wo 81 Wo 80 Wo 79 Wo 83 Wo 82 Wo 81 Wo 80 Wo 79 Wo
42 No
43 No
o41 N
42 No
43 No
o41 N
42 No
43 No
o41 N
42 No
43 No
o41 N
4 “Lakewide” Cruises (below) and 1 diel survey (not shown) in Central basin

The NT Project – What we did
~180 CTD Profiles
~135 Optical Profiles (Fast Repetition Rate Fluorometry, Fluoroprobe, PAR)
~115 Water Chemistry Suites (Chl –a, PAB spectra, TP, TDP, SRP, Part. C, Part. N, Part. P, SRSi, NH3, N03, Phytoplankton and Bacterial Samples)
Greg: ~113 14C Photosynthetic Irradiance Curves and 226 Alkalinity Titrations
Kim: ~ 200 Nutrient Assays
Maggie: ~15 C02 Production Experiments
4 Spatial/Diurnal Surveys in the Bay of Quinte

4 5 6 7 8 9 10MONTH
10
15
20
25303540
TP (u
g l- 1
)
westerneasterncentral-westcentral
BASIN

4 5 6 7 8 9 10MONTH
2
4
6
810
SR
P (u
g l-1
)
westerneasterncentral-westcentral
BASIN

4 5 6 7 8 9 10MONTH
5
10152025
Chl
a (u
g l-1
)
westerneasterncentral-westcentral
BASIN

Nutrient status indicators
Assay Nutrient Moderate Extreme Deficient
Deficiency Deficiency
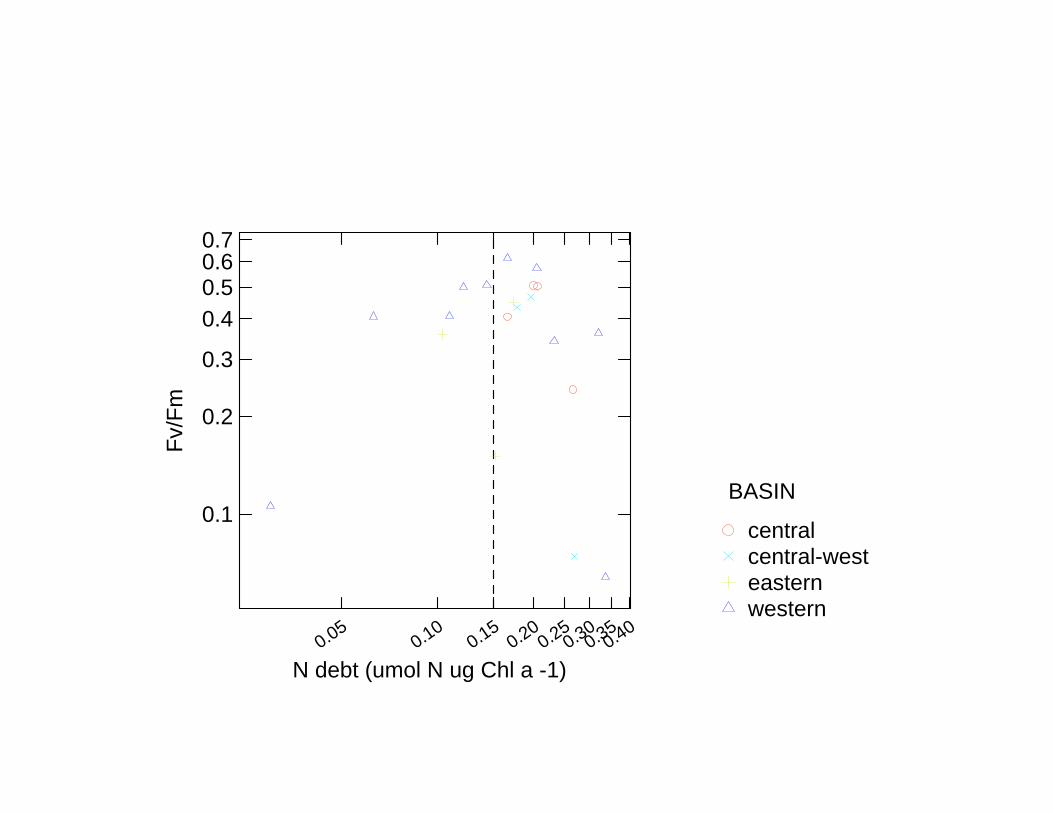
N debt N >0.15
P debt P >0.075
APA P 0.003-0.005 >0.005
C:N N 8.3-14.6 >14.6
C:P P 129-258 >258

4 5 6 7 8 9 10MONTH
0.001
0.010
0.100
P d
ebt (
umo l
P u
g C
hl a
- 1)
westerneasterncentral-westcentral
BASIN
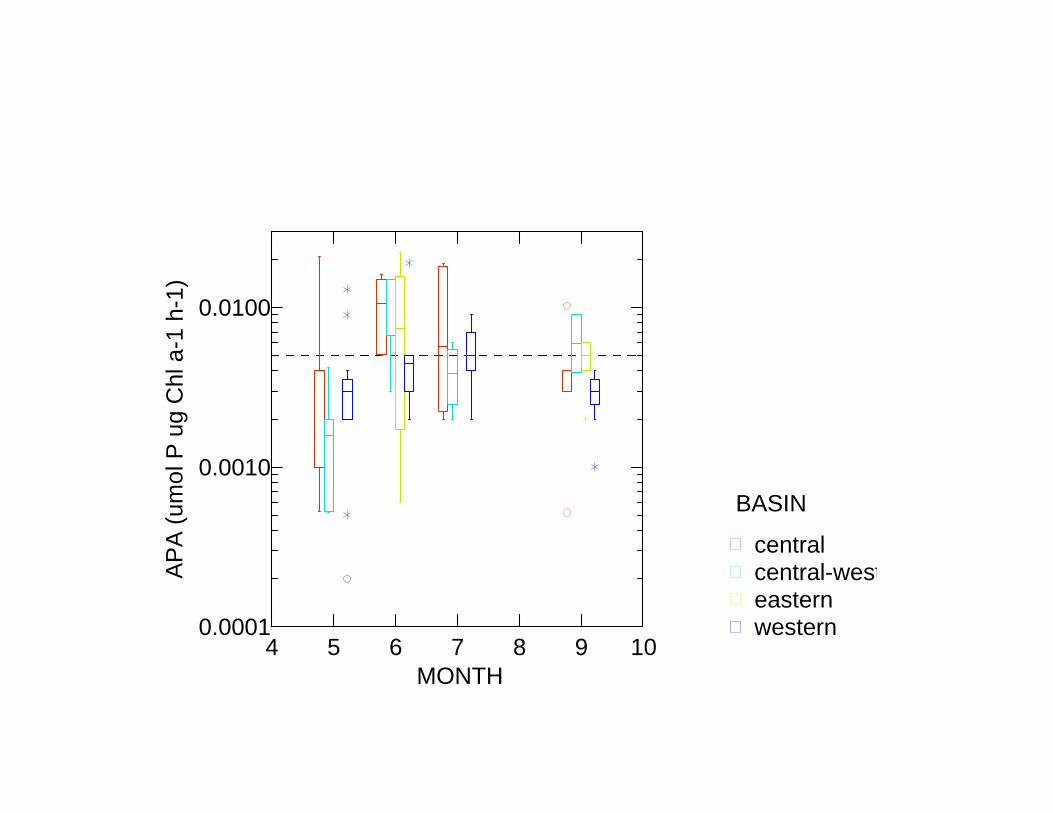
4 5 6 7 8 9 10MONTH
0.0001
0.0010
0.0100
AP
A (u
mo l
P u
g C
h l a
-1 h
-1)
westerneasterncentral-westcentral
BASIN

4 5 6 7 8 9 10MONTH
0.001
0.010
0.100
N d
ebt (
umol
N u
g C
hl a
- 1)
westerneasterncentral-westcentral
BASIN
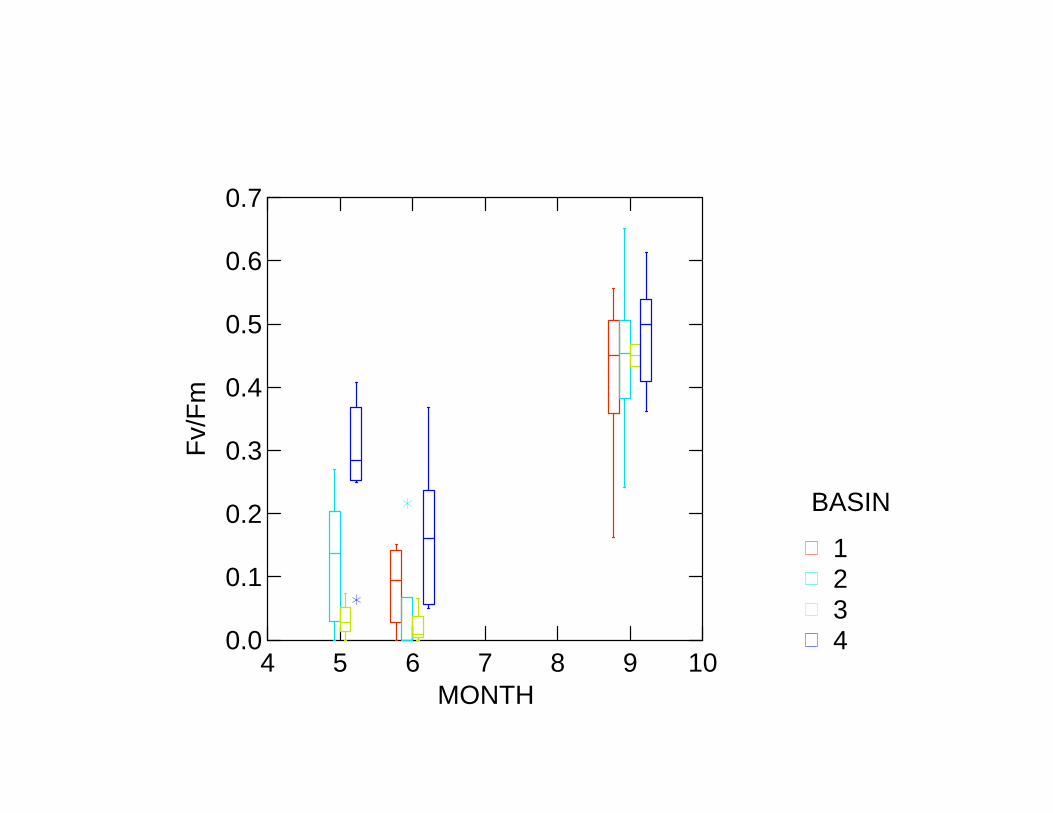
4 5 6 7 8 9 10MONTH
0.0
0.1
0.2
0.3
0.4
0.5
0.6
0.7Fv
/Fm
4321
BASIN
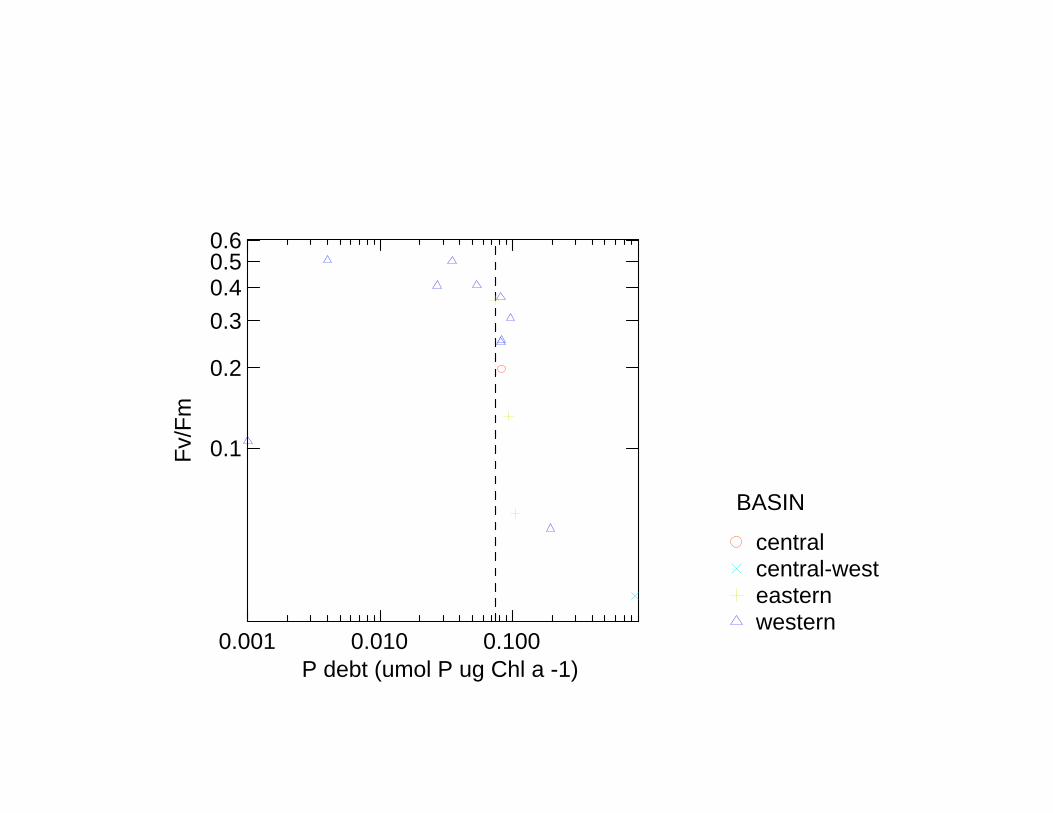
0.001 0.010 0.100P debt (umol P ug Chl a -1)
0.1
0.2
0.30.40.50.6
Fv/F
m
westerneasterncentral-westcentral
BASIN
0.050.10
0.150.20
0.250.30
0.350.40
N debt (umol N ug Chl a -1)
0.1
0.2
0.3
0.40.50.60.7
Fv/F
m
westerneasterncentral-westcentral
BASIN

Date and Time
Dep
th (m
)
0
5
10
15
20
0.05 0.15 0.25 0.35 0.45 0.55 0.65
Dep
th (m
)
0
5
10
15
20
0 50 100 150 200 250 300 350 400
Dep
th (m
)
0
5
10
15
20
8 10 12 14 16 18 19
Temperature (Deg C)
PAR (µmol.m-2.s-1)
Fv'/Fm'
09:00 12:00 15:00 18:00 21:00 24:00 03:00 06:00 09:0016-Jun-05 17-Jun-05

Date and Time
Dep
th (m
)
0
5
10
15
20
0.0 1.0 2.0 3.0 4.0 5.0 6.0
Dep
th (m
)
0
5
10
15
20
0.05 0.15 0.25 0.35 0.45 0.55 0.65
Dep
th (m
)
0
5
10
15
20
0 50 100 150 200 250 300 350 400
PAR (µmol.m-2.s-1)
Fv/Fm Dark Chamber
09:00 12:00 15:00 18:00 21:00 24:00 03:00 06:00 09:0016-Jun-05 17-Jun-05
Chl-a Fluorescence(µg.L-1)

Fv/Fm
0.0 0.1 0.2 0.3 0.4 0.5 0.6
Dep
th (m
)
0
5
10
15
20
25
Sigma PSII0 100 200 300 400
Fm
0 2 4 6 8 10 12 14 16
Fv/Fm DarkFv/Fm LightSigma PSIIFm Dark (Biomass)
Dark Adaptionfrom 2 m sample
Time
14:00 14:20 14:40 15:00 15:20 15:40 16:00
Sigm
a PS
II
0
100
200
300
400
500
600
Fv/F
m
0.0
0.1
0.2
0.3
0.4
0.5
0.6
0.7
Sigma PSIIFv/Fm
Time of Profile13:50
Conclusions to date
• Diel photoinhibition is a very significant complication but
• Moderate (15-20 minutes) periods of dark adaptation may remove most such effects
• N and P (and Si) deficiency symptoms occur in Lake Erie and
• Fv/Fm (dark adapted PAM) shows promise in detecting nutrient stress
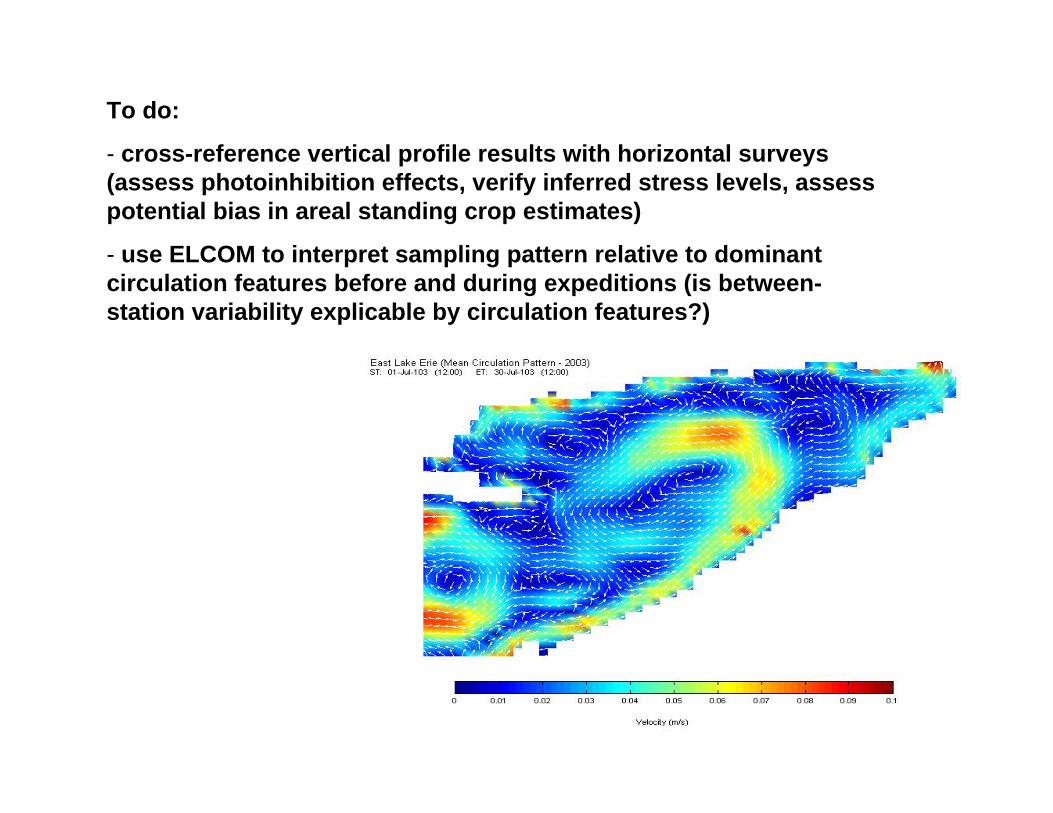
To do:
- cross-reference vertical profile results with horizontal surveys (assess photoinhibition effects, verify inferred stress levels, assess potential bias in areal standing crop estimates)
- use ELCOM to interpret sampling pattern relative to dominant circulation features before and during expeditions (is between-station variability explicable by circulation features?)
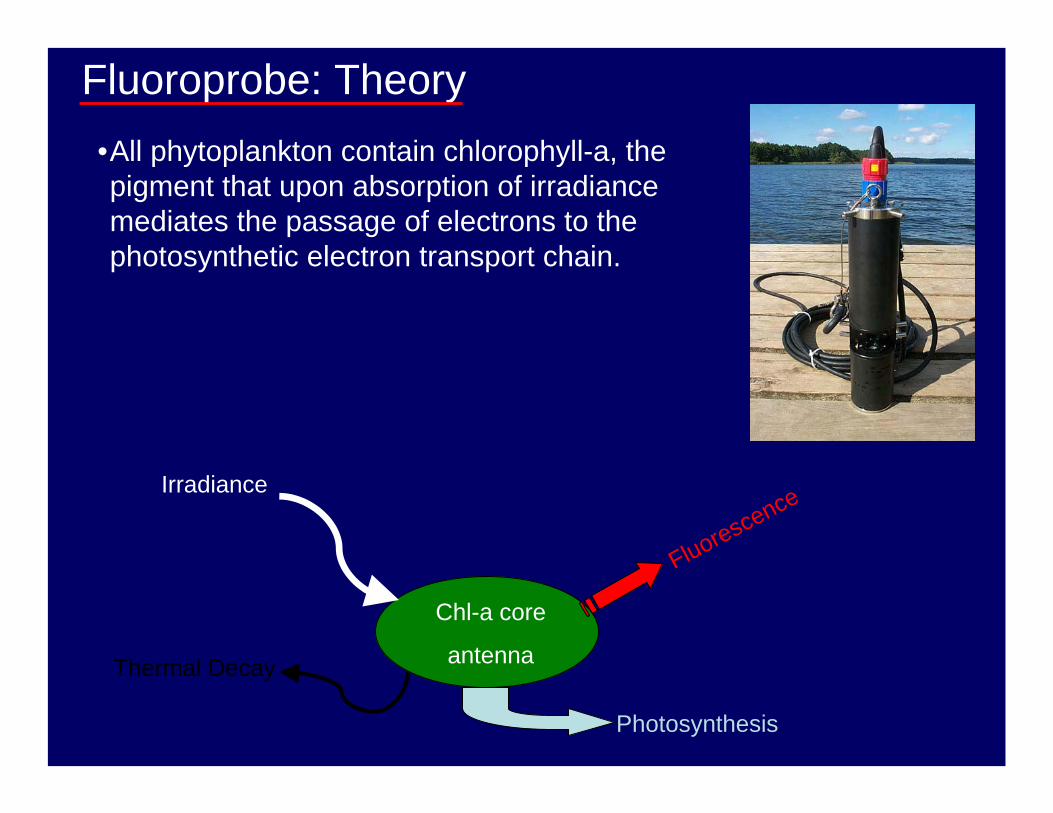
Fluoroprobe: Theory•All phytoplankton contain chlorophyll-a, the pigment that upon absorption of irradiance mediates the passage of electrons to the photosynthetic electron transport chain.
Chl-a core
antenna
Photosynthesis
FluorescenceIrradiance
Thermal Decay

Fluoroprobe: Theory•All phytoplankton contain chlorophyll-a, the pigment that upon absorption of irradiance mediates the passage of electrons to the photosynthetic electron transport chain.
Fluoroprobe: Theory•All phytoplankton contain chlorophyll-a, the pigment that upon absorption of irradiance mediates the passage of electrons to the photosynthetic electron transport chain.
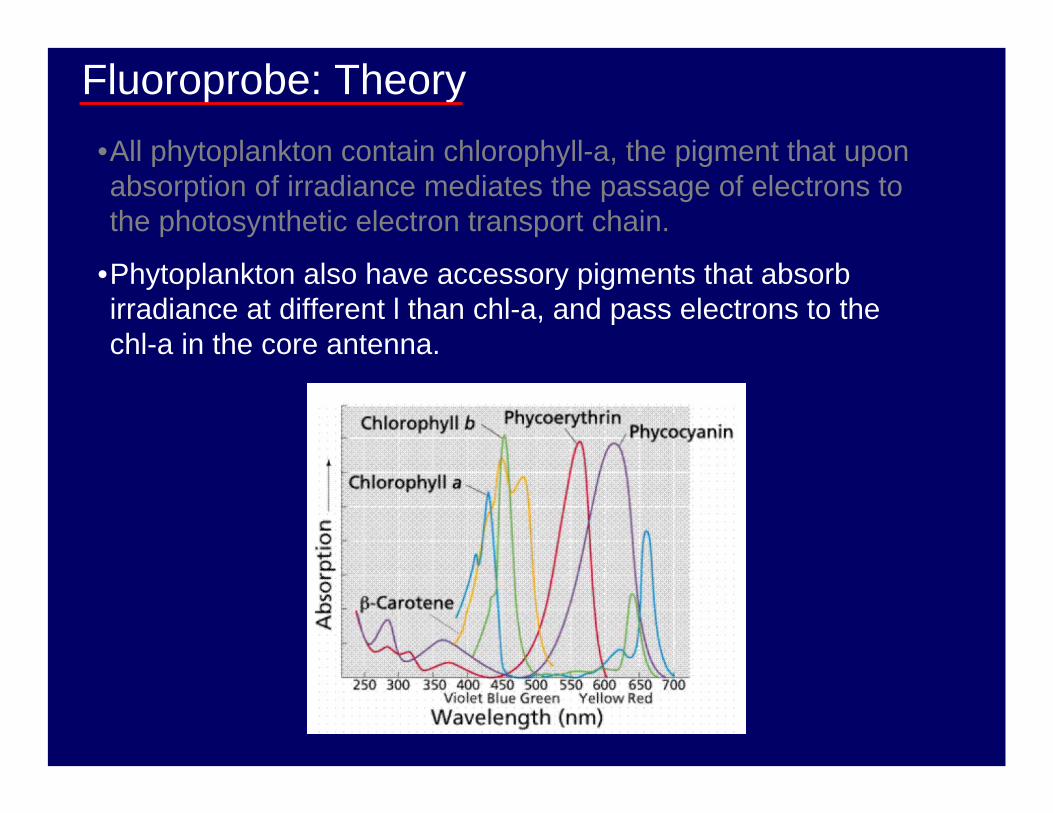
•Phytoplankton also have accessory pigments that absorb irradiance at different l than chl-a, and pass electrons to the chl-a in the core antenna.
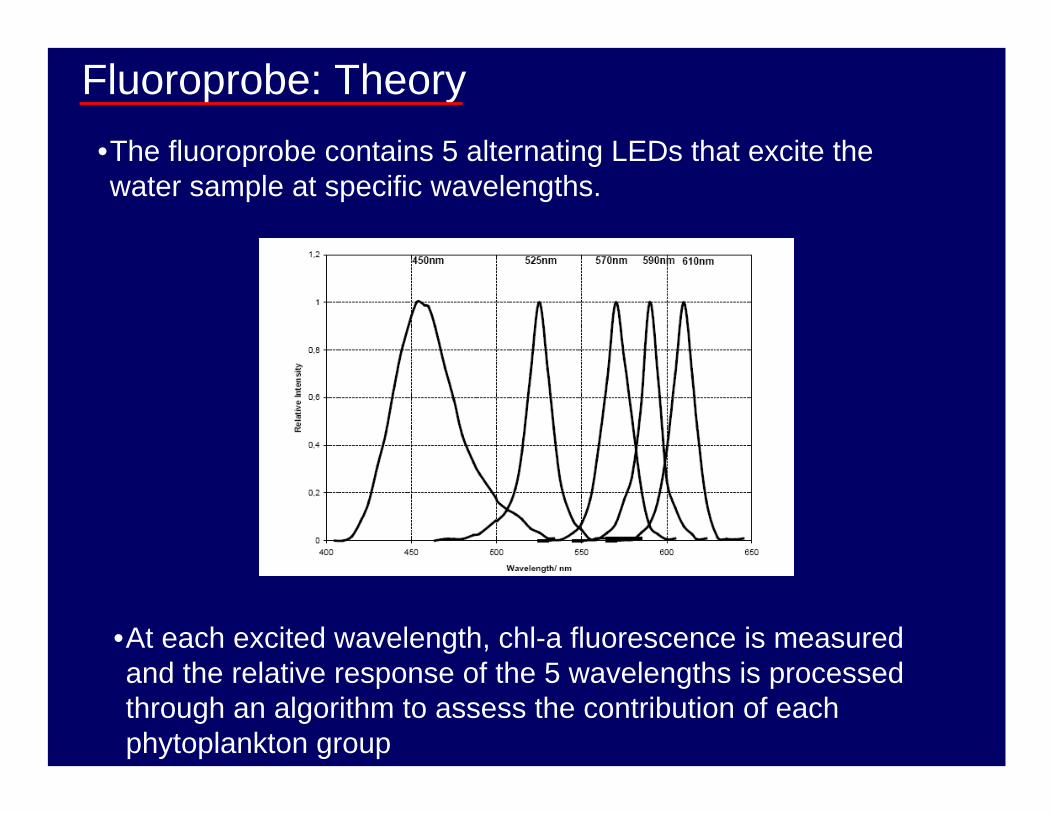
Fluoroprobe: Theory•The fluoroprobe contains 5 alternating LEDs that excite the water sample at specific wavelengths.
•At each excited wavelength, chl-a fluorescence is measured and the relative response of the 5 wavelengths is processed through an algorithm to assess the contribution of each phytoplankton group
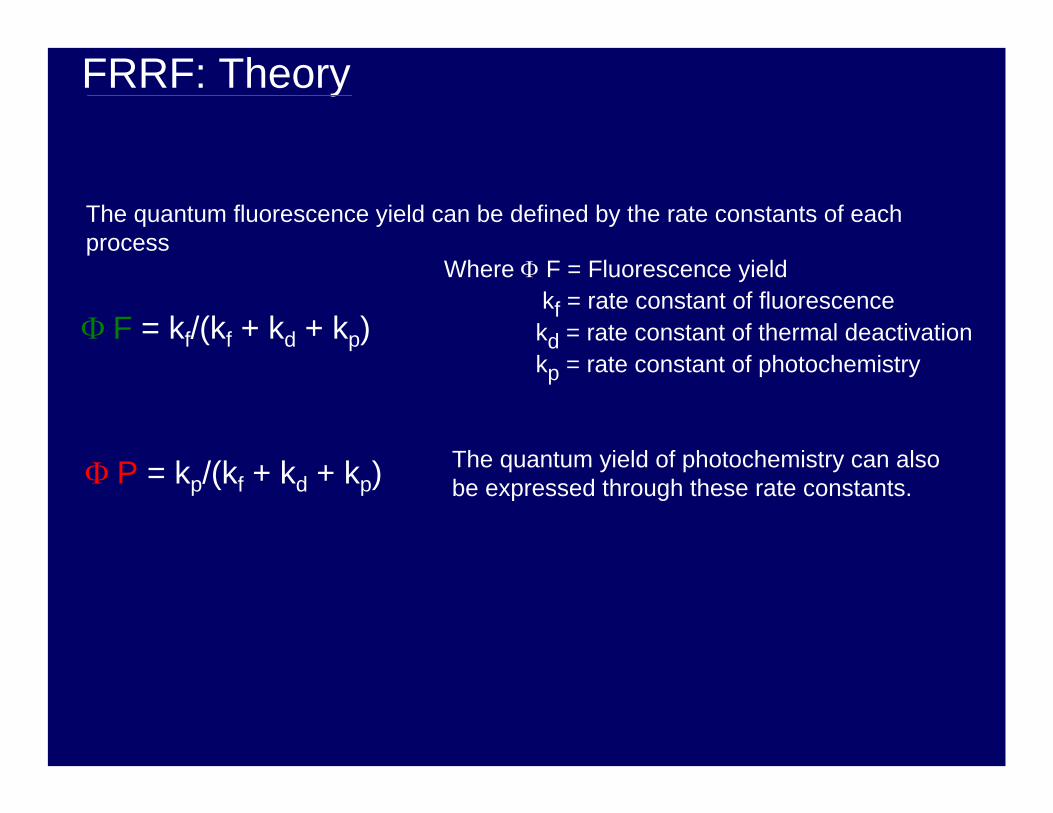
FRRF: Theory
Φ F = kf/(kf + kd + kp)
The quantum fluorescence yield can be defined by the rate constants of each process
Where Φ F = Fluorescence yieldkf = rate constant of fluorescencekd = rate constant of thermal deactivationkp = rate constant of photochemistry
Φ P = kp/(kf + kd + kp)The quantum yield of photochemistry can also be expressed through these rate constants.
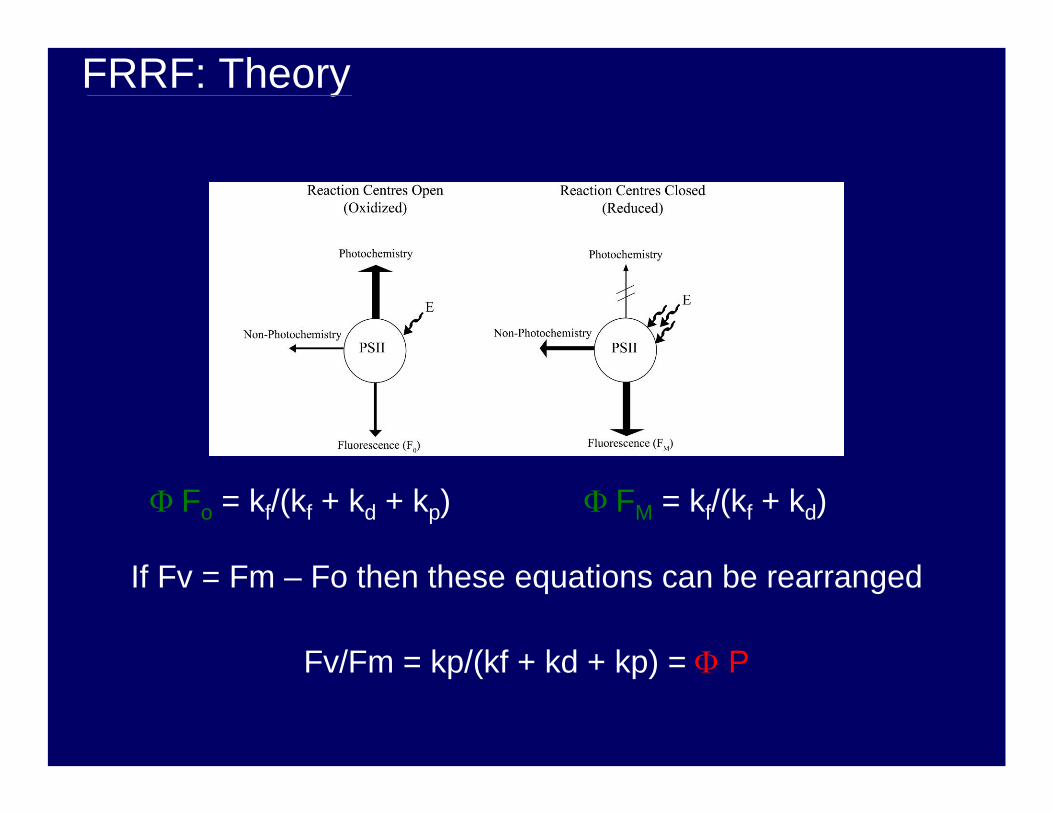
FRRF: Theory
Φ Fo = kf/(kf + kd + kp) Φ FM = kf/(kf + kd)
If Fv = Fm – Fo then these equations can be rearranged
Fv/Fm = kp/(kf + kd + kp) = Φ P

3. Fluorescence InductionFluorescent Probes
0 100000 200000 300000Cumulative Excitation Energy (a.u.)
1000
1500
2000
2500
3000
Fluo
resc
ence
(a.u
.)
Depth = 83.69m, 06:01:13, 03/08/99
00.20.40.60.81
(F -
F 0)/F
V
FV/FM = 0.449σPSII = 624 (± 89) (Å2 quanta-1)R2 = 0.860
The primary advantage of using a sequence of saturating pulses (FRRF) is you can obtain an instantaneous induction curve. The slope of the curve is represented mathematically using a poisson formula.
[F(E) – Fo] / Fv = 1 – e σPSII E
Where σPSII is the effective absorption cross-section of Photosystem II
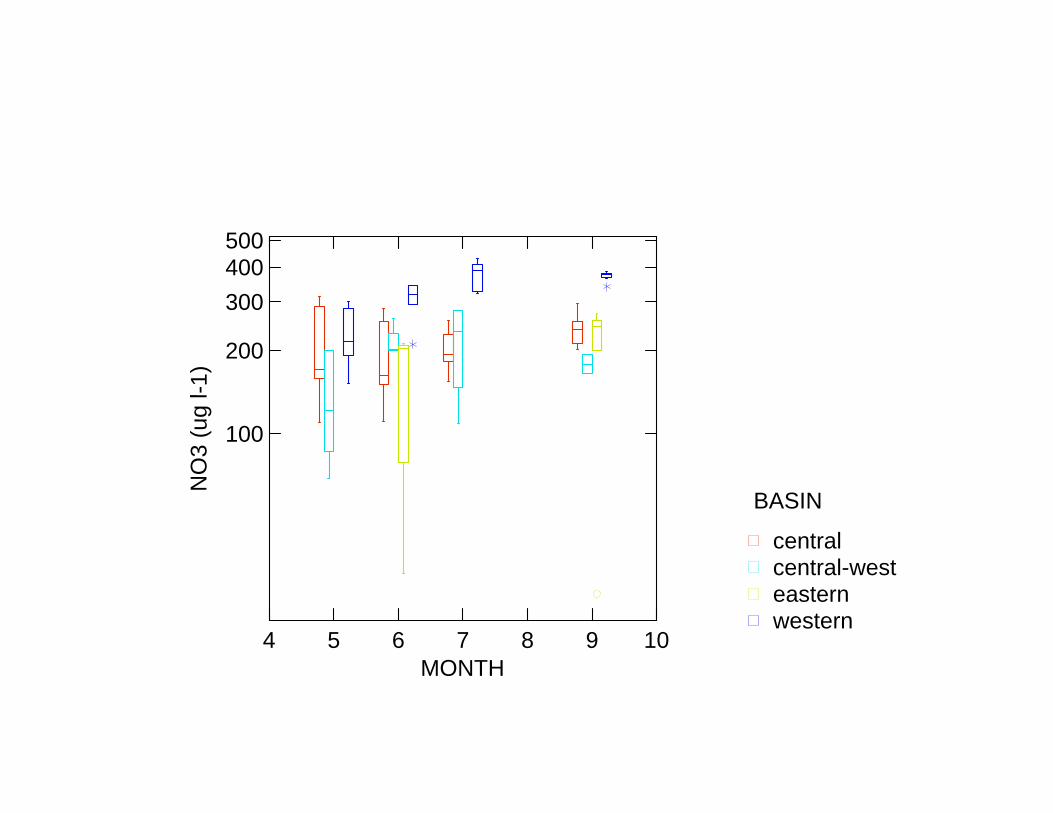
4 5 6 7 8 9 10MONTH
100
200
300400500
NO
3 (u
g l -1
)
westerneasterncentral-westcentral
BASIN

4 5 6 7 8 9 10MONTH
10
20
30
405060
NH
3 (u
g l-1
)
westerneasterncentral-westcentral
BASIN
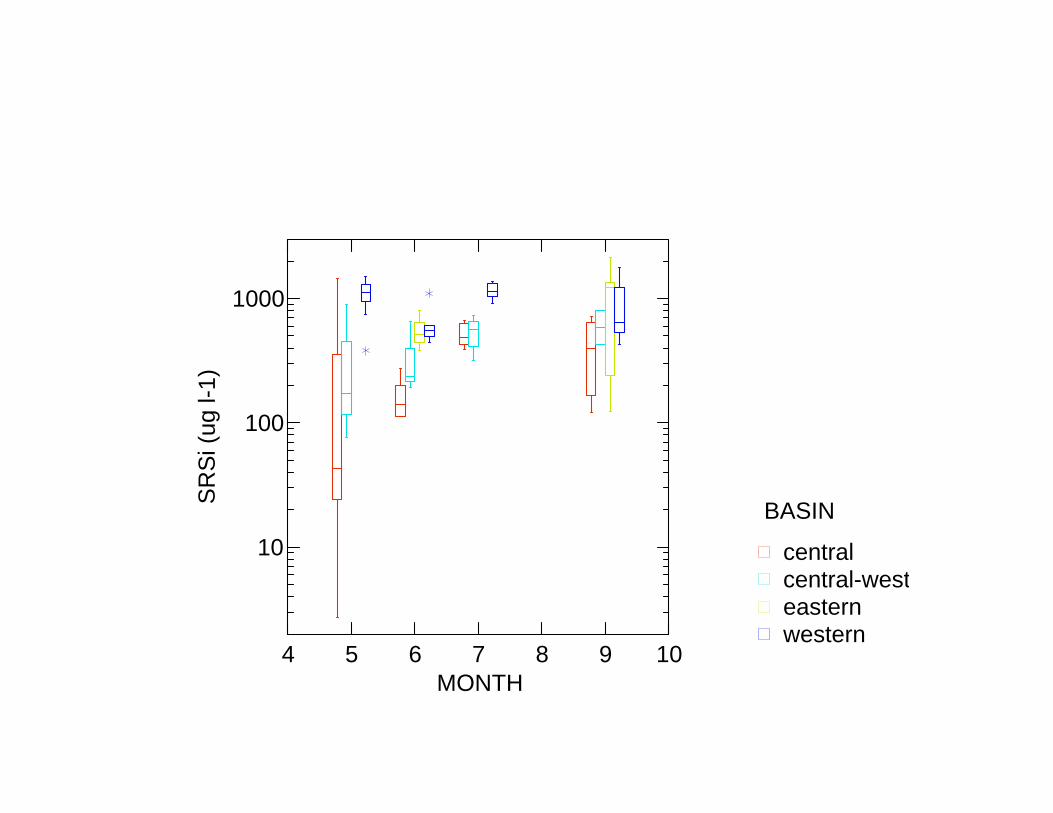
4 5 6 7 8 9 10MONTH
10
100
1000
SR
Si (
ug l-
1)
westerneasterncentral-westcentral
BASIN