nutrition and mortality survey - … · nutrition and mortality survey ... coordination from...
TRANSCRIPT

1
NUTRITION AND MORTALITY SURVEY
Tharparkar, Sanghar and Kamber Shahdadkhot districts of
Sindh Province, Pakistan
18-25 March, 2014
2
TABLE OF CONTENT TABLE OF CONTENT ................................................................................................................................... 2
ABBREVIATIONS ........................................................................................................................................... 3
EXECUTIVE SUMMARY ............................................................................................................................... 4 1. Introduction ................................................................................................................................................ 6 2. Objective of the Study ............................................................................................................................... 6 3. Methodology .............................................................................................................................................. 7
3.1 Study area ......................................................................................................................................... 7
3.2 Study population .............................................................................................................................. 7 3.3 Study design ...................................................................................................................................... 8
3.3.1 Sample size determination: ............................................................................................................ 8 3.3.2 Cluster determination and selection .............................................................................................. 8
3.4 Sampling Procedure......................................................................................................................... 8
3.5 Data Collection .............................................................................................................................. 9
3.5.1 Anthropometric measurements ...................................................................................................... 9
3.5.2 Mortality data ................................................................................................................................ 9 3.5.3 Morbidity data ............................................................................................................................... 9 3.5.4 Vaccination - Measles and BCG .................................................................................................. 10 3.5.5 Vitamin A supplementations ........................................................................................................ 10 3.5.6 Contextual factors ........................................................................................................................ 10
3.6 Survey management....................................................................................................................... 10
3.6.1 Coordination of the survey........................................................................................................... 10 3.6.2 Recruitment and Training of Enumerators .................................................................................. 10
3.7 Data analysis and Reporting .................................................................................................... 10 3.7.1 Data Analysis ............................................................................................................................... 10
3.7.2 Preliminary result and final report .............................................................................................. 10
4. RESULTS ................................................................................................................................................ 11 4.1 Sex and age distribution children 6 to 59 months ........................................................................ 11
4.2 Anthropometric results (WHO 2006) .......................................................................................... 11 4.3 Mortality results (retrospective over x months/days prior to interview) ..................................... 16 4.4 Child morbidity ............................................................................................................................ 16
4.5 Vitamin A Supplementation and Vaccination status ................................................................... 17 4.6 Household (HH) Characteristics .................................................................................................. 18
5. Discussion ................................................................................................................................................ 21 5.1 Nutritional status .............................................................................................................................. 21 5.2 Mortality .......................................................................................................................................... 22 5.3 Morbidity and coverage public health intervention ......................................................................... 23
5.4 Water, sanitation and Hygiene (WASH) ......................................................................................... 23 5.5 Household Food security ................................................................................................................. 24
6. Recommendations and priorities.............................................................................................................. 25 7. APPENDICES ......................................................................................................................................... 26
7.1 Assignment of clusters ..................................................................................................................... 26 7.2 Questionnaires.................................................................................................................................. 29
3
ABBREVIATIONS
ARI Acute Respiratory infection
BCG Bacillus Calmette–Guérin
CMAM Community Management of Acute Malnutrition
CDC center for disease control
CI confidence Interval
CMR Crude Mortality rate
DHO District Health Office
DHS Demographic Health Survey
EBF Exclusive Breastfeeding
ENA Emergency Nutrition assessment (ENA/SMART)
GAM Global Acute malnutrition
HFA Height for Age
HH Household
IP Implementing partner
IYCF Infant and young child feeding
MUAC Mid-Upper Arm Circumference
NNS National Nutrition Survey
PPS Probability Proportional to Size
SMART Standardized Monitoring and Assessment of Relief and Transitions
UC Union Council
UNICEF United Nations Children’s Fund
WASH Water Sanitation and Hygiene
WFA Weight-for-Age
WFH Weight-for-Height
WHO World Health Organization

4
EXECUTIVE SUMMARY
Through UNICEF technical and ECHO financial support, three SMART Nutrition and mortality surveys were conducted in Tharparkar, Sanghar and Kamber Shahdadkot districts of Sindh, Pakistan. The overall objective of the nutrition surveys were to measure the extent and severity of acute malnutrition in children aged 6-59 months in the above mentioned districts. The data collection was managed by implementing partners; HANDS, Shifa Foundation, and NDS through coordination from provincial nutrition cell. The survey for Tharparkar and Sanghar were conducted between 19th and 25th whereas for Kamber Shahdadkot between 18th and 24th March 2014. Provincial nutrition cell in coordination with District health office (DHO) and the implementing partners (IPs) in the respected district were responsible to manage the survey. UNICEF was responsible to provide technical support throughout the assessment including design the questionnaire, providing the training for enumerators, analyzing the data and supporting the report writing. The survey design was descriptive cross-sectional survey, two-stage cluster sampling. In stage one, in each district total of 35 clusters or villages were selected randomly from the list of all villages in the respected districts. In stage two, from each clusters, total of 15 houses were randomly selected using random table number. A total of 630 children in Tharparkar, 511 in Sanghar, and 693 children in Kamber Shahdadkot were assessed. The major findings are summarized below
FINDINGS The survey findings indicate that the prevalence of global acute malnutrition (GAM) of 22.7% in Tharparkar, 16.0% in Sanghar, and 13.8% in Kamber Shahdadkot. According to World Health Organization (WHO) classification of severity of acute malnutrition in a community, the rate in Tharparkar and Sanghar is classify as critical whereas for Kamber Shahdadkot it is under the classification of serious. According to WHO threshold for chronic malnutrition, the level of stunting all three surveys was found very high; 45.9% in Tharparkar, 53.4% in Sanghar and 48.4% in Kamber Shahdadkot. The crude (CMR) and under-five mortality rates (U5MR) in Tharparkar and Sanghar were almost within the acceptable range for South Asia region. The CMR and U5MR for Tharparkar was 0.2 and 0.9 deaths/10,000 people/day respectively whereas in Sanghar CMR was 0.22 and U5MR 0.64 /10,000 people/day. However, the CMR and U5MR in Kamber was 0.45 and 2.45 deaths/10,000 people/day which was above emergency threshold levels of the region. Two weeks period morbidity prevalence shows 43.5% of children in Tharparkar, 49.7% in Sanghar and 34.8% were sick. According to maternal report, the most common reported illness according to the rank were fever, cough, and diarrhea. Measles cases were reported in all three districts; Tharparkar 3.6%, Sanghar 24.6% and Kamber 4.1 percent. The assessment revealed that 68.8% of children in Tharparkar, 85.3% in Sanghar and 64.5% percent in Kamber Shahdadkot were received Vitamin A supplementation. BCG vaccination coverage in Tharparkar, Sanghar and Kamber was 51.9%, 80.8%, and 73.5% respectively. The coverage for measles (9 to 59 months) confirmed by card was 35% in Tharparkar, 77.5% in Sanghar and 35.9 percent in Kamber.
Access to an improved source of drinking water in Sanghar and Kamber Shahdadkot is nearly universal whereas in Tharparkar it was low. Percentage of population with access to improved water sources in Tharparkar, Sanghar and Kamber Shahdadkot was 64, 90.6, and 89.8% respectively. The sanitation situation was found to be poor. Nearly 90 percent in Tharparkar and about half of the households in Sanghar and Kamber have no improve toilet facility. About 78 percent of the population in Tharparkar, 37% in Sanghar and 26 percent in Kamber were using open field for defecation. In all three survey districts, majority of the population dispose the garbage in the street (Tharparkar 56.3%, Sanghar 60.4% and Kamber 86.3%).

5
The main source of income for Tharparkar and Sanghar was unskilled wage labour, 41.3% and 43.6% respectively whereas for Kamber Shahdadkot the primary sources was from farming/agriculture (46.8%). The main sources of staple food in Tharparkar, Sanghar and Kamber was 99.5%, 96.1% and 78.4% respectively. About 34% of households in Tharparkar, 9% in Sanghar and 25% in Kamber own agricultural land. About 87% of households in Tharparkar, 44% in Sanghar and 56% in Kamber own farm animals; small animals (sheep, goat), large animals (cattle, buffalo, camel) and chickens.
Recommendations and priorities
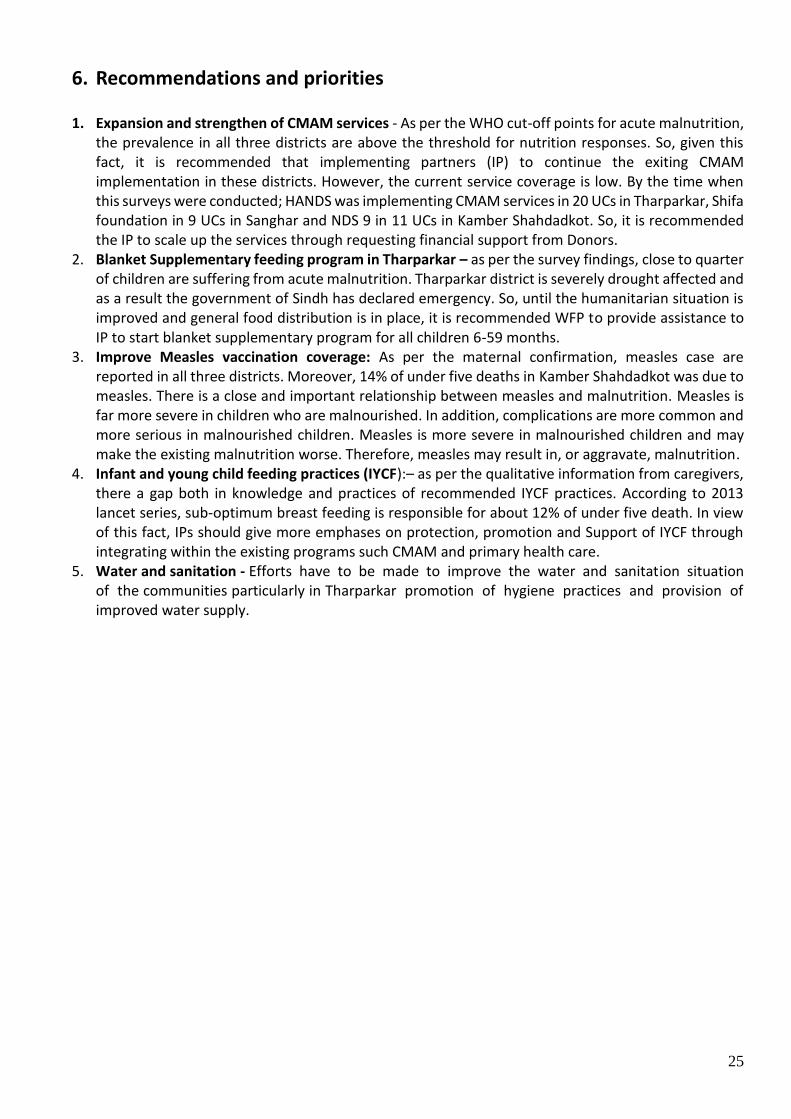
1. Expansion and strengthen of CMAM services - As per the WHO cut-off points for acute malnutrition, the prevalence in all three districts are above the threshold for nutrition responses. So, given this fact, it is recommended that implementing partners (IP) to continue the exiting CMAM implementation in these districts. However, the current service coverage is low. By the time when this surveys were conducted; HANDS was implementing CMAM services in 20 UCs in Tharparkar, Shifa foundation in 9 UCs in Sanghar and NDS 9 in 11 UCs in Kamber Shahdadkot. So, it is recommended the IP to scale up the services through requesting financial support from Donors.
2. Blanket Supplementary feeding program in Tharparkar – as per the survey findings, close to quarter of children are suffering from acute malnutrition. Tharparkar district is severely drought affected and as a result the government of Sindh has declared emergency. So, until the humanitarian situation is improved and general food distribution is in place, it is recommended WFP to provide assistance to IP to start blanket supplementary program for all children 6-59 months.
3. Improve Measles vaccination coverage: As per the maternal confirmation, measles case are reported in all three districts. Moreover, 14% of under five deaths in Kamber Shahdadkot was due to measles. There is a close and important relationship between measles and malnutrition. Measles is far more severe in children who are malnourished. In addition, complications are more common and more serious in malnourished children. Measles is more severe in malnourished children and may make the existing malnutrition worse. Therefore, measles may result in, or aggravate, malnutrition.
4. Infant and young child feeding practices (IYCF):– as per the qualitative information from caregivers, there a gap both in knowledge and practices of recommended IYCF practices. According to 2013 lancet series, sub-optimum breast feeding is responsible for about 12% of under five death. In view of this fact, IPs should give more emphases on protection, promotion and Support of IYCF through integrating within the existing programs such CMAM and primary health care.
5. Water and sanitation - Efforts have to be made to improve the water and sanitation situation of the communities particularly in Tharparkar promotion of hygiene practices and provision of improved water supply.
6
1. Introduction
Tharparkar is one the 23 districts of Sindh province located on the south east end of the country. It is boarder district bounded by India. The district has a tropical desert climate. Administratively, it is divided into four Talukas and further subdivided into 44 union councils. The estimated population for 2012 is 1,428,610 (extrapolated from 1998 census). Following the failure of monsoon rains since Nov-2013, drought has occurred manifested by in severe shortage of food, fodder and water. As a result the government has declared an emergency in the entire district. According to 2009 food security assessment, Tharparkar is one of lowest in access to food index in the country. According to the same sources, 53.4% of the population is food insecure and was ranked as top in Sindh and 17th in the country. Sanghar district is one of the boarder district bounded by Indian state on the east, district Khairpur and Shaheed Benazirabad on the north, district Matiari and Tando Allahyar on the west, and district Umerkot and Mirpur Khas on the south. Sanghar district has six talukas 55 union councils. The estimated population for 2012 is 1,834,212 (extrapolated from 1998 census). Sanghar is one of the district vulnerable to disaster. It was severely hit by rain/flood in 2010, 2011 and 2012. Kamber-Shahdadkot district is situated in the north-west of Sindh. It is bounded by district Larkana in the east, Baluchistan province in the north-west, district Jacobabad in the north-east and district Dadu in the south. Kamber Shahdadkot consists of seven talukas and 40 union councils. The estimated population for 2012 is 1,300,649 (extrapolated from 1998 census). The district was consecutively hit by heavy floods and rains in 2010, 2011 and in 2012.
2. Objective of the Study
General Objective The overall objective of the nutrition survey was to measure the extent and severity of acute malnutrition in children aged 6-59 months in Tharparkar, Sanghar and Kamber Shahdadkot districts of Sindh province. Specific OBJECTIVES
To estimate the prevalence of acute and chronic malnutrition among children 6-59 months of age;
To assess crude mortality rate (CMR) and under five mortality rates (U5MR);
To assess morbidity, immunization coverage (measles and BCG), and Vitamin A supplementation coverage among 6-59 months children;
To examine the population’s access to, and use of, improved water, sanitation and hygiene.

7
3. Methodology
3.1 Study area As it is shown in the map below, three independent SMART surveys were conducted in Tharparkar, Sanghar, and Kamber Shahdadkhot districts of Sindh province.
3.2 Study population The target population were children from 6 to 59 months of age and the household members.
Anthropometric and morbidity - children from 6 to 59 months
Retrospective mortality assessment – All household members
Household Food security, WASH, and other characteristics – the target was household with children 6-59 months.

8
3.3 Study design The survey design was cross-sectional study with two-stage cluster sampling using SMART methodology. Clusters are defined as Villages. Villages were considered as the smallest geographical unit (clusters). The sample size was determined using the Emergency Nutrition Assessment (ENA) for SMART software.
3.3.1 Sample size determination:
As the survey was combination of Anthropometry and mortality assessment, the Sample sizes for anthropometric and mortality surveys were calculated separately. The sample size for both anthropometric and Mortality was calculated using ENA for SMART software (version November 16th, 2013). As shown in the following table, the minimum household to be visited for anthropometry survey was estimated at 518 households. Table 1: Sample Size for Anthropometry
Estimated GAM
Prevalence (NNS 2011) Precision DEFF
Sample size
children 6-59 pop.
Average HH size
number of 6-59/HH
Number of HH
required con
tin
gen
c
y Total HH
required
Number of cluster require
15HH/cluster
17.5% 4 1.3 491 14% 7 0.98 502 3% 518 35
Sample size for mortality was determined based on the following parameters; estimated Crude Mortality Rate (CMR), Level of the desired precision, Design effect, Recall period, Average household size, and Contingency Table 2: Sample size for Mortality
District estimated
CMR Precision DEFF Recall period
Population to be
included Average HH size Contingency
Number of HH to
be included
Number of cluster require
15HH/cluster
0.37 0.3 1.5
90 days 2865 7 3% 422 29
As per the above two tables, the sample size for nutrition was estimated at 518 households whereas for mortality it was 422 households. However, as both components were conducted concurrently by the same team, the larger sample size which, 518 households, was considered for both anthropometry and mortality.
3.3.2 Cluster determination and selection
The total number of clusters were determined by dividing the total household sample size to the number of households that can be visited per a day per team. The number of households that can be visited per a day per team was determined as 15. Thereafter, the total number of clusters was calculated at 35 (518/15 = 34.5 rounded off to 35).
3.4 Sampling Procedure The sampling procedure was divided into two stages; stage-1 selection of villages from the total district villages and stage-2 selection of households from the village. Stage-I Cluster Selection
Lists of all villages and their corresponding population estimates in each district were obtained from the implementing partners.
9
Cluster election - total of 35 clusters in each district were selected using probability proportional to size (PPS) giving equal chance of selection for each village.
SMART software was applied in the selection of the clusters.
Stage-II Selection of the Household This was done by the teams in the field. After the teams arrived in the selected village, the following processes were carried out;
1. Listing of all households in the village. 2. Using random number table, 15 households were randomly selected 3. Then the selected households were visited by the team. Regardless of the presence of children under
five, all household were interviewed for mortality questionnaire. If any child 6-59 months the anthropometric and household questionnaire were administered
4. When the villages were big with more than about 250 households, the team used segmentation approach.
3.5 Data Collection
According to the assessment objectives the following data was collected.
3.5.1 Anthropometric measurements
Age: The mothers or care taker were asked to recall the date of birth of the child. When the mothers were failed to recall, then they were asked to show documents where birth date is written like a vaccination card. A local calendar by months was also prepared and provided to the team to assist age estimation.
Sex: (M/F)
Weight: All children were weighed using digital weighing scale.
Height/Length: Children under 87.0 cm or 24 months of age are measured lying down and children height greater or equal to 87.0 cm or 24 months are measured in the standing position.
MUAC: The eligible children for the survey aged between 6-59 months were measured in MUAC to the nearest 0.1 cm.
Oedema: The presence of nutritional Oedema was determined by pressing both feet for three seconds. Fortunately, no oedematous child was reported.
3.5.2 Mortality data
The number of deaths during the three months prior to interview (90 days) was recorded retrospectively for all household. Regardless of the presence of children in the household, the mortality questionnaire was administered in all 15 household in each clustered. Causes of the death was also be recorded if known. December 5th 2013, “topi Ajkrak”, was selected as a reference/starting date and all the deaths, births, household members joined and household members left since the start of recall period was recorded. Then crude and under five mortality rates were calculated as the number of deaths occurring per 10,000 per day.
3.5.3 Morbidity data
Two-week retrospective morbidity data of children 6-59 months was collected from mothers/caregivers. The mothers/caregivers were asked whether or not the child had diarrhea, fever and/or cough in the two weeks preceding the survey. Diarrhea was defined as three or more loose stools per day. Cough was considered any coughing or difficulty breathing. All morbidity reports were be based on mothers’/caregivers’ confirmation.

10
3.5.4 Vaccination - Measles and BCG
Measles vaccination was collected from children 9-59 months. Caregivers were asked to show the vaccination cards of the child and then cards were observed and checked whether or not the child has had measles vaccination. If a child did not have a card, mothers were further sked whether or not they could recall child being vaccinated. BCG immunization coverage was assessed among all under-five children in the survey area by checking scar on the left arm.
3.5.5 Vitamin A supplementations
Mothers were asked whether or not their children had received Vitamin A in the last 6 months. Mothers were shown Vitamin A capsule.
3.5.6 Contextual factors
The contextual factors (Household characteristics, income, land ownership, livestock ownership, water, hygiene and sanitation) was collected through household interview.
3.6 Survey management
3.6.1 Coordination of the survey
Provincial nutrition cell in coordination with District health office (DHO) and the implementing partners (IPs) in the respected district were responsible to manage the survey. They were The IPs were HANDS (Tharparkar), Shifa foundation (Sanghar) and NDS (Kamber). They were responsible in the selection of data collectors, managing the logistic and data collection. UNICEF was responsible to provide technical support throughout the assessment including design the questionnaire, providing the training for enumerators, analyzing the data and supporting the report writing.
3.6.2 Recruitment and Training of Enumerators
In each district, there were five teams each consists of three people composed of team leader and two enumerators. At district level, the teams were supervised by survey coordinator from implementing partners. Four days training was given to the enumerators. The first three days training was facilitated by Kiross Tefera (Nutrition specialist – UNICEF) and assisted by Dr Muhammad Mazhar Alam (Nutrition officer- UNICEF). In the first three days, they attend theoretical sessions and practical demonstration on body anthropometric measurement and how to collect other nutrition related information or data using SMART methodology. The field test was conducted in the fourth day and was managed by IPs. The fourth day was field testing. The following topics were covered during the training; objectives of the SMART survey; Basic concept of Sampling method; Anthropometrical measurements: height/length, weight, MUAC measurement techniques, and checking of bilateral oedema; Age assessments, preparation of local calendar and how to use local calendar to assist mothers to recall the age of their children; Assessment of health status of the child (illness), immunization and mortality data; Data collection and interview technique procedures; Question-by-question review of the questionnaire; Sampling procedure at village/cluster level; Practising interview/ role play; and Pilot testing in the field
3.7 Data analysis and Reporting
3.7.1 Data Analysis
SMART (ENA) and EPI INFO version 3.5.4s was used to process and analyze the results of the survey. Data was cleaned and analyzed by Kiross Tefera (UNICEF).
3.7.2 Preliminary result and final report
The preliminary summary result was shared two weeks after the data collection and this is the final report.
11
4. RESULTS
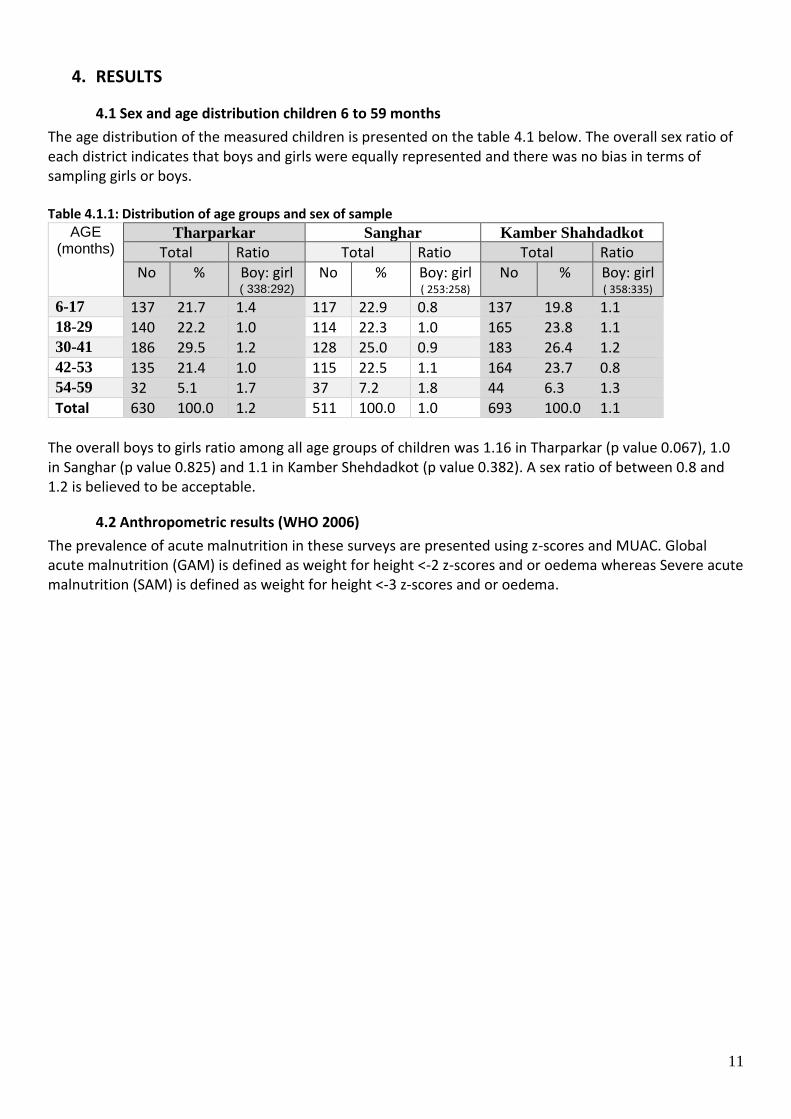
4.1 Sex and age distribution children 6 to 59 months
The age distribution of the measured children is presented on the table 4.1 below. The overall sex ratio of each district indicates that boys and girls were equally represented and there was no bias in terms of sampling girls or boys. Table 4.1.1: Distribution of age groups and sex of sample
AGE (months)
Tharparkar Sanghar Kamber Shahdadkot
Total Ratio Total Ratio Total Ratio
No % Boy: girl ( 338:292)
No % Boy: girl ( 253:258)
No % Boy: girl ( 358:335)
6-17 137 21.7 1.4 117 22.9 0.8 137 19.8 1.1 18-29 140 22.2 1.0 114 22.3 1.0 165 23.8 1.1 30-41 186 29.5 1.2 128 25.0 0.9 183 26.4 1.2 42-53 135 21.4 1.0 115 22.5 1.1 164 23.7 0.8 54-59 32 5.1 1.7 37 7.2 1.8 44 6.3 1.3
Total 630 100.0 1.2 511 100.0 1.0 693 100.0 1.1
The overall boys to girls ratio among all age groups of children was 1.16 in Tharparkar (p value 0.067), 1.0 in Sanghar (p value 0.825) and 1.1 in Kamber Shehdadkot (p value 0.382). A sex ratio of between 0.8 and 1.2 is believed to be acceptable.
4.2 Anthropometric results (WHO 2006)
The prevalence of acute malnutrition in these surveys are presented using z-scores and MUAC. Global acute malnutrition (GAM) is defined as weight for height <-2 z-scores and or oedema whereas Severe acute malnutrition (SAM) is defined as weight for height <-3 z-scores and or oedema.

12
Table 4.2.1: Prevalence of acute malnutrition based on weight-for-height z-scores (and/or oedema) and by sex
Tharparkar Sanghar Kamber Shehdadkot
All n = 622
Boys n = 333
Girls n = 289
All n = 511
Boys n = 253
Girls n = 258
All n = 688
Boys n = 353
Girls n = 335
Prevalence of global malnutrition (<-2 z-score and/or oedema)
(141) 22.7 % (18.3-27.8)
(81) 24.3 % (18.7-31.0 )
(60) 20.8 % (15.8-26.7 )
(82) 16.0 % (12.4 - 20.6)
(41) 16.2 % (11.6 - 22.2 )
(41) 15.9 % (11.8 - 21.0)
(95) 13.8 % (10.7 - 17.6 )
(47) 13.3 % (10.2 - 17.2 )
(48) 14.3 % (9.3 - 21.5 )
Prevalence of moderate malnutrition (<-2 z-score and >=-3 z-score, no oedema)
(101) 16.2 % (12.9-20.3 )
(56) 16.8 % (12.4-22.3 )
(45) 15.6 % (11.5-20.8 )
(57) 11.2 % (8.5 - 14.5 )
(28) 11.1 % (7.7 - 15.6 )
(29) 11.2 % (7.8 - 15.9) (65) 9.4 %
(7.1 - 12.5 ) (29) 8.2 %
(5.9 - 11.4 ) (36) 10.7 % (7.0 - 16.1 )
Prevalence of severe malnutrition (<-3 z-score and/or oedema)
(40) 6.4 % (4.1-10.0 )
(25) 7.5 % (4.5-12.3 )
(15) 5.2 % (3.0-8.8 )
(25) 4.9 % (3.2 - 7.4 )
(13) 5.1 % (3.0 - 8.7 )
(12) 4.7 % (2.8 - 7.7)
(30) 4.4 % (3.1 - 6.0 )
(18) 5.1 % (3.5 - 7.5 )
(12) 3.6 % (1.7 - 7.4 )
Table 4.2.2: Prevalence of acute malnutrition by age, based on weight-for-height z-scores and/or oedema
Tharparkar Sanghar Kamber Shahdadkot
Severe wasting
(<-3 z-score)
Moderate wasting (>= -3 and <-2 z-score )
Severe wasting
(<-3 z-score)
Moderate wasting
(>= -3 & <-2 z-score )
Severe
wasting
(<-3 z-score)
Moderate wasting
(>= -3 & <-2 z-score )
Age (month)
Total no. No. % No. %
Total No. % No. %
Total No. % No. %
6-17 134 16 11.9 23 17.2 117 9 7.7 23 19.7 137 11 8.0 14 10.2
18-29 139 4 2.9 26 18.7 114 9 7.9 13 11.4 163 6 3.7 17 10.4
30-41 183 9 4.9 20 10.9 128 4 3.1 10 7.8 181 7 3.9 11 6.1
42-53 134 7 5.2 23 17.2 115 2 1.7 10 8.7 163 5 3.1 20 12.3
54-59 32 4 12.5 9 28.1 37 1 2.7 1 2.7 44 1 2.3 3 6.8
Total 622 40 6.4 101 16.2 511 25 4.9 57 11.2 688 30 4.4 65 9.4

13
Table 4.2.3: Prevalence of acute malnutrition based on MUAC cut off's (and/or oedema) and by sex
Tharparkar Sanghar Kamber Shahdadkot
All n = 630
Boys n = 338
Girls n = 292
All n = 511
Boys n = 253
Girls n = 258
All n = 693
Boys n = 358
Girls n = 335
Prevalence of global malnutrition (< 125 mm and/or oedema)
(103) 16.3 % (12.6 - 20.9)
(57) 16.9 % (11.9 - 23.3)
(46) 15.8 % (11.9 - 20.6)
(86) 16.8 % (12.6 - 22.2)
(40) 15.8 % (11.1 - 22.0)
(46) 17.8 % (12.7 - 24.5)
(107) 15.4 % (12.6 - 18.7)
(45) 12.6 % (9.5 - 16.5)
(62) 18.5 % (14.2 - 23.8)
Prevalence of moderate malnutrition (< 125 mm and >= 115 mm, no oedema)
(75) 11.9 % (9.1 - 15.4)
(40) 11.8 % (7.7 - 17.7.)
(35) 12.0 % (9.2 - 15.4 )
(61) 11.9 % (8.9 - 15.9
(28) 11.1 % (7.4 - 16.2)
(33) 12.8 % (9.2 - 17.5)
(80) 11.5 % (9.0 - 14.7)
(33) 9.2 % (6.3 - 13.3)
(47) 14.0 % (10.1 - 19.2)
Prevalence of severe malnutrition (< 115 mm and/or oedema)
(28) 4.4 % (2.9 - 6.7)
(17) 5.0 % (3.1 - 8.1 )
(11) 3.8 % (2.0 - 7.1 )
(25) 4.9 % (3.0 - 8.0)
(12) 4.7 % (2.3 - 9.7)
(13) 5.0 % (2.8 - 8.8 )
(27) 3.9 % (2.5 - 6.1)
(12) 3.4 % (1.6 - 6.7)
(15) 4.5 % (2.7 - 7.4)
Table 4.2.4: Prevalence of acute malnutrition by age, based on MUAC cut off's and/or oedema
Tharparkar Sanghar Kamber Shahdadkot
Severe wasting
(< 115 mm)
Moderate wasting (>= 115 & < 125 mm)
Severe wasting
(< 115 mm)
Moderate wasting (>= 115&< 125 mm)
Severe wasting
(< 115 mm)
Moderate wasting (>= 115&< 125 mm)
Age (month)
Total no. No. % No. %
Total No. % No. %
Total No. % No. %
6-17 137 16 11.7 36 26.3 117 14 12.0 38 32.5 137 16 11.7 42 30.7 18-29 140 7 5.0 20 14.3 114 7 6.1 11 9.6 165 7 4.2 26 15.8 30-41 186 4 2.2 10 5.4 128 2 1.6 6 4.7 183 1 0.5 11 6.0 42-53 135 0 0.0 7 5.2 115 2 1.7 4 3.5 164 3 1.8 1 0.6 54-59 32 1 3.1 2 6.3 37 0 0.0 2 5.4 44 0 0.0 0 0.0 Total 630 28 4.4 75 11.9 511 25 4.9 61 11.9 693 27 3.9 80 11.5

14
Table 4.2.5: Prevalence of underweight based on weight-for-age z-scores by sex
Tharparkar Sanghar Kamber Shahdadkot
All n = 627
Boys n = 336
Girls n = 291
All n = 511
Boys n = 253
Girls n = 258
All n = 693
Boys n = 358
Girls n = 335
Prevalence of underweight (<-2 z-score)
(269) 42.9 % (36.8 - 49.2)
(149) 44.3 % (36.9 - 52.1)
(120) 41.2 % (34.6 - 48.2)
(216) 42.3 % (36.0 - 48.8)
(105) 41.5 % (34.2 - 49.2)
(111) 43.0 % (34.8 - 51.7)
(201) 29.0 % (23.8 - 34.8)
(113) 31.6 % (26.1 - 37.6)
(88) 26.3 % (20.1 - 33.6)
Prevalence of moderate underweight (<-2 z-score and >=-3 z-score)
(146) 23.3 % (19.3 - 27.8)
(75) 22.3 % (18.0 - 27.4)
(71) 24.4 % (18.8 - 31.0)
(133) 26.0 % (21.9 - 30.6)
(64) 25.3 % (19.4 - 32.3)
(69) 26.7 % (21.5 - 32.7)
(152) 21.9 % (18.3 - 26.0)
(82) 22.9 % (18.3 - 28.2)
(70) 20.9 % (15.9 - 26.9)
Prevalence of severe underweight (<-3 z-score)
(123) 19.6 % (15.7 - 24.2)
(74) 22.0 % (16.9 - 28.2)
(49) 16.8 % (12.5 - 22.3)
(83) 16.2 % (12.1 - 21.5)
(41) 16.2 % (11.5 - 22.3)
(42) 16.3 % (11.3 - 23.0)
(49) 7.1 % (4.7 - 10.5)
(31) 8.7 % (5.4 - 13.6)
(18) 5.4 % (3.3 - 8.7)
Table 4.2.6: Prevalence of underweight by age, based on weight-for-age z-scores
Tharparkar Sanghar Kamber Shahdadkot
Severe
underweight
(<-3 z-score)
Moderate underweight
(>= -3 and <-2 z-score )
Severe
underweight
(<-3 z-score)
Moderate underweight
(>= -3 and <-2 z-score )
Severe
underweight
(<-3 z-score)
Moderate underweight
(>= -3 and <-2 z-score )
Age (month)
Total no. No. % No. %
Total No. % No. %
Total No. % No. %
6-17 135 30 22.2 33 24.4 117 22 18.8 36 30.8 137 12 8.8 36 26.3 18-29 139 31 22.3 28 20.1 114 24 21.1 29 25.4 165 17 10.3 42 25.5 30-41 186 35 18.8 36 19.4 128 24 18.8 28 21.9 183 7 3.8 38 20.8 42-53 135 19 14.1 38 28.1 115 9 7.8 35 30.4 164 9 5.5 29 17.7 54-59 32 8 25.0 11 34.4 37 4 10.8 5 13.5 44 4 9.1 7 15.9 Total 627 123 19.6 146 23.3 511 83 16.2 133 26.0 693 49 7.1 152 21.9

15
Table 4.2.7: Prevalence of stunting based on height-for-age z-scores and by sex
Tharparkar Sanghar Kamber Shahdadkot
All n = 617
Boys n = 329
Girls n = 288
All n = 511
Boys n = 253
Girls n = 258
All n = 690
Boys n = 355
Girls n = 335
Prevalence of stunting (<-2 z-score)
(283) 45.9 % (40.1 - 51.7)
(154) 46.8 % (39.2 - 54.6)
(129) 44.8 % (38.3 - 51.5)
(273) 53.4 % (48.0 - 58.8)
(146) 57.7 % (50.4 - 64.7)
(127) 49.2 % (41.3 - 57.2)
(334) 48.4 % (44.3 - 52.6)
(185) 52.1 % (46.9 - 57.3)
(149) 44.5 %
(38.4 - 50.7)
Prevalence of moderate stunting (<-2 z-score and >=-3 z-score)
(157) 25.4 % (21.2 - 30.3)
(88) 26.7 % (21.1 - 33.3)
(69) 24.0 % (19.1 - 29.6)
(123) 24.1 % (19.7 - 29.1)
(65) 25.7 % (20.5 - 31.6)
(58) 22.5 % (16.5 - 29.8)
(171) 24.8 % (20.6 - 29.5)
(95) 26.8 % (22.4 - 31.6)
(76) 22.7 % (16.7 - 30.0)
Prevalence of severe stunting (<-3 z-score)
(126) 20.4 % (16.7 - 24.7)
(66) 20.1 % (15.4 - 25.7)
(60) 20.8 % (16.5 - 26.0)
(150) 29.4 % (24.6 - 34.7)
(81) 32.0 % (25.7 - 39.0)
(69) 26.7 % (20.9 - 33.5)
(163) 23.6 % (19.3 - 28.6)
(90) 25.4 % (20.3 - 31.1)
(73) 21.8 % (16.9 - 27.6)
Table 4.2.8: Prevalence of stunting by age based on height-for-age z-scores
Tharparkar Sanghar Kamber Shahdadkot
Severe
stunting
(<-3 z-score)
Moderate stunting (>= -3 & <-2 z-score )
Severe
stunting
(<-3 z-score)
Moderate stunting (>= -3 & <-2 z-
score )
Severe stunting
(<-3 z-score)
Moderate stunting (>= -3 & <-2 z-
score )
Age (mo)
Total no. No. % No. %
Total No. % No. %
Total No. % No. %
6-17 134 25 18.7 34 25.4 117 22 18.8 24 20.5 135 37 27.4 29 21.5 18-29 135 40 29.6 36 26.7 114 40 35.1 30 26.3 165 52 31.5 49 29.7 30-41 182 34 18.7 47 25.8 128 48 37.5 29 22.7 183 40 21.9 55 30.1 42-53 134 22 16.4 32 23.9 115 34 29.6 32 27.8 163 26 16.0 32 19.6 54-59 32 5 15.6 8 25.0 37 6 16.2 8 21.6 44 8 18.2 6 13.6 Total 617 126 20.4 157 25.4 511 150 29.4 123 24.1 690 163 23.6 171 24.8

16
4.3 Mortality results (retrospective over x months/days prior to interview)
A three months retrospective mortality data was collected from each household. December 5, 2013 was taken as a reference/starting date. In each survey district, the mortality data was collected from 3911 household residents in Tharparkar, 3479 in Sanghar and 4051 in Kamber Shahdadkot. Of the total residents, the population under five months (0-59) in Tharparkar, Sanghar, and Kamber was 709,510, and 622 respectively. A total deaths reported in Tharparkar, Sanghar and Kamber were 9, 7 and 17 respectively. Of the total deaths, the under five (0-59 months) were 6, 3, and 14 respectively. Table 4.3.1: Mortality rates
Indicators Tharparkar Sanghar Kamber Shahdadkot
Mortality Rate
Crude mortality rate – CMR Total deaths/10,000 people / day):
0.24 (0.12-0.48 95% CI)
0.22 (0.11-0.4495% CI)
0.45 (0.22-0.94 95% CI)
Under five mortality rate – U5MR Number of Under five deaths/10,000 under five/day
0.91 (0.44-1.88 95% CI)
0.64 (0.21-1.97) (95% CI)
2.45 (1.2-4.93 95% CI)
According to the respondent’s confirmation, the main causes of under five deaths in Kamber Shahdadkot were fever (21%), measles (14%), malaria (7%), diarrhea (7%), unknown (29%), and others (21%).
4.4 Child morbidity
Table 4.4.1: Prevalence of reported illness in children 6-59 months in the last two weeks Indicators Tharparkar Sanghar Kamber Shahdadkot
Prevalence of all reported Illnesses in the last two weeks prior to survey 43.5 % (n=628)
(39.6 – 47.5 95% C.I.) 48.7% (n=511)
(44.3 – 53.2 95% C.I.) 34.8% (n=693)
(31.3 – 38.5 95% C.I.)
Of those who were sick, who visited health facilities for treatment 60.6% (n=274)
(54.5 – 66.4 95% C.I.) 74.6% (n=248)
(68.7 – 79.9 95% C.I.) 65.1% (n=241)
(58.8 – 71.1 95% C.I.)
Symptom breakdown based on maternal confirmation1 n=274 N=248 N=241
Diarrhea 26.3% 41% 39.4%
Fever 71.9% 57% 61.4%
Cough 28.8% 45.8% 53.9%
Measles 3.6% 24.6% 4.1%
1 Some children were with more than one symptom.

17
4.5 Vitamin A Supplementation and Vaccination status
Table 4.5.1: BCG and measles vaccination and Vitamin A supplementation coverage
Indicators Tharparkar Sanghar Kamber Shahdadkot
Vitamin A supplementation 6-59 months - By Maternal recall 68.8% (N=624)
(64.9 – 72.3 95% C.I.) 85.3% (n=509)
(81.8 – 88.2 95% C.I.) 64.5% (n=654)
(60.7 – 68.2 95% C.I.)
Measles Vaccination 9-59 months - Confirmed with card
35.0 % (N=604) (31.1 – 39.1 95% C.I.)
77.5 % (n=475) (73.4 – 81.1 95% C.I.)
35.9 % (n=560) (31.9 – 40.0 95% C.I.)
9-59 months -With card or confirmation from mother 63.4 % (N=604)
(59.3 – 67.3 95% C.I.) 84.2 % (n=475)
(80.5 – 87.3 95% C.I.) 67.7 % (n=560)
(63.6 – 71.5 95% C.I.)
BCG Vaccination 6-59 months - scar 51.9 % (N=628)
(47.9 – 55.9 95% C.I.) 80.8 % (n=510)
(77.0 – 84.1 95% C.I.) 73.5 % (n=510)
(70.0 – 76.7 95% C.I.)

18
4.6 Household (HH) Characteristics
Table 4.6.1 Household Characteristics and food security
No. Characteristics/Variables Tharparkar Sanghar
1 Sex of Household head N=387 N=510 N=361
Male 100% - 97.5%
2 Marital Status N=387 N=509 N=361
Married 99.2% 99.0% 98.6%
Divorced 0.3% 0.6% 0.0%
Widowed 0 0.4% 1.1%
other 0 0 0.3%
3 Number of Household members N=382 N=507 N=360
3 3.1% 5.1% 2.8% 4 7.9% 10.2% 6.7% 5 11.8% 15.7% 9.4%
6 15.4% 15.4% 14.4%
7 15.4% 13.2% 9.7% 8 10.5% 7.3% 12.5% 9 8.6% 10.0% 10.6% 10+ 27.3% 23.0% 34.0% Average HH size 7.8 7.8 8.8
4 Household head education N=387 N=509 N=361
No education 47% 44.0% 59.8% Primary (Class 1-5) 11.90% 16.1% 15.0% Middle (Class 6-8) 7.20% 11.4% 3.3% Secondary (Class 9-10) 15% 13.4% 9.4% Intermediate (Class 11-12) 13.40% 10.8% 7.2% Tertiary education 5.20% 4.3% 3.6% Other 0.30% 0 1.7%
5 Primary income of the household N=387 N=507 N=361
Agriculture (Fishing, Livestock, crop) 30.0% 28.6% 46.8% Trading/Business 2.6% 6.7% 6.6% Salaried (private/government/ 19.6% 15.6% 8.6% Unskilled Wage labour (Agriculture/non-Agri) 41.3% 43.6% 11.1% Handicraft 0.5% 1.2% 7.8% Remittance – family support from outside Pakistan) 0.0% 2.4% 2.8% Support (zakat, family, social welfare) 0.0% 1.8% 1.1% Others 5.9% 0.2% 15.2%
6 The major source of main staple food for the HH N=385 N=508 N=361
Purchase 99.5% 96.1% 78.4% Own production 0.3% 3.0% 4.4% Relief food 0.3% 0.2% 0% Food loans 0 0.4% 15.8% Food gift from family or neighbors 0 0.4% 1.1% Others 0 9.6% 0.3%
7 Household owned livestock/other farm animals, or poultry N=383 N=509 N=360
Yes 87.2% 43.8% 56.4%
Household own any land that can be used for agriculture N=384 N=510 N=361
Yes 34.1% 9.6% 35.2%
8 If owned livestock, which type of animals do have? N=334 N=223 N=203
Small animal – Sheep or goat 95.7% 71.8% 77.5% Large Animals - cattle , Buffalo, camel 67.8% 55.6% 91.0% Poultry/chicken- 13.3% 14.3% 68.3%

19
Table 4.6.2: Maternal questionnaire on IYCF
No Question Answer Tharparkar Sanghar Kamber
1 Maternal education N=382 N=508 N=361
No education 91.6% 68.3% 82.5%
Primary (Class 1-5) 3.4% 15.7% 10.8%
Middle (Class 6-8) 1.6% 5.3% 2.2%
Secondary (Class 9-10) 2.4% 6.1% 2.8%
Intermediate (Class 11-12) 0.3% 3.5% 1.4%
Tertiary education 0.3% 1.0% 0.3%
Other 0.5% 0 0%
Do you know how long after delivery should a mother initiate breastfeeding for the new-born?
N=373 N=501 N=361
Within one hour 29.8% 33.7% 36.3%
2 Between 1 and 23 hours 47.7% 44.9% 36.6%
After 24 hours 20.9% 21.2% 23.5%
Don’t know 1.6% 0.2% 3.6%
What did you do with the first milk yellowish colour of breast milk (colostrum)
N=376 N=503 N=361
3 Discard /remove / 64.9% 23.9% 23.3%
Given to the child 32.2% 75.5% 75.6%
Don’t know 2.9% 0.4% 1.1%
If the colostrum was throw away or discard, what was the reason?
N=237 N=130 N=84
It is dirty 84.0% 65.4% 61.9%
Harmful to the baby 8.4% 20.0% 20.2%
4 Advice from elders/in-law 4.6% 11.5% 15.5%
It is tradition 2.5% 2.3% 1.2%
Other 0.4% 0.8% 1.2%
For how long (up to what age) do you think a child should feed only breast milk (even no water)?
N=376 N=510 N=358
Before 4 months 33.2% 20.8% 46.0%
5 4 to 5 months 22.6% 24.9% 20.4%
6 months 27.1% 44.7% 31.0%
After six months 17.0% 9.6% 2.5%
Besides breast milk, at what age do you think, it is best to start giving soft, semi-solid or foods in addition breast milk to children?
N=375 N=510 N=361
Before 4 months 6.7% 14.9% 8.4%
6 Between 4 to 5 months 27.5% 22.2% 20.2%
Between 6 to 8 months 49.6% 57.1% 59.6%
After 9 months 16.3% 5.9% 11.9%
Have you ever received any counselling or advice regarding BF? Yes
N=377 N=489 N=350
7 28.4% 57.3% 66.0%
If you received counselling or advice on breastfeeding, from whom do you get the information about breastfeeding?
N=107 N=280 N=231
Health facility staff 0 15.4% 75.0%
Leady health workers 28.1% 47.9% 35.4%
8 CMAM staff (NGO staff) 25.5% 5.7% 6.1%
TTBA 61.3% 1.1% 2.1%
Media (radio, TV, newspaper, ) 2.4% 5.7% 45.3%
Family (husband/ in-low) 0 22.9% 72.4%
Friends/neighbors 0 0.7% 23,7%

20
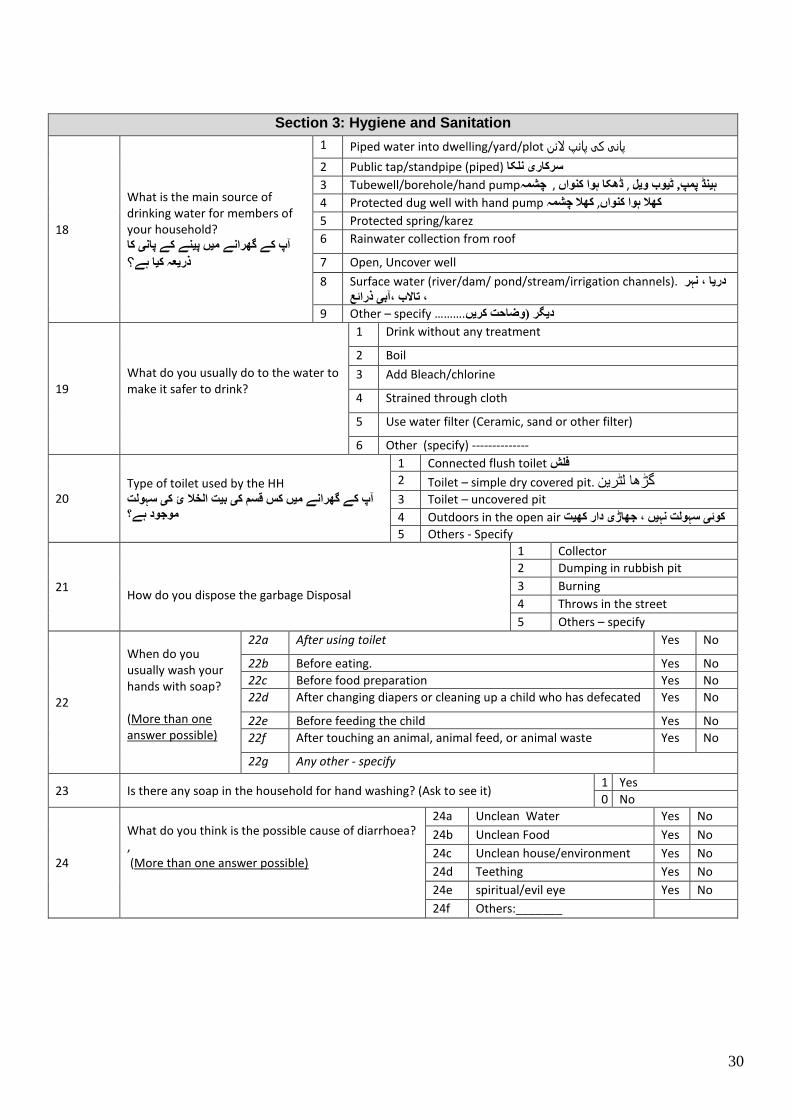
Table 4.6.3: Hygiene and Sanitation
No Characteristics/Variable Tharparkar Sanghar Kamber
Main source of drinking water for household? N=385 N=509 N=361
Piped water into dwelling/yard/plot 1.3% 11.2% 18.6%
Public tap/standpipe (piped) 4.7% 2.0% 12.7%
Tubewell/borehole/hand pump 12.5% 69.9% 54.6%
Protected dug well with hand pump 45.5% 7.3% 3.3%
Protected spring/karez 0% 0.2% 0.6%
Rainwater collection from roof 1.8% 0.0% 0.0%
Open, Uncover well 31.7% 0.4% 0.0%
Surface water (river/dam/ pond/stream/irrigation channels). 0.5% 9.0% 5.3%
Other sources 2.1% 0.0% 5.0%
What do you usually do to the water to make it safer to drink? N=385 N=504 N=361
Drink without any treatment 55.6% 82.9% 98.1%
Boil 0% 4.8% 0.3%
Add Bleach/chlorine 1.0% 2.4% 0.0%
Strained through cloth 43.4% 9.3% 1.7%
Other 0% 0.6% 0.0%
Type of toilet used by the HH N=384 N=506 N=353
Connected flush toilet 6.3% 36.0% 26.6%
Toilet – simple dry covered pit. 3.4% 18.4% 24.6%
Toilet – uncovered pit 11.5% 8.7% 22.4%
Outdoors in the open air 78.4% 37% 26.3%
How do you dispose the garbage Disposal N=382 N=503 N=285
Collector 3.4% 11.5% 1.4%
Dumping in rubbish pit 2.1% 13.5% 1.4%
Burning 38.2% 13.5% 10.9%
Throws in the street 56.3% 60.4% 86.3%
When do you usually wash your hands with soap? N=306 N=510
After using toilet 47.1% 62.4% 95.3%
Before eating. 39.1% 53.7% 84.4%
Before food preparation 33.3% 50.5% 79.7%
After changing diapers or cleaning up a child who has defecated 11.3% 52.7% 63.4%
Before feeding the child 12.9% 40.8% 38.9%
After touching an animal, animal feed, or animal waste 14.7% 34.5% 51.7%
Households with any soap (confirmed)? N=374 N=510 N=361
Yes 48.7% 76.1% 80.6%
What do you think is the possible cause of diarrhea N=227 N=510
Unclean Water 96.9% 24.1% 53.8%
Unclean Food 89.4% 74.5% 86.3%
Unclean house/environment 20.3% 30.0% 70.9%
Teething 40.9% 21.8% 19.6%
spiritual/evil eye 2.9% 1.4% 6.1%

21
5. Discussion
5.1 Nutritional status Children whose weight-for-height is below minus two standard deviation (-2SD) from the median of the reference population are considered wasted while those who measure below minus three standard deviation (-3SD) from the median of the reference population are considered severely wasted. Global acute malnutrition (GAM) is defined as weight for height < -2 Z-scores and or Oedema. Severe acute malnutrition (SAM) is defined as weight for height < -3 Z-scores and or Oedema. The nutritional status was calculated based on the WHO 2006 reference population. Results based on the NCHS 1977 reference are attached in appendix).
5.1.1 Acute malnutrition (6 to 59 months)
The surveys found GAM prevalence of 22.7% in Tharparkar, 16.0% in Sanghar, and 13.8% in Kamber Shahdadkot. According to World Health Organization (WHO) classification of severity of acute malnutrition in a community, the rate for Tharparkar and Sanghar is classify as critical whereas for Kamber Shehdadkot it
is under the classification of serious2. Even though there is no agreed threshold for severe acute malnutrition, the rate of SAM in all the three districts was very high; Tharparkar 6.4%, Sanghar 4.3% and Kamber Shahdadkot 4.4 percent. There were no children with oedema. The statistical test showed that in all three surveys there was no significant statistical difference between boys and girls. However, in all three districts the level of acute malnutrition was disproportionately higher among the younger age groups (6-23 months) compared to those above 24 months (p value Tharparkar 0.044, Sanghar 0.001 and Kamber 0.007). The strength of association between potential risk factors and nutritional status was estimated using odds ratio, and 95% confidence intervals (CI) were used to judge the statistical significant for associations. In Tharparkar and Sanghar, wasting was positively associated with morbidity. In Tharparkar, Children who had diarrhea and fever two weeks prior to survey had a greater risk of being malnourished than those who were not sick (Odds ratio (OR) 2.35 (1.39-3.96 95% CI), and 1.58 (1.074 – 2.35% CI) respectively. In Sanghar wasting was associated with only Diarrhea (OR 2.43 95% CI 1.43 – 4.13). Malnutrition starts either with the failure of an individual to acquire enough food to eat, or with ill health. Illness and malnutrition are closely linked. The statistical test also revealed that in Tharparkar low maternal MUAC were positively associated with acute malnutrition (OR 2.15 95% C.I 1.36 – 3.39). Mothers who were malnourished (MUAC <21cm), were more likely to have acutely malnourished children, and there are many potential reasons for this association. On the other hand, in Sanghar maternal education was negatively associated with wasting (OR 0.52 95% C.I 0.28 – 0.99). Findings Relative to previous Nutrition surveys In order to further understand the situation in regards to the current prevalence of acute malnutrition in the three districts, it is important to compare these results with the previous surveys conducted in the same area. However, there have not been anthropometric surveys done in the three districts. As a result it was difficult to make trend analysis. However, comparisons was made with surveys conducted in the Sindh in 2013. During this period total of six SMART nutrition surveys were conducted in the following districts; Thatta, Badin, TMK, Dadu, Shikarpur and Kashmore. These surveys were conducted at different tome; one in July, three in November and the two in December).
2 WHO (2000). The Management of Nutrition in Major Emergencies. The classification is as follow; <5% acceptable, 5-9% poor, 10-14% serious, and >=15% critical.

22
The current three surveys were conducted in March 2014. So, given the seasonal variation, comparison of these survey results is not technically feasible. However, it might give rough insight. As it is shown below, the situation of acute malnutrition in the whole province is very widespread.
5.1.2 Chronic Malnutrition (6 to 59 months)
Sindh province has the highest stunting rate in the country. Over half (56.7%)3 of children are stunted and
according to WHO classification, the prevalence of stunting is “very high”4. Stunting is attributable to many factors. Stunting is a good indicator of a nation’s level of socioeconomic development. This is why stunting is used as an outcome indicator in poverty reduction strategy papers. The level of stunting found in the current surveys; Tharparkar, Sanghar and Kamber Shehdadkot is 45.9, 53.4 and 48.4 percent respectively which is categorized under the WHO classification of “very high”. Statistical analysis found that there was no a significant difference between boys and girls and across all age groups.
5.2 Mortality In Tharparkar and Sanghar, both the Crude (CMR) and Under-five Mortality Rates (U5MR) were almost within
the acceptable range for South Asia region5. The CMR and U5MR for Tharparkar was 0.2 and 0.9 respectively whereas in Sanghar CMR was 0.22 and U5MR 0.64 /10,000 people/day. However, the CMR and U5MR in Kamber was 0.45 and 2.45 deaths/10,000 people/day which was above emergency threshold levels of the region. According to the respondent’s confirmation, the main causes of under five deaths in Kamber Shehdadkot were fever (21%), measles (14%), malaria (7%), diarrhea (7%), unknown (29%), and others (21%).
3 Pakistan DHS 2012-13 4 WHO. Physical Status: The use and interpretation of anthropometry, WHO Technical Report Series. 1995. According to the technical report; <20% low, 20-29% medium, 30-39% high, >=40 very high. 5 SPHERE 2011. The emergency baseline reference mortality for South Asia; CMR 0.4 and U5MR 0.9
5.8% 5.6% 5.1% 1.8% 7.2% 3.0% 6.4% 4.3% 4.4%
12.20%
22.1%19.4%
12.6%
18.5%
13.5%
22.7%
16.0%13.8%
0.0%
5.0%
10.0%
15.0%
20.0%
25.0%
30.0%
35.0%
40.0%
45.0%
50.0%
SMART Nutrition Surveys in Sindh (July 2013 - March 2014)
SAM GAM

23
5.3 Morbidity and coverage public health intervention 5.3.1 Morbidity
Two weeks period morbidity prevalence shows 43.5 percent of children in Tharparkar, 49.7% in Sanghar and 34.8% were reported to be recently sick. As it is shown in section 5.4, the most common reported illness according to the rank were fever, cough, and diarrhea. Measles cases were reported in all three districts; Tharparkar 3.6%, Sanghar 24.6% and Kamber 4.1 percent. All the reported cases were based on maternal perception of the illness. The reported illness were not validated by medical personnel. So, it is likely that there was over reporting of illness. As a result it was difficult to interpret morbidity results confidently. As it is stated in the previous section of 6.1, there was association between morbidity (diarrhea and fever) with wasting. The prevalence of illness was not uniform across all age groups being higher with 6-23 months age groups than the older 24-59 months. The statistical analysis showed that significant difference among
the age groups in the prevalence of diarrhea (Tharparkar X2=14.0, p-value=0.000; Sanghar X2=11.4, p-
value=0.000; Kamber X2=53.3, p-value =0.000), Fever (Tharparkar X2= 5.27, p-value=0.02; Kamber X2=22.26,
p-value =0.000), and cough (Kamber X2=14.2, p-value =0.000). The younger age groups are more vulnerable
as they are mobile and pick up dirty objects exposing themselves to disease.
5.3.2 Vitamin A supplementation As per the WHO recommendation, children under 5 years of age should be supplemented twice a year with vitamin A. Vitamin A is an essential micronutrient for proper functioning of the immune system and also for eyesight. Supplementation of vitamin A capsule is one of the main strategies that have been adapted globally.
The national Vitamin A supplementation coverage (2012) is 99%6. However, the current assessment found 68.8 percent of children in Tharparkar, 85.3 in Sanghar and 64.5 percent in Kamber Shehdadkot were received Vitamin A supplementation.
5.3.3 Measles and BCG Vaccination In order to determine vaccination coverage, information on BCG and measles vaccinations was collected via vaccination card, maternal recall (if the card was lost), and scar (BCG). The assessment found that BCG vaccination coverage in Tharparkar at 51.9%, Sanghar 80.8% and Kamber 73.5 percent. The coverage for measles (9 to 59 months) confirmed by card was 35% in Tharparkar, 77.5% in Sanghar and 35.9 percent in
Kamber. The national coverage for Measles and BCG is 83 and 87 percent respectively7.
5.4 Water, sanitation and Hygiene (WASH) Access to improved water supply and sanitation facilities is the one of the powerful public health interventions in preventing morbidity particularly diarrhea. Research has shown that Improved water sources reduce diarrhea morbidity by 21%; improved sanitation reduces diarrhea morbidity by 37.5%; and the simple act of washing hands at critical times can reduce the number of diarrhea cases by as much as 35%8. According WHO and UNICEF joint monitoring for water and sanitation, an improved water source is defined as water that is supplied through a household connection, public standpipe, borehole well, protected dug well, protected spring, or rainwater collection. Access to an improved source of drinking water in Sanghar and Kamber Shahdadkot is nearly universal whereas in Tharparkar it was low. Percentage of population with access to improved water sources in Tharparkar, Sanghar and Kamber Shahdadkot was 64, 90.6, and 89.8% respectively.
6 Accessed from UNICEF website on May 11/2014 http://www.unicef.org/infobycountry/pakistan_pakistan_statistics.html 7 Ibid 8 CDC- http://www.cdc.gov/healthywater/global/wash_statistics.html access on 15th of May 2014

24
The most common source of drinking water in urban areas is a tube well/borehole/hand pump (Sanghar 69.9% and Kamber 54.6%) followed by piped water into dwelling/yard/plot (Sanghar 11.2% and Kamber 18.6%).. The sanitation situation was found to be poor. Nearly 90 percent in Tharparkar and about half of the households in Sanghar and Kamber have no improve toilet facility. About 78 percent of the population in Tharparkar, 37% in Sanghar and 26 percent in Kamber were using open field for defecation. In all three survey districts, majority of the population dispose the garbage in the street (Tharparkar 56.3%, Sanghar 60.4% and Kamber 86.3%). Hand washing practices with soap is not common particularly in Tharparkar district. About 47 percent of respondents in Tharparkar, 62% in Sanghar and 95% in Kamber wash their hands after using a toilet. About 39 percent in Tharparkar, 54% in Sanghar, and 85% in Kamber use soap before eating. About 33 percent in Tharparkar, 51 percent in Sanghar, and 80 percent in Kamber use soap before food preparation.
5.5 Household Food security Information regarding household income, sources of staple food, livestock and land ownership was collected. The survey finding indicated that the main source of income for Tharparkar and Sanghar was unskilled wage labour, 41.3% and 43.6% respectively whereas for Kamber Shahdadkot the primary sources was from farming/agriculture (46.8%). The main sources of staple food in Tharparkar, Sanghar and Kamber was 99.5%, 96.1% and 78.4% respectively. This assessment was conducted about three month after rice harvest and one months before wheat harvest. The hunger season usually starts around August and goes up to mid-October. Thirty-four percent of households in Tharparkar, nine percent in Sanghar and thirty-five percent in Kamber own agricultural land. About 87% of households in Tharparkar, 44% in Sanghar and 56% in Kamber own farm animals; small animals (sheep, goat), large animals (cattle, buffalo, camel) and chickens.
25
6. Recommendations and priorities
1. Expansion and strengthen of CMAM services - As per the WHO cut-off points for acute malnutrition, the prevalence in all three districts are above the threshold for nutrition responses. So, given this fact, it is recommended that implementing partners (IP) to continue the exiting CMAM implementation in these districts. However, the current service coverage is low. By the time when this surveys were conducted; HANDS was implementing CMAM services in 20 UCs in Tharparkar, Shifa foundation in 9 UCs in Sanghar and NDS 9 in 11 UCs in Kamber Shahdadkot. So, it is recommended the IP to scale up the services through requesting financial support from Donors.
2. Blanket Supplementary feeding program in Tharparkar – as per the survey findings, close to quarter of children are suffering from acute malnutrition. Tharparkar district is severely drought affected and as a result the government of Sindh has declared emergency. So, until the humanitarian situation is improved and general food distribution is in place, it is recommended WFP to provide assistance to IP to start blanket supplementary program for all children 6-59 months.
3. Improve Measles vaccination coverage: As per the maternal confirmation, measles case are reported in all three districts. Moreover, 14% of under five deaths in Kamber Shahdadkot was due to measles. There is a close and important relationship between measles and malnutrition. Measles is far more severe in children who are malnourished. In addition, complications are more common and more serious in malnourished children. Measles is more severe in malnourished children and may make the existing malnutrition worse. Therefore, measles may result in, or aggravate, malnutrition.
4. Infant and young child feeding practices (IYCF):– as per the qualitative information from caregivers, there a gap both in knowledge and practices of recommended IYCF practices. According to 2013 lancet series, sub-optimum breast feeding is responsible for about 12% of under five death. In view of this fact, IPs should give more emphases on protection, promotion and Support of IYCF through integrating within the existing programs such CMAM and primary health care.
5. Water and sanitation - Efforts have to be made to improve the water and sanitation situation of the communities particularly in Tharparkar promotion of hygiene practices and provision of improved water supply.

26
7. APPENDICES
7.1 Assignment of clusters
Table 7.1.1 Sanghar District Clusters
Cluster Number
Place of catchment area Union Council Taluka
1 B-14 Housing Society Sanghar Sanghar-II
Sanghar
2 Vill.Darya Khan Chandio Kandiari
3 Vill.Chak-1 Khadwari
4 Vill.Chak-9-B Gujri
5 Vill. Mazhar Mari Sethar Pir
6 Vill.Rakhyal Rajar Chotiaryoon
7 Vill.Jaffar Khan Lighari Jaffar Khan Lighari
8 Ward-1 Khadro Khadro
9 Vill.Sahib Khan Rind Khadro
10 Vill.Suleman Chang Shah Mardanabad
11 Vill.Allah Dad Palh Pritamabad
12 Chakki Para Shahdadpur Shahdadpur-I
Shahdadpur
13 Mohammad Bux Colony Shahdadpur-II
14 Mustafa Colony Shahdadpur Shahdadpur-III
15 Bismillah Town Shahdadpur-IV
16 Vill.Bachal Bodani Jatia
17 Vill.Jan Mohammad Birohi Shahpurchakar
18 Jamali Muhalla Sarhari Sarhari
19 Vill.Maqsoodo Rind Lundo
20 Vill.Maroof Dahri S.F.Hingoro
21 Vill.Nachayo Bhanojo Asgharabad
22 Vill.Chanessar Bagrani Maldasi
23 Khatti Para Tando Adam Tando Adam-I
Tando Adam
24 Juman Shah Road Tando Adam Tando Adam-II
25 Joharabad Tadno Adam Tando Adam-IV
26 Vill.Haji Pir Bux Hingoro Mir Hassan Mari
27 Vill.Kumb Darhoon Kumb Darhoon
28 Bhittai Colony Khipro Khipro
Khipro
29 Vill.Qazi Mubeen Dars Roonjho
30 Vill.Majeed Khaskheli Roonjho
31 Vill.M.Sharif Samejo Khahi
32 Vill.Haji Ali Samoon Khori
33 Vill.Lakhoo Tajiyo Bilawal Hingorjo
34 Vill.Naley Chango Hingoro Qazi Faiz M.Rajar
35 Vill.Haji Jian Faqir Hingorjo Dhilyar

27
Table 7.1.2 Tharparkar District
Cluster Name of Village Name of UC
1 Sahiyaro Chelhar
2 Mevo rind Kantio
3 Jhanjhi Rajoro
4 Bhunio Ssaranghiar
5 Tar Dos Tar Dos
6 Jatrar Tar Ahmed
7 Jumoon Dhani Mithrio Charan
8 Kamanhar Kheensar
9 Ramlani Lapolo
10 Pirbhe Jo Par Pirane Jo Par
11 Sakree Dahli
12 Shabik Jee Veri Gadhro
13 Sanurani Jase Jo Par
14 Gadhro Pethapur
15 Ghartiyari Nagarparkar
16 Pano Jee Veri Harho
17 Ramsar Veerwah
18 Piaro Dal Sati Dera
19 Matheno Bajeer Peeloo
20 Malanhore Veena Malanhor Vina
21 Janjhno Menghwar Mohrano
22 Leyari Joruo
23 Chownhar Bhakuo
24 Noora Tal Mainthee
25 Khankhaniyar Raham Islamkot
26 Joglar Sonal Bah
27 Meenhoon lanjo Seengaro
28 Mole Jo Tar Khario G.Shah
29 Khorooro Aarokhee
30 Konral Jhimiryo
31 Dago Seengalo
32 Kaloi Kaloi
33 Otaq Memon Kaloi
34 Hajamro Khetlari
35 U.C Mihi Town

28
Table 7.1.3 Kamber Shahdadkhot clusters
Cluster number NAME OF VILLEGES Name of Union Councils Name of Taluka
1 JAKHAR KHANDU Warah
2 MUHAMMAD HASHIM CHHUTTO ABAD Warah
3 QAIM KHAN MUGHERI LALU RAUNK Warah
4 KHATAN KHAN MUGHERI WAGAN Warah
5 GAZI MURKHAND GAJI KHUHAWAR=16 Warah
6 RAISE JAHAN KHAN CHANDIO MIR PUR Warah
7 ARZI DEPAR MIANDAD CHINJI Nasirabad
8 WAZIR MALANO LAKHA Nasirabad
9 MIANI RAWAL (MIANI MUGHERI) KHAIR PUR JUSO Nasirabad
10 BHAWANDO LAKHO KAMBAR 1-2 Kambar
11 BER BER Kambar
12 CHUNDIA KALHORA BER Kambar
13 KHAMISO KHAN BROHI KALAR Kambar
14 HJI GHULAM HUSSAIN BOOHAR Kambar
15 CHHATANIN JO GOTH RANWATI Kambar
16 ESSO JIAN ABRO Kambar
17 MUJAWARAN JO GOTH JIAN ABRO Kambar
18 SHAKAL JI WAHI GAIBI DERO Kambar
19 NAO GOTH SIJAWAL Sijawal
20 MOHD HASSAN MASTOI MASTOI Sijawal
21 ARZ MOHD GADRO`S HOUSED MASTOI Sijawal
22 BAHADUR BHAND DHIGANO MAHESSAR Sijawal
23 TILLAN JATOI DHIGANO MAHESSAR Sijawal
24 LASHAKAR KHAN CHANDIO THUF CHOSOOL Sijawal
25 QADIR BUX CHANDIO THUF CHOSOOL Sijawal
26 QAMARUDDIN GOPANG MIROKHAN Miro Khan
27 MIRAN MUGHERI BAHRAM HATHION Miro Khan
28 ALI MOHMAD AHIR BAHRAM HATHION Miro Khan
29 DALIL BURIRO KARIRA Miro Khan
30 KHIRO GADAHI KALHORA Miro Khan
31 CHAJRI KALHORA Miro Khan
32 MIR JE NARI SILRA Shahdad Kot
33 MOLVI SHAKARUDIN (ARAKN) AITBAR KHAN CHANDIO Shahdad Kot
34 MOHD ALAM BHURGERI JAMALI Shahdad Kot
35 PATHAN BURIRO BAGO DARO Qubo Saeed Khan

29
7.2 Questionnaires
SMART NUTRITION SURVEY, SINDH March 2014
HOUSEHOLD QUESTIONAIRE
Section 1: Identification s
1 District _________________ 4 Village: __________________ 7 Date of Survey: ______________
2 Taluka: _________________ 5 Cluster Number: ___________ 8 Household Number: ________
3 UC: ____________________ 6 Team Number: ___________ m
Section 1: Household Characteristics
9 What sex is the head of the household? 1 Male
2 Female
10 Marital status of household head
1 Married
2 Divorced
3 Widow
4 Separated
5 others
11 Number of household members (HH size including head) /______________ /
12
Education level of the head of the household گھر کے سربراہ کی تعلیمی معیار کیا ہے؟
1 No formal schooling
2 Primary level (Grade 1 to 5), پرایمری
3 Middle Level (Grad 5-8 grade), مڈل
4 secondary ( Grade 9-10, SSC) ہائی
5 Intermediate (grade 11-12, HSSC)
6 Higher education and above
7 Other (specify) _______________ O
Section 2: Household Food security
13 What is the primary source of income of the household? (Only one Major economic activity)?
1 Agriculture/farming (Fishing, Livestock, crop)
2 Trading/Business
3 Salaried employee
4 Unskilled Wage labour (Agriculture/non-Agri)
5 Handicraft
6 Remittance – family support from outside Pakistan
7 Support (zakat, family, social welfare)
8 Other -Specify
14 Does this household own any livestock, herds, other farm animals, or poultry? Yes
If no go to Q16 No
15 If Q14 yes, which of the following animals does this household own?
Q15A Small animal – Sheep or goat Yes No
Q15B Large Animals - cattle , Buffalo, camel Yes No
Q15C Poultry/chicken- Yes No
16 Does this household own any land that can be used for agriculture?
1 Yes
0 No
17 At this time, What is the major source of your main staple food for the household?
1 Purchase
2 Own production
3 Relief food
4 Food loans
5 Food gift from family or neighbors
6 Others
30
O
Section 3: Hygiene and Sanitation
18
What is the main source of drinking water for members of your household?
آپ کے گھرانے میں پینے کے پانی کا
؟ذریعہ کیا ہے
1 Piped water into dwelling/yard/plot پانی کی پائپ الئن
2 Public tap/standpipe (piped) سرکاری نلکا
3 Tubewell/borehole/hand pumpہینڈ پمپ, ٹیوب ویل , ڈھکا ہوا کنواں , چشمہ
4 Protected dug well with hand pump کھال ہوا کنواں, کھال چشمہ
5 Protected spring/karez
6 Rainwater collection from roof
7 Open, Uncover well
8 Surface water (river/dam/ pond/stream/irrigation channels). دریا ، نہر
، تاالب ،آبی ذرائع9 Other – specify ………. دیگر )وضاحت کریں
19 What do you usually do to the water to make it safer to drink?
1 Drink without any treatment
2 Boil
3 Add Bleach/chlorine
4 Strained through cloth
5 Use water filter (Ceramic, sand or other filter)
6 Other (specify) --------------
20 Type of toilet used by the HH
آپ کے گھرانے میں کس قسم کی بیت الخال ئ کی سہولت
موجود ہے؟
1 Connected flush toilet فلش
2 Toilet – simple dry covered pit. گڑھا لٹرین 3 Toilet – uncovered pit
4 Outdoors in the open air کوئی سہولت نہیں ، جھاڑی دار کھیت
5 Others - Specify
21
How do you dispose the garbage Disposal
1 Collector
2 Dumping in rubbish pit
3 Burning
4 Throws in the street
5 Others – specify
22
When do you usually wash your hands with soap? (More than one answer possible)
22a After using toilet Yes No
22b Before eating. Yes No
22c Before food preparation Yes No
22d After changing diapers or cleaning up a child who has defecated Yes No
22e Before feeding the child Yes No
22f After touching an animal, animal feed, or animal waste Yes No
22g Any other - specify
23 Is there any soap in the household for hand washing? (Ask to see it) 1 Yes
0 No
24
What do you think is the possible cause of diarrhoea? , (More than one answer possible)
24a Unclean Water Yes No
24b Unclean Food Yes No
24c Unclean house/environment Yes No
24d Teething Yes No
24e spiritual/evil eye Yes No
24f Others:_______
N

31
Section 4: IYCF – Maternal Knowledge and Practice
25 Education level of mother of the child or primary care giver
1 No formal schooling
2 Primary level (Grade 1 to 5),
3 Middle Level (Grad 5-8 grade),
4 secondary ( Grade 9-10, SSC)
5 Intermediate (grade 11-12, HSSC)
6 Higher education and above
7 Other (specify) _______________
26
Do you know how long after delivery should a mother initiate breastfeeding for the newborn?
1 Within one hour
2 Between 1 and 23 hours
3 More than 24 hours
4 Don’t know
27 What did you do with the first milk yellowish color of breast milk (colostrum
1 Discard /remove /throw away If given to the child go to 29 2 Given to the child
3 Don’t know
28 If the colostrum was throw away or discard, what was the reason?
1 It is dirty
2 Harmful to the baby, cause sick
3 Advice from elders/in-law/peer
4 It is tradition
5 Other specify ___________________
29 For how long (up to what age) do you think a mother should breastfed her child only breast milk (even no water)?
--------- months (if less than one months, write 0)
30 In addition to breast milk, at what age do you think, it is best to start giving soft, semi-solid or foods?
--------- Month (if less than I month, write “0”.
31 Have you ever received any information or advice about breastfeeding? 1 Yes
2 No
32
If you received counseling or advice on breastfeeding, from whom do you get the information about breastfeeding? (multiple option)
1 Health facility staff (BHU, RHC, MCHC, Hospital) Yes No
2 Leady health workers Yes No
3 Nutrition CMAM staff (NGO staff) Yes No
4 Trained Traditional birth attendants Yes No
5 Media (radio, TV, newspaper, ) Yes No
6 Family (husband/ parent/in-low) Yes No
7 Friends/neighbours Yes No
8 Other (specify): __________________________

32
MORTALITY DATA QUESTIONNAIRE
March 2014 District: _________ Taluka: ____________, UC Name: _________ Village: ___________ Cluster number:_____ Team No: ____
HH
Total
household Members
Family
member joined
between December 5
2013 to March 5/2014
(between 2013 Topi
Ajkrak to 5th March
دن میں 00
کوئی شامل ہوا
ہے
Family
member who left between
December 5 2013 to March 5/2014
(between 2013 Topi Ajkrak to
5th
March دن 00
میں کسی نے
چھوڑا ہے
New
births between
December 5 2013 to
March 5/2014
(between 2013 Topi Ajkrak to
5th 00 دن
میں کوئی
پیدائش ہوئی
ہے
Death between December 5
2013 to March 5/2014 (between
2013 Topi Ajkrak to 5th
دن میں کوئی فوتگی ہو 00
ئی ہے
Causes of deaths
موت کے وجوھات
Remark
Total
< 5
Total
< 5
Total
< 5
Total
death
U5 Deaths
Causes of U5 Code 1-10
Cause of death >5 Code 1-10
1
2 3
4
5 6 7 8 7 10 11 12 13 14 15
Tota
l
Note: If there is more than one death, please detail the cause of each death under “Cause”.
1. Diarrhea 6. Malnutrition 2. Measles 7. Accident 3. Malaria 8. Conflict 4. Fever 9. Unknown 5. ARI – coughing/breathing difficulty 10. Others (specify)

33
ANTHROPOMETRIC, MORBIDITY, VACCINATION and IYCF
District: ___ Taluka: ______ UC: _______ Village Name:___ Cluster Number __
Survey Date :_____ Team Number: __ Team Leader Name: _________
Q1 Chil
d No.
Q2 HH
No
Q3 Chil
d
Name
Q4 Sex
(F/M)
Q5 Date of
birth (dd/mm/y
y)
Q6 Age
in
months
Q7 Weig
ht
(kg) ±100g
Q8 Heig
ht
(cm)
±0.1 cm
Q9 Oedem
a (Y/N)
Q10 MUA
C
Q1
1-
Vit
amin
A s
upp
lem
enta
tion i
n t
he
last
six
mo
nth
s (S
ho
w m
oth
er c
apsu
le)
(No
=0
, Y
es =
1,
DK
=8
)
Vaccination
was the child ill since last two weeks
IYCF children 6-23
months Maternal Nutrition and
Education
Q1
2 M
easl
es v
acci
nat
ion
(ag
e 9
-59
mon
ths)
**
(1=
Yes
co
nfi
rmed
fro
m c
ard
, 2
= y
es m
oth
er c
on
firm
atio
n/n
o c
ard
, 3
=
no
t v
acci
nat
ed, 8
= d
on't k
no
w
Q1
3 B
CG
mar
k (
No =
0,
Yes
= 1
, D
K=
8)
Q1
4 D
iarr
ea (
No
=0
, Y
es =
1,
DK
=8
)
Q1
5 F
ever
(N
o =
0, Y
es =
1,
DK
=8
)
Q1
6 C
ou
gh
(N
o =
0,
Yes
= 1
, D
K=
8)
Q1
7 M
easl
es (
N0
=0
, Y
es=
1,
DK
=*
)
Q18
Other
illnes
s
(writ
e
down
)
Q1
9 if
the
ch
ild w
as s
ick,
did
he
/she
vis
it H
ea
lth
facili
ty
(N0=
0,
Yes=
1, D
K=
8)
Q2
0 H
as th
is c
hild
eve
r b
ee
n b
rea
st
fed a
t an
y tim
e in
his
/her
life?
No
=0
, Y
es=
1
Q2
1 i
s th
e ch
ild
cu
rren
tly s
till
on
bre
astf
ed?
No
=0,
Yes
= 1
Q2
2 M
oth
er
MU
AC
Q2
3 W
ha
t is
th
e h
igh
est
leve
l o
f sch
ool th
e m
oth
er
att
en
ded?
(Neve
r att
end
ed
=0
, cla
ss 1
-5 =
1,
Cla
ss 6
-8 =
2,
Cla
ss 9
-10
=3
, C
lass 1
1-1
2 =
4 h
igh
er,
=5
)

34
Diarrhea - is defined any episode of more than 3 stools in 24 hours (it can be bloody or not). Measles - is can be manifested as fever, rash or red eyes Cough - includes difficulty breathing; Fever - is elevated body temperature;