nutrition in food · all other watering was done only with the hydroponic nutrient solution. amount...
TRANSCRIPT
Nutrition in Food Using GANS and its benefits
Jim MacDonald 5/22/19 Agriculture

P a g e 1 | 29
Growing Nutritious Food An investigation to determine whether using the GANS on seeds can
improve the Nutritional value of our food.
By Jim Mac Donald, May 2019
Introduction
Modern Agriculture conjures up a lot of debate around different farming practices.
Does one till the land or not till the land? Do you only surface till the land? Growing
organically versus conventional chemical farming. Farming using bio-dynamics
principles or farming using permaculture. Growing food in soil compared to growing
food in water through hydroponic and aquaponic systems.
Each way of farming has its supporters and naysayers. We can all get lost in the
debates, but I believe we have lost sight of the one main principle of farming and that
is to grow and provide the most nutritious food irrespective of how it is grown.
When you go to your local grocer and see an array of fresh tomatoes of different
varieties, how do we know which one will give us the most nutrition? What nutrients
are we getting, if any? We do not see a list of nutrients on our tomato or carrot, so
how can we be sure of what we are buying? When we buy any other food from the
store, each product lists the ingredients and nutritional value. Why are we not doing
this for our freshly grown produce?
The link between food nutrition and our health is a well-established and an obvious
connection. We are told by Nutritionists and Doctors “Eat a healthy diet including
fruit and vegetables”. Yes, they are correct, but how much of the fruit and vegetables
do I need to eat every day to ensure my body is receiving enough nutrition? If my
food is so depleted of the vitamins and minerals, do I have to eat 3 x times as much
just to keep me healthy? Has the nutrition of our food declined so much and is this a
big contributing factor to the poor state of our health today?
The objective of this experiment is to determine if we can increase the
nutritional value of a plant using the GANS Plasma Solution.
The following report details the method and results of soaking
Daikon Radish seeds in a GANS Plasma solution, allowing them to
grow and conducting tests on the nutritional value of the plant.
P a g e 2 | 29
Materials and Methods.
• Daikon radish seeds Raphanus sativus L. were used throughout these
experiments.
• Two batches of Daikon plant material were grown and used for analysis.
The two batches of plant material were divided as follows
• The first batch of seeds were soaked in the GANS Plasma solution. These will
be referred to as the Plasma Radish
• The second batch of seeds were only soaked in distilled water. These will be
referred to as the Plain Radish
Both batches of Radish plants were watered with our standard nutrient solution which
contains the following minerals as a salt solution:
Calcium, Nitrogen, Iron, Potassium, Magnesium, Sulphur, Phosphor with trace
amounts of Boron, Zinc and Copper
GANS stands for: A molecule of Gas which becomes a Nano of itself and appears as
Solid state of matter. The methods of creating this material was developed by M T
Keshe of the Keshe Foundation [Reference 1].
The development of the Plasma Science & Technology and especially in the GANS
and its benefits on both plants and animals is at the leading edge of science. This
report cannot go into the depths of knowledge about the GANS and Plasma Science.
Please go to the following links: www.keshefoundation.org and www.kfssi.org for
more background information.
P a g e 3 | 29
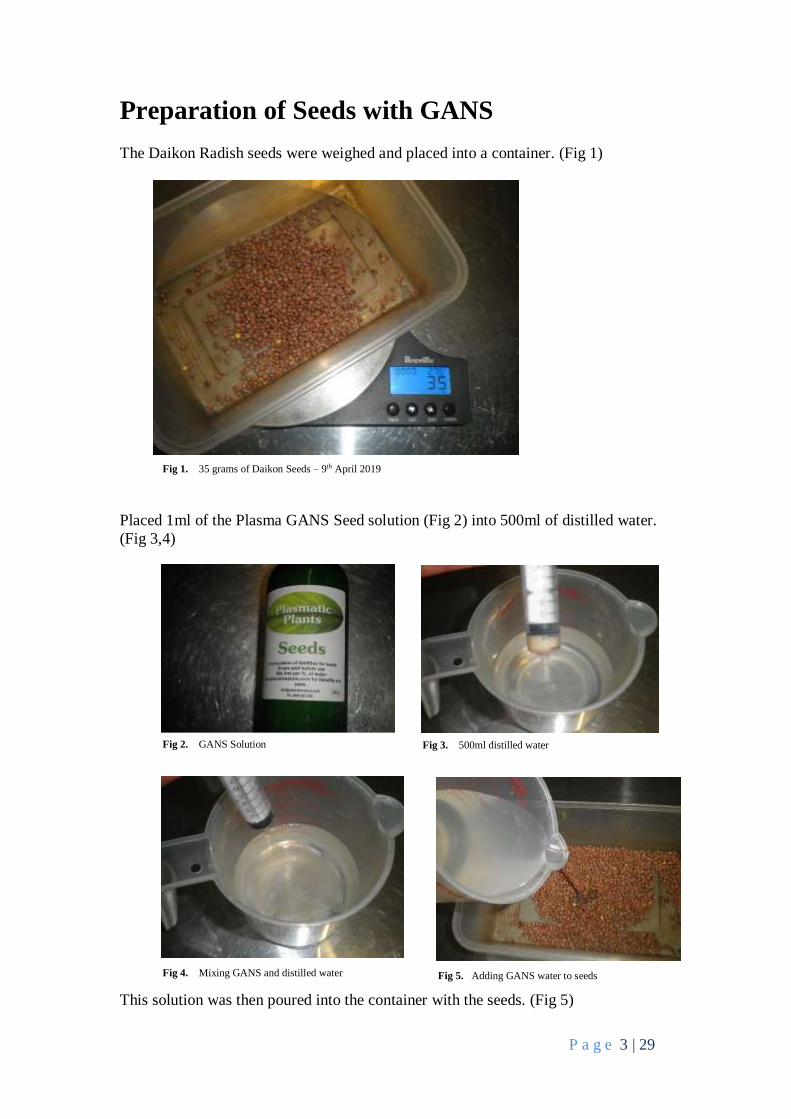
Preparation of Seeds with GANS
The Daikon Radish seeds were weighed and placed into a container. (Fig 1)
Placed 1ml of the Plasma GANS Seed solution (Fig 2) into 500ml of distilled water.
(Fig 3,4)
This solution was then poured into the container with the seeds. (Fig 5)
Fig 1. 35 grams of Daikon Seeds – 9th April 2019
Fig 2. GANS Solution Fig 3. 500ml distilled water
Fig 4. Mixing GANS and distilled water Fig 5. Adding GANS water to seeds

P a g e 4 | 29
This container was placed on a heating mat and covered with a towel. The heating mat
keeps the seeds at a warm temperature which helps with the germination, particularly
during the colder months. (Fig 6-8)
The seeds were left to soak in the Plasma GANS solution for 24 hours.
Fig 6. Seeds on heating mat Fig 7. Seeds covered
Fig 8. Covered with towel
Fig 9. Image of seeds after 24 hours.

P a g e 5 | 29
The picture (Fig 9) shows the seeds after soaking in the Plasma solution. 10 April
2019
The water is drained
away and the seeds are
spread out over a 2cm
layer of plain coco fibre.
The coco fibre contains
no nutritional value.
(Fig 10)
Full tray of treated seeds. (Fig
11)
10 April 2019
The seeds are covered and
allowed to germinate.
Fig 10. Seeds on coco fibre
Fig 11. Tray with daikon seeds
Fig 12. Germinated seeds

P a g e 6 | 29
The pictures (Fig 12 - 14) shows the radish after germination. 14 April 2019
During the germination stage, no water is added. Once the radish has germinated and
during the growth period over the next 4 days, the radish is watered morning and
evening. This water is taken from a deep water hydroponic grow bed where rain water
is collected. It also has glass bottles of GANS submerged in the water. A 9-litre
container is filled with this water and 40ml of our standard hydroponic nutrient mix is
added. Over the course of the 4 days, 2ml of the Seed Plasma solution was added
three times during this growing period. All other watering was done only with the
hydroponic nutrient solution.
Amount of GANS Plasma Solution used.
The initial soaking of the seeds was in a 0.2% solution of the GANS
The watering of the plants was with a 0.02% solution of the GANS
The pictures (Fig 15 - 17) show the radish on the day of harvest. 17th April 2019. This
shows the growth 8 days from soaking of the seeds.
Fig 13. Side view of germinated seeds Fig 14. Top view of germinated seeds
Fig 15. Top view plasma radish.

P a g e 7 | 29
The following pictures (Fig 18 - 20) show the root growth of the radish plants. In all
previous experiments over the past few years, we have consistently seen rigorous root
growth and well-developed roots when using the GANS on plants.
Fig 16. Side view plasma radish. Fig 17. Close-up view of radish
Fig 18. Root growth of radish
Fig 19. Close-up view of roots

P a g e 8 | 29
The plants where placed in a large bath of water to wash the coco fibre off the roots.
The plants
were washed
10 times to
remove the
coco fibre.
Each time the
water was
refreshed.
(Fig 21)
They were then placed into a bag and placed into a spinner 2 times to remove all the
excess water.
Fig 20. Side view of root growth
Fig 21. Washing of the radish plants

P a g e 9 | 29
The total radish was then weighed.
From the original 35 grams of seed we produced 424 grams of plant mass. (Fig 22)
Random samples of individual plants were taken to measure the length of their roots.
The set of pictures below show the results.
18cm from tip of root to top
of plant. (Fig 23)
Fig 22. Weighing of radish plants
Fig 23. Measuring length of radish plant

P a g e 10 | 29
The length of the
plants was measured
(Fig 24):
18cm, 18cm, 19cm,
15cm, 14cm, 17cm
16cm, 14cm
The length of the
roots only was:
12cm, 9cm, 8cm,
6cm, 8cm, 7cm,
5cm, 6cm
A sample of 200g of the radish plants with roots were sent to the Environmental
Analysis Laboratory of the Southern Cross University for Plant Tissue Analysis on
the 17 April 2019.
A sample of 50g of the radish plants and roots was used for the Pfeiffer’s Circular
Chromatography test.
The balance of the radish was placed in the fridge for shelf life evaluation.
Preparation of the Plain Seeds
The Daikon Radish seeds were weighed (35 grams ) and placed into a container on
the 16th April 2019. (Fig 25).
Fig 24. Measuring multiple radish plants
Fig 25. Weighing of Daikon radish seeds

P a g e 11 | 29
Added 500ml of distilled water into the container of seeds. No GANS Plasma solution
was added.
This container was placed on a heating mat and covered with a towel. The heating mat
keeps the seeds at a warm temperature which helps with the germination, particularly
during the colder months. (Fig 26 - 28)
The seeds were left to soak in the plain water for 24 hours.
On the 17th April the water was drained,
and the seeds were planted. (Fig 29)
The seeds were spread over a 2cm thick
layer of coco fibre. (Fig 30)
17 April
Fig 26. Seeds on heating mat Fig 27. Seeds covered Fig 28. Seeds covered with a towel
Fig 29. Seeds after soaking for 24 hours
Fig 30. Tray covered with seeds

P a g e 12 | 29
During the germination stage no water is added. Once the radish has germinated and
during the growth period over the next 4 days the radish was watered morning and
evening. This water is taken from a deep water hydroponic grow bed where rain water
is collected. It also has glass bottles of GANS submerged in the water. A 9-litre
container is filled with this water and 40ml of our standard hydroponic nutrient mix is
added. No GANS plasma solution was added to this water.
The pictures (Fig 31,32) show the radish on the day of harvest. 24 April. 8 days from
seed to harvest.
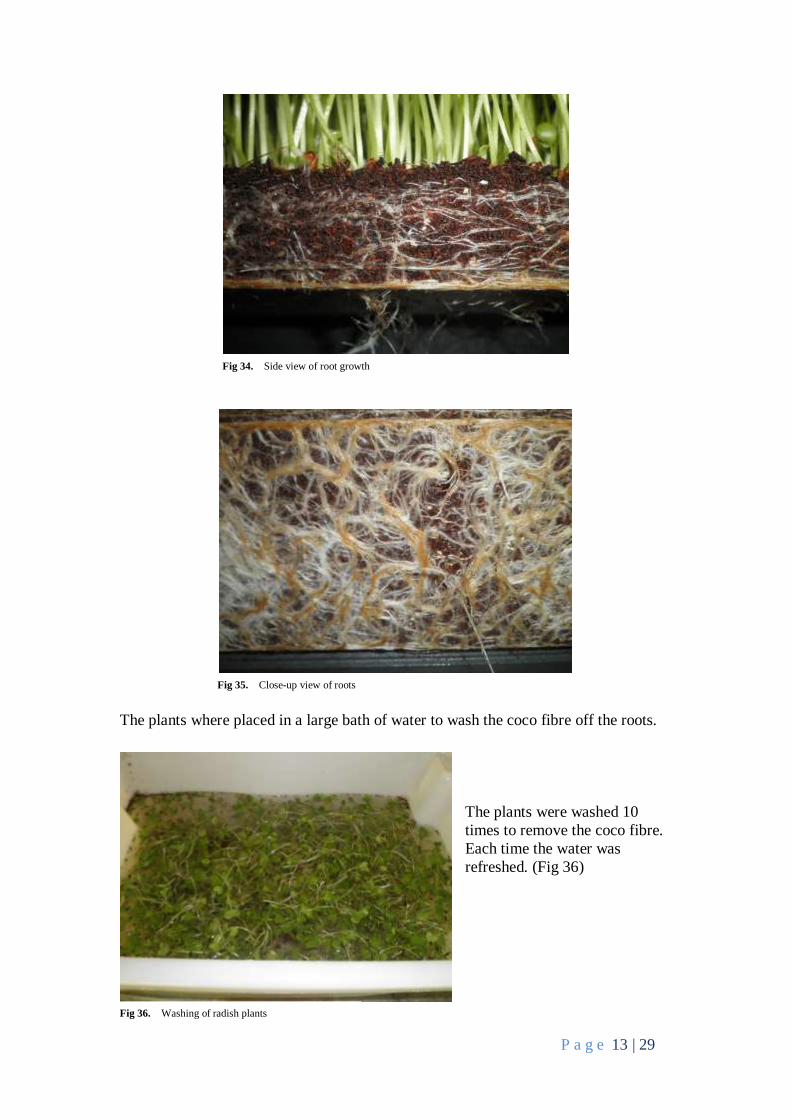
The pictures (Fig 33 - 35) are showing the root growth of the radish plants.
Fig 31. Top view of radish plants Fig 32. Side view of radish plants
Fig 33. View of roots
P a g e 13 | 29
The plants where placed in a large bath of water to wash the coco fibre off the roots.
The plants were washed 10
times to remove the coco fibre.
Each time the water was
refreshed. (Fig 36)
Fig 34. Side view of root growth
Fig 35. Close-up view of roots
Fig 36. Washing of radish plants
P a g e 14 | 29
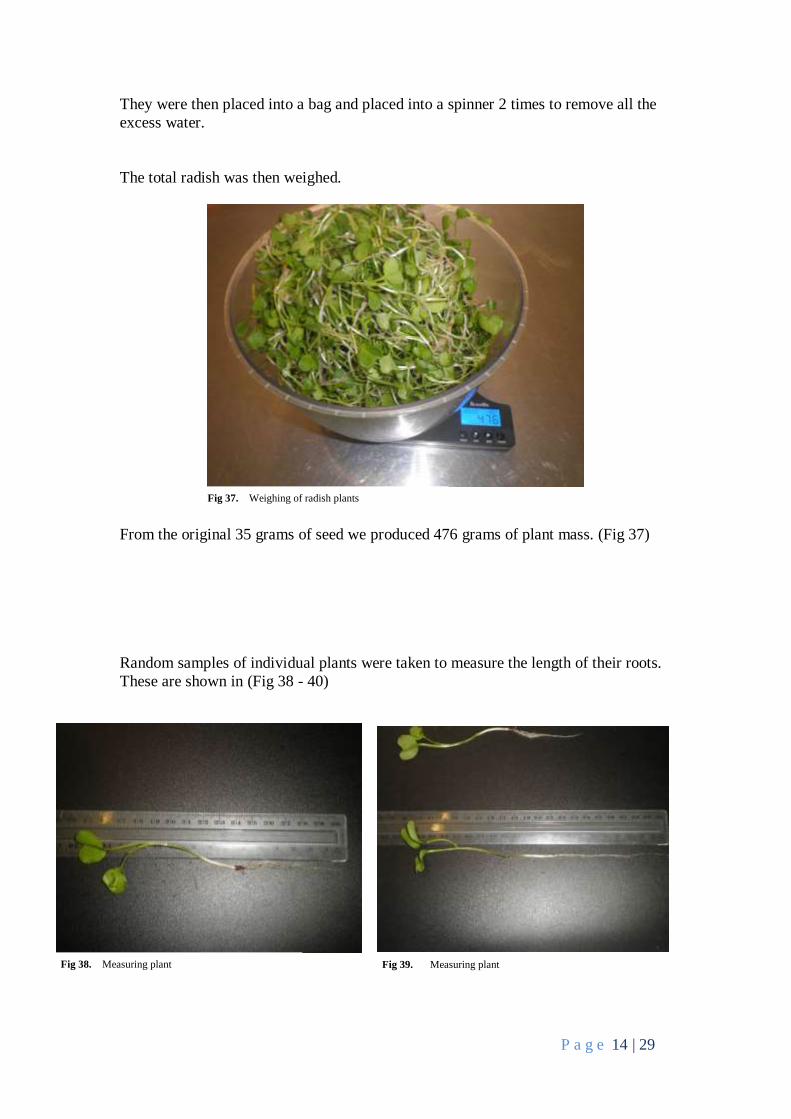
They were then placed into a bag and placed into a spinner 2 times to remove all the
excess water.
The total radish was then weighed.
From the original 35 grams of seed we produced 476 grams of plant mass. (Fig 37)
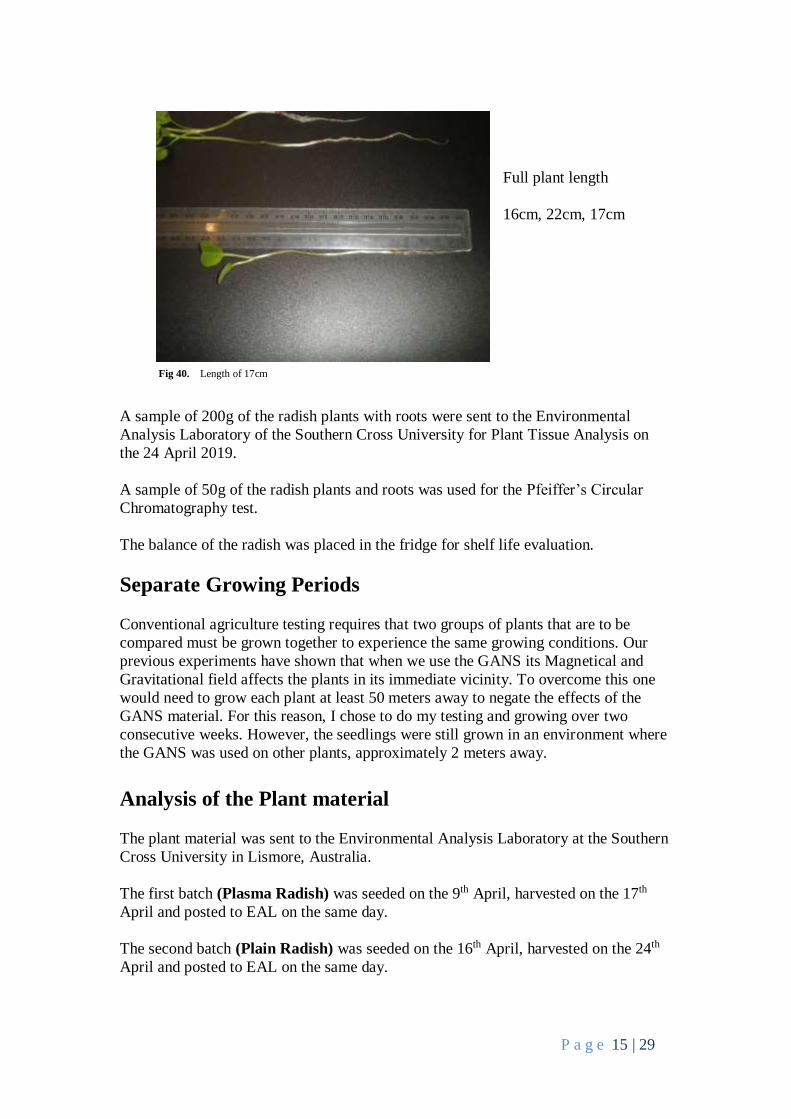
Random samples of individual plants were taken to measure the length of their roots.
These are shown in (Fig 38 - 40)
Fig 37. Weighing of radish plants
Fig 38. Measuring plant Fig 39. Measuring plant
P a g e 15 | 29
Full plant length
16cm, 22cm, 17cm
A sample of 200g of the radish plants with roots were sent to the Environmental
Analysis Laboratory of the Southern Cross University for Plant Tissue Analysis on
the 24 April 2019.
A sample of 50g of the radish plants and roots was used for the Pfeiffer’s Circular
Chromatography test.
The balance of the radish was placed in the fridge for shelf life evaluation.
Separate Growing Periods
Conventional agriculture testing requires that two groups of plants that are to be
compared must be grown together to experience the same growing conditions. Our
previous experiments have shown that when we use the GANS its Magnetical and
Gravitational field affects the plants in its immediate vicinity. To overcome this one
would need to grow each plant at least 50 meters away to negate the effects of the
GANS material. For this reason, I chose to do my testing and growing over two
consecutive weeks. However, the seedlings were still grown in an environment where
the GANS was used on other plants, approximately 2 meters away.
Analysis of the Plant material
The plant material was sent to the Environmental Analysis Laboratory at the Southern
Cross University in Lismore, Australia.
The first batch (Plasma Radish) was seeded on the 9th April, harvested on the 17th
April and posted to EAL on the same day.
The second batch (Plain Radish) was seeded on the 16th April, harvested on the 24th
April and posted to EAL on the same day.
Fig 40. Length of 17cm

P a g e 16 | 29
Results
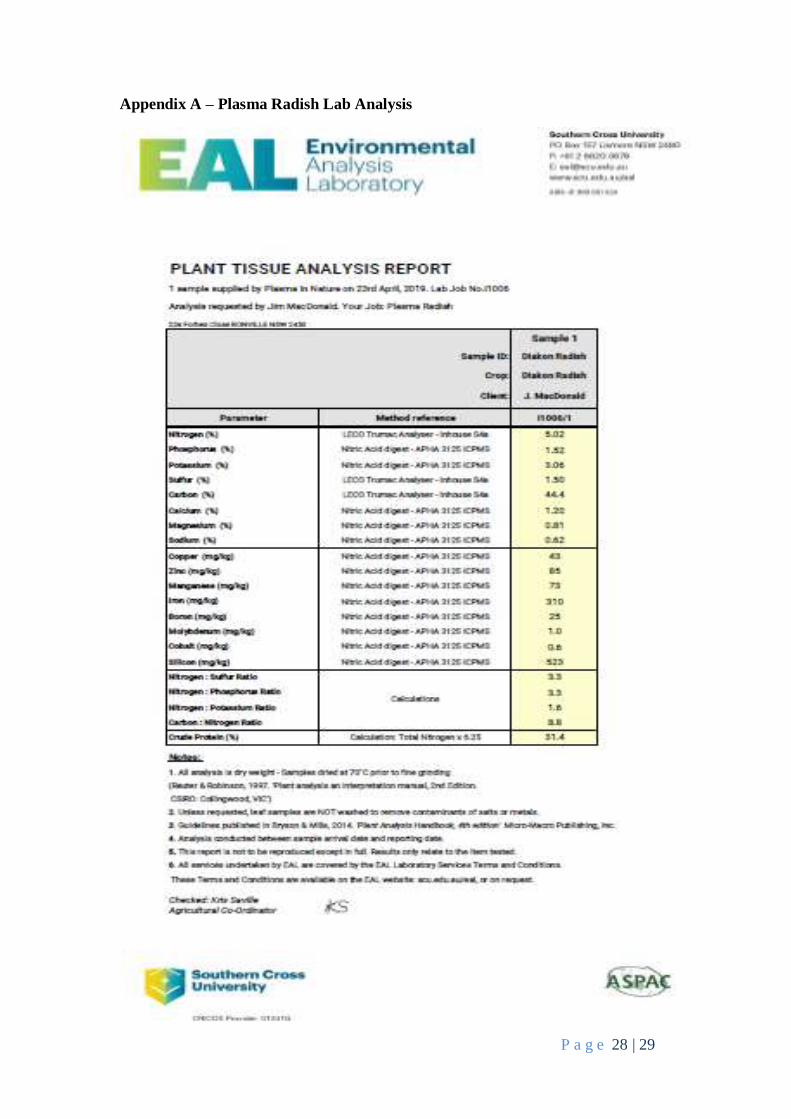
Plant Tissue Analysis Report
The following set of results and graphs are a direct comparison between the Plasma
Radish and the Plain Radish. In both cases the whole plant including the roots was
sent for analysis. The original analysis reports for both samples are attached as
appendices at the end of this paper. Appendix A is the report of the Plasma Radish.
Appendix B is the report of the Plain Radish.
Table 1 is a direct comparison of the results between the two.
Table 1. Table of the results from the plasma radish and the plain radish
P a g e 17 | 29
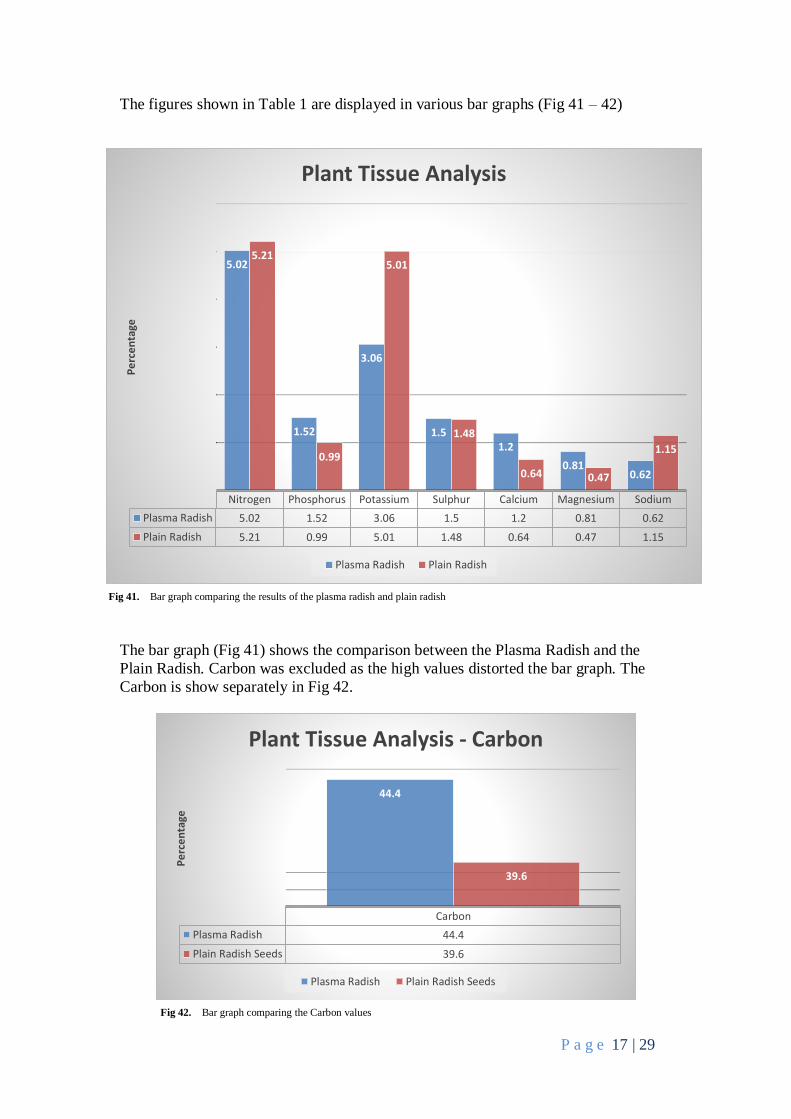
The figures shown in Table 1 are displayed in various bar graphs (Fig 41 – 42)
The bar graph (Fig 41) shows the comparison between the Plasma Radish and the
Plain Radish. Carbon was excluded as the high values distorted the bar graph. The
Carbon is show separately in Fig 42.
Carbon
Plasma Radish 44.4
Plain Radish Seeds 39.6
44.4
39.6
Pe
rce
nta
ge
Plant Tissue Analysis - Carbon
Plasma Radish Plain Radish Seeds
Nitrogen Phosphorus Potassium Sulphur Calcium Magnesium Sodium
Plasma Radish 5.02 1.52 3.06 1.5 1.2 0.81 0.62
Plain Radish 5.21 0.99 5.01 1.48 0.64 0.47 1.15
5.02
1.52
3.06
1.51.2
0.810.62
5.21
0.99
5.01
1.48
0.64 0.47
1.15
Pe
rce
nta
ge
Plant Tissue Analysis
Plasma Radish Plain Radish
Fig 41. Bar graph comparing the results of the plasma radish and plain radish
Fig 42. Bar graph comparing the Carbon values

P a g e 18 | 29
The series of graphs (Fig 43 – 44) show the mineral compositions of the different
radish.
Iron Silicon
Plasma Radish 310 523
Plain Radish 198 460
310
523
198
460
mg
/ 1
00
g
Plant Tissue Analysis
Plasma Radish Plain Radish
Copper Zinc Manganese Boron Molybdenum Cobalt
Plasma Radish 43 85 73 25 1 0.6
Plain Radish 16 50 49 30 0.9 0.2
43
85
73
25
1 0.6
16
50 49
30
0.9 0.2
mg
/ 1
00
g
Plant Tissue Analysis
Plasma Radish Plain Radish
Fig 43. Bar graph comparing the results of the plasma radish and the plain radish
Fig 44. Bar graph of the results for Iron and Silicon
P a g e 19 | 29
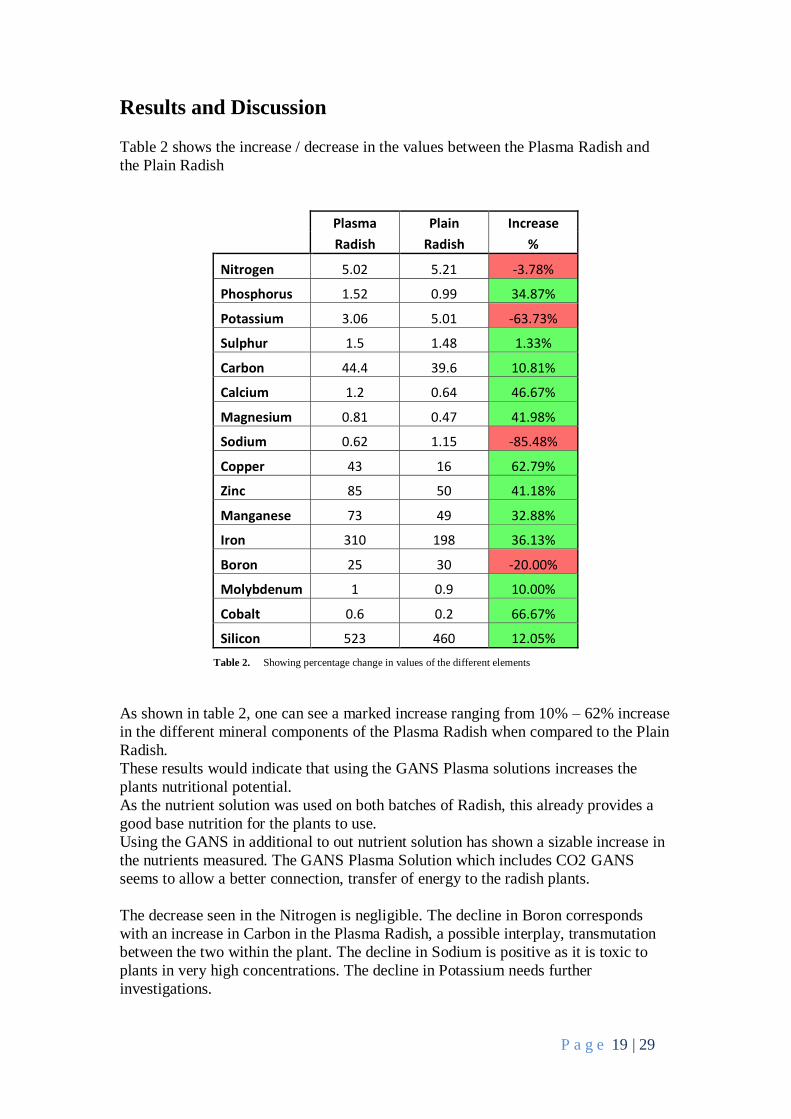
Results and Discussion
Table 2 shows the increase / decrease in the values between the Plasma Radish and
the Plain Radish
Plasma Plain Increase
Radish Radish %
Nitrogen 5.02 5.21 -3.78%
Phosphorus 1.52 0.99 34.87%
Potassium 3.06 5.01 -63.73%
Sulphur 1.5 1.48 1.33%
Carbon 44.4 39.6 10.81%
Calcium 1.2 0.64 46.67%
Magnesium 0.81 0.47 41.98%
Sodium 0.62 1.15 -85.48%
Copper 43 16 62.79%
Zinc 85 50 41.18%
Manganese 73 49 32.88%
Iron 310 198 36.13%
Boron 25 30 -20.00%
Molybdenum 1 0.9 10.00%
Cobalt 0.6 0.2 66.67%
Silicon 523 460 12.05%
As shown in table 2, one can see a marked increase ranging from 10% – 62% increase
in the different mineral components of the Plasma Radish when compared to the Plain
Radish.
These results would indicate that using the GANS Plasma solutions increases the
plants nutritional potential.
As the nutrient solution was used on both batches of Radish, this already provides a
good base nutrition for the plants to use.
Using the GANS in additional to out nutrient solution has shown a sizable increase in
the nutrients measured. The GANS Plasma Solution which includes CO2 GANS
seems to allow a better connection, transfer of energy to the radish plants.
The decrease seen in the Nitrogen is negligible. The decline in Boron corresponds
with an increase in Carbon in the Plasma Radish, a possible interplay, transmutation
between the two within the plant. The decline in Sodium is positive as it is toxic to
plants in very high concentrations. The decline in Potassium needs further
investigations.
Table 2. Showing percentage change in values of the different elements

P a g e 20 | 29
Comparison and evaluation of Plant growth between the Plasma
Radish batch and the Plain Radish batch
Visual Appearance
Both batches of radish grew for 8 days. The Plain Radish (Fig 46) looked taller than
the Plasma Radish (Fig 45). Several factors come into play, amount of sunlight, colder
nights. A small change in weather was experienced during this period. Over the many
years of growing the Daikon radish, this is normal to see different growth rates from
week to week. The weight difference of 52 grams is quite normal depending on the
growing conditions for that week.
Comparing Root Growth
Figures 47 and 48 show the roots of the Plasma Radish
Fig 45. Radish grown with GANS Fig 46. Plain Radish grown with no GANS
Fig 47. Fig 48.
P a g e 21 | 29
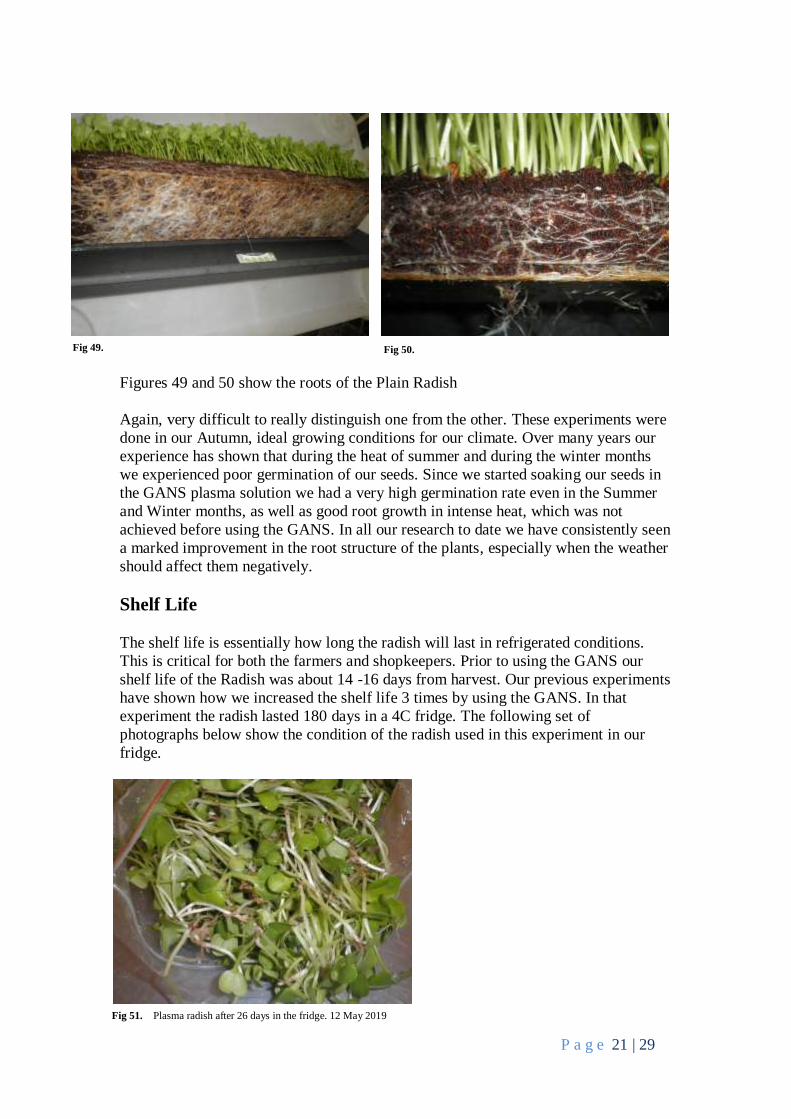
Figures 49 and 50 show the roots of the Plain Radish
Again, very difficult to really distinguish one from the other. These experiments were
done in our Autumn, ideal growing conditions for our climate. Over many years our
experience has shown that during the heat of summer and during the winter months
we experienced poor germination of our seeds. Since we started soaking our seeds in
the GANS plasma solution we had a very high germination rate even in the Summer
and Winter months, as well as good root growth in intense heat, which was not
achieved before using the GANS. In all our research to date we have consistently seen
a marked improvement in the root structure of the plants, especially when the weather
should affect them negatively.
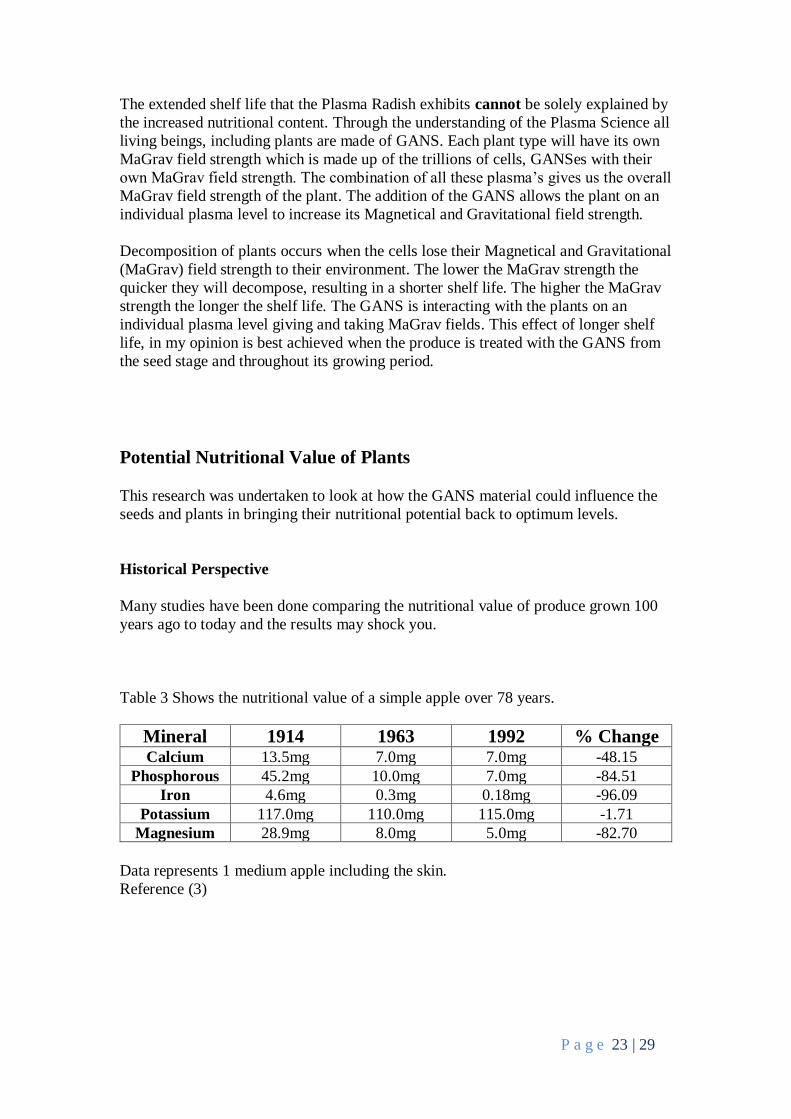
Shelf Life
The shelf life is essentially how long the radish will last in refrigerated conditions.
This is critical for both the farmers and shopkeepers. Prior to using the GANS our
shelf life of the Radish was about 14 -16 days from harvest. Our previous experiments
have shown how we increased the shelf life 3 times by using the GANS. In that
experiment the radish lasted 180 days in a 4C fridge. The following set of
photographs below show the condition of the radish used in this experiment in our
fridge.
Fig 49. Fig 50.
Fig 51. Plasma radish after 26 days in the fridge. 12 May 2019

P a g e 22 | 29
The Plasma Radish (Fig 51) is showing a superior shelf life in the fridge compared to
the Plain Radish (Fig 52). This again confirms our initial fridge trials on the radish in
which we achieved superior shelf life of over 3 times.
Fig 52. Plain radish after 19 days in the fridge. 12 May 2019
Fig 53. Plasma radish 34 days in the fridge. 20th May 2019
Fig 54. Plain radish 27 days in the fridge. 20th May 2019
P a g e 23 | 29
The extended shelf life that the Plasma Radish exhibits cannot be solely explained by
the increased nutritional content. Through the understanding of the Plasma Science all
living beings, including plants are made of GANS. Each plant type will have its own
MaGrav field strength which is made up of the trillions of cells, GANSes with their
own MaGrav field strength. The combination of all these plasma’s gives us the overall
MaGrav field strength of the plant. The addition of the GANS allows the plant on an
individual plasma level to increase its Magnetical and Gravitational field strength.
Decomposition of plants occurs when the cells lose their Magnetical and Gravitational
(MaGrav) field strength to their environment. The lower the MaGrav strength the
quicker they will decompose, resulting in a shorter shelf life. The higher the MaGrav
strength the longer the shelf life. The GANS is interacting with the plants on an
individual plasma level giving and taking MaGrav fields. This effect of longer shelf
life, in my opinion is best achieved when the produce is treated with the GANS from
the seed stage and throughout its growing period.
Potential Nutritional Value of Plants
This research was undertaken to look at how the GANS material could influence the
seeds and plants in bringing their nutritional potential back to optimum levels.
Historical Perspective
Many studies have been done comparing the nutritional value of produce grown 100
years ago to today and the results may shock you.
Table 3 Shows the nutritional value of a simple apple over 78 years.
Mineral 1914 1963 1992 % Change Calcium 13.5mg 7.0mg 7.0mg -48.15
Phosphorous 45.2mg 10.0mg 7.0mg -84.51
Iron 4.6mg 0.3mg 0.18mg -96.09
Potassium 117.0mg 110.0mg 115.0mg -1.71
Magnesium 28.9mg 8.0mg 5.0mg -82.70
Data represents 1 medium apple including the skin.
Reference (3)

P a g e 24 | 29
Another way to view this data is to look at how many apples would I have to eat in
1992 to get the same nutrition as the 1 apple in 1914
Calcium 2 apples
Phosphorous 6 apples
Iron 25 apples
Potassium 1 apple
Magnesium 6 apples
This illustrates the decline in the nutritional value of apples. Can you imagine what it
is today?
Figure 55 illustrates the decline of the total nutrition of a cabbage, lettuce, tomato and
spinach between 1914 and 1997. Ref 2
The total Calcium, Magnesium and Iron in these four vegetables totalled 400mg in
1914.
In 1997 it totalled 75mg, a decline of 81.25% over the 83 years.
To summarize one would need to eat 5 x the amount of the cabbage, lettuce, tomatoes
and spinach in 1997 to get the same nutrition they gave you in 1914.
Fig 55. Showing the decline of nutritional values over 83 years. (Reference 2)

P a g e 25 | 29
The decline in the nutrient value of
our foods is partly due to the
degradation and destruction of our
soils over the decades. We have
gone from small scale farming to
commercial sized farming to feed
the world’s population. The use of
fertilizers in the soils is like a drug
addict who always needs another
fix. When you start down the road of
using fertilizers on your farm you
eventually destroy your soils, so that
over time you need more and more fertilizers to get the same growth. Most farming
today is unsustainable and food security for many nations is becoming a top priority.
As there are many farming methods, so there are many ways to tackle this problem,
each one coming from a different perspective.
A wholistic approach needs to be taken. One where we can increase the nutritional
content of our food while at the same time regenerate our soils and at the same time
remove the toxins from the soils, while creating an environment where the plants,
animals and humans are happy. Far-fetched, impossible – NO.
With the development of the Plasma Science and Technology for space travel at the
Keshe Foundation all the above criteria can be resolved at the same time.
Over the last century,
the nutritional value
of our foods has
shown a steady
decline. It is not the
plants that have
changed so much, but
rather the conditions
in which they are
growing. This
information of poor
growth has unfortunately been passed onto each successive generation of new plants
through the seeds. This new information as Magnetical and Gravitational fields, has
been added to the DNA and RNA of the seeds. Growing with these seeds today means
we are starting from a lower base.
This implies that the plants have the potential to provide us with very high nutrient
values if given the right growing conditions. Plants grown in very poor soils and
conditions will still grow, albeit looking small, unhealthy and susceptible to all sorts
P a g e 26 | 29
of pests and diseases. This would be the minimum conditions for the plant to sustain
itself. I believe this is what we are facing today in feeding the world’s population.
Plants grown in perfect conditions, not wanting for anything will grow to their full
potential, the best Radish or Carrot it can be. History has shown the potential of the
plants.
The results that we have shown of increased minerals in the Daikon Radish by
soaking the seeds in the GANS Plasma solution is giving us an indication that we can
increase the nutritional content of our crops, allowing the plants to grow to their full
potential.
By increasing the health of the plant, you are also reducing the prevalence of any
pests or diseases. The same comparison can be made in people, a healthy fit person
will not be susceptible to diseases compared to a very overweight, unhealthy person.
In previous trials conducted by M.T Keshe of the Keshe Foundation it has been
shown that soaking the seeds in GANS removes the layers of information of the
conditions and environment of the past that has been passed onto the seeds over the
generations. In the experiment they were able to take the seeds of wheat and it showed
its true origin as a grass.
It must be understood that we are not changing the genetics of the plants to achieve
higher nutritional levels, all we are doing is allowing the plants to grow and thrive
under all conditions and in so doing the plants will have a higher nutrient level
because the potential already existed in the plant. We are allowing the plant to express
its full potential.
This concept can be applied on the commercial scale farming in the following way.
Adding the GANS into the seed coating mixture that is currently used. Artificial
coating of seeds is used to improve handling and for the delivery of protectants,
symbiotic microorganisms, micronutrients, soil adjuvants, germination promoters and
growth regulators. By adding the GANSes into this mix we can potentially achieve
the following:
• Ease of distribution of the GANS with the seeds, thereby eliminating an
additional cost for the farmer to distribute the GANS onto his farm.
• The addition of micronutrients in the coating mixture with the GANS will
allowing a better connection to the seed and the plant as a whole.
• The GANS is added to the soil through the seed coating thereby aiding in the
overall regeneration of the soils and the microbial life in the soils. This will
have a long term beneficial impact on the soils, environment, plants and
people.
• The environment of the farm can be changed with the addition of the GANS
• An acceptable method of introducing the GANS to commercial farmers who
tend to be creatures of habit and do not like change.
Further Investigations
As stated before, the plain radish was watered with our reservoir of rain water, which
does have bottles of GANS in the water. The whole area in which we grow has many
bottles of GANS and certain plasma devices in the water in the nearby growing beds.

P a g e 27 | 29
How this plasmatic environment plays a role will require further experiments but for
this current experiment it is something we need to be aware of.
Health Impacts on Society
Eating produce that is grow with the GANS over an extended period will have a huge
impact on the long-term health (physical and emotionally) of people. Our experience
over the last 3 years in supplying our local area with the food grown with the GANS
has shown some interesting behaviour patterns.
• We have a dedicated following of clients
• Customers get upset when we cannot supply, it almost seems they become
“addicted” to the benefits (nutritionally and emotionally) that the produce
offers.
• Our demand over the winter, colder months does not decline as much
compared to the period before we started using the GANS
Conclusion
Using the GANS Plasma solution increases the plants nutritional potential, allowing
them to physically and emotionally thrive. The emotional benefits of using the GANS
for the plants and the humans who eat and cultivate the produce is an additional,
unquantifiable benefit.
The results shown in this experiment are essentially a snap-shot in time of the life of
the plant. The figures will change as the radish grows to maturity and throughout the
growth stage. The seeds collected from these plants will contain new DNA and RNA
information for future generations of plants and potentially increase the nutritional
benefit even further.
The increased shelf life of the Plasma Radish is confirming previous experiments
undertaken by the author. Increased nutritional values can contribute to this effect,
However, nutrient values do NOT account for the very significant increase. This is
where the real benefits of using the GANS shows itself. Just a doubling of shelf life
will have profound benefits for small scale farmers around the world. Their ability to
bring their crops to the markets with less waste will have a direct effect on the
financial wellbeing of the farmers and the communities. Nations can grow the same
amount of food today but can feed more people, as there will be less loss of food
when getting it to the consumer.
Further testing on other crops is required as this experiment has shown marked
benefits of using the GANS plasma solution on seeds.
References:
1. Keshe, M.T., The Origin of the Universe, p13, 2011.
2. Lindlahr, 1914, Memaker 1982, USDA, 1963 and 1997
3. Nutritionsecurity.org
P a g e 28 | 29
Appendix A – Plasma Radish Lab Analysis

P a g e 29 | 29
Appendix B – Plain Radish Lab Analysis