nutritional composition of neglected underutilized green
TRANSCRIPT
Nutritional composition of Neglected Underutilized 1
Green Leafy Vegetables and Fruits in South East Geo-2
Political Zone of Nigeria 3
4
N. N. Umerah1* and N. M. Nnam2 5
6 1Department of Food Science and Technology, Enugu State University of Science and Technology, 7
Nigeria. 8 2Department of Home Science, Nutrition and Dietetics, University of Nigeria, Nsukka, Nigeria 9
ABSTRACT 10 11
Background/Objective: Vegetables and fruits play a highly significant role in food security of the underprivileged in both urban and rural settings. The study was designed to determine the nutritional implication of some neglected underutilized fruits and vegetables in Southeast geopolitical zone of Nigeria. Methodology: The commonly occuring underutilized fruits and vegetables were selected for the study. The food crops were harvested and identified at the Herbarium in the Department of Plant Science and Biotechnology, University of Nigeria Nsukka. Twenty underutilized fruits and vegetables each were cleaned and analysed for nutrients composition using standard methods. Data were presented using descriptive statistics, percentage, mean, standard deviation and frequency. Results: The proximate composition of the fruits ranged from 54.34-80.30 % moisture, 0.27-6.21 % protein, 0-3.08 % fat, 0.28-8.58 % fibre, 0.33-11.05 % ash and 9.08-36.61 % carbohydrate. The ranges for mineral values of the fruits were iron 0.10-9.60 mg, zinc 0.02-10.30 mg, manganese 0.10-6.60 mg and calcium 5.42-46.50 mg. The vitamin contents of the fruits ranged from beta-carotene traces -5666.67 RE, ascorbic acid 0-48.82 mg and vitamin E 0 -11.99 mg. The proximate composition of the vegetables ranged from moisture 60.45-91.00%, protein 0.02-6.60%, fat 0.02-2.19 %, fibre 0.04-5.01 %, ash 0.04-4.20 % and carbohydrate 10.30-36.61 %. The ranges for mineral values of the vegetables were iron 1.40-14.80 mg, zinc trace-9.40 mg, manganese 0.07-4.80 mg and calcium 18.19-400.00 mg. The vitamin levels of the vegetables were beta-carotene 15.20-1933.33 RE, ascorbic acid 2.40-38.40 mg and vitamin E traces - 6.67 mg. Conclusion: The use of these fruits and vegetables should be encouraged particularly in areas where they are not produced through nutrition education in order to promote the food use of these crops.
12 Keywords: Nutritional, composition; underutilized; vegetables and fruits. 13
14
1.INTRODUCTION 15
United Nations Food and Agriculture Organization (1) has widely noted that most widespread 16
and debilitating nutritional disorders, like birth defects, mental and physical retardation, 17
weakened immune systems, blindness and even death has resulted from poor fruits and 18
vegetables consumption habits (2). The ideal strategy to fighting micronutrient deficiency is to 19
improve the diet by including a large variety of food rich in micronutrients and to increase dietary 20
absorption of these nutrients. According to Okigbo (3) while the crisis situation caused by lack of 21
animal foods may require broad and fundamental rethinking about policy and action, traditional 22
foods may be the short term remedy. Micronutrients are found in vegetables and fruits but in a 23
form less easily absorbed unless taken at the same time with enhancers or processed in a way 24

to enhance the absorption of these micronutrients (4). Quite large number of indigenous leafy 25
vegetables and fruits have long been known and reported to have health protecting properties 26
and uses. Vegetables and fruits are important sources of protective substances, which are 27
highly beneficial for the maintenance of good health and prevention of diseases (5; 6). The 28
inclusion of vegetables and fruits in the diets has provided basic nutritional requirements for 29
man. The indigenous knowledge of the health promoting and protecting attributes of vegetables 30
and fruits are clearly linked to their nutritional and non- nutrient bioactive properties. Indigenous 31
fruits and vegetables have long been, and continue to be reported to significantly contribute to 32
the dietary vitamin and mineral intakes of local populations (7). The potassium content of leafy 33
vegetables and fruits are useful in the control of diuretic and hypertensive complications, 34
because it lowers arterial blood pressure. The fiber content also contributes to the feeling of 35
satisfaction and prevents constipation (8). In spite of the body of evidence confirming the 36
nutritional contribution of indigenous vegetables and fruits to local diets, their health 37
maintenance and protective properties, there has been very little concerted effort towards 38
exploiting the biodiverse nutritional and health properties of fruits and vegetables to address 39
the complex food, nutrition and health problems of the society. The ultimate goal of this 40
research was to determine the chemical composition of these underutilized fruits and 41
vegetables which will promote their use as food and consequently improve the nutritional status 42
of both the rural and urban dwellers. 43
2. MATERIALS AND METHODS 44 45
2.1 Study Area/ Study Design 46 47 The study is experimental. 48 49
The study was carried out in South East Nigeria. South east Nigeria lies approximately between 50
4o 30
1 N and 7
o 00
1 N latitude and 6
o 00
1 E and 9
o 00
1 E longitude, located in the mosaic of 51
lowland rainforest and secondary grassland vegetation zone found in some parts of Nigeria. The 52
zone occupies about 50, 000 km2 of Nigeria’s total area of 923 768 km
2. South East zone shares 53
boundary with Cross River in the East, Akwa Ibom, Bayelsa and Rivers in the South, Kogi and 54
Benue in the North and Delta in the West. In South east zone of Nigeria, due to their rich 55
biodiversity, many underutilized indigenous leafy vegetables and fruits of promising nutritional 56
values which can nourish the ever increasing human population exist. 57
58
59
60
61

2.2 Procurement/ Identification of Samples 62 63
A multi stage sampling technique was used to select 20 communities for the study. The samples 64
were harvested in 20 communities in South East Nigeria. The plants harvested were identified at the 65 Herbarium in the Department of Botany, University of Nigeria Nsukka, Nigeria. Some samples were 66 randomly selected and used for further study. 67
68
2.3 Chemical analysis 69
Moisture determination 70
The moisture content of the samples was determined using the air oven method of AOAC (9). 71
Protein determination 72
Crude protein content of the samples was determined using the automated micro-Kjeldahl 73
method as described by AOAC (9). 74
Fat determination 75
The fat content was determined using the Soxhlet extraction method (9). 76
Crude fibre determination 77
The crude fibre content of the samples was determined according to the procedure of AOAC (9). 78
Ash determination 79
The ash content was determined according to the procedure of AOAC (9). 80
Carbohydrate determination 81
Carbohydrate content was calculated by difference. The estimated percentages of crude protein, 82
ash, fat, fibre and moisture was summed up and the value subtracted from 100%. 83
CHO = 100% - % ( protein + fat + ash + fibre + moisture). 84
Mineral determination 85
The mineral contents, namely: Na, K, Ca, Mg, Cu, Mn, Hg and Pb contents were determined by 86
the method described by Pearson (10) using a Pye Unicam SP9 Atomic Absorption 87
Spectrophotometer (AAS) connected to an SP9 computer (Pye Unicam Ltd, York Street, 88
Britain). Total phosphorus was determined by the spectrophotometric molybdovanadate (9). 89
Determination of ß-carotene 90
The extraction of carotenoids was carried out according to the method of Seo et al (11) with 91
slight modifications. 92
Determination of vitamin E profile 93

Vitamin E content was analysed by the method described by Burri (12) using High performance 94
liquid chromatography (HPLC). 95
Vitamin C determination 96
Vitamin C determination by iodine titration as described by Anne Helmenstine was carried out 97
(9). 98
3. RESULTS 99
The list of underutilized vegetables selected for analysis was shown in table 1. 100
The list of underutilized fruits selected for analysis was shown in table 2. 101
The proximate composition of twenty underutilized indigenous vegetables were shown in table 102
3a. The moisture content of these indigenous vegetables ranged from 60.45-91.00% per 100g 103
edible portion, with Bombaceae spp having the highest moisture content and Blinghia unijugata 104
having the least value. The protein content varied from 0.02-6.60% per 100g sample with Ficus 105
elsticoides having the highest protein content. The fat content of the samples ranged from 0.02 in 106
Moraceae spp to 2.19% in Vaccinium parvifolium per 100g sample. The crude fibre contents of 107
the samples ranged from 0.04-5.01%/100g, with Bombaceae spp having the highest crude fibre 108
content. The ash content of the vegetables were between 0.04 in Euphobiaceae spp to 4.20% in 109
Pterocarpus santalinoides while the carbohydrate content of the samples were between 10.30-110
30.49%. 111
The proximate composition of some underutilized fruits were shown in table 3b. The moisture 112
content of these underutilized fruits ranged from 54.34-80.30%, with Phyllanthus debilis having 113
the highest moisture value and Parkia clappatonia having the least value. The protein content 114
varied from 0.27-6.21% with Irvingia gabonensis fruits having the highest protein content. The 115
fat content of the samples ranged from Traces-3.08%. The crude fibre contents of the samples 116
ranged from 0.11-8.58%/100g, with Ficus sur having the highest crude fibre value. The ash 117
content of the fruits were between 0.33-11.05%/100g sample while the carbohydrate contents of 118
the samples were between 9.08-36.61%. All values are on wet weight basis. 119
The mineral composition of the twenty underutilized vegetables were shown in table 4a. The iron 120
content of the underutilized vegetables were between 1.40-11.80mg/100g with psychotria viridis 121

having the highest iron content and Bombaceae spp and Blinghia nitens having the least value. 122
The copper content was highest in Ipomea batata (3.14mg/100g) and lowest in Moraceae spp 123
(0.02mg/100g). The levels for other minerals are zinc (0.00-9.40mg/100g), manganese (0.07-124
4.80mg/100g), calcium (18.19-400.00mg/100g), magnesium (4.38-47.20mg/100g), sodium 125
(0.27-3.01mg/100g), potassium (16.20-104.23mg/100g), and phosphorus (75.40-126
685.60mg/100g). 127
The mineral composition of some underutilized indigenous fruits were shown in table 4b. The 128
iron contents of these underutilized fruits were between 0.10-9.80mg/100g with Vevet tamarind 129
having the highest iron content and Gongronema spp having the least value. The copper content 130
was highest in Gongronema spp (4.06mg/100g) and lowest in Olax viridis (0.00mg/100g). The 131
levels for other minerals are zinc (0.02-10.30mg/100g), manganese (0.10-6.60mg/100g), calcium 132
(5.42-46.50mg/100g), magnesium (0.21-31.82mg/100g), sodium (Trace-6.20mg/100g), 133
potassium (2.43-410.00mg/100g), and phosphorus (1.70-44.66mg/100g). 134
The B-carotene and vitamin composition of some underutilized vegetables were shown in table 135
5a. The beta carotene contents of the underutilized vegetables were between 15.20-1933.33 136
RE/100g sample with Vitex doniana having the highest beta carotene value. The ascorbic acid 137
contents varied between 2.40-38.40mg /100g sample while the vitamin E contents were from 138
Traces-6.67mg/100g sample. 139
The B-carotene and vitamin composition of some underutilized fruits were shown in table 5b. 140
The beta-carotene content of the underutilized fruits ranges from traces of beta-carotene to 141
5666.67RE /100g sample with Cola parchycarpa having the highest beta-carotene value. The 142
ascorbic acid contents varied between 1.20 in Cola gigantean to 48.82mg/100g in Artocarpus 143
altilis edible samples. The vitamin E contents ranged from traces in Olax viridis, Napoleana 144
imperialist and Icacina trichatha olive to 11.99mg/100g in Artocarpus altilis samples. 145
4. DISCUSSION 146
147
4.1 Proximate analysis 148
4.2 Moisture 149
In the study, the moisture content of the underutilized vegetables were between 60.45-150
91.00%/100g sample. The result of the present study is in line with the value reported by Sheela 151
et al. (5) who observed that the moisture content of thirty eight underutilized green leafy 152
vegetables in Southern Karnatala were between the range of 68.00-93.00%. Fasoyiro et al. (13) 153
observed that the moisture content of fruits were from 78.24-84.81%. This falls within the range 154
of values obtained in this study (54.34-80.30%). The high moisture content in these vegetables 155
and fruits were not a surprise as Ene-Obong (14) noted that the most single constituent of fruits 156
and vegetable is water, which accounts for more than 80% of the nutrients. This will result to 157
lower contribution of other proximate components. The high moisture content of these fruits and 158
vegetables indicates that they will not have a long keeping quality. 159
4.3 Protein 160
The protein values (0.02-6.60%) obtained for these vegetables varied. Although vegetables are 161
not good sources of protein, Ficus elsticoides had a high protein level (6.60%). Eyo et al. (15) 162
observed that the protein levels of some vegetables are comparable to those of cereals (7.90%). 163
The high protein content of Ficus elsticoides could be useful in fighting kwashiorkor in 164
communities where protein energy malnutrition is prevalence provided it is consumed in 165
significant quantity. The protein value obtained for the fruits were 0.27-6.21%. Inclusion of 100g 166
portion size of Ficus elsticoides (6.60% protein), Irvingia gabonensis (6.21% protein) and 167
Sterculiar spp (6.04% protein) as shown in the pictorial record to the diet may be capable of 168
providing more than one-fifth of protein which will satisfy the RNI (27g protein) for children 169
(16). 170
4.4 Fat 171
Generally, vegetables and fruits are not good sources of fat. The result of the study confirms this 172
claim (0.02-2.19% fat) for vegetables and (traces-3.08% fat) for fruits. Consumption of these 173
vegetables and fruits may help to reduce high incidence of obesity, diabetes, cardiovascular 174
diseases, high blood pressure, which are associated with high intake of fatty foods. The results of 175
the vegetables were in line with the values reported by Sheela et al. (5) (0.20-2.60%). 176
4.5 Crude fibre 177
The crude fibre levels of the underutilized vegetables (0.04-5.01%/100g) and fruits (0.11-178
8.58%) are of interest. The high fibre contents of Pterocarpus santalinoides (4.30%), Bombaceae 179
spp (5.01%) and Olax viridis (8.58%) could provide bulk in the diet, enhance gastrointestinal 180
function, prevent constipation and may reduce the incidence of metabolic diseases like maturity 181

onset diabetes mellitus and hypercholesterolemia (17). Portion size as shown for 100g of Olax 182
viridis if consumed in a day may provide more than one-third of the (RNI) for fibre which is 18g 183
(18). 184
4.6 Ash 185
Landolfolia dulcis fruit (11.05%) with high ash content suggests that the mineral content of this 186
fruit may be high. The ash levels of foods are an indication of the mineral content of the food. 187
The values (0.60-3.40%) reported by Ajayi et al.(19) as the ash contents of some leafy vegetables 188
studied were within the range of values observed in this study (0.04-4.20%). 189
4.7 Carbohydrate 190
Vegetables and fruits are not major sources of carbohydrates compared to starchy foods, which 191
form the bulk of food eaten. The very low carbohydrate contents of Portulace oleraceae 192
(10.30%), Ficus sur vegetables (11.17%), Phyllanthus debilis (9.08%) and Ficus sur fruit 193
(10.48%) is of interest. This is because low carbohydrate foods are good for people with obesity, 194
high blood pressure and diabetes mellitus challenges. 195
4.8 Vitamins and Beta-carotene 196
4.9 Ascorbate 197
The ascorbic acid values (2.40-38.40mg) for all the vegetables studied were within the range of 198
values (3.00-75.00mg) as observed by Sheela et al. (5) on 28 underutilized vegetables studied in 199
Tanzania. The high ascorbate value for Portulace oleraceae (38.40mg), Artocarpus altilis 200
(48.82mg) and Ficus sur fruit (40.22mg) is of interest. Consumption of adequate quantities of the 201
fruits and vegetables with iron rich foods will enhance the absorption of iron. Ascorbic acid is 202
important in connetive tissue and for proper absorption of iron and calcium. Adequate intake of 203
the fruits and vegetables may assist in the prevention of early death from heart diseases and 204
cancer and may also play a primary role in collagen formation which is essential for the growth 205
and repairs of tissue cells, gums, blood vessels, bones and teeth. Vitamin C is an important 206
antioxidant. The high Vitamin C level in the fruits and vegetables may help to battle against 207
cancer and many degenerative diseases (i.e. Alzheimer’s, Cardiovascular Disease, Diabetes, etc). 208
(20). 209
4.10 Vitamin E 210

The high vitamin E content of some of the fruits and vegetables is desirable. Vitamin E is a 211
powerful antioxidant thus neutralizing free radicals in the body that causes cellular damage. It 212
also contributes to a healthy circulatory system and aids in proper blood clotting and improves 213
wound healing. Some studies have shown that vitamin E decreases symptoms of premenstrual 214
syndrome and certain types of breast disease (21). Artocarpus altilis fruit had 11.99mg/100g 215
vitamin E, Phyllanthus debilis fruit had 8.00mg/100g, while Blighia unijugata vegetables had 216
6.67mg/100g. Portion size as shown for 100g of Artocarpus altilis (11.99mg/100g) and 217
Phyllanthus debilis fruit (8.00mg/100g), could provide half of the daily RNI need of vitamin E 218
for breastfeeding mothers (16.80mg), adult men, women and pregnant women (13.20mg) (22). 219
4.11 Beta-carotene 220
The high beta-carotene levels (15.20-1933.00RE) of the vegetables are not a surprise. Eyo et al. 221
(15) observed that the yellow and green colours of vegetables indicate carotene, which is a 222
precursor of vitamin A. Consumption of 100g of majority of the vegetables studied as shown in 223
the pictorial record (Vitex doniana-1933.33RE, Ficus vogaliana-163333RE, Ceiba pentandra-224
1866.67RE, Pterocarpus santalinoides-1233.33RE, Moraceae spp-450.00RE, Bombaceae spp-225
616.67RE, Blighia unijugata -591.67RE, Brillantaisi nitens- 700.00RE, Vaccinium parvifolium- 226
451.67RE, and Gssampelus mucanta- 701.67RE ) could provide the RNI (400RE) for 227
provitamin A (23). Majority of the fruits (Nauclea diderrichii-1233.33 RE, Spondian mombin-228
2000.00 RE, Vitex doniana-1333.33 RE, Afromomium daniella-566.67 RE, Myristicaceae spp-229
4333.33 RE, Irvingia gabonensis-416.67 RE, Cola parchycarpa-5666.67 RE and Parkia 230
clappatonia-970.67 RE ) have high beta carotene which are higher than the RNI (400RE) for 231
Provitamin A. High level of beta-carotene in some of the vegetables and fruits is particularly 232
important if they are consumed in significant quantity to reduce incidence and severity of 233
respiratory tract infection of which pneumonia is the most serious (24). High consumption of the 234
vegetables and fruits could help to maintain normal vision, promote healthy cell growth, improve 235
iron utilization, gene expression, reproductive system, embryonic development, growth and 236
immune function (25). 237
4.12 Minerals 238
4.13 Iron (Fe) 239

The high iron content of Psychotria viridis (11.80mg), Napoleana imperialist (9.40mg), 240
Hippocretae myrint (9.60mg), Afromomium daniella (8.40mg), Portulace oleraceae (10.50mg), 241
Ficus fur (10.60mg) and Berlinia grandflora (8.80mg) has nutritional significance. The fruits 242
and vegetables with their high ascorbate levels could be useful in the fight against iron 243
deficiency anemia. Vitamin C enhances the absorption of nonheme iron. The ascorbate levels 244
for each of the fruits and vegetables were psychotria viridis (29.90mg), Portulace oleraceae 245
(38.40mg), Hippocretae myrint (22.70mg), Afromomium daniella (14.80mg), Ficus fur 246
(11.60mg) and Berlinia grandflora (11.40mg). Consumption of 100g portion size of psychotria 247
viridis (11.80mg Fe), Napoleana imperialist (9.40mg Fe), Hippocretae myrint (9.60mg Fe), 248
Afromomium daniella (8.40mg Fe), Portulace oleraceae (10.50mg Fe), Ficus fur (10.60mg Fe) 249
and Berlinia grandflora (8.80mg Fe) may provide more than half of the RNI, for iron 250
(12.00mg/day) (26). The result indicated that the iron content of some of the vegetables (1.40-251
11.80mg) were higher than those reported by Nnamani et al. (27) (3.68-7.34mg) and Maundu 252
(28) (0.70-8.90mg) on underutilized vegetables. 253
4.14 Copper (Cu) 254
Copper is not found in large quantity in fruits and vegetables. The values (traces-4.06mg) 255
observed for fruits were in line with the values (0.60-3.80mg) observed by Umran and Nevo (29) 256
on fruits. Decuypene (26) observed that the estimated safe and adequate intake of copper per 257
day is 1.50-3.00mg. Thus including 100g portion size of Cola parchycarpa fruits (2.01mg) and 258
Blinghia unijugata vegetables (2.28mg) in daily diet ensures up to 50% of the daily RNI for 259
copper.Daily consumption of 100g portion size of Gongronema spp (4.06mg) and Ipomea batata 260
(3.14mg) may provide 100% RNI for copper which is an important component of many redox 261
enzymes, including cytochrome oxidase (30). 262
4.15 Zinc (Zn) 263
The zinc contents of the vegetables studied were between 1.30-9.40mg/100g. The zinc levels in 264
the fruits (0.02-10.30mg) were in line with the report of Umran et al. (31) who observed zinc 265
levels of 1.80-9.10 mg on fruits. The zinc levels of Vitex doniana (9.40mg) and Hippocretae 266
myrint (10.30mg) are of interest since plant foods are not major sources of zinc. Lippard and 267
Berg (30) stated that zinc is a trace mineral element that plays a catalytic role in enzymes. The 268

RNI of Zn is 200mg/day. Shankar and Prasad (32) observed that zinc enrichment may be 269
beneficial for health, but excess zinc may interact with Fe and Cu metabolism. Intake of 270
significant quantity of the vegetables with high zinc levels (Vitex doniana (9.40mg) and 271
Hippocretae myrint (10.30mg)) could reduce the duration and severity of diarrhea for infants and 272
young children with acute diarrhea (33). 273
4.16 Manganese (Mn) 274
Consumption of 100g portion size of some of the vegetables and fruits such as Ficus vogaliana 275
(4.80mg), Hippocretae myrint (6.60mg), Icacina trichatha olive (5.40mg), Bombaceae spp 276
(4.30mg), Uvaria chamea (3.60mg), and Daniella olivera (4.02mg) may provide the daily need 277
of manganese in both children and adult which is 2.00-5.00mg and 2.00-3.00mg, respectively 278
(26). The result of the fruits studied (0.10-6.60) were in line with the values reported by Umran 279
et al. (31) on fruits (0.70-5.70mg). Manganese is essential for processing oxygen (30). 280
4.17 Calcium (Ca) 281
Some of the vegetables studied are good sources of calcium. The values observed in this study 282
(18.19-400.00mg) for vegetables and values (5.42-46.50mg) for fruits are of interest. Inclusion 283
of 100g portion size of Brillantaisi nitens (400.00mg), Irvingia gabonensis (30.00mg) 284
Pterocarpus santalinoides (343.40mg), Bombaceae spp (252.00mg), Berlinia grandflora 285
(340.00mg), Ceiba pentandra (261.50mg), Daniella olivera (281.90mg) and Gssampelus 286
mucanta (374.00mg) in daily diet may ensure 100% RNI (250mg calcium) for infants. Adequate 287
intake of fruits and vegetables could help in building the structural frame work of the body, 288
formation of bone, neutralize acidity, clear toxins and help blood stream (34). 289
4.18 Magnessium (Mg) 290
The result showed that some of these fruits and vegetables could provide some health benefits 291
as dietary components because they contain significant quantities of magnesium. Phyllanthus 292
debilis (31.82mg) and Nauclea diderrichii (26.10mg) has significant quantities of Mg. 293
Magnesium is required for processing ATP and related reactions, build bone, cause strong 294
peristalsis, increase flexibility, maintain blood pressure and acid –base balance (34). Magnesium 295
also helps in maintaining proper muscle functioning and keeping the muscles relaxed, helps in 296

absorbing calcium and phosphorus and is very important for proper functioning of the nervous 297
system (35). 298
4.19 Sodium (Na) 299
The sodium levels of the vegetables (0.27-3.01mg) were lower than the values reported by 300
Nnamani et al. (36) (7.00-21.00mg) and Taiyie and Asiebey-Berko (37) (6.44-21.82mg). The 301
values (traces-6.20mg) obtained in the fruits were in line with the values observed by Nevo (38) 302
(0.0-10.00mg) and Musinguzi et al. (39) (1.80-5.00mg) on fruits. Sodium is a very common 303
electrolyte; not generally found in plant foods and the RNI is 200mg/day (34). The ion is very 304
common in food as sodium chloride, or common salt. 305
4.20 Potassium (K) 306
The potassium levels in the vegetables and fruits were 16.20-104.23mg and 2.43-410.00mg, 307
respectively. The following fruits and vegetables had high K levels - Blinghia grandflora 308
(104.23mg), Hippocretae myrint (281.00mg), Napoleana imperialist (110.00mg), Spondian 309
mombin (260.00mg),Vitex doniana (130.00mg), Afromomium daniella (198.00mg), Cola 310
gigantean (110.00mg), Olax viridis (240.00mg), Phyllanthus debilis (270.00mg), Sterculia spp 311
(180.00mg), Myristicaceae spp (156.00mg), Ficus sur (126.00mg), Landofolia dulcis 312
(210.00mg), Parkia clappatonia (220.00mg), Gongronema spp (192.00mg), Irvingia gabonensis 313
(410.00mg). Intake of significant quantities of the fruits and vegetables may be useful in 314
performing the functions of potassium in the body. Potassium is a common electrolyte that is 315
required for keeping the heart, brain, kidney, muscle tissues and other important organs of the 316
human body in good condition. It works in association with sodium to perform a number of 317
critical body tasks (40). 318
4.21 Phosphorus (P) 319
The vegetables studied are good sources of phosphorus (75.40-685.60mg). The values 320
determined in this study were higher than the values observed by Taiye and Asiebey-Berko (37) 321
(9.42-48.95mg); Nnamani et al. (41) (37.00-57.00mg). The RNI for phosphorus is 200mg/day. 322
Consumption of 100g of some of the vegetables like Boerhavia diffusa (685.60mg), Ipomea 323
batata (257.20mg), Ficus elsticoides (375.40mg), Berlinia grandflora (363.22mg ), Vitex 324
doniana (602.00mg), Vaccinium parvifolium (339.12mg) and Ficus fur (444.25mg) would be 325
able to meet up with the RNI for phosphorus. Phosphorus is required to build healthy bones and 326
it is essential for energy metabolism (41). 327
6 Conclusion 328
The result of the study showed that Phyllanthus debilis is a good source of minerals especially 329
magnesium and calcium. Some of the fruits and vegetables like psychotria viridis, Napoleana 330
imperialist, Hippocretae myrint, Afromomium daniella, Portulace oleraceae, Ficus fur and 331
Berlinia grandflora are good sources of iron. The vegetables could be useful in dietary 332
formulations to fight iron deficiency anaemia. This important attribute of the vegetables should 333
be explored. Vitex doniana and Hippocretae myrint are rich in zinc despite the fact that plant 334
foods are not good sources of zinc. The high protein levels of some of the fruits and vegetables 335
like Ficus elsticoides, Irvingia gabonensis and Sterculiar spp suggest that they could be used in 336
dietary formulation or in supplementing low protein foods in the diet. 337
Vitex doniana, Ficus vogaliana, Ceiba pentandra, Pterocarpus santalinoides, Moraceae spp, 338
Bombaceae spp, Blighia unijugata, Brillantaisi nitens, Vaccinium parvifolium, Gssampelus 339
mucanta, Nauclea diderrichii, Spondian mombin, Vitex doniana fruits, Afromomium daniella, 340
Myristicaceae spp, Irvingia gabonensis pulp, Cola parchycarpa and Parkia clappatonia has high 341
levels of beta carotene. Consumption of the vegetables and fruits in adequate quantity could help 342
to alleviate the problems associated with vitamin A deficiency. Portulace oleraceae, Artocarpus 343
altilis and Ficus sur fruit are high in ascorbate which is a powerful antioxidant that could help 344
fight degenerating diseases. If the vegetables and fruits are consumed with iron rich foods, the 345
high ascorbate level will facilitate iron absorption. Artocarpus altilis fruit, Phyllanthus debilis 346
fruit, and Blighia unijugata vegetables are rich in vitamin E which is a common antioxidant. 347
348
349
350
351
352
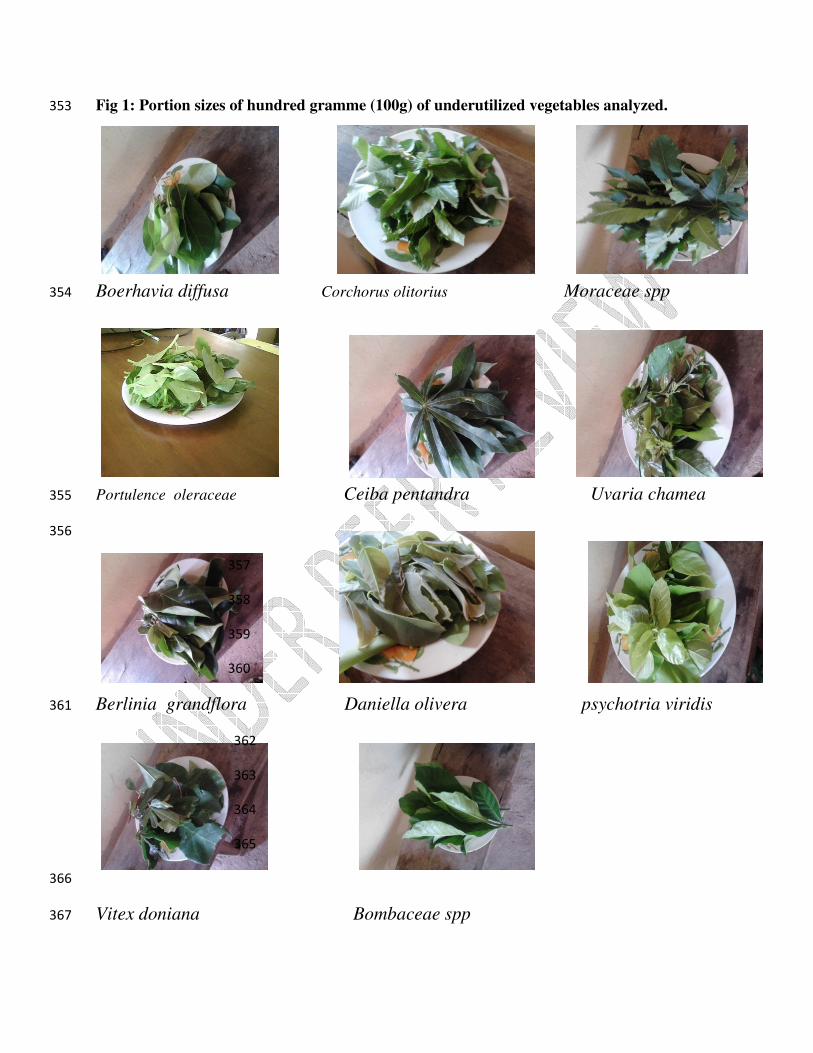
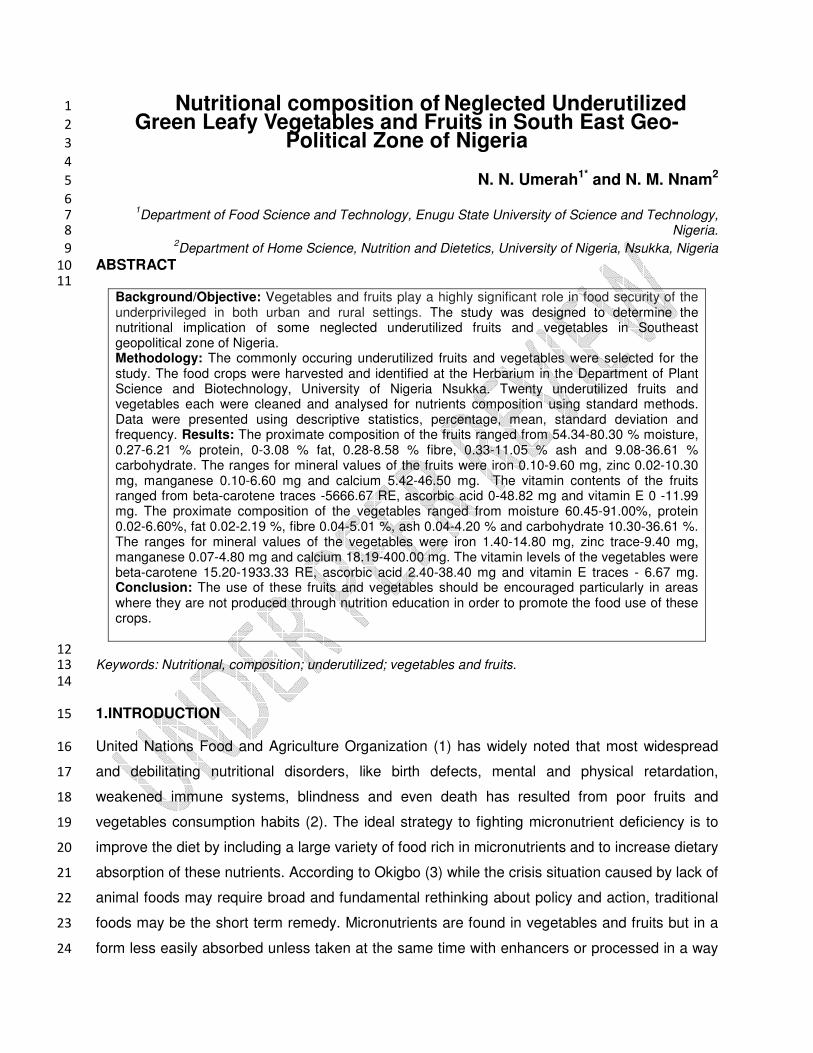
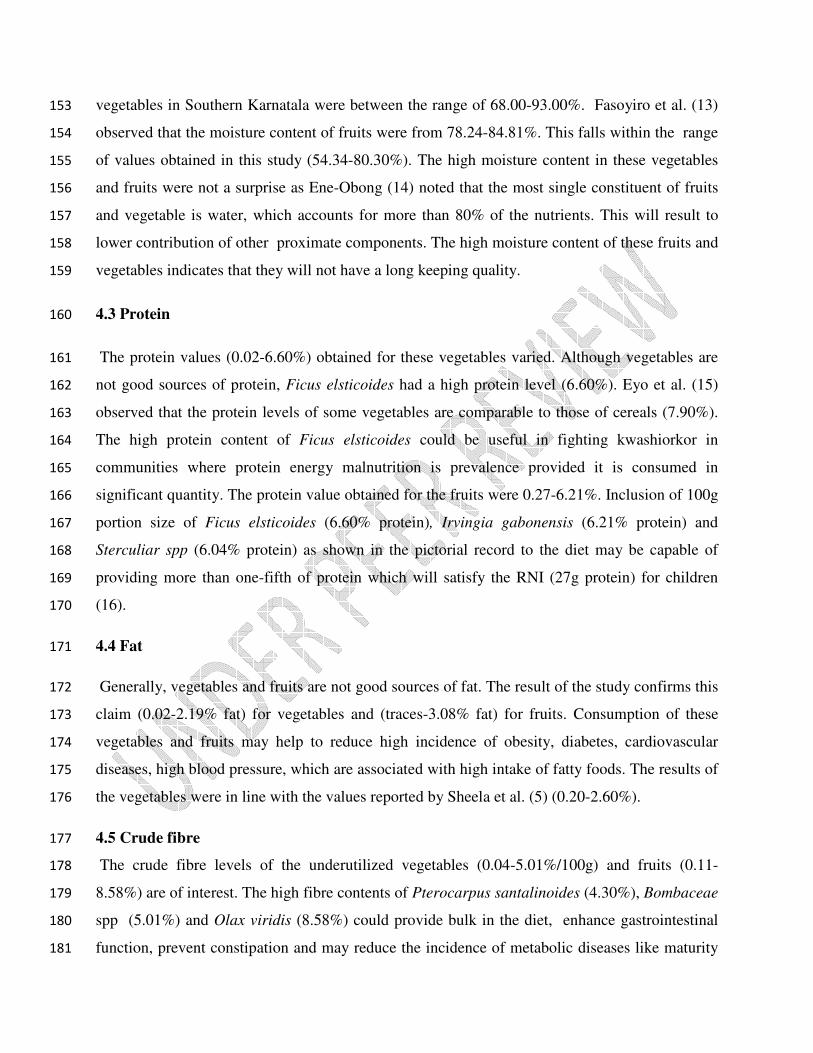
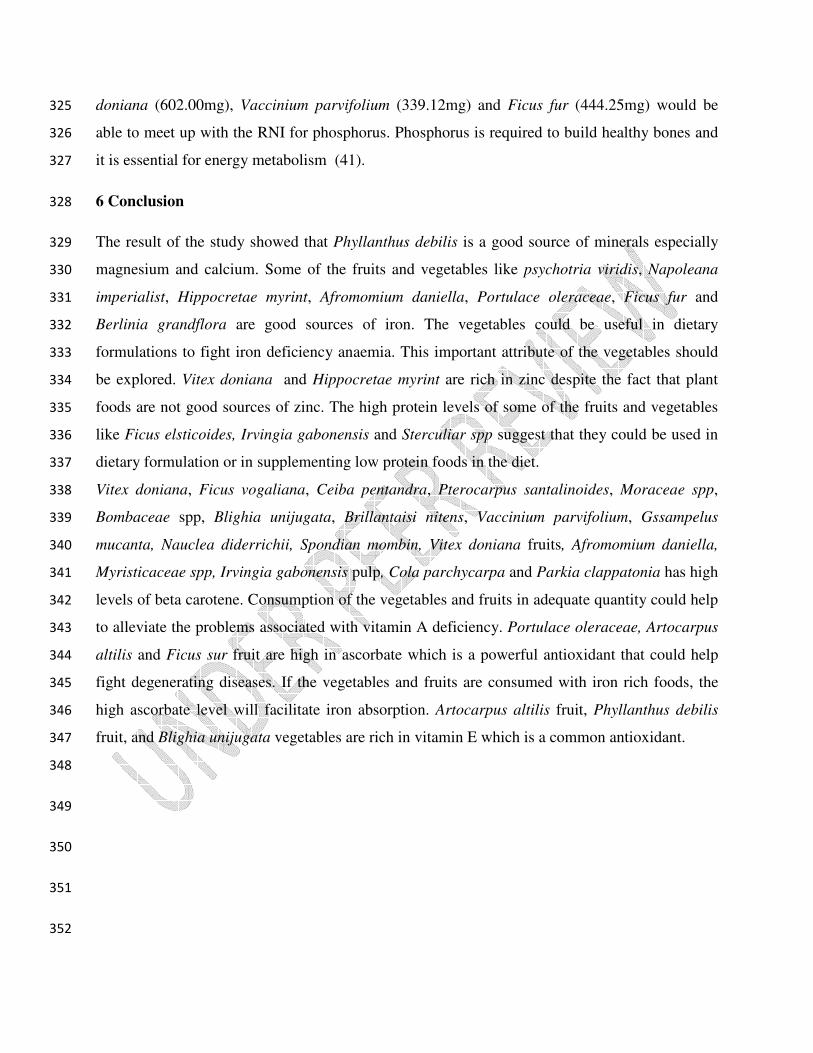
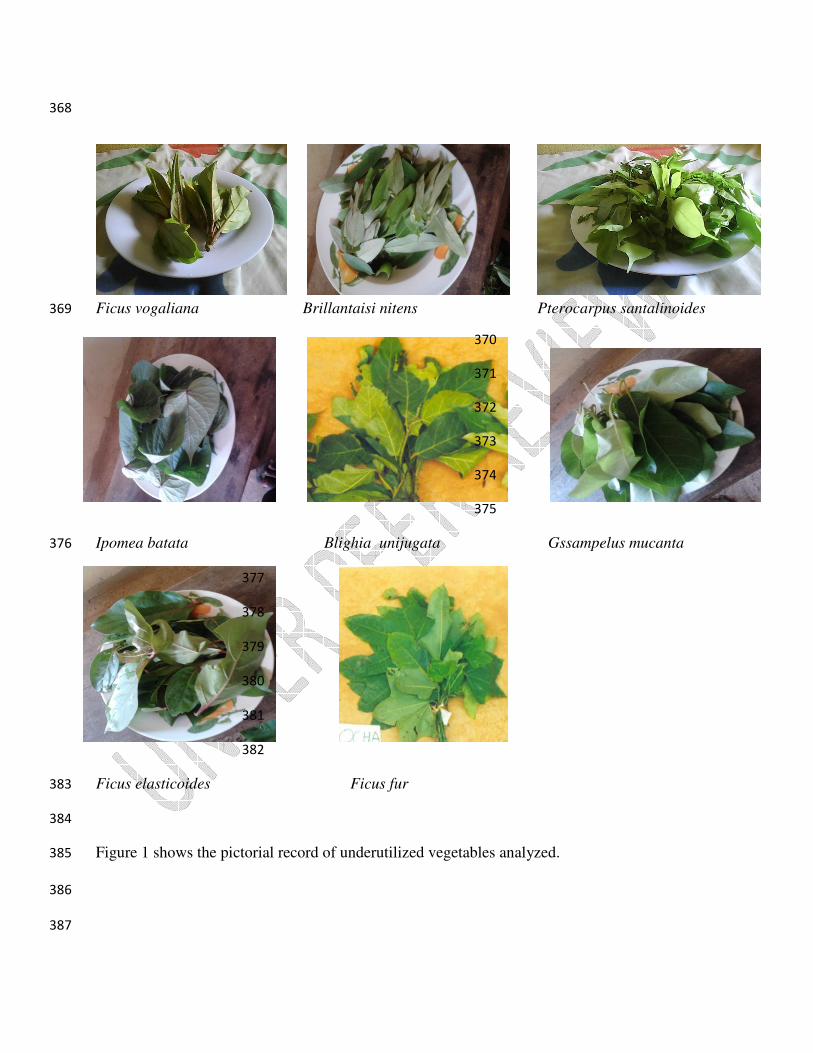
Fig 1: Portion sizes of hundred gramme (100g) of underutilized vegetables analyzed. 353
Boerhavia diffusa Corchorus olitorius Moraceae spp 354
Portulence oleraceae Ceiba pentandra Uvaria chamea 355
356
357
358
359
360
Berlinia grandflora Daniella olivera psychotria viridis 361
362
363
364
365
366
Vitex doniana Bombaceae spp 367
368
Ficus vogaliana Brillantaisi nitens Pterocarpus santalinoides 369
370
371
372
373
374
375
Ipomea batata Blighia unijugata Gssampelus mucanta 376
377
378
379
380
381
382
Ficus elasticoides Ficus fur 383
384
Figure 1 shows the pictorial record of underutilized vegetables analyzed. 385
386
387

Fig 3: Portion sizes of hundred grammes (100g) of the underutilized fruits analyzed. 388
Velvet tamarind Afromomium daniella Parkia clappatonia Artocarpus altilis Sterculiar spp 389
390
391
392
Phyllanthus debilis Irvingia gabonensis Myristicaceae spp Olax viridis 393
394
395
396
397
Cola parchycarpa Hippocretae myrint Cola gingatean Landolfolia dulcis 398
399
400
Napoleana imperialist Spondian mombin Ficus sur Nauclea diderrichii 401
402 Icacina trichatha olive 402 Gongronema spp 402
403
404
Figure 3 shows the pictorial record of underutilized fruits analyzed. 405
406

Table 1: List of underutilized vegetables randomly selected for analysis. 407
Common name Igbo name Scientific name
Vegetable
Fig tree
Ogbu ike
Ficus elasticoides
Hog weed Azuigwe Boerhavia diffusa
- Ogbu Ficus vogaliana
Black plum Uchakiri Vitex doniana
- Uturukpa Pterocarpus santalinoides
_ Anyazu psychotria viridis
Water leaf Ntioke Portulace oleraceae
- Agba Daniella olivera
Jute Arira/Elegule Corchorus olitorius
- Akwokwo akpu Ceiba pentandra
__ Okwuruezikemba Moraceae spp
_ Ogwuazu Bombaceae spp
_ Okpokuko Uvaria chamea
_ Akuokoro Ficus fur
_ Ububa Berlinia grandflora
Akee/Ackee Uso Blighia unijugata
Huckleberry Ewa Vaccinium parvifolium
_ Obuako-enwe Gssampelus mucanta
_ Agbolu-uku Brillantaisi nitens
Potato leaves Akwukwo ji nnu Ipomea batata
408
409

Table 2: List of fruits randomly selected for analysis. 410
Common name
Fruits
Igboname
Scientific name
Hog plum Echikara Spondian mombin
Black plum Mbembe Vitex doniana
- Icheku Velvet tamarind
- Osisiike/Karagu Myristicaceae spp
_ Urumbia Icacina trichatha olive
_ Mkpuruamunwaebule Hippocretae myrint
_ Aku okoro Ficus sur
_ Ose ohia Afromomium daniella
_ Uvuru Nauclea diderrichii
_ Uvurunwamkpi Artocarpus altilis
White rubber vine Utu Landolfolia dulcis
West African locust bean Nkpuru ugba Parkia clappatonia
_ Achicha Cola parchycarpa
Bush mango Ujuru Irvingia gabonensis
_ Oji-eyi Cola gingatean
_ Osenga Olax viridis
_ Aodo Gongronema spp
Gooseberry Akpuru Phyllanthus debilis
_ Nkwukpo Sterculiar spp
_ Odure Napoleana imperialist

Table 3a: Proximate composition of some underutilized vegetables on wet weight basis (%). 411
Scientific Name Moisture Protein Fat Fibre Ash CHO
Vitex doniana 64.10±0.01 5.20±0.59 2.10±0.00 0.40±0.11 1.60±0.21 26.60±0.88
Ficus elasticoides 68.80±0.07 6.60±0.06 0.70±0.08 2.10±0.13 2.90±0.12 18.90±0.26
Corchorus olitorius 70.20±0.10 3.30±0.03 0.80±0.53 1.00 ±0.20 1.80±0.70 17.90±0.15
Ficus vogaliana 61.60±0.03 2.80 ±0.01 0.40±0.00 2.80±0.15 3.70±0.11 28.70±0.13 Ceiba pentandra 69.70±0.23 2.70±0.02 0.10±0.00 1.20± 0.60 0.90±0.0.30 25.40±0.04
Portulace oleraceae
Berlinia grandflora
80.20±0.05
74.20±0.23
4.80±0.06
1.22±0.02
0.10±0.00
1.27±0.64 1.20±0.04
1.92± 0.60
1.40± 0.21
1.75±0.30
10.30±0.21
19.64±0.04
Boerhavia diffusa
Blinghia unijuta
65.90±0.07
60.45±0.05
3.60±0.15
4.27±0.06
0.20±0.02
1.45±0.81
1.60±0.18
3.22±0.04
2.40± 0.12
3.13± 0.21
21.30±0.56
27.48±0.21
Daniella olivera 71.10±0.04 3.90±0.01 0.40±0.04 1.70 ±0.01 0.90±0.73 18.00±0.15
Brillantaisi nitens 61.05±0.07 5.27±0.15 0.20±0.02 2.22±0.18 0.77±0.12 30.49±0.56
Vaccinium parvifolium 77.00±0.04 1.00±0.01 2.19±0.04 0.12 ±0.01 2.78±0.73 16.91±0.15
Pterocarpus santalinoides 60.80±0.04 4.20±0.05 0.40±0.08 4.30±0.02 4.20±0.90 26.10±0.31
psychotria viridis 66.40±0.14 1.40± 0.09 1.30±0.02 0.60±0.50 1.80±0.40 23.50±0.18
Moraceae spp 66.00±0.01 3.03±0.59 0.02±0.00 2.11±0.11 3.54±0.21 25.30±0.88
Bombaceae spp 91.00±0.07 0.02±0.06 0.90±0.08 5.01±0.13 0.92±0.12 2.15±0.26
Uvaria chmea 72.24±0.10 2.07±0.03 0.78±0.53 0.78 ±0.20 2.44±0.70 21.86±0.15
Ficus sur
Ipomea batata
Gssampelus mucanta
84.22±0.03
68.12±0.14
80.23±0.04
0.22±0.01
2.12± 0.09
0.48±0.05
2.11±1.00
0.41±0.02
0.62±0.08
0.04±0.01
2.10±0.50
1.16±0.02
2.24±0.11
0.04±0.00
1.11±0.90
11.17±0.13
27.21±0.18
16.40±0.31
Mean±Standard deviation
412
413
414

Table 3b: Proximate composition of some underutilized fruits on wet weight basis (%/). 415
ScientificName Moisture Protein Fat Fibre Ash CHO
Hippocretae myrint 72.40±0.09 0.30±0.10 0.10±0.09 0.28±0.66 0.55±0.74 26.37±0.30
Nauclea diderrichii 59.70±0.04 1.01±0.01 0.41±1.04 1.47±0.27 0.80±0.29 36.61±0.22
Icacina trichatha olive 73.50±0.40 0.90±0.06 0.37±0.43 0.11±0.03 0.73±0.30 24.39±0.63
Myristicaceae spp 60.90±0.63 1.20±0.21 0.52±0.36 0.93±0.80 0.68±0.75 35.77±0.35
Artorcarpus altilis 61.15±0.01 3.00±0.59 0.46±0.00 7.94±0.11 6.84±0.21 20.61±0.88
Landolfolia dulcis 70.40±0.07 2.08±0.06 1.52±0.08 1.48±0.13 11.05±0.12 13.47±0.26
Cola parchcarpa 59.27±0.03 4.57 ±0.01 1.03±1.00 3.67±0.15 5.72±0.11 25.74±0.13
Gongranema spp 75.40±0.23 2.60±0.02 Trace 1.38± 0.60 0.66±0.0.30 19.96±0.04
Irvingia gabonensis 67.42±0.05 6.21±0.06 1.65±0.81 7.80±0.04 4.80± 0.21 12.12±0.21
Olax viridis 73.10±0.33 0.72±0.71 0.39±0.01 0.39±0.10 0.71±0.52 25.08±0.44
Napoleana imperialist 70.90±0.28 0.70± 0.03 0.31±0.24 0.40±0.11 0.39±0.47 27.30 ±0.12
Parkia clappatonia 54.34±0.10 3.02±0.03 3.08±0.53 2.74 ±0.20 3.91±0.70 32.91±0.15
Afromomium daniella 71.30±0.36 0.27±0.07 0.27±0.26 1.01±0.60 0.65±0.78 26.50±0.16
Vevet tamarind 72.80±0.50 0.31±0.03 0.47±0.49 0.36±0.09 0.44±0.83 25. 62±0.53
Cola gigantean 71.02±0.04 2.11±0.01 2.38±0.04 1.17 ±0.01 0.33±0.73 22.99±0.15
Ficus sur 63.85±0.04 5.52±0.05 2.05±0.08 8.58±0.02 9.52±0.90 10.48±0.31
Phyllanthus debilis 80.30±0.14 3.42± 0.09 2.00±0.02 4.20±0.50 1.00±0.40 9.08±0.18
Spondian mombin 67.20±0.30 1.20±0.20 0.20± 0.06 2.02±0.02 3.00±0.62 26.38±0.74
Vitex doniana 61.70±0.04 1.30±0.30 2.50 ±0.41 0.76 ±0.06 2.79±0.13 30.95 ±0.0
Sterculia spp 68.92±0.07 6.04±0.15 1.46±0.02 5.27±0.18 3.36± 0.12 14.95±0.56 Mean±Standard deviation 416
417
418
419
420
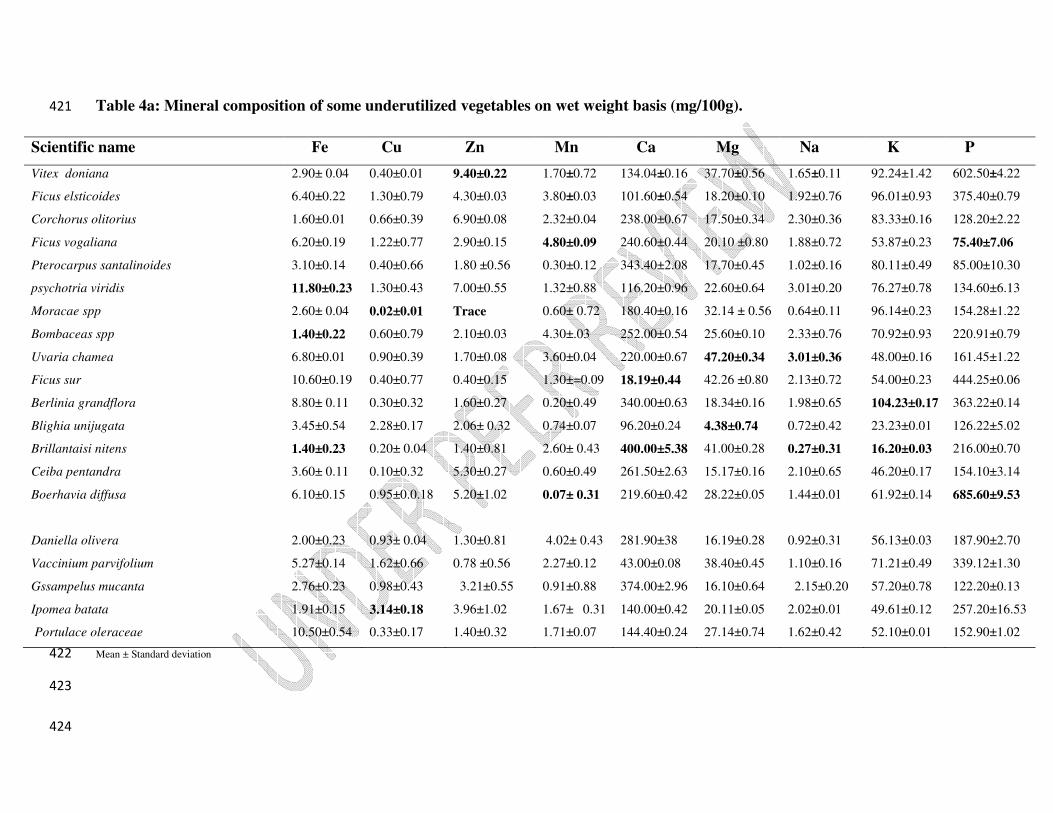
Table 4a: Mineral composition of some underutilized vegetables on wet weight basis (mg/100g). 421
Scientific name Fe Cu Zn Mn Ca Mg Na K P
Vitex doniana 2.90± 0.04 0.40±0.01 9.40±0.22 1.70±0.72 134.04±0.16 37.70±0.56 1.65±0.11 92.24±1.42 602.50±4.22
Ficus elsticoides 6.40±0.22 1.30±0.79 4.30±0.03 3.80±0.03 101.60±0.54 18.20±0.10 1.92±0.76 96.01±0.93 375.40±0.79
Corchorus olitorius 1.60±0.01 0.66±0.39 6.90±0.08 2.32±0.04 238.00±0.67 17.50±0.34 2.30±0.36 83.33±0.16 128.20±2.22
Ficus vogaliana 6.20±0.19 1.22±0.77 2.90±0.15 4.80±0.09 240.60±0.44 20.10 ±0.80 1.88±0.72 53.87±0.23 75.40±7.06
Pterocarpus santalinoides 3.10±0.14 0.40±0.66 1.80 ±0.56 0.30±0.12 343.40±2.08 17.70±0.45 1.02±0.16 80.11±0.49 85.00±10.30
psychotria viridis 11.80±0.23 1.30±0.43 7.00±0.55 1.32±0.88 116.20±0.96 22.60±0.64 3.01±0.20 76.27±0.78 134.60±6.13
Moracae spp 2.60± 0.04 0.02±0.01 Trace 0.60± 0.72 180.40±0.16 32.14 ± 0.56 0.64±0.11 96.14±0.23 154.28±1.22
Bombaceas spp 1.40±0.22 0.60±0.79 2.10±0.03 4.30±.03 252.00±0.54 25.60±0.10 2.33±0.76 70.92±0.93 220.91±0.79
Uvaria chamea 6.80±0.01 0.90±0.39 1.70±0.08 3.60±0.04 220.00±0.67 47.20±0.34 3.01±0.36 48.00±0.16 161.45±1.22
Ficus sur 10.60±0.19 0.40±0.77 0.40±0.15 1.30±=0.09 18.19±0.44 42.26 ±0.80 2.13±0.72 54.00±0.23 444.25±0.06
Berlinia grandflora 8.80± 0.11 0.30±0.32 1.60±0.27 0.20±0.49 340.00±0.63 18.34±0.16 1.98±0.65 104.23±0.17 363.22±0.14
Blighia unijugata 3.45±0.54 2.28±0.17 2.06± 0.32 0.74±0.07 96.20±0.24 4.38±0.74 0.72±0.42 23.23±0.01 126.22±5.02
Brillantaisi nitens 1.40±0.23 0.20± 0.04 1.40±0.81 2.60± 0.43 400.00±5.38 41.00±0.28 0.27±0.31 16.20±0.03 216.00±0.70
Ceiba pentandra 3.60± 0.11 0.10±0.32 5.30±0.27 0.60±0.49 261.50±2.63 15.17±0.16 2.10±0.65 46.20±0.17 154.10±3.14
Boerhavia diffusa 6.10±0.15 0.95±0.0.18 5.20±1.02 0.07± 0.31 219.60±0.42 28.22±0.05 1.44±0.01 61.92±0.14 685.60±9.53
Daniella olivera 2.00±0.23 0.93± 0.04 1.30±0.81 4.02± 0.43 281.90±38 16.19±0.28 0.92±0.31 56.13±0.03 187.90±2.70
Vaccinium parvifolium 5.27±0.14 1.62±0.66 0.78 ±0.56 2.27±0.12 43.00±0.08 38.40±0.45 1.10±0.16 71.21±0.49 339.12±1.30
Gssampelus mucanta 2.76±0.23 0.98±0.43 3.21±0.55 0.91±0.88 374.00±2.96 16.10±0.64 2.15±0.20 57.20±0.78 122.20±0.13
Ipomea batata
Portulace oleraceae
1.91±0.15
10.50±0.54
3.14±0.18
0.33±0.17
3.96±1.02
1.40±0.32
1.67± 0.31
1.71±0.07
140.00±0.42
144.40±0.24
20.11±0.05
27.14±0.74
2.02±0.01
1.62±0.42
49.61±0.12
52.10±0.01
257.20±16.53
152.90±1.02
Mean ± Standard deviation 422
423
424

Table 4b: Mineral composition of some underutilized fruits on wet weight basis (mg/100g). 425
Scientific name Fe Cu Zn Mn Ca Mg Na K p
Hippocretae myrint 9.60±0.16 0.03±0.00 10.30±0.04 6.60±0.20 13.04±0.02 3.00±0.03 1.00±0.03 281.00±6.18 20.00±0.93
Nauclea diderrichii 4.80±0.29 0.02±0.00 1.70±0.03 2.80±0.18 9.20±0.11 26.10±0.13 3.00±0.01 60.00±0.17 9.00±0.83
Icacina trichatha olive 2.10±0.11 0.04±0.01 2.80±0.21 5.40±0.47 20.70±0.03 10.40±0.14 3.00± 0.19 29.42±0.08 13.00±0.42
Napoleana imperialist 9.40±0.43 0.02±0.01 0.60±0.13 0.30±0.07 28.10±0.08 9.60±0.10 3.00±0.55 110.00±2.08 21.00±0.40
Spondian mombin 2.12±0.22 0.01±0.00 6.03±0.09 3.10±0.11 17.91±0.10 15.00±0.06 4.50±0.18 260.00±4.14 39.00±0.02
Vitex doniana 3.40±0.35 0.12±0.01 4.40±1.04 2.61±0.24 12.16±0.06 9.27±0.41 4.00±0.26 130.00±0.49 19.00±0.01
Afromomium daniella 8.40±0.09 0.01±0.00 0.40±0.04 0.10±0.03 17.20±0.03 2.04±0.15 Trace 281.00±3.04 14.00±0.05
Vevet tamarind 9.80±0.27 0.04±0.03 8.60±0.11 0.50±0.02 14.71±0.06 18.12±0.07 1.55±0.05 198.00±0.01 18.00±0.21
Irvingia gabonensis 2.00±0.54 0.30±0.17 2.20± 0.32 1.21±0.07 30.00±0.24 3.00±0.74 6.20±0.42 410.00±1.01 1.70±0.02
Cola gingatean 1.70±0.23 0.04± 0.01 0.10±0.00 0.32± 0.43 27.00±0.38 8.64±0.28 1.17±0.31 110.00±0.03 12.34±0.70
Ficus sur 1.43±0.14 0.02±0.66 1.29 ±0.56 2.27±0.12 31.20±0.08 3.25±0.45 1.61±0.16 240.00±1.49 39.42±0.30
Phyllanthus debilis 3.20±0.23 1.00±0.43 0.20±0.55 0.42±0.08 46.50±0.96 31.82±0.64 0.20±0.20 270.00±0.78 37.10±0.13
Sterculiar spp 1.04±0.15 Trace 0.42±0.02 0.11± 0.01 22.50 ±0.42 18.03±0.05 2.00±0.01 180.00±0.14 20.13±0.53
Myristicaceae spp 6.40±0.59 0.04±0.02 2.30±0.35 4.40±0.74 19.09±0.17 14.72±0.14 2.00±0.11 156.00±0.18 12.00±0.19
Olax viridis 3.60±0.35 0.00 0.10±0.61 0.30±1.09 18.47±0.22 12.88±0.56 1.00±0.40 126.00±0.60 14.00±0.26
Artocarpus altilis 4.76± 0.04 0.02±0.01 1.42±0.22 3.17± 0.72 11.30±0.16 4.60 ± 0.56 2.17±0.11 2.43±0.23 11.46±0.22
Landolfolia dulcis 3.85±0.22 0.03±0.01 0.02±0.03 0.98±.03 5.42±0.54 3.02±0.10 1.80±0.76 210.00±0.93 3.85±0.79
Parkia clappatonia 2.90±0.01 0.06±0.03 0.80±0.08 0.40±0.04 18.00±0.67 0.21±0.04 3.70±0.36 220.00±0.16 28.21±0.22
Cola parchycarpa 3.40±0.19 2.01±0.77 1.82±0.15 1.38±=0.09 32.10±0.44 1.71 ±0.80 4.12±0.72 96.00±0.23 6.79±0.06
Gongronema spp 0.10± 0.02 4.06±0.32 2.43±0.27 1.72±0.49 9.96±0.63 16.63±0.16 4.47±0.65 192.00±0.17 44.66±0.14
Mean ± Standard deviation 426
427

Table 5a: ßeta-carotene and Vitamin composition of some underutilized vegetables on wet 428
weight basis. 429
Scientific name
ß-carotene
(RE)
VitaminC
(mg)
VitaminE
(mg)
Vitex doniana 1933.33±21.59 12.10±0.35 0.96±0.11
Ficus elsticoides 15.20±0.29 32.90±0.09 0.11±0.01
Corchorus olitorius 16.00±0.35 3.60±0.02 1.92±0.76
Ficus vogaliana 1633.33±8.74 6.50±1.00 1.24±0.40
Ceiba pentandra 1866.67±18.17 12.20±0.26 3.11±0.01
Portulace oleraceae 31.20±0.14 38.40 ± 0.62 2.10±0.46
Daniella olivera 22.40±0.11 3.04±0.14 0.87±0.19
Pterocarpus santalinoides 1233.33±6.18 11.20 ±0.22 2.41±0.02
psychotria viridis 25.67±0.01 29.90±0.14 2.63±0.56
Boerhavia diffusa 1366.67± 0.19 16.10 ±0.60 1.86±0.08
Moraceae spp 450.00±0.59 2.40±0.35 Trace
Bombaceae spp 6161.67±1.29 12.80±0.09 1.24±0.91
Uvaria chemea 200.00±0.35 14.30±0.02 0.08±0.06
Ficus sur 356.67±2.74 11.60±1.00 0.67±0.40
Blinghia unijugata 591.67±1.14 4.12 ± 0.62 6.67±0.46
Brillantaisi nitens 700.00±0.11 14.20±0.14 1.12±0.19
Vaccinium parvifolium 451.67±2.18 5.27 ±0.22 3.25±0.02
Gssampelus mucanta 266.83±0.01 19.60±0.14 4.98±0.56
Ipomea batata 701.67± 0.19 8.67 ±0.60 5.57±0.08
Berlinia grandflora 356.67±1.17 11.40±0.26 3.36±0.01 Mean±Standard deviation 430
431
432
433
434
435
436
437
438
439

Table 5b: ßeta-carotene and Vitamin composition of some underutilized fruits on wet 440
weight basis. 441
Scientific name VitaminC
(mg)
VitaminC
(mg)
B-carotene
(RE)
Hippocretae myrint 22.70±0.09 22.70±0.09 Trace
Nauclea diderrichii 13.40±0.05 13.40±0.05 1233.33±6.62
Icacina trichatha olive 4.90±0.42 4.90±0.42 16.67±0.94
Napoleana imperialist 3.80±0.14 3.80±0.14 Trace
Spondian mombin 9.30±0.07 9.30±0.07 2000.00±9.71
Vitex doniana 14.29±0.03 14.29±0.03 1333.33±0.76
Afromomium daniella 14.80±0.01 14.80±0.01 566.67±0.73
Vevet tamarind 8.60±0.16 8.60±0.16 Trace
Myristicaceae spp 14.90±0.07 14.90±0.07 4333.33±11.03
Olax viridis 2.40± 0.11 2.40± 0.11 16.67± 0.09
Artocarpus altilis 48.82±0.35 48.82±0.35 199.83±4.59
Irvingia gabonensis 35.80 ± 0.62 35.80 ± 0.62 416.67±2.14
Cola gigantean 1.20±0.14 1.20±0.14 46.67±0.11
Ficus sur 40.22 ±0.22 40.22 ±0.22 665.00±1.18
Phyllanthus debilis 14.26±0.14 14.26±0.14 141.67±0.01
Sterculia spp
13.68 ±0.60 13.68 ±0.60 60.00± 0.19
Landolfolia dulcis 17.40±0.09 17.40±0.09 48.33±0.29
Parkia clappatonia 18.90±0.02 18.90±0.02 970.67±1.35
Cola parchycarpa 11.61±1.00 11.61±1.00 5666.67±2.74
Gongronema spp 14.48±0.26 14.48±0.26 17.5±0.17 Mean ± Standard deviation 442
443
444
5. CONCLUSION 445
446
The result of the study showed that Phyllanthus debilis is a good source of minerals especially 447
magnesium and calcium. Some of the fruits and vegetables like psychotria viridis, Napoleana 448
imperialist, Hippocretae myrint, Afromomium daniella, Portulace oleraceae, Ficus fur and 449
Berlinia grandflora are good sources of iron. The vegetables could be useful in dietary 450
formulations to fight iron deficiency anaemia. This important attribute of the vegetables should 451
be explored. Vitex doniana and Hippocretae myrint are rich in zinc despite the fact that plant 452

foods are not good sources of zinc. The high protein levels of some of the fruits and vegetables 453
like Ficus elsticoides, Irvingia gabonensis and Sterculiar spp suggest that they could be used in 454
dietary formulation or in supplementing low protein foods in the diet. 455
Vitex doniana, Ficus vogaliana, Ceiba pentandra, Pterocarpus santalinoides, Moraceae spp, 456
Bombaceae spp, Blighia unijugata, Brillantaisi nitens, Vaccinium parvifolium, Gssampelus 457
mucanta, Nauclea diderrichii, Spondian mombin, Vitex doniana fruits, Afromomium daniella, 458
Myristicaceae spp, Irvingia gabonensis pulp, Cola parchycarpa and Parkia clappatonia has high 459
levels of beta carotene. Consumption of the vegetables and fruits in adequate quantity could help 460
to alleviate the problems associated with vitamin A deficiency. Portulace oleraceae, Artocarpus 461
altilis and Ficus sur fruit are high in ascorbate which is a powerful antioxidant that could help 462
fight degenerating diseases. If the vegetables and fruits are consumed with iron rich foods, the 463
high ascorbate level will facilitate iron absorption. Artocarpus altilis fruit, Phyllanthus debilis 464
fruit, and Blighia unijugata vegetables are rich in vitamin E which is a common antioxidant. 465
466
REFERENCE 467
1 FAO. United Nations Food and Agriculture Organization.(2005) Increasing fruit and 468
vegetable consumption becomes a global priority. Available from: 469
http://fao.org/english/newsroom/focus/2003/fruitveg1.htm. 470
2 Mwangi, S. & Mumbi, K.( 2006) African leafy vegetables evolves from underutilized 471
species to commercial cash crops.Research Workshop on Collective Action and Market Access 472
for Smallholders (www.afri.veg/res). 473
3 Okigbo, B.N. (1986). Broadening the food base in Africa: The potentials of traditional food 474
plants. Food and Nutr.12: 1 FAO/UN. 475
4 World Bank (1994). Enriching lives: Overcoming Vitamins and Mineral malnutrition. In 476
Developing Countries (http/nut.jorn.org). 477
5 Sheela, K.., Kamal, G., Nath, D., Vijayalakshmi, G. M., Yankanchi & Roopa, B. P. (2004). 478
Proximate Composition of Underutilized Green LeafyVegetables in Southern Karnataka. 479
Journal of Human Ecology, 15(3), 227-229. 480
6 Nnamani, C.V., Oselebe, H.O & Okporie, E.O. (2007). Ethnobotany of Indigenous Leafy 481
Vegetables of Izzi Clan, in Ebonyi State, Nigeria. In:Proceeding of 20th Annual National 482
Conference of Biotechnology Society of Nigeria. Abakaliki, November 14th-17th, 111-114. 483

7 Oboh, G. & Akindahunsi , A. A.(2004). Change in ascorbic acid, total phenol and 484
antioxidant activity of sun-dried commonly consumed green leafy vegetables in Nigeria. 485
Nutrition. & Health, 18, 29-36. 486
8 Noonan, S.C. & Savage, G.P. (1999). Oxalate content of foods and Its effect on humans. 487
Asia Pactific. Journal of Clinical Nutrition, 67,64-74. 488
9. AOAC (2000). Association of Official Analytical Chemist. Official methods of Analysis, 489
Washington, D.C 490
10. Pearson, I.O. (1976). Fundamental of Food Biochemistry, 2nd
ed., Atlanta, Georgia, 30322 491
USA (www.en.wikipedia.org/wiki/special). 492
11. Seo, J. S., Burri, B.J., Quan, Z. & Neidlinger,T.R. (2005). Extraction and chromatography 493
of carotenoids from pumpkin. American Journal of Chromatography 1073:371-375. 494
12. Burri, B.J.( 2007). Analysis of vitamin E by HPLC. The Encyclopedia of Vitamin E. pp. 495
13. Oxford Dictionary of Biochemistry and Molecular Biology.(2006) Oxford University Press. 496
ISBN 0198529171.(www.en.wikipedia.org/wiki/special). 497
14 Ene-Obong, H.N. (1998).Native species in National food consumption system A paper 498
presented during the inauguration of the R and D Team for the National Programme on 499
indigenous crops and animals by the Federal Ministry of Science and Technology at the 500
conference Hall of National centre for Genetic Resources and Biotechnology, Moor 501
Plantation, Ibadan on 4th
May,1998. pp 5-34 502
15 Eyo, S.E., Molime, A. & Abel, H.J.(1983).Chemical composition and amino acid contents 503
of Gnetum africana, Heinia crinita and Piper guinense. Nigerian .Journal of Nutritional Science, 504
4, 57-62. 505
16 FAO (1996). Fruits and vegetables processing by Dauthy, M.E, FAO Agriculture Service 506
Bulletin, Rome 119: 437. 507
17 Mensah, J.K.., Okoli, R.I., Ohaju-Obodo, J.O. & Eifediyi, K. (2008). Phytochemical, 508
nutritional and medical properties of some leafy vegetables consumed by Edo people of 509
Nigeria. African Journal of Biotechnology. 7 (14), 2304-2309. 510
18 U.S. Department of Health and Human Services and U.S. Department of Agriculture (2005).Dietary 511
Guidelines for Americans, 2005. 6th Edition, Washington, DC: U.S. Government Printing Office, January 512
2005. 513

19 Ajayi, I.E. ,Obasi, N.A. , Chinyere, G.C. & Ugbogu, A.E. (2007). Nutritional and 514
chemical value of Amaranthus hybridus L. leaves from Nigeria, African Journal of 515
Biotechnology. 6 (24), 2833-2839. 516
20 Adnani, S. (2007).Health benefit of mineral. (http/www.organicfacts.net/health-benefits). 517
21 Dionne, I. (2009). Vitamin E with Vitamin C supplements or exercise boost bone health in 518
older women (www.health info). 519
22 Aaron, B. (2009).Importance of Vitamin E. http/www.healthinforesources.blogspot.com) 520
23 FNB (Food and Nutrition Board/IOM (Institute of Medicine). Dietary Reference Intakes 521
for vitamin A, vitamin K, arsenic, boron, chromium, copper, iodine, iron,manganese, 522
molybdenum, nickel, silicon, vanadium, and zinc. Washington, D.C., National Academy Press; 523
2001. p.82-393. 524
24. Barua, A.B. and Olson, J.A. (2001). β-Carotene is converted primarily to retinoids in rats in 525
vivo. J. Nutr. 2000, 130, 1996-2001. 526
25 Robert M. and Russell (2007). Vegetables and fruits are nutrient rich. Higher fruit and 527
vegetable intakes and concomitant nutrients have Multivitamin-multimineral supplements' 528
effect on total nutrient intake . Am J Clin Nutr. 2007. 529
26 Decuypere, J., H. K. Henderickx, & I. Vervaeke. (2010). Influence of nutritional doses of 530
Virginiamycin and Spiramycin on the quantitative and topographical composition of the 531
gastro-intestinal flora of artificially reared piglets. Zbl. Bakt Hyg, I Abt Orig. A223, 348–355. 532
27 Nnamani, C. V., Oselebe, H. O. & Agbatutu, A. (2009). Assessment of nutritional values of 533
three underutilized indigenous leafy vegetables of Ebonyi State, Nigeria. African Journal of 534
Biotechnology, 8 (9), 2321-2324, at http://www.academicjournals.org/AJB. 535
28 Maundu,P. (2006). Promotion of underutilized food plants in Sub-Sahara African: 536
Experiences with leafy vegetables. International plant Genetic Resources Institute 537
(IPGRI). 538
29 Umran and Nevo (1996). Grain zinc, iron and protein concentrations and zinc- efficiency 539
(http//docpayer.net,45508521) 540

30 Lippard, S. J., & J. M. Berg. 1994. Principles of Bioinorganic Chemistry. University 541
Science Books, Mill Valley, CA. 542
31 Shankar, A.H. & Prasad, A.S. (1998). Zinc and immune function; the biological basis of 543
altered resistance of infection. American Journal of Clinical Nutrition, 68, 447-463. 544
32 Nelson, D. L.; & Cox, M. M.(2000) "Lehninger, Principles of Biochemistry" 3rd Ed. Worth 545
Publishing: New York, ISBN 1-57259-153-6. 546
33 Nnamani, C. V., Oselebe, H. O. & Agbatutu, A. (2009). Assessment of nutritional values of 547
three underutilized indigenous leafy vegetables of Ebonyi State, Nigeria. African Journal of 548
Biotechnology, 8 (9), 2321-2324, at http://www.academicjournals.org/AJB. 549
34 Sahin OZ1, Asci G, Kircelli F, Yilmaz M, Duman S, Ozkahya M, Dogan C, Odabas AR, Cirit 550
M, Ok E.(2012).The impact of low serum sodium level on mortality depends on glycemic control. 551
Eur J Clin Invest. 2012 May;42(5):534-40. doi: 10.1111/j.1365-2362.2011.02613.x. Epub 2011 552
Nov 3. 553
35. World Health Organization, UNICEF & Johns, H. B.(2007) School of Public Health, 554
USAID .P.28 (www.en.wikipedia.publichealth). 555
36Nevo table (1996). Nevo Foundation, Netherlands Nutrition Centre. 556
37 Musinguzi, E.L, J.K. Kikafunda and B.T. Kiremire,(2007).Promoting indigenous wild edible fruits to 557
complement roots and tuber crops in alleviating vitamin A deficiencies in Uganda. Proceedings of the 558
13th ISTRC Symposium, pp: 763-769. 559
38 Adnani, S. (2007).Health benefit of mineral. (http/www.organicfacts.net/health-benefits). 560
39 Corbridge, D. E. C. (1995). Phosphorus: An Outline of its Chemistry, Biochemistry, and 561
Technology (5th ed.). Amsterdam: Elsevier. ISBN 0-444-89307-5. 562