nvidia perfkit 6 · nvidia perfkit 6: the world’s most advanced gpu performance suite perfhud 6...
TRANSCRIPT

NVIDIA PerfKit 6

NVIDIA PerfKit 6: The World’s Most Advanced GPU Performance Suite
PerfHUD 6
New! GeForce 8800GT, 9600GT, 9800GX2 support
New! Use stock NVIDIA drivers with PerfHUD (on Windows Vista)
New! Multi-GPU Support
New! More real-time signals, including SLI signals
New! API Call List
New! Draw Call Dependency Analysis
New! Advanced Texture Visualization
New! Texture Overrides
Real-time performance analysis and debugging
Automated bottleneck determination
PerfSDK
New! GeForce 8800GT, 9600GT, 9800GX2 support
API for accessing GPU and driver counters
Supports DirectX 9 & 10, as well as OpenGL
NVIDIA Plug-in for Microsoft PIX for Windows
GLExpert

PerfHUD 6
Advanced Data MiningMulti-GPU Support
Powerful Texture Visualization Combined CPU/GPU Timing Graph
Crysis used with permission from Crytek. © Crytek GmbH. All Rights Reserved. Crysis and CryENGINE are trademarks or registered trademarks of Crytek GmbH in the U.S and/or other countries.
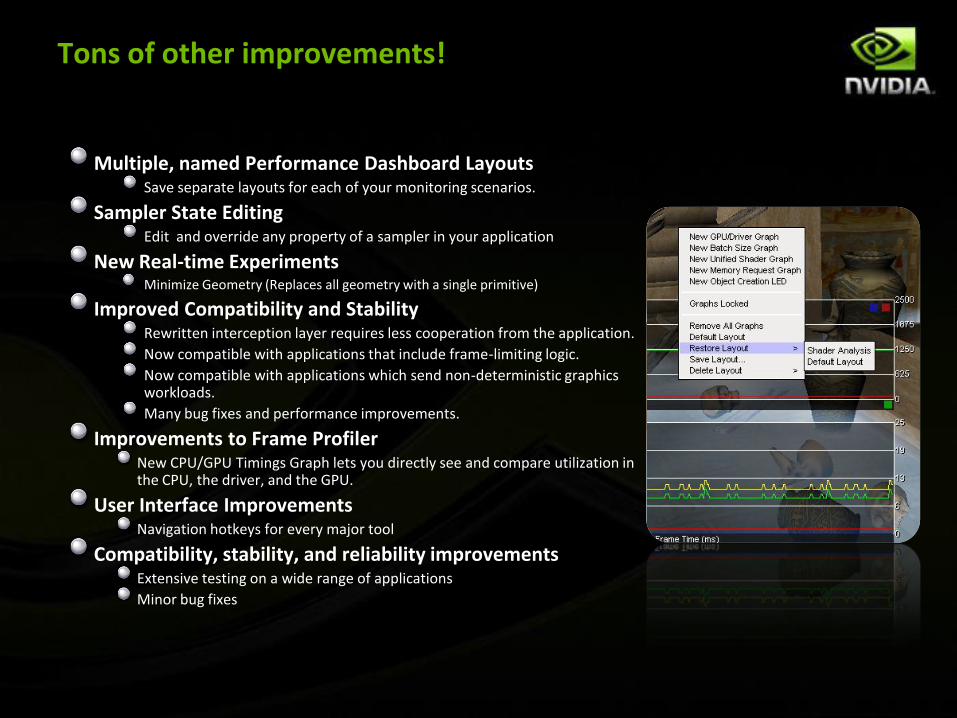
Tons of other improvements!
Multiple, named Performance Dashboard LayoutsSave separate layouts for each of your monitoring scenarios.
Sampler State EditingEdit and override any property of a sampler in your application
New Real-time ExperimentsMinimize Geometry (Replaces all geometry with a single primitive)
Improved Compatibility and StabilityRewritten interception layer requires less cooperation from the application.
Now compatible with applications that include frame-limiting logic.
Now compatible with applications which send non-deterministic graphics workloads.
Many bug fixes and performance improvements.
Improvements to Frame Profiler New CPU/GPU Timings Graph lets you directly see and compare utilization in the CPU, the driver, and the GPU.
User Interface ImprovementsNavigation hotkeys for every major tool
Compatibility, stability, and reliability improvements Extensive testing on a wide range of applications
Minor bug fixes

How to Think of PerfHUD’s Main Modes
Performance DashboardReal-time Holistic Analysis
Frame DebuggerRendering Debugging
Advanced ScreensShader and Render State Inspection and Modification
Frame ProfilerAutomated Bottleneck Detection
Per-Draw Call Performance Graphs

New! Advanced Texture Overrides
Override any texture in your application with a variety of useful texture overrides
2x2 Texture: Reduces texture bandwidth usage by using the smallest texture possible.
Black, 25% Gray, 50% Gray, 75% Gray, White, Horizontal gradient, Vertical Gradient: Each of these can be useful as debug input to your shaders.
Color Mipmap Texture: Visualize your miplevels quickly and easily
Use with shader edit and continue to quickly diagnose and correct bugs.
Texture Context Menu
Mipmap Visualization

New! API Call List and Perf Event View
New! API Call List
A full list of all D3D API calls, colorized by call type
One click jumps you to the
corresponding draw call.
New! Perf Event List
Navigate your scene using D3D Perf Events to annotate sections of the frame.
Use Perf Events to selectively disable state overrides for portions of the scene.
Set a debug break (_int 3) to occur on a PerfEvent to help debug your CPU code.

Shader Edit and Continue
Edit & Continue for:DirectX 9 HLSL and .fx
DirectX 10 HLSL and .fx
Vertex, geometry, and pixel shaders
Code editingStandard keyboard and mouse interaction
Search bar
Easily toggle between original and modified shaders
Discard Current Edits
Restore Original Shader
Controlled via hotkey
Editing Shaders

The Frame Profiler
Same powerful automated analysis as in PerfHUD 5
New! CPU/GPU timing graph
Detailed CPU/GPU Timings

How is PerfHUD Different from Other Performance Tools?
It works in real-time on your application. Other tools require out of context,
offline analysis. PerfHUD allows you to debug and tune your application in the
most natural place: within your application!
One key press provides a list of draw calls (grouped by bottleneck and sorted by
duration) to work on. Running experiments and collecting data from individual
pipeline units is difficult and easy to misjudge. PerfHUD automatically tells you
exactly where your bottlenecks are so you can fix them quickly.
Real-time frame scrubbing. Modern engines have thousands of draw calls per
frame. PerfHUD lets you decompose the scene, stepping through each draw
call to find any problems.
Edit-and-continue. Modifying shader code and render states can be time
consuming. PerfHUD allows you to make changes while your application is
running – allowing you to quickly try our ideas and get immediate feedback.

Trying Out PerfHUD 6
Read Chapter 1 of the User’s GuideThis will guide you through the key new features quickly
Please share your feedback:
[email protected]/forums