nvironment and sustainable development of mongolian...
TRANSCRIPT
NEESPI Regional Science Team Meeting 16-20 Sept 2007, Urumqi, China
Environment and Sustainable Development of Mongolian Plateau Region: an overview of international collaboration activities and results
Funding sponsor: Chinese Academy of Sciences
Lin Zhen, Jiyuan Liu, D. Dorjgotov, O. Batkhishig, Qinxue Wang, Yuhai Bao
IGSNRR of CAS, IG of MAS, NIES of Japan, IMNU
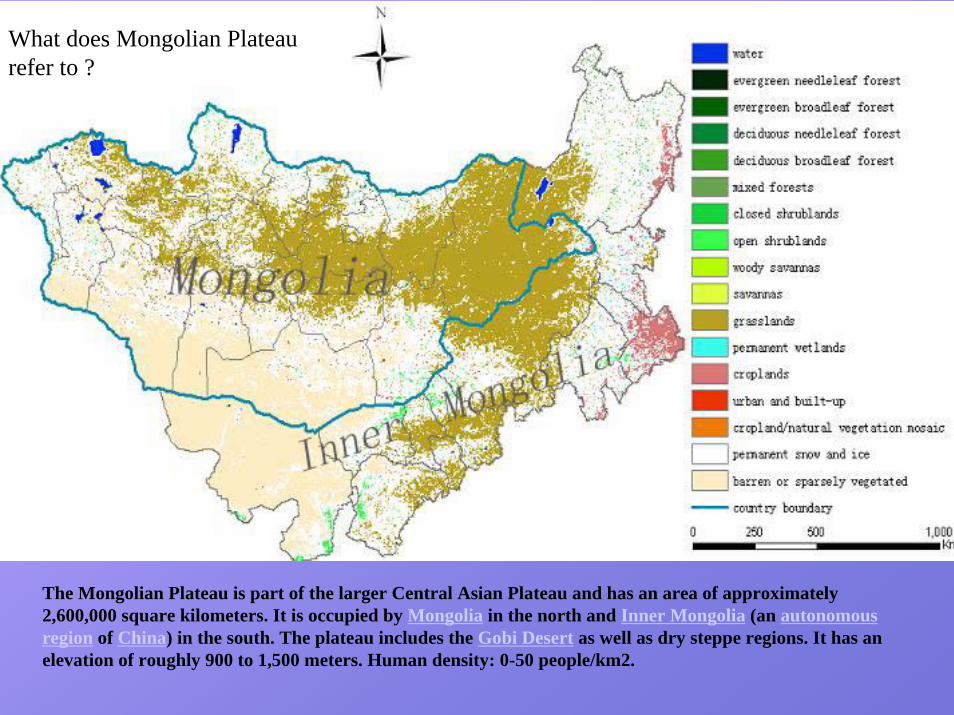
The Mongolian Plateau is part of the larger Central Asian Plateau and has an area of approximately 2,600,000 square kilometers. It is occupied by Mongolia in the north and Inner Mongolia (an autonomous region of China) in the south. The plateau includes the Gobi Desert as well as dry steppe regions. It has an elevation of roughly 900 to 1,500 meters. Human density: 0-50 people/km2.
What does Mongolian Plateau refer to ?
Background and focus of China-Mongolia collaboration
Climate change and impacts
Consumption and perceptions of ecosystem services: Mongolia vs Inner Mongolia
Environmental consequence: soil erosion mechanism Mongolia vs Inner Mongolia
Plans for future research and collaboration
Outline
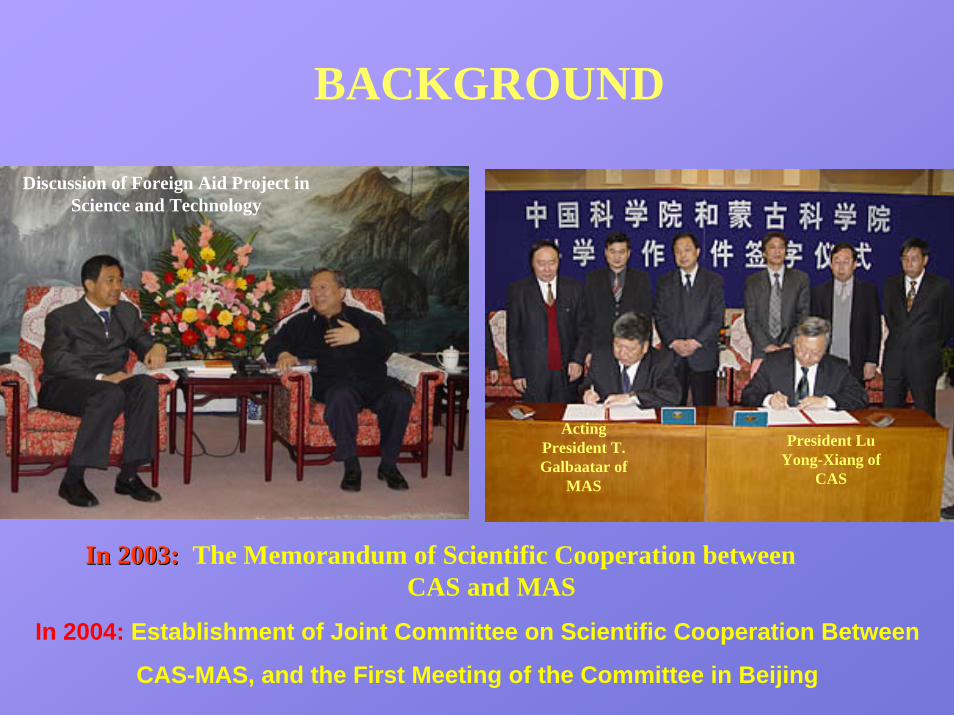
BACKGROUND
In 2003: In 2003: The Memorandum of Scientific Cooperation between CAS and MAS
In 2004: Establishment of Joint Committee on Scientific Cooperation Between
CAS-MAS, and the First Meeting of the Committee in Beijing
President Lu Yong-Xiang of
CAS
Acting President T. Galbaatar of
MAS
Discussion of Foreign Aid Project in Science and Technology
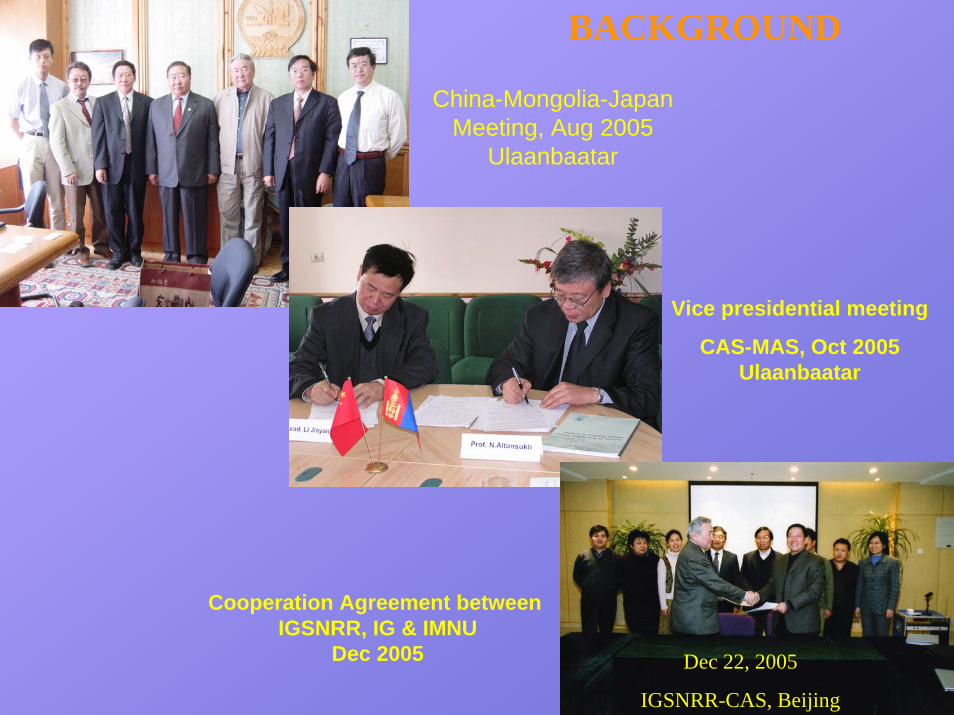
China-Mongolia-Japan Meeting, Aug 2005
Ulaanbaatar
BACKGROUND
Vice presidential meeting
CAS-MAS, Oct 2005 Ulaanbaatar
Cooperation Agreement between IGSNRR, IG & IMNU
Dec 2005 Dec 22, 2005
IGSNRR-CAS, Beijing
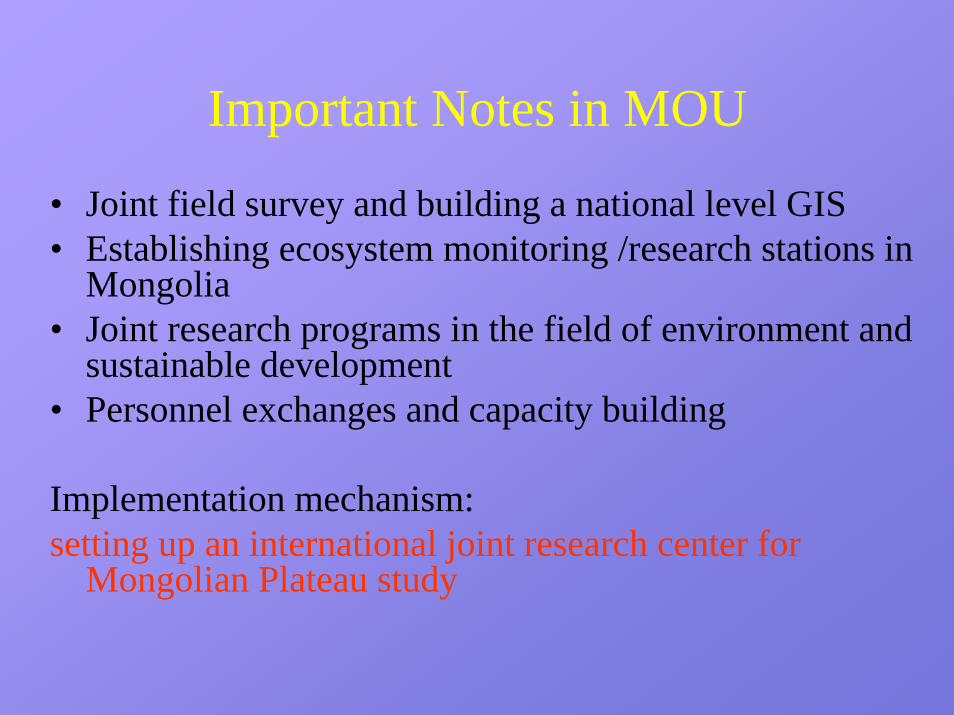
Important Notes in MOU
• Joint field survey and building a national level GIS• Establishing ecosystem monitoring /research stations in
Mongolia• Joint research programs in the field of environment and
sustainable development• Personnel exchanges and capacity building
Implementation mechanism: setting up an international joint research center for
Mongolian Plateau study
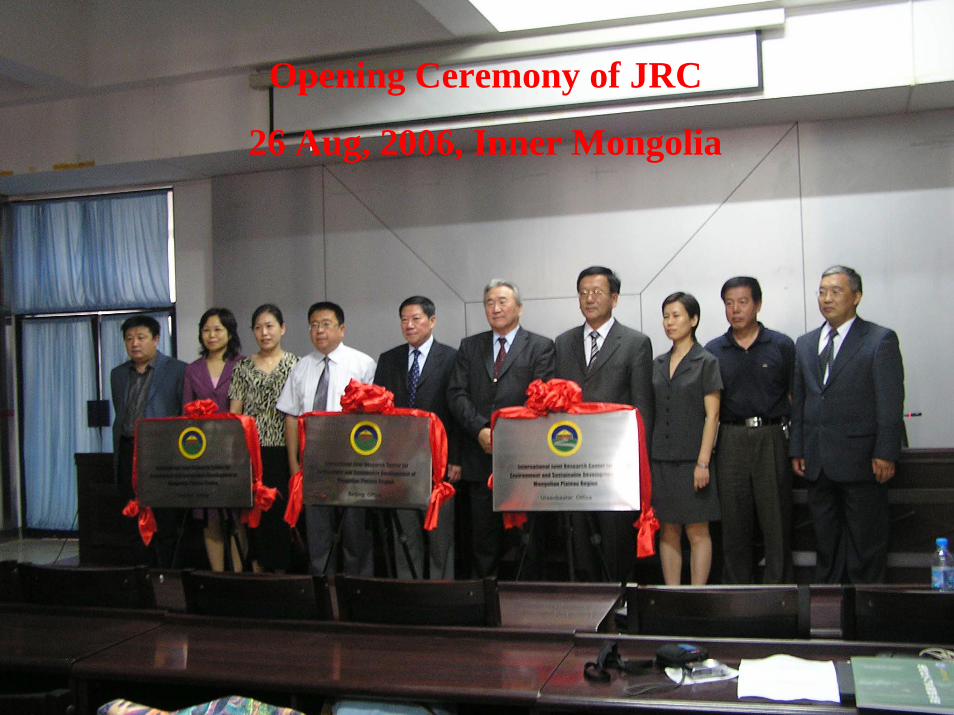
Opening Ceremony of JRC
26 Aug, 2006, Inner Mongolia
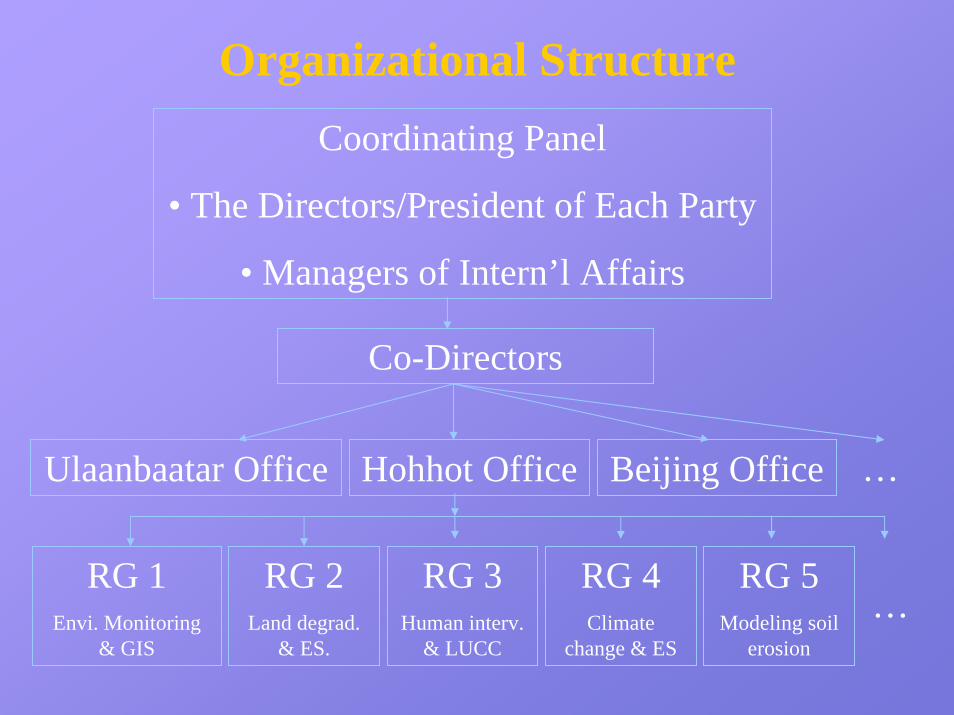
Organizational StructureCoordinating Panel
• The Directors/President of Each Party
• Managers of Intern’l Affairs
Hohhot OfficeUlaanbaatar Office Beijing Office
Co-Directors
RG 1Envi. Monitoring
& GIS
…
RG 2Land degrad.
& ES.
RG 3Human interv.
& LUCC
RG 4Climate
change & ES
RG 5Modeling soil
erosion
…
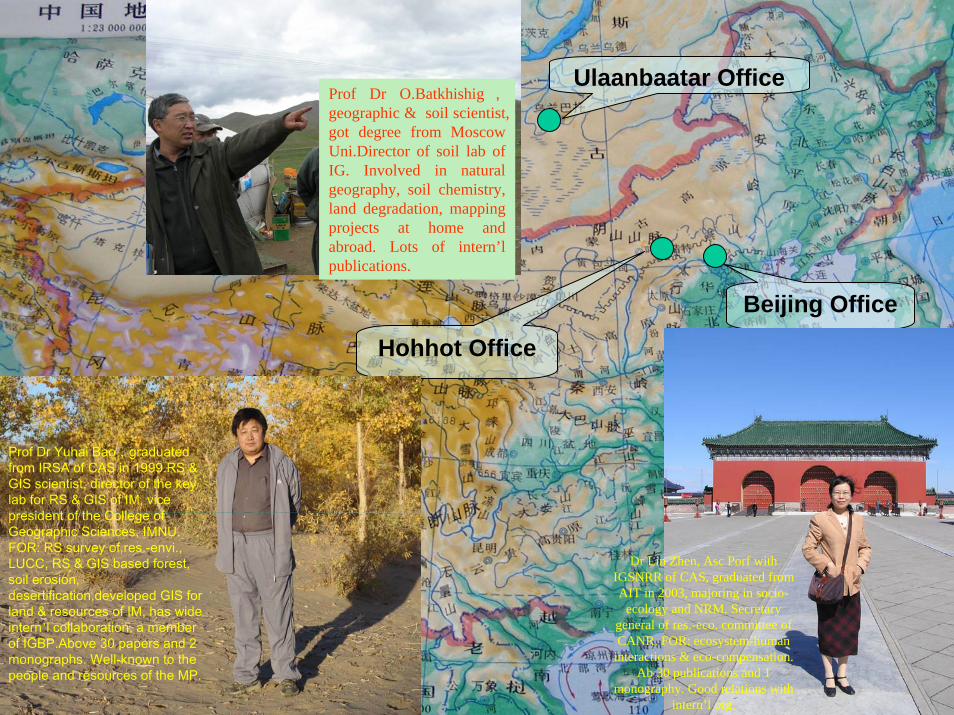
Beijing Office
Dr Lin Zhen, Asc Porf with IGSNRR of CAS, graduated from AIT in 2003, majoring in socio-
ecology and NRM. Secretary general of res.-eco. committee of CANR. FOR: ecosystem-human
interactions & eco-compensation. Ab 30 publications and 1
monography. Good relations with intern’l org.
Hohhot Office
Prof Dr Yuhai Bao,graduated from IRSA of CAS in 1999.RS & GIS scientist, director of the key lab for RS & GIS of IM, vice president of the College of Geographic Sciences, IMNU. FOR: RS survey of res.-envi., LUCC, RS & GIS based forest, soil erosion, desertification,developed GIS for land & resources of IM, has wide intern’l collaboration, a member of IGBP.Above 30 papers and 2 monographs. Well-known to the people and resources of the MP.
Ulaanbaatar OfficeProf Dr O.Batkhishig ,geographic & soil scientist, got degree from Moscow Uni.Director of soil lab of IG. Involved in natural geography, soil chemistry, land degradation, mapping projects at home and abroad. Lots of intern’lpublications.
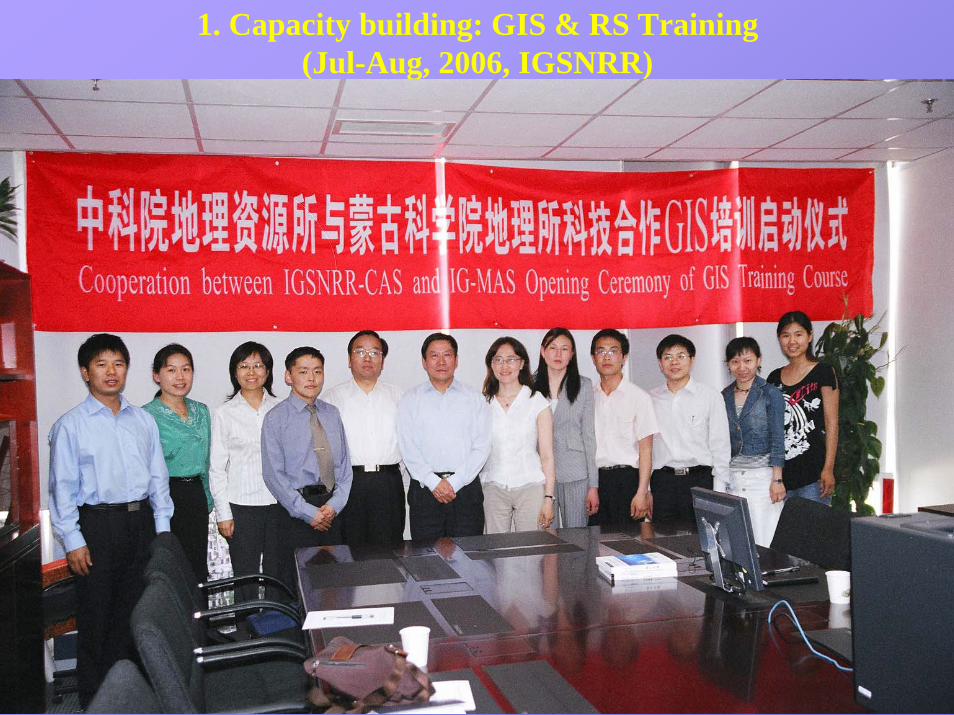
1. Capacity building: GIS & RS Training (Jul-Aug, 2006, IGSNRR)
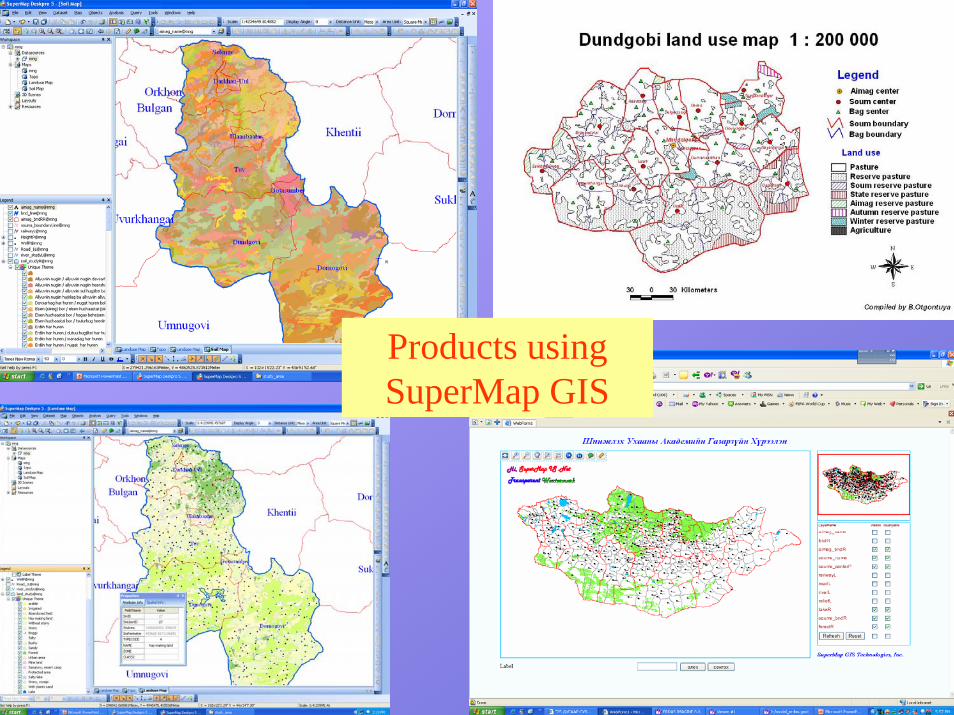
Products using SuperMap GIS
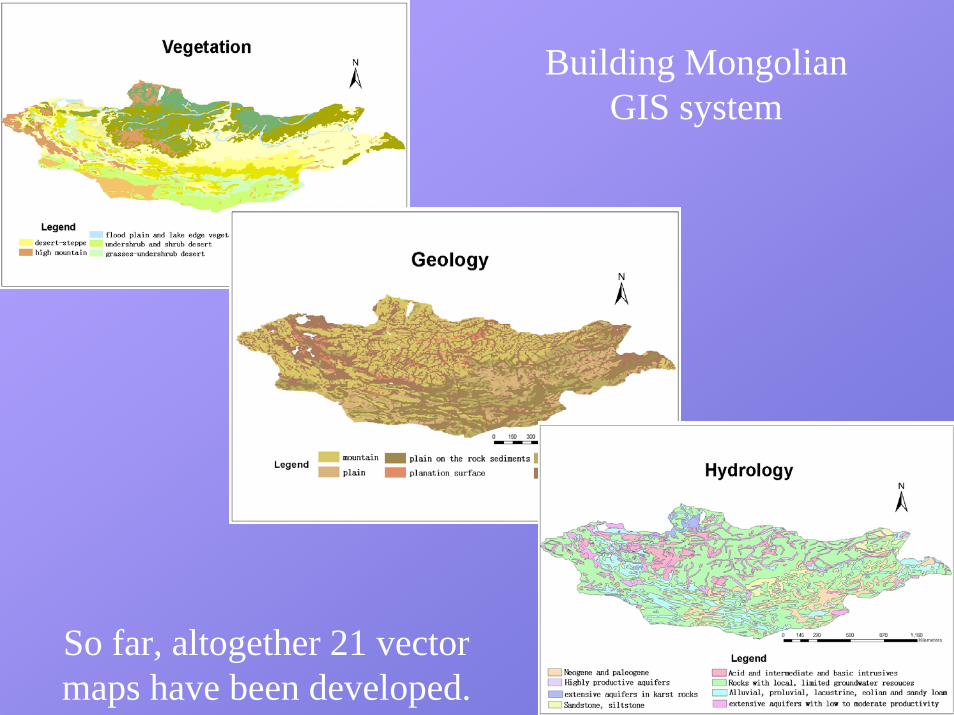
Building Mongolian GIS system
So far, altogether 21 vector maps have been developed.
International Exchanges
• Joint field surveys: since 2005.• Visiting• International conference on Environment
and Sustainable Development of Mongolian Plateau and Surrounding Regions:- The first meeting: Ulaanbaatar 2005- The second meeting: Hohhot 2006- The third meeting: 26-27 Nov 2007,
IGSNRR of CAS, Beijing
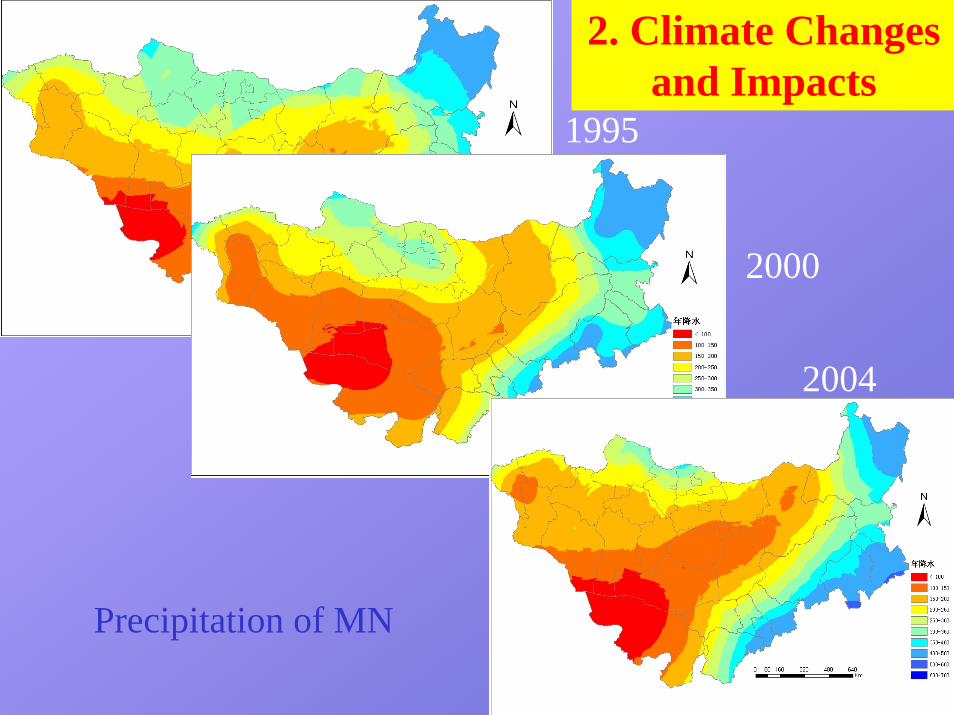
1995
2004
2000
2. Climate Changes and Impacts
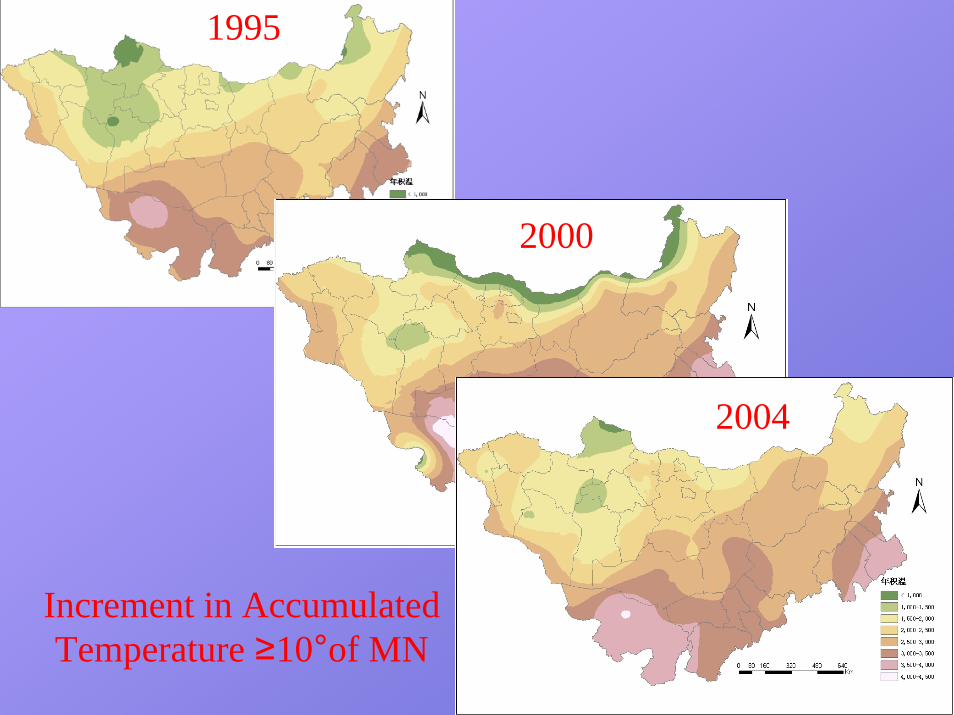
1995
Precipitation of MN
1995
2004
2000
Increment in Accumulated Temperature ≥10°of MN
Ulaabaatar-6
-5
-4
-3
-2
-1
01940 1945 1950 1955 1960 1965 1970 1975 1980 1985 1990 1995 2000
年份
气温
( ℃)
0
100
200
300
400
500
600
降水
(mm
)
气温降水
呼和浩特
0
2
4
6
8
10
1951 1956 1961 1966 1971 1976 1981 1986 1991 1996 2001 年份
气温
( ℃)
0
200
400
600
800
1000
降水
)mm
)
气温降水
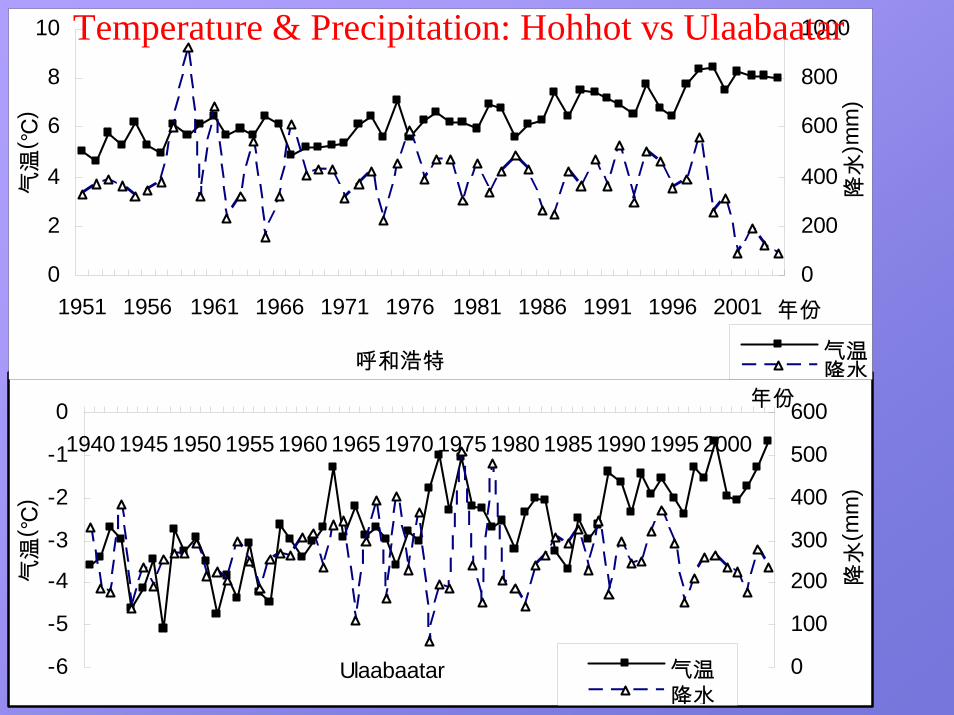
Temperature & Precipitation: Hohhot vs Ulaabaatar
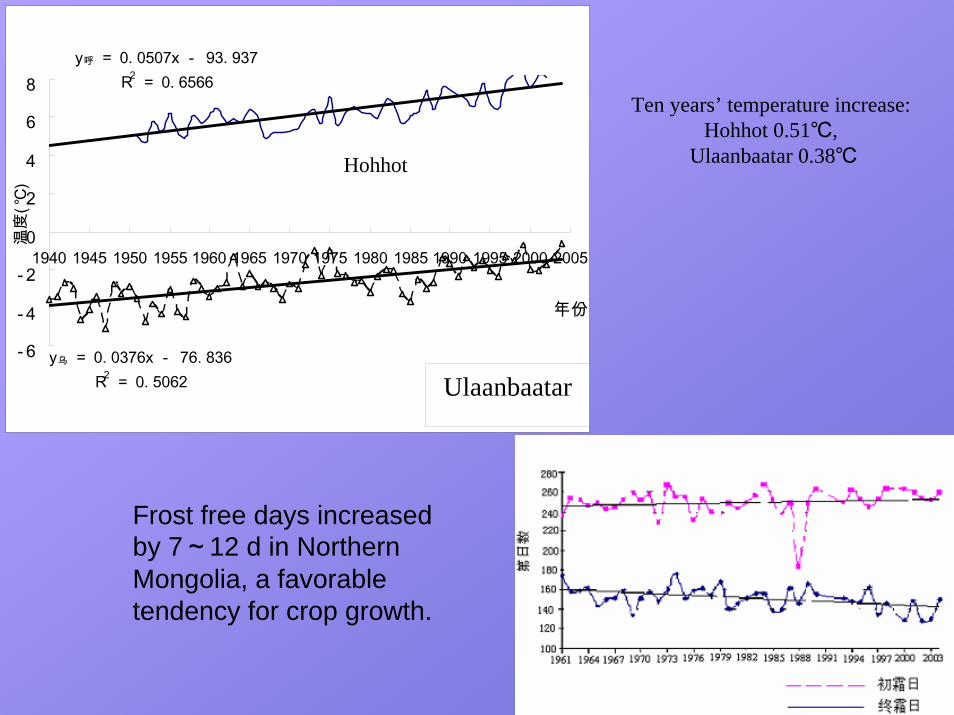
y呼 = 0. 0507x - 93. 937R2 = 0. 6566
y乌 = 0. 0376x - 76. 836R2 = 0. 5062
- 6
- 4
- 2
0
2
4
6
8
1940 1945 1950 1955 1960 1965 1970 1975 1980 1985 1990 1995 2000 2005
年份
温度
(℃)
呼和浩特Ul aabaat a
Hohhot
Ulaanbaatar
Ten years’ temperature increase: Hohhot 0.51℃,
Ulaanbaatar 0.38℃
Frost free days increased by 7~12 d in Northern Mongolia, a favorable tendency for crop growth.
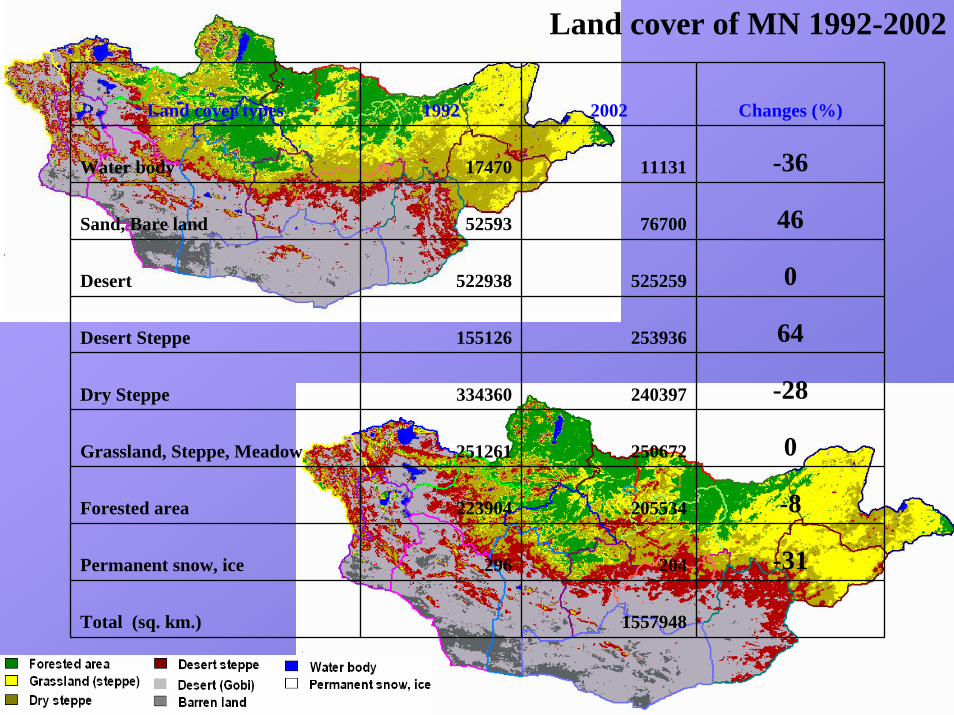
Land cover types 1992 2002 Changes (%)
Water body 17470 11131 -36
Sand, Bare land 52593 76700 46
Desert 522938 525259 0
Desert Steppe 155126 253936 64
Dry Steppe 334360 240397 -28
Grassland, Steppe, Meadow 251261 250672 0
Forested area 223904 205534 -8
Permanent snow, ice 296 204 -31
Total (sq. km.) 1557948
Land cover of MN 1992-2002
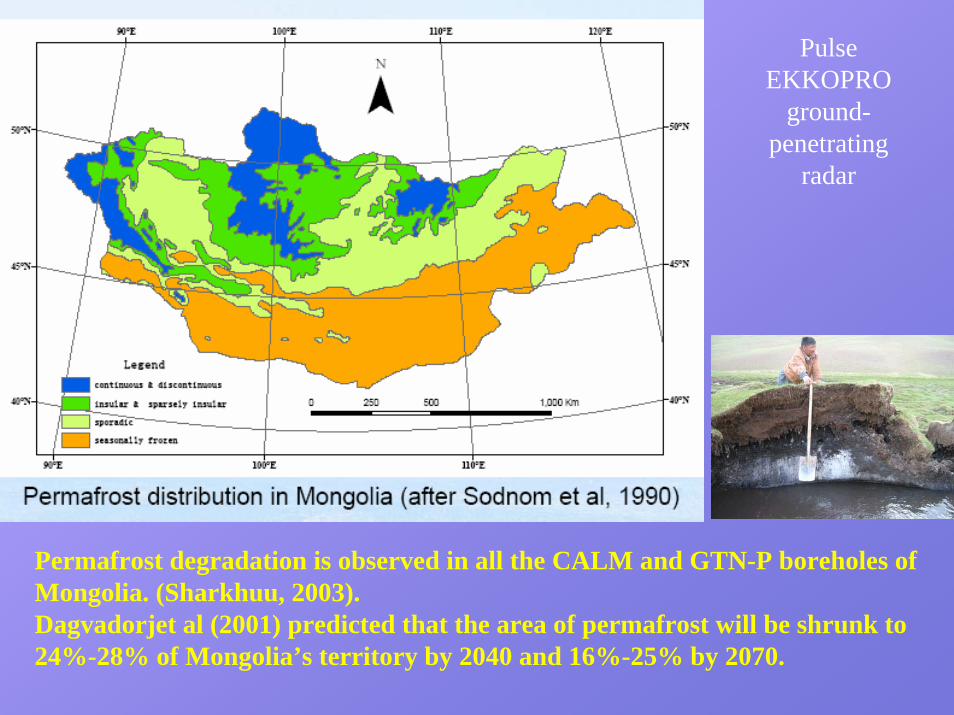
Permafrost changesh
Permafrost degradation is observed in all the CALM and GTN-P boreholes of Mongolia. (Sharkhuu, 2003).Dagvadorjet al (2001) predicted that the area of permafrost will be shrunk to 24%-28% of Mongolia’s territory by 2040 and 16%-25% by 2070.
Pulse EKKOPRO
ground-penetrating
radar

500
1000
1500
2000
2500
3000
3500
4000
1989 1991 1993 1995 1997 1999 2001 2003
年份
面积
(hm
2 ×10
00, 总
产量
((T×
1000
)
1
2
3
4
5
6
7
8
单产
(T/h
m2 )
面积(*1000hm2)产量(*1000吨)单产(t/hm2)
Impact of climate change on crop
yield
Ulaanbaatar
Hohhot
0
200
400
600
800
1000
197019741978198219861990199419982002
年份
谷物
总产
量( 千
吨), 人
口( 万
人)
0
100
200
300
400
500
人均
谷物
占有
量(k
g/人
)
谷物产量(千吨)万人kg/人
0200400600800
1000120014001600
1970 1975 1980 1985 1990 1995 2000 2005年份
万头
牛绵羊山羊
0
500
1000
1500
2000
2500
3000
1989 1992 1995 1998 2001 2004
年份
大牲
畜(×
1000
头), 羊
(×10
000 头
)
0
50
100
150
200
250
300
350
400
降水
量(m
m)
大牲畜羊降水
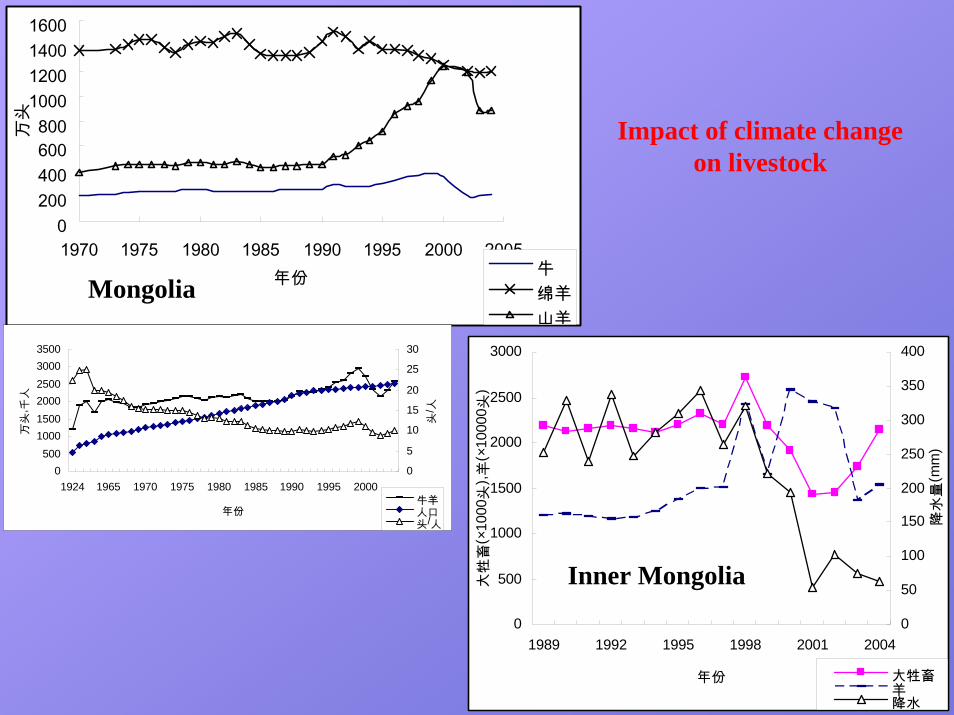
Impact of climate change on livestock
Mongolia
Inner Mongolia
0500
100015002000250030003500
1924 1965 1970 1975 1980 1985 1990 1995 2000
年份
万头
, 千人
0
5
10
15
20
25
30
头/ 人
牛羊人口头/人
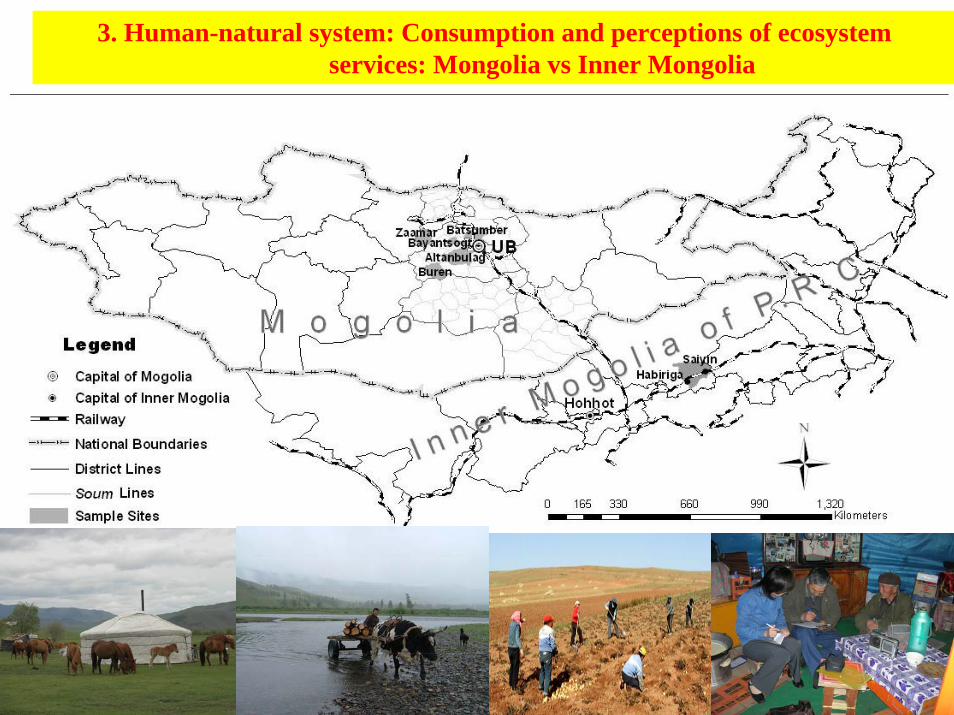
Sampling Soum: 7 soums, 270 HH
3. Human-natural system: Consumption and perceptions of ecosystem services: Mongolia vs Inner Mongolia
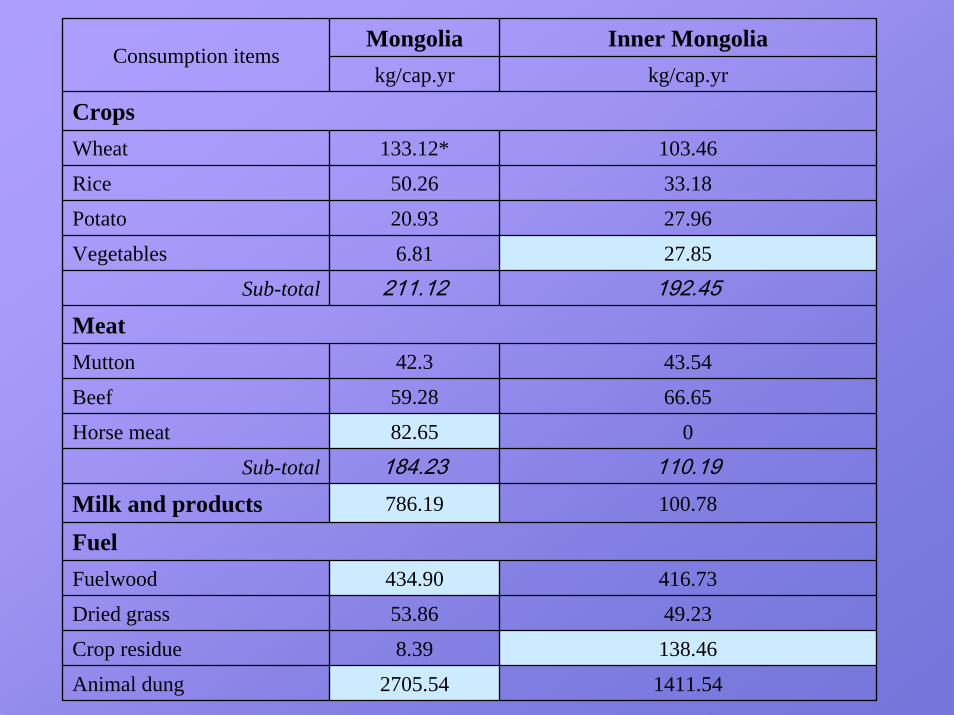
Mongolia Inner Mongoliakg/cap.yr kg/cap.yr
CropsWheat 133.12* 103.46
Rice 50.26 33.18
Potato 20.93 27.96
Vegetables 6.81 27.85
Sub-total 211.12 192.45MeatMutton 42.3 43.54
Beef 59.28 66.65
Horse meat 82.65 0
Sub-total 184.23 110.19Milk and products 786.19 100.78
Fuel Fuelwood 434.90 416.73
Dried grass 53.86 49.23
Crop residue 8.39 138.46
Animal dung 2705.54 1411.54
Consumption items
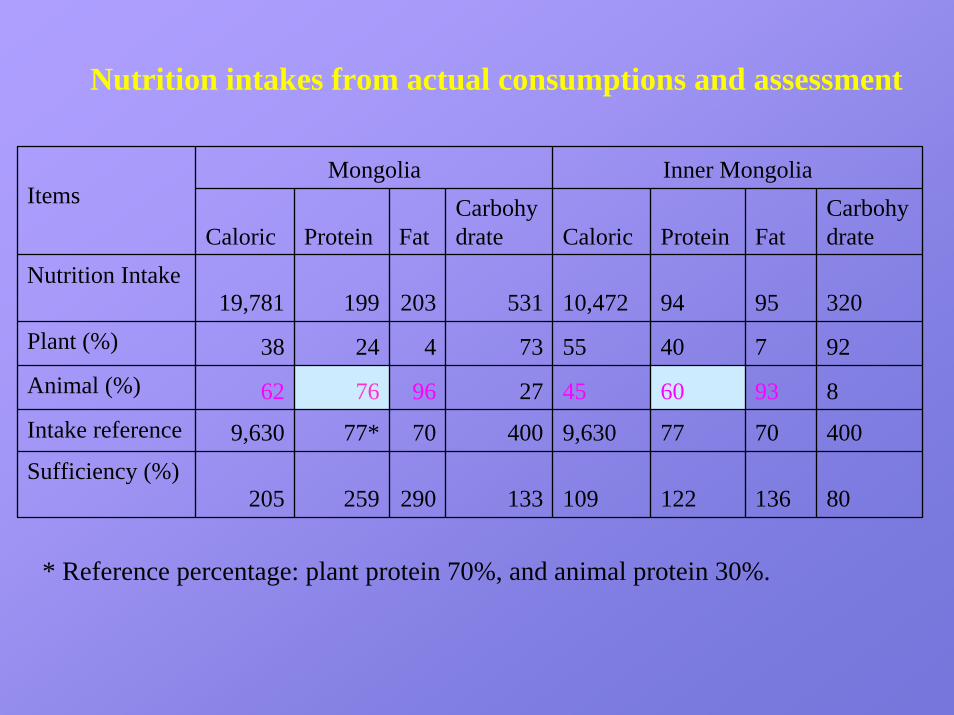
Nutrition intakes from actual consumptions and assessment
Mongolia Inner Mongolia
Caloric Protein Fat Carbohydrate Caloric Protein Fat
Carbohydrate
Nutrition Intake19,781 199 203 531 10,472 94 95 320
Plant (%) 38 24 4 73 55 40 7 92Animal (%) 62 76 96 27 45 60 93 8 Intake reference 9,630 77* 70 400 9,630 77 70 400Sufficiency (%)
205 259 290 133 109 122 136 80
Items
* Reference percentage: plant protein 70%, and animal protein 30%.
13 43 3 4933 35 12 7
24 24 24 5813 37 92 90 43
65 29 3169 82 9 42
22 15 44 1986 3 14
83 1769 31
9 9124 76
13 8790 10
4 9690 10
68 3284 16
MongoliaInner Mongolia
MongoliaInner Mongolia
MongoliaInner Mongolia
MongoliaInner Mongolia
MongoliaInner Mongolia
MongoliaInner Mongolia
MongoliaInner Mongolia
MongoliaInner Mongolia
MongoliaInner Mongolia
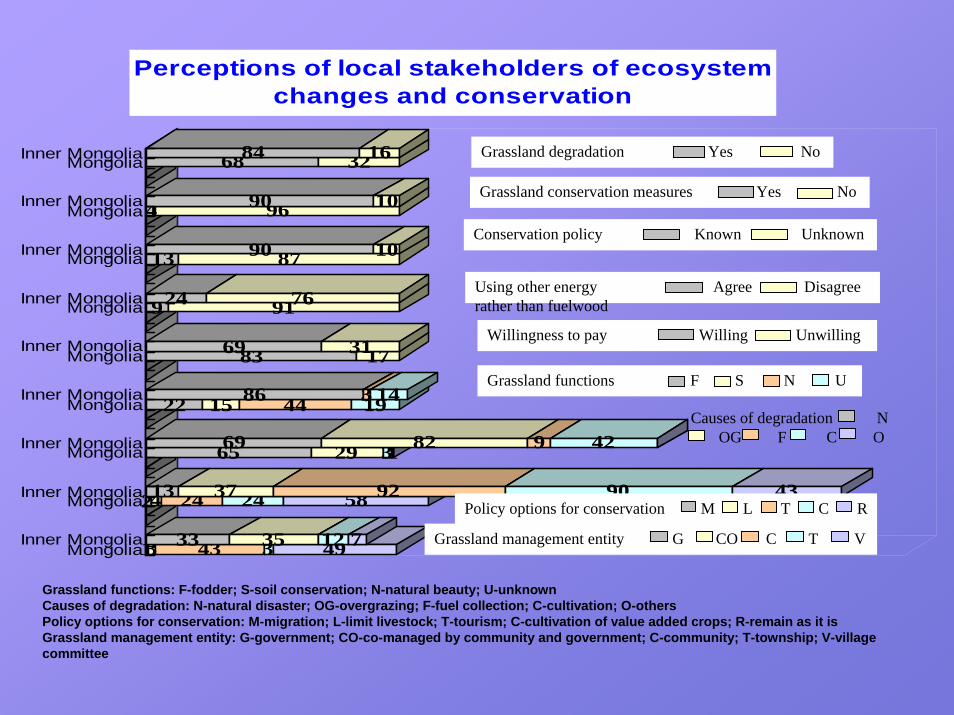
Perceptions of local stakeholders of ecosystemchanges and conservation
Grassland functions: F-fodder; S-soil conservation; N-natural beauty; U-unknownCauses of degradation: N-natural disaster; OG-overgrazing; F-fuel collection; C-cultivation; O-othersPolicy options for conservation: M-migration; L-limit livestock; T-tourism; C-cultivation of value added crops; R-remain as it isGrassland management entity: G-government; CO-co-managed by community and government; C-community; T-township; V-village committee
Grassland degradation Yes No
Grassland conservation measures Yes No
Conservation policy Known Unknown
Using other energy Agree Disagreerather than fuelwood
Willingness to pay Willing Unwilling
Grassland functions F S N U
Causes of degradation NOG F C O
Grassland management entity G CO C T V
Policy options for conservation M L T C R
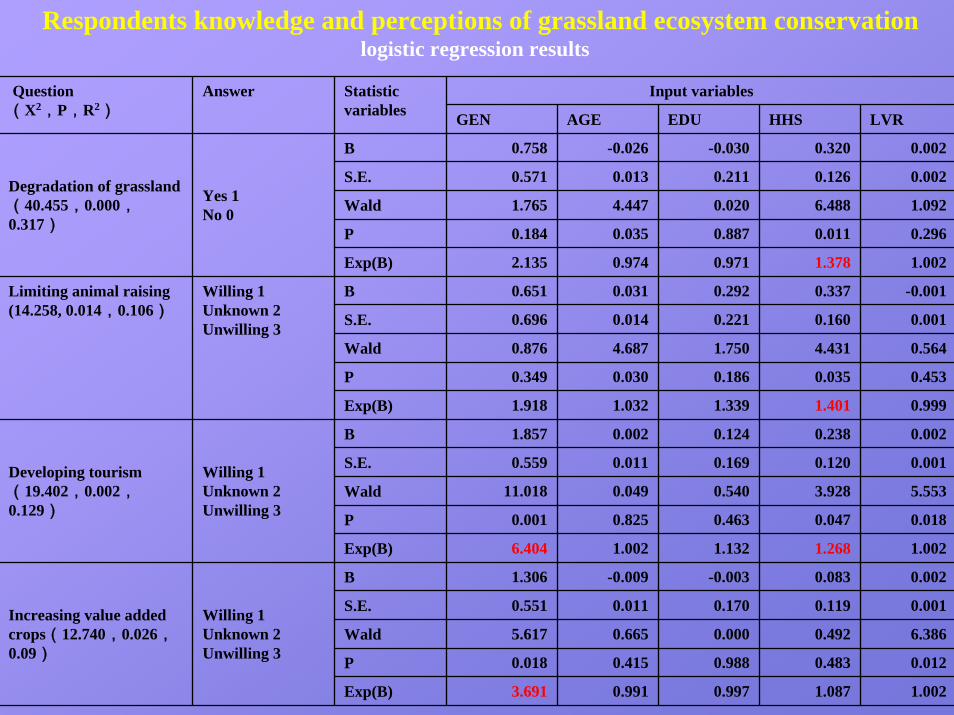
Input variablesQuestion (X2,P,R2)
Answer Statistic variables GEN AGE EDU HHS LVR
B 0.758 -0.026 -0.030 0.320 0.002
S.E. 0.571 0.013 0.211 0.126 0.002
Wald 1.765 4.447 0.020 6.488 1.092
P 0.184 0.035 0.887 0.011 0.296
Exp(B) 2.135 0.974 0.971 1.378 1.002
B 0.651 0.031 0.292 0.337 -0.001
S.E. 0.696 0.014 0.221 0.160 0.001
Wald 0.876 4.687 1.750 4.431 0.564
P 0.349 0.030 0.186 0.035 0.453
Exp(B) 1.918 1.032 1.339 1.401 0.999
B 1.857 0.002 0.124 0.238 0.002
S.E. 0.559 0.011 0.169 0.120 0.001
Wald 11.018 0.049 0.540 3.928 5.553
P 0.001 0.825 0.463 0.047 0.018
Exp(B) 6.404 1.002 1.132 1.268 1.002
B 1.306 -0.009 -0.003 0.083 0.002
S.E. 0.551 0.011 0.170 0.119 0.001
Wald 5.617 0.665 0.000 0.492 6.386
P 0.018 0.415 0.988 0.483 0.012
Exp(B) 3.691 0.991 0.997 1.087 1.002
Increasing value added crops(12.740,0.026,0.09)
Willing 1Unknown 2Unwilling 3
Developing tourism(19.402,0.002,0.129)
Willing 1Unknown 2Unwilling 3
Limiting animal raising (14.258, 0.014,0.106)
Willing 1Unknown 2Unwilling 3
Degradation of grassland(40.455,0.000,0.317)
Yes 1No 0
Respondents knowledge and perceptions of grassland ecosystem conservationlogistic regression results
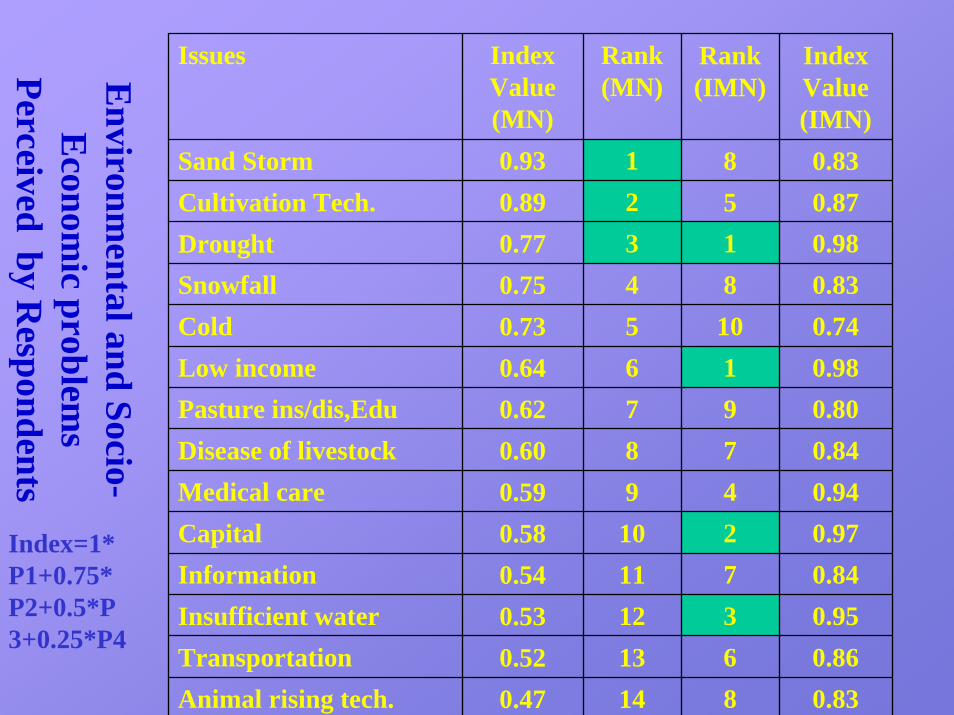
Issues IndexValue(MN)
Rank(MN)
0.93 1234567891011121314
0.890.770.750.730.640.620.600.590.580.540.530.520.47
Rank(IMN)
IndexValue(IMN)
Sand Storm 8 0.83Cultivation Tech. 5 0.87Drought 1 0.98Snowfall 8 0.83Cold 10 0.74Low income 1 0.98Pasture ins/dis,Edu 9 0.80Disease of livestock 7 0.84Medical care 4 0.94Capital 2 0.97Information 7 0.84Insufficient water 3 0.95Transportation 6 0.86Animal rising tech. 8 0.83
Environm
ental and Socio-E
conomic problem
s Perceived by R
espondents
Index=1*P1+0.75*P2+0.5*P3+0.25*P4
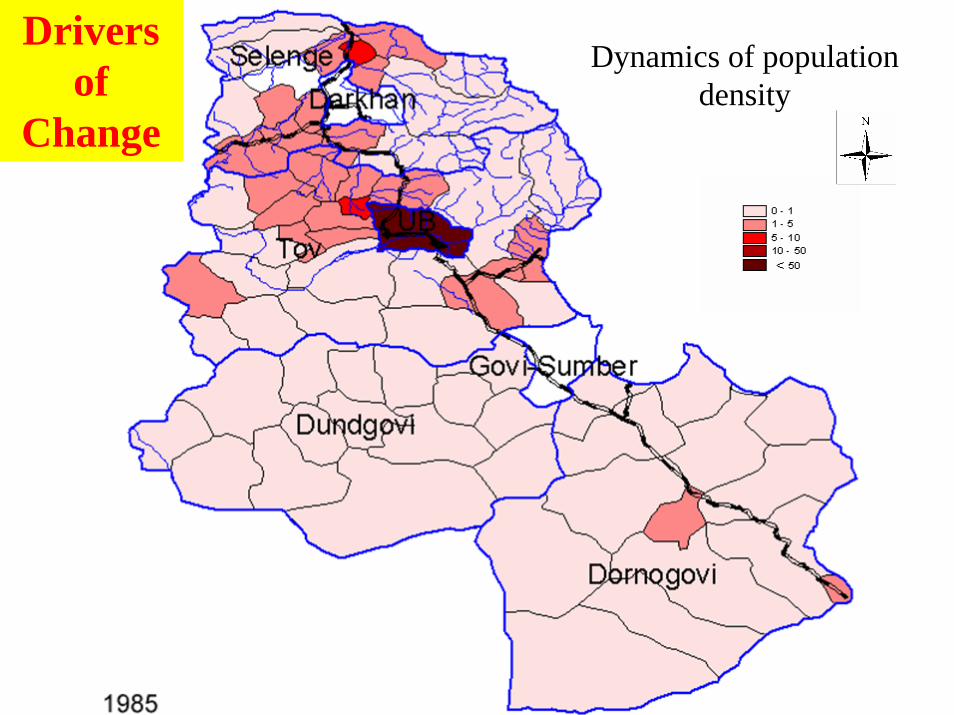
Dynamics of population density
Drivers of
Change
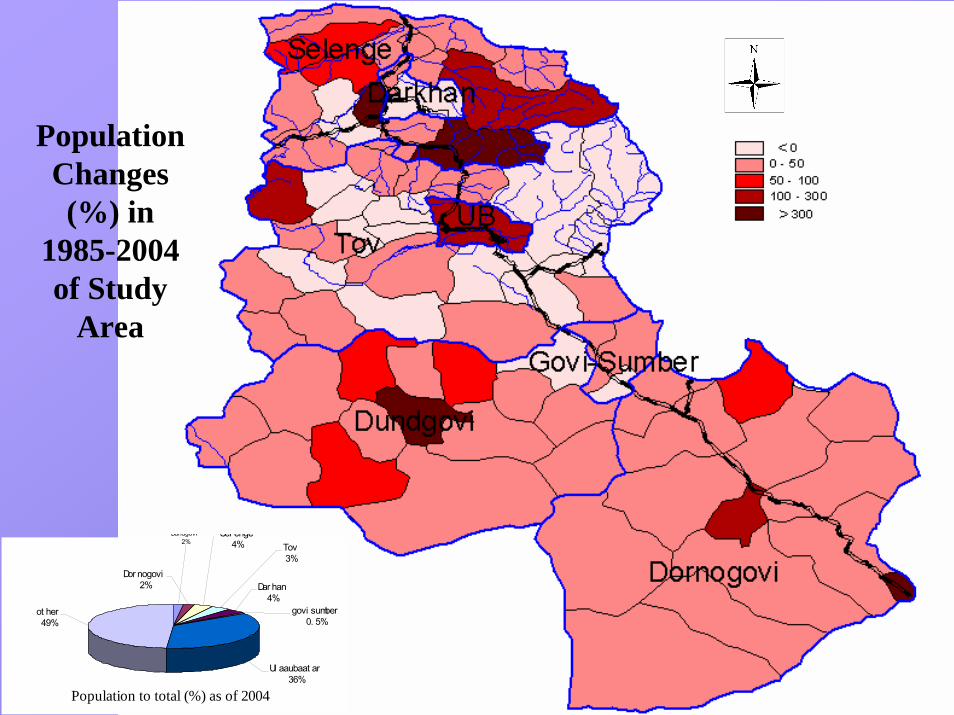
Population to total (%) as of 2004
ot her49%
Ul aaubaat ar36%
Dar han4%
Tov3%
Sel enge4%
Dor nogovi2%
govi sumber0. 5%
Dundgovi2%
Population Changes (%) in
1985-2004 of Study
Area
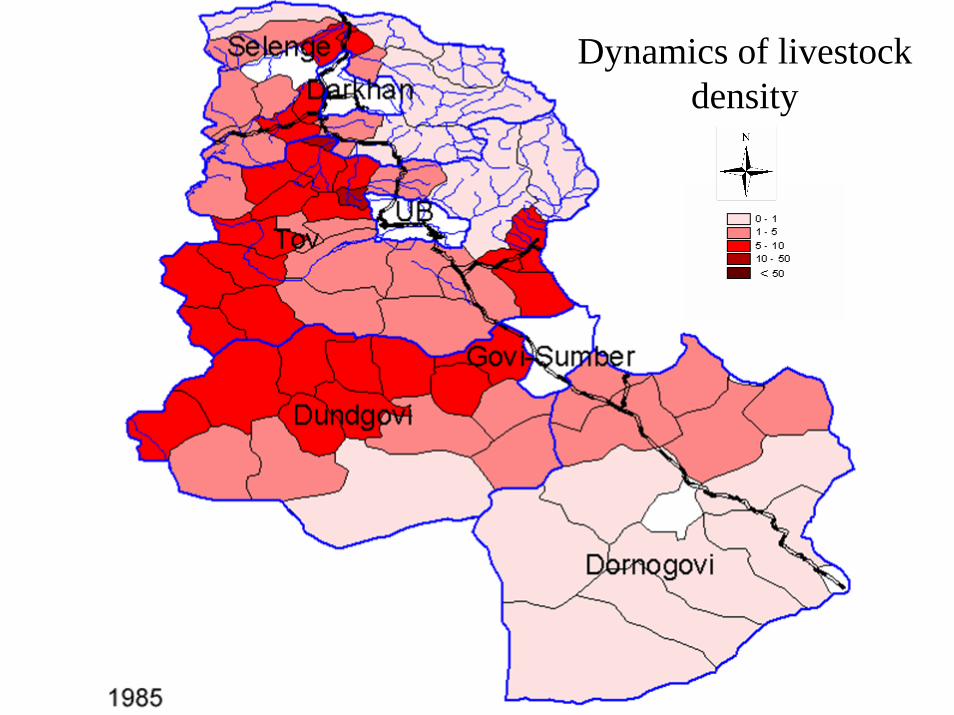
Dynamics of livestock density
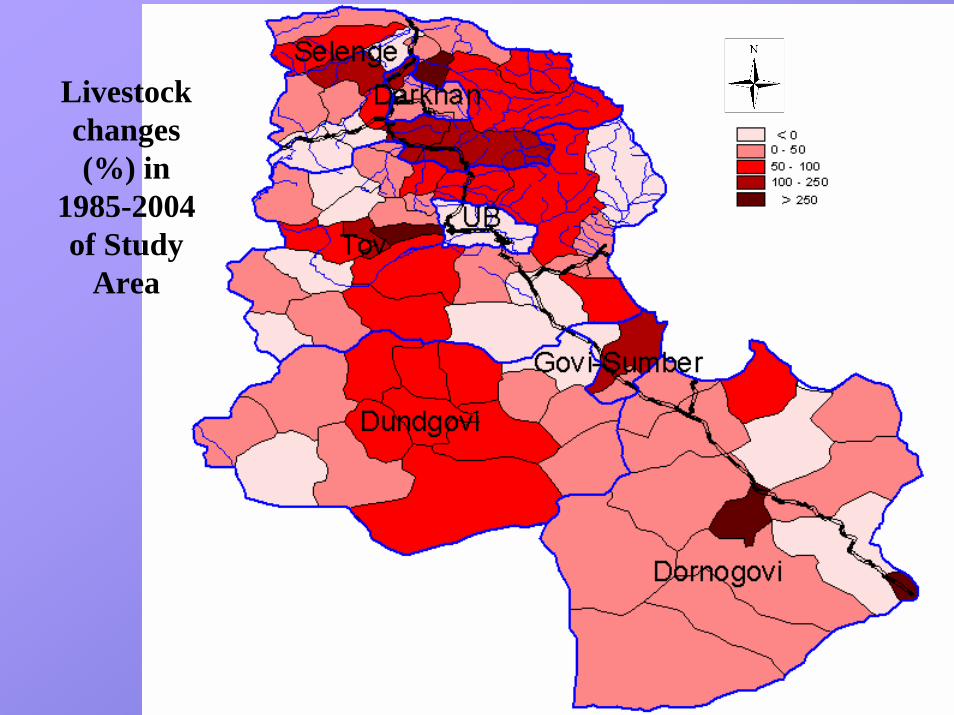
Livestock changes (%) in
1985-2004of Study
Area
哈拉和林
Sampling sites: Sampling sites: 137137Cs tracing methodCs tracing method
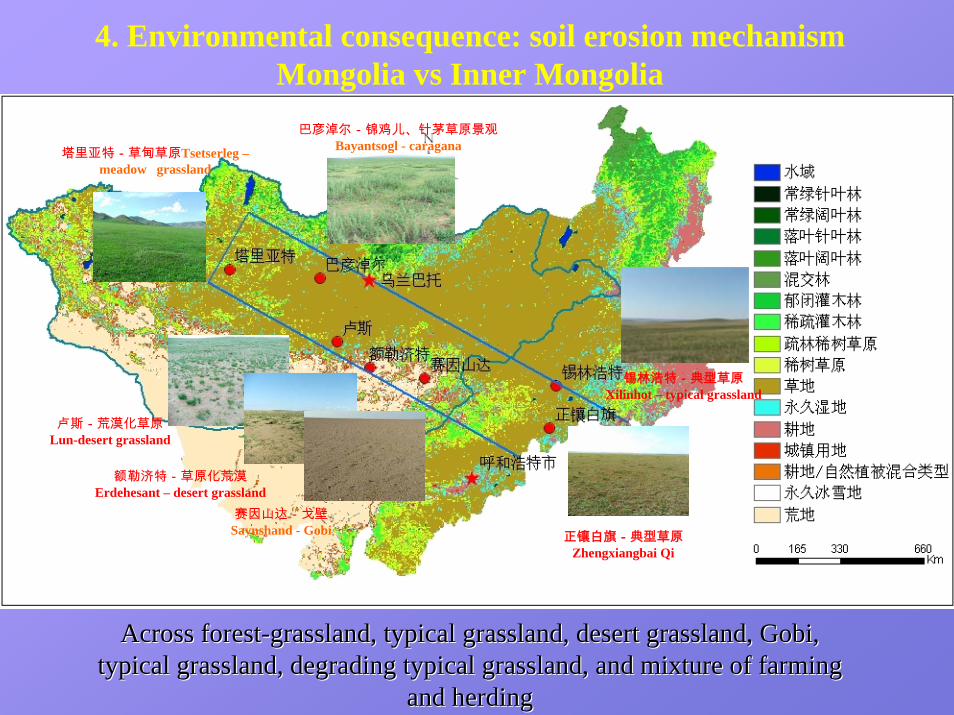
4. Environmental consequence: soil erosion mechanism Mongolia vs Inner Mongolia
Across forestAcross forest--grassland, typical grassland, desert grassland, Gobi, grassland, typical grassland, desert grassland, Gobi, typical grassland, degrading typical grassland, and mixture of ftypical grassland, degrading typical grassland, and mixture of farming arming
and herdingand herding
塔里亚特-草甸草原Tsetserleg –meadow grassland
巴彦淖尔-锦鸡儿、针茅草原景观Bayantsogl - caragana
卢斯-荒漠化草原Lun-desert grassland
额勒济特-草原化荒漠Erdehesant – desert grassland
赛因山达-戈壁Saynshand - Gobi
锡林浩特-典型草原Xilinhot – typical grassland
正镶白旗-典型草原Zhengxiangbai Qi
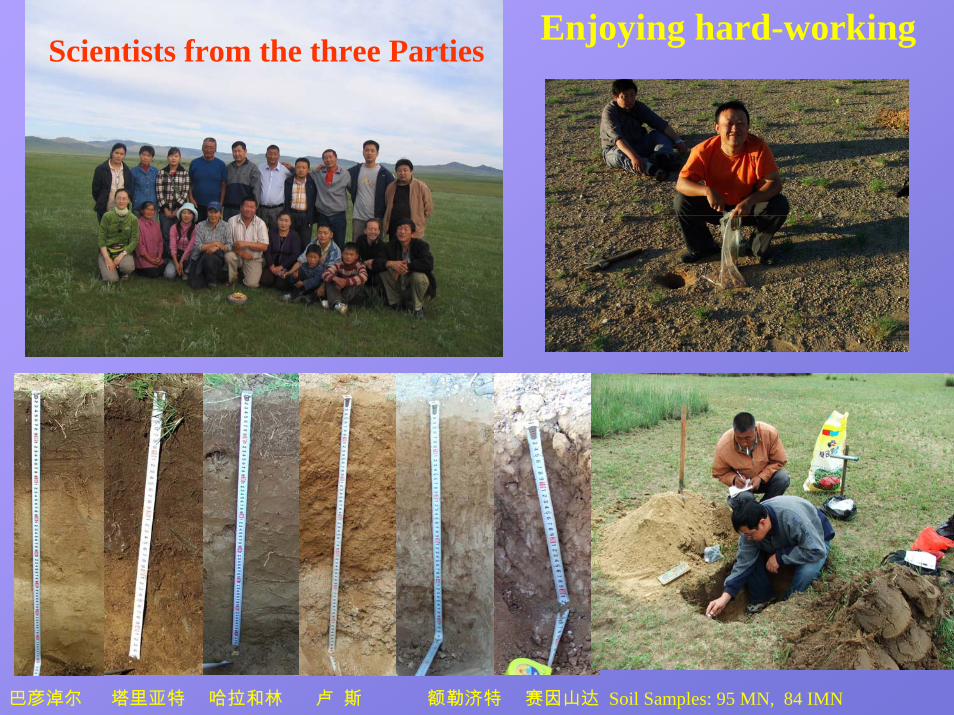
巴彦淖尔 塔里亚特 哈拉和林 卢 斯 额勒济特 赛因山达 Soil Samples: 95 MN, 84 IMN
Scientists from the three PartiesEnjoying hard-working
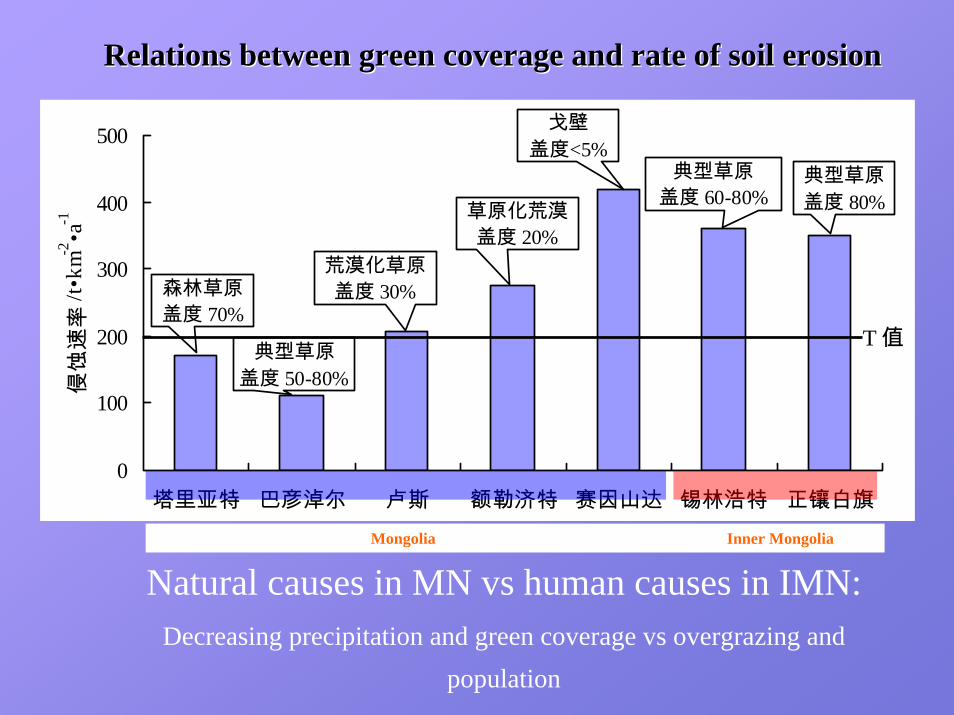
0
100
200
300
400
500
塔里亚特 巴彦淖尔 卢斯 额勒济特 赛因山达 锡林浩特 正镶白旗
侵蚀
速率
/t•k
m-2•a
-1
森林草原 盖度 70%
典型草原 盖度 50-80%
荒漠化草原盖度 30%
草原化荒漠 盖度 20%
戈壁 盖度<5%
典型草原 盖度 60-80%
典型草原盖度 80%
T 值
Relations between green coverage and rate of soil erosionRelations between green coverage and rate of soil erosion
Natural causes in MN vs human causes in IMN:Decreasing precipitation and green coverage vs overgrazing and
population
SaynshandSaynshandSaynshandSaynshandMongolia Inner Mongolia
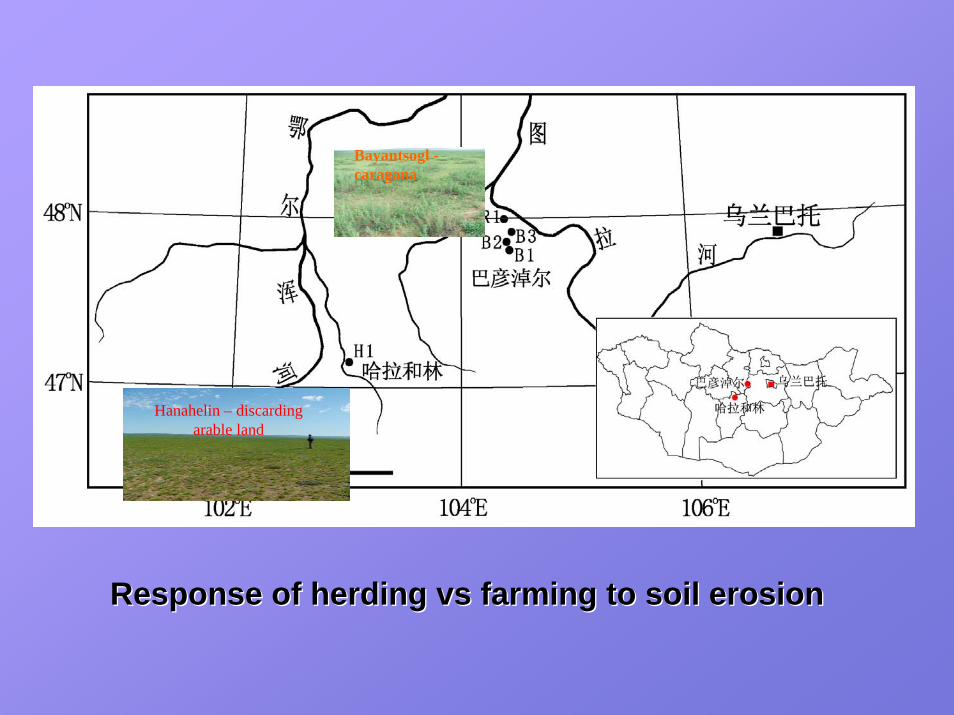
Response of herding Response of herding vsvs farming to soil erosionfarming to soil erosion
Bayantsogl -caragana
Hanahelin – discarding arable land
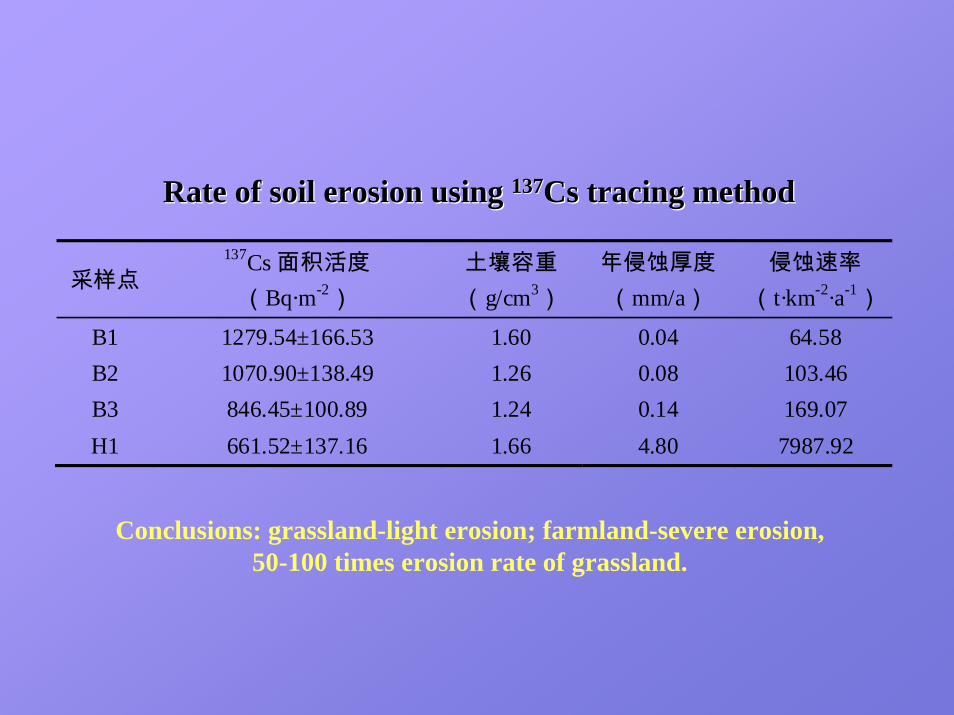
采样点 137Cs 面积活度
(Bq·m-2) 土壤容重 (g/cm3)
年侵蚀厚度(mm/a)
侵蚀速率(t·km-2·a-1)
B1 1279.54±166.53 1.60 0.04 64.58 B2 1070.90±138.49 1.26 0.08 103.46 B3 846.45±100.89 1.24 0.14 169.07 H1 661.52±137.16 1.66 4.80 7987.92
Rate of soil erosion using Rate of soil erosion using 137137Cs tracing method Cs tracing method
Conclusions: grassland-light erosion; farmland-severe erosion, 50-100 times erosion rate of grassland.
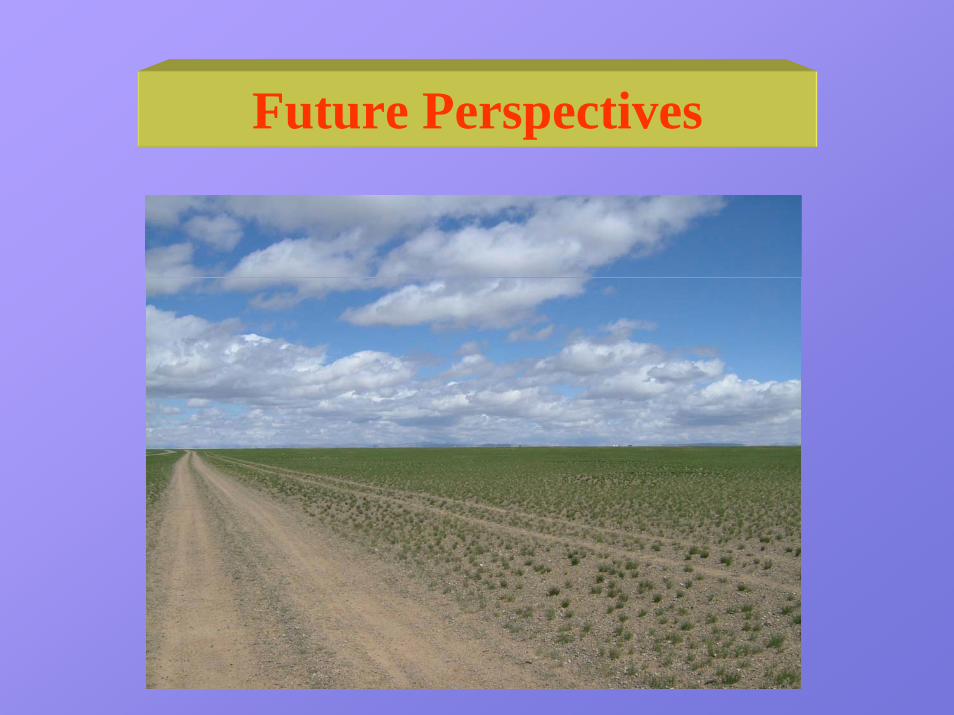
Future Perspectives
Joint scientific research• Joint survey on ecosystem-environment-socio-
economic consequences• Mapping LUCC• Remote Sensing Image and Landuse data base• Key ecosystem services and consumption
patterns• Soil erosion modeling & land degradation
drivers
Future Perspectives
Exchanges and Capacity Building
• Training• Joint master’s & doctoral program• Exchange of visiting scholars• Conference, seminars, workshops
Future Perspectives
Thank YouThank Youhttp://www.cas.ac.cnhttp://www.cas.ac.cn
http://www.igsnrr.ac.cnhttp://www.igsnrr.ac.cn