nyir 2015-122us industry monitor · pdf file1 us industry monitor ... the metal moves out of...
TRANSCRIPT

US Industry Monitor | 1ST APRIL 1
;
Industry Report
US Industry Monitor 2016 First Half Issue
Bank of Tokyo-Mitsubishi UFJ A member of MUFG, a global financial group
1ST APRIL 2016
【OVERVIEW】~ Modest Recovery Continues for US Business Environment. Impact of Low Commodity Prices Should be Monitored. While business environment remains challenging for the energy-related industries affected
by lower oil prices and material-related industries impacted by the strong dollar and weak commodity prices, consumer spending is solid. Real GDP increased at an annual rate of only 1.0% in the fourth quarter of 2015 on the back of a decline in energy-related demand due to a warm winter, but moderate recovery continues in the US business environment.
Looking ahead, crude oil prices are expected to stay depressed for the near term, and any material change is hard to hope for with regards to the strong dollar and weak commodity prices. However, consumer spending is forecasted to remain generally solid, and the overall business environment for the US industries is expected to continue its moderate recovery. Nevertheless, the impact of low crude oil and commodity prices and the outlook of the emerging economies continue to warrant close monitoring.
《The Outlook for Major Sectors and Indicators》
ENERGY: Crude oil prices are forecasted to remain depressed, as oversupply is expected to continue. Despite downward trending domestic tight oil production, demand is slowing in China and emerging markets. Natural gas prices are expected to stay low given continued oversupply, although demand from gas-fired power plants and exports could support prices. Cuts in energy-related capex should be monitored.
MATERIALS: Ethane-based producers in North America are maintaining a cost advantage over naphtha-based producers. However, challenging conditions continue as ethylene margins are narrowing on low oil prices. A decline in prices seems inevitable in steel, aluminum and other commodity prices given persistent oversupply.
INDUSTRIALS: Construction remains solid driven by residential but also relatively healthy in nonresidential such as manufacturing, office building and lodging. Commercial aircraft backlog remains high on favorable demand of new narrowbody aircraft. However, low oil prices have dampened replacement demand for newer, more fuel efficient aircraft.
CONSUMER DISCRETIONARY/STAPLES: The U.S. light vehicle sales remain favorable, forecasted to reach 17.5 million units for the full year 2016, as the moderate upward trend is expected to continue. Sales are strong particularly for CUVs and pickup trucks on lower gasoline prices. Overall retailing is generally expected to stay healthy. However, elevated risk of stock market volatility is driving consumers to remain selective, which in turn is making promotional pricing important.
HEALTHCARE: Record pace approvals of new drugs are leading pharma companies to benefit from both pricing and volumes. M&A has paused for now, but continued low interest rates could reactivate small- and mid-size deals to strengthen specific products.
IT: Smartphones remain favorable on growing demand from the emerging markets. The telecommunications industry is expected to continue its steady growth on the back of increased data usage boosted by OTT mobile video services among others.
US Industry Monitor | 1ST APRIL 2
Sector Industry Indicator Latest Data
Page
Energy Oil & Natural Gas
Crude Oil Prices and Global Demand / US Tight Oil Production
Feb 2016 Mar 2016
3
Natural Gas Prices and Production / Inventories
Feb 2016 3
Materials
Chemicals Ethylene Price Jan 2016 4
Container & Packaging Cardboard Box Shipments Jan 2016 4
Metals & Mining Steel Price/ Production / Import Jan 2016
5 Aluminum LME Spot Price / Inventory Feb 2016
Paper & Forest Products Paper Price Feb 2016 5
Industrial
Construction & Engineering Construction Expenditures Jan 2016 6
Aerospace & Defense Commercial Aircraft Orders and Backlog 3Q 2015 6
Industrial Machinery Machinery Order Jan 2016 7
Freight & Shipping Railroad Traffic 4Q 2015 7
Airlines Airline Revenue Passenger Miles Nov 2015 8
Consumer Discretionary
Auto & Auto parts Automobile Sales / Production Jan 2016 8
Media Ad Revenue Growth / Media Spend by Sector
4Q 2015 9
Hotels, Restaurants & Leisure Growth in Hotel Occupancy and Average Daily Room Rate (ADR)
4Q 2015 9
Consumer Discretionary Retailing
Same Store Sales 4Q 2015 10
Consumer Staples
Food & Staples Retailing Same Store Sales 4Q 2015 10
Healthcare
Healthcare Services Hospital Volume Growth / CPI 4Q 2015/ Jan 2016
11
Pharmaceuticals Pharmaceuticals Shipment / PPI Jan 2016 11
Medical Equipment Electromed - Instrument Manufacturing / PPI Jan 2016 12
Information Technology
IT Solution PC Shipment / Media Tablet and Smartphone Shipments
4Q 2015 12
IT Components Semiconductor Shipment / Equipment Bookings
Dec 2015 Jan 2016
13
Telecoms Telecommunications Wireless Subscription / Wireless ARPU 4Q 2015 13
Utilities Utilities Electricity Retail Sales / Wholesale Price 4Q 2015 Jan 2016
14
Appendix1 - Macro Indicators 4Q 2015 15
Appendix2 - Exchange Rates Feb 2016 16
Note: The "FORECAST" period in this edition is a short-term outlook (6 months-1 year).

US Industry Monitor | 1ST APRIL 3
1. Crude Oil Prices and Global Demand / US Tight Oil Production
Forecast: Pricing will remain range-bound, as crude will continue to be oversupplied
Crude pricing remains lower for longer. Although crude has rebounded sharply off the lows, currently averaging $31/bbl for WTI in February 2016, it still remains 39% below year ago levels. The WTI-Brent spread has compressed further to $2/bbl due to the expectation that crude will eventually be exported out of the US now that the export ban has been lifted.
Demand struggles. China and much of the rest of the emerging markets continue to experience slowing economic growth, which drives a deceleration in demand for the marginal barrel of crude.
US production declining. Tight oil production in the US, which drives the marginal barrel of supply, is continuing to decline, providing some support for crude oil pricing. US operators are expected to make a further 50% reduction in capex in 2016 in order to protect balance sheets in a “lower for longer” oil pricing environment. This will continue to pressure US production even lower.
Crude pricing will remain range-bound going forward. Globally crude will remain oversupplied for a number of years, as global economic growth stagnates, limiting the upside for crude going forward. Pricing support will come from production declines as operators continue to rein in spending.
2. Natural Gas Prices and Production / Inventories
Forecast: Pricing will remain range-bound close to multi-year lows
Natural gas at multi-year lows. Natural gas is approaching levels last seen 17 years ago, averaging $1.64/mmbtu in March 2016, as production continues to make record highs.
Inventories are at multi-year highs. Natural gas inventories have surpassed 5-year highs and are expected to remain elevated as demand is not expected to keep pace with supply growth.
Supply growth will be driven by the Northeast. Throughout the rest of the decade, supply growth will continue to come from the Northeast, driven by takeaway capacity expansions in the Marcellus and Utica shales. This region has competitive break-evens and cash operating costs, compared with shale gas plays in other parts of the US.
Pricing will remain range-bound close to current multi-year lows. Natural gas pricing will remain range-bound, with upside capped by production growth, while downside will be limited by cash costs, decline curves and the launch of exports to Mexico and LNG exports.
US Tight Oil Production
(Source: EIA) (Unit: Mbpd)
0
1,000
2,000
3,000
4,000
5,000
6,000
'07 '08 '09 '10 '11 '12 '13 '14 '15 '16
NiobraraEagle FordBakkenPermian
Natural Gas Prices and Production
(Source: Bloomberg) (Unit: $/mmbtu, bcfpd)
50
55
60
65
70
75
80
85
$0$2$4$6$8
$10$12$14$16
'06 '07 '08 '09 '10 '11 '12 '13 '14 '15 '16
Production (right)
Natural Gas Price (left)
Natural Gas Inventories
(Source: EIA) (Unit: bcf)
750
1750
2750
3750
5-yr range 5-yr average2015 2016

US Industry Monitor | 1ST APRIL 4
3. Ethylene Price Forecast: Ethylene pricing will firm up
Ethylene prices plummeted in 2H15 and hit some of the lowest levels since the recession. The collapse of crude oil prices, to which ethylene prices are pegged, dragged down ethylene prices.
Oil prices fell faster than feedstock costs, leading to steeply lower ethylene margins in North America. Nevertheless, domestic producers remain cost advantaged versus naphtha-based producers in Europe and Asia, as their ethane feedstock costs are at near-record lows amid ethane oversupply.
Ethylene prices will recover slightly. A mild rebound in crude oil prices, coupled with positive demand from derivatives and plans for more than 10% of North American ethylene cracker capacity to be off-line for maintenance and turn around activity in 1H16, will buoy ethylene prices.
4. Cardboard Box Shipments Forecast: More balanced market ahead
US box shipments decelerated in the second half of 2015, rising 0.9% y-o-y after recording 1.8% growth in the first half of the year, due largely to a tough comparison y-o-y with 2H14. Still, against a challenging macroeconomic backdrop, the data is favorable. US containerboard production was muted in 2H15 (+0.3%), an indication of more prudent output expansions as companies attempt to match supply with demand. Total inventories (mill and box plant) remain above their 10-year average; however, they have declined steadily since September 2015.
Continued positive growth going forward. The market is expected to come into better balance given recent capacity closures and containerboard producers’ greater resolve to keep inventories down. Some of the larger companies’ profitability may be affected by the strengthening US dollar through exports and looming capacity increases in China.
(Source: Bloomberg, IHS Chemical) (Unit: Cents / lb)
0
10
20
30
40
50
60
70
80
'06 '07 '08 '09 '10 '11 '12 '13 '14 '15 '16
Ethylene Price (Delivered pipeline, Gulf)
(Source: RISI) (Unit: Mil sq ft)
-15%
-10%
-5%
0%
5%
10%
15%
25
27
29
31
33
35
'06 '07 '08 '09 '10 '11 '12 '13 '14 '15 '16
Shipments Growth (Y/Y)

US Industry Monitor | 1ST APRIL 5
5. Steel Price / Production / Import, Aluminum LME Spot Price / Inventory
Forecast: Steel and aluminium markets continue to struggle with falling prices
Steel:
Hot-rolled coil (HRC) prices in the US continued their precipitous fall amid structural oversupply in the global steel market and pressure from cheap imports, particularly from China, in the US market. Cheap imports have prevented US producers from taking advantage of incremental demand gains coming from the auto and construction sectors. Falling orders forced US producers to make additional output cuts, with US crude steel production down 12.6% y-o-y in 2H15.
Prices will likely slightly weaken further before stabilizing. Though demand in the U.S. for steel should improve, import levels and price will be influenced by the results of pending trade cases against China and other countries.
Aluminum:
Average LME aluminum prices fell sharply in 2H15 amid weak fundamentals, notably sharply dropping LME stocks (meaning higher supply as the metal moves out of LME warehouses) and global overcapacity. Even though US and global demand continue to expand, capacity reductions are not enough to balance the market.
Prices will likely continue to fall. Inventories will continue to decline further due to the enforcement of the new LME stock rules. In fact, regional premiums are now declining as well, as LME holders attempt to liquidate positions within the market while still benefiting from some premium pricing. Overcapacity remain a theme as China continues to increase production and other stakeholders fail to shutter.
6. Paper Price Forecast: Paper prices of all grades will decline amid supply/demand imbalances
Overall paper demand continues to decline due to its substitution by electronic communication and the growing use of recycled materials.
The defection of readers and advertisers to online media is powering a steep decline in demand for newsprint. Despite paper mill closures, excess supply led to accelerated decline in newsprint prices, from -6.6% YoY in 1H15 to -15.1% in 2H15.
Electronic communications continue to supplant paper in offices. Weak demand also led to accelerated decline in uncoated freesheet prices, to -4.1% YoY in 2H15.
Linerboard prices are likely to fall as new container capacity comes on stream. After a period of stable and high linerboard prices since mid-2014, demand for corrugated packaging used for online shopping orders will likely lag planned capacity expansion, weighing on prices.
Steel Price, Production & Import
(Source: Bloomberg) (Unit: Million Tonne, US$/t)
0
200
400
600
800
1,000
1,200
0
2
4
6
8
10
12
'06 '07 '08 '09 '10 '11 '12 '13 '14 '15 '16
Production (left) Imports (left)Hot Rolled Prices (right)
Aluminum LME Spot Price/Inventory
(Source: Bloomberg) (Unit: $/t, '000t)
0
1,000
2,000
3,000
4,000
5,000
6,000
0
500
1,000
1,500
2,000
2,500
3,000
3,500
4,000
'08 '09 '10 '11 '12 '13 '14 '15 '16
LME
Sto
ck
LME
Spo
t Pric
e
LME Stock
LME Spot Price
(Source: Pulp & Paper Week) (Unit: $/Ton)
300
400
500
600
700
800
900
1,000
'06 '07 '08 '09 '10 '11 '12 '13 '14 '15 '16
Newsprint Uncoated Freesheet Linerboard

US Industry Monitor | 1ST APRIL 6
7. Construction Expenditures Forecast: Construction spending will increase on the back of continued housing recovery
Total construction in North America slowed somewhat in 2H15, but residential construction continued to gain steam. Growing by 13.2% YoY in 2H15, the value of residential construction put in place returned to levels not seen since before the recession, on the back of both higher prices and unit growth.
Manufacturing, lodging and office are the main drivers of non-residential construction spending growth. Sustained economic growth and rising employment levels will underpin further growth in these segments.
Residential construction will remain the main engine of construction spending growth. Housing starts, particularly multi-family housing starts, continued to rise at a double-digit rate in 2H15.
8. Commercial Aircraft Orders and Backlog Forecast: Backlogs will be flat on fewer orders and ramped up deliveries
Overall orders for commercial aircraft declined sharply in the first 3 quarters of 2015. Low jet fuel costs continue to reduce the urgency for airlines to replace their fleets with more fuel efficient aircraft.
But demand for narrowbody next generation aircraft remains strong. Orders for Airbus’ A320 neo and Boeing’s 737 Max continued to pour in even amid a decline in orders for other aircraft.
Industry backlogs remain at record levels. With no deliveries of the new models having been made yet, industry backlogs rose to new highs in 3Q15, even if at a much slower pace than in the same period the year before.
Manufacturers continue to ramp up production. Deliveries of narrow-bodies, such as A321ceo and B737-800 are spearheading production growth.
Fewer orders will lead to flat backlogs going forward. Despite strong airline traffic growth, low fuel costs will hamper a rebound in aircraft orders.
(Source: U.S. Census Bureau) (Unit:Billion US$)
-20%
-10%
0%
10%
20%
0
500
1,000
1,500
'06 '07 '08 '09 '10 '11 '12 '13 '14 '15 '16
ResidentialNon-Residential (Private)Non-Residential (Public)Growth (Y/Y)
(Source: Boeing, Airbus) (Unit: Thousand Units)
0.01.53.04.56.07.59.010.512.013.5
0.0
0.5
1.0
1.5
2.0
2.5
3.0
3.5
'06 '08 '10 '12 '14 Q1 Q3 Q1 Q3
Bac
klo
g
Ord
ers
Boeing Airbus Backlog
2014 2015 2016

US Industry Monitor | 1ST APRIL 7
9. Machinery Order Forecast: Machinery orders will likely be flat
New machinery orders declined last year, on the back of a 45.5% YoY plunge in orders for mining, oil and gas field machinery. Low commodity prices discouraged the construction of new oil and gas wells and curtailed mining activity last year.
Industrial machinery orders rebounded in 4Q15. After declining in the first three quarters, industrial machinery orders posted a 9.1% YoY growth in 4Q15, pointing to increased manufacturers’ confidence and likely future improvement in demand.
Construction machinery orders swung to weakness in 4Q15. After sustained growth in the first three quarters, construction machinery orders declined YoY in 4Q15, as the ongoing recovery in residential and non-residential construction in the U.S. could not offset weak demand from China and Latin America.
Machinery orders will likely be flat going forward, reflecting mixed trends. While industrial machinery orders will also grow further, they will be unable to offset weakness in other sectors amid slow economic growth in the U.S. and weak exports.
10. Railroad Traffic Forecast: : Continued weakness in railroad traffic ahead
Railroad ton-mile traffic fell by 8.4% in 2H15, on the back of sharply lower volumes of coal, metallic ores and metals, and petroleum and petroleum products.
The decline accelerated in the second half of the year. Coal, metals, and petroleum carloads plummeted by double-digit rates YoY in 2H15.
Motor vehicles and parts, grain, and intermodal units were the only carload categories that showed growth in 2H5, tempering slightly the pace of the overall carload contraction.
Railroad traffic will remain under pressure, on the back of persistent weakness in coal, metals and oil shipments. Ongoing oil glut along with lower exports to China and Latin America and increased competition from trucking will hamper a rebound in rail traffic.
(Source: U.S. Census Bureau) (Unit: Billion US$)
-50%-40%-30%-20%-10%0%10%20%30%40%50%
0
5
10
15
20
25
30
35
40
'06 '07 '08 '09 '10 '11 '12 '13 '14 '15 '16
New Order (SA) Y/Y % Change
(Source: Surface Transportation Board) (Unit: Billions)
-20%
-15%
-10%
-5%
0%
5%
10%
15%
20%
0
100
200
300
400
500
600
700
'06 '07 '08 '09 '10 '11 '12 '13 '14 '15 '16
Ton-Miles (left)Growth Ratio (Y/Y) (right)

US Industry Monitor | 1ST APRIL 8
11. Airline Revenue Passenger Miles Forecast: Traffic growth and low jet fuel costs will further bolster airline performance
Airline traffic growth on U.S. airlines accelerated in the course of 2015. Domestic RPM grew by an average 7.2% YoY in 2H15, up from 4.7% in 1H15.
International travel recovered slightly from its nearly flat YoY showing in the first half of the year. Slowing economic growth in emerging markets coupled with weak foreign currencies restrained visits to the U.S.
Airlines’ operating profitability is surging. Benefiting from low jet fuel costs, airlines’ operating profitability rose to record levels last year.
Airline profitability will strengthen further. Against the background of sustained economic growth and low jet fuel costs, airlines will continue to improve their performance, deploying their strong pricing power and disciplined capacity management.
12. Automobile Sales / Production Forecast: U.S. auto sales are expected to grow by 1% in 2016 but remain relatively flat in 2017
2015 U.S. car and light truck sales reached a record 17.39mn units, up 5.8% y/y from 16.44M a year earlier, and topped the previous record of 17.35mn set 15 years ago. 2016 is off to a good start with sales in the first two months tracking at 17.50mn SAAR, up 6.2% y/y. Elevated incentives, coupled with an improving labor market and low interest rates continue to support sales growth. Lower gasoline prices are also spurring sales of profitable CUVs and pickups. For now these factors are here to stay and provide near-term support to auto sales in 2016. Still, with the monthly SAAR at or above previous highs, the underlying momentum is moderating, suggesting that U.S. auto sales may be near peak. While we do not expect the SAAR to fall off a cliff anytime soon, we see slower growth in coming years. We expect U.S. auto sales to increase to 17.5mn units in 2016 but remain relatively flat in 2017.
North America auto factories churned out 17.44mn cars and light trucks in 2015, up 2.9% y/y and 1.6% above the previous record set in 2000. Car production fell -0.9% y/y with Canada and the U.S. reporting declines of -2.7% and -2.1%, but Mexico witnessed an increase of 2.7%. Overall light truck production rose by 5.6% y/y; output increased 7.1% in the U.S. and 11.1% in Mexico, but dropped -6.0% in Canada. North American production is expected to rise again in 2016, but at a slower pace of ~1.7% y/y.
(Source: U.S. Dept. of Transportation) (Unit: Billions)
-20%
-10%
0%
10%
20%
0
20
40
60
80
100
'06 '07 '08 '09 '10 '11 '12 '13 '14 '15 '16
Domestic RPMs International RPMs
Dom Growth (Y/Y) Int Growth (Y/Y)
US Light Vehicle Sales (SAAR)
(Source: Ward's AutoInfoBank) (Unit: Millions)
-40%
-20%
0%
20%
40%
0
5
10
15
20
25
30
'06 '07 '08 '09 '10 '11 '12 '13 '14 '15 '16
Litght TruckCarGrowth Rate (Y/Y)
North America Light Vehicle Production
(Source: Ward's AutoInfoBank) (Unit:Thousands)
-80%
-40%
0%
40%
80%
120%
160%
0
500
1,000
1,500
2,000
'06 '07 '08 '09 '10 '11 '12 '13 '14 '15 '16
Light TruckCarGrowth Rate (Y/Y)

US Industry Monitor | 1ST APRIL 9
13. Ad Revenue Growth / Media Spend by Sector
Forecast: Advertising market set to benefit from record political ad spending
Advertising market spend is rising. Market fundamentals remain healthy in respect to both pricing and demand. Following 3% growth in 2015, the U.S. ad spending market is seen advancing about 5% in 2016, benefiting from an expected record surge in political TV ad spending related to the presidential elections, as well as the 2016 Summer Olympics major sporting event.
Digital demand flourishes. Digital (the Internet) continues to be the biggest contributor of new ad dollars to the industry. Mobile advertising is gaining rapid acceptance and now accounts for roughly a quarter of total digital ad spend.
Publishing ad platforms remain in state of decline. The market is being hurt by secular industry shift from print to digital viewing platforms, which is shortening news cycles, eroding traditional revenue sources, and enabling new kinds of competition through lower barriers of entry. Vendors are targeting growing digital opportunities, but digital advertising currently accounts for a small portion of publish market revenue and will take time to have a noticeable impact on overall demand trends.
14. Growth in Hotel Occupancy and Average Daily Room Rate (ADR) Forecast: Slowing but still positive results
Occupancy growth is slowing, as was to be expected given strong comps in 2015 and the impact of supply growth. This trend is expected to continue into 2016 as slightly declining demand (due to continued economic uncertainty) will continue to meet slow and steady supply growth.
All major hotel chains are rapidly expanding their pipeline of new hotels, a trend that began in 2013 following the strong post-recession recovery in the industry. However, supply growth appears to remain controlled at about 2% – leading to expectations of supply / demand parity vs. oversupply.
Hotel markets continue to perform variably. Certain markets such as Houston are seeing weakness, driven by declining oil prices. Others such as Oahu, New Orleans and New York are seeing the negative impact of the higher dollar on tourism volumes.
Major operators Hyatt and Starwood are continuing to derisk by converting more properties to franchise and management agreements, which reduce exposure to performance risk but also impacts profitability with lower absolute EBITDA, albeit at higher margins .
U.S. Advertising Spend
(Source: Bloomberg) (Unit: Billion US$)
-20%
-15%
-10%
-5%
0%
5%
10%
30
35
40
45
50
55
60
'07 '08 '09 '10 '11 '12 '13 '14 '15 '16
Total U.S. Adver tising Y/Y Growth
Media Spend by Sector
(Source: Bloomberg) (Unit: Billion US$)
-2
2
6
10
14
18
'07 '08 '09 '10 '11 '12 '13 '14 '15 '16
Television Newspapers Magazines Digital (Internet)
(Source: Hotel New s Now ) (Unit: %)
-12-10-8-6-4-202468
1012
'06 '07 '08 '09 '10 '11 '12 '13 '14 '15 '16
Occupancy Growth (Y/Y)
ADR Growth (Y/Y)

US Industry Monitor | 1ST APRIL 10
15. Consumer Discretionary Retailing (Same Store Sales)
Forecast: Value consumers continue to dominate a weaker retail environment
A continued mixed economic environment continues to be a headwind for retailers, but is a good environment for discounters.
The overall characterization of the US consumer remains cautious and uncertain. Interestingly there are some possible signs of a shift in consumer mentality given the continued slow improvement in specialty apparel sales.
Household wealth continues to improve and unemployment is lower. High underemployment, weak labor participation and wage growth remain constraints. Lower- and middle-income consumers remain pressured.
The retailing environment continues to converge in terms of showing 0% - 5% growth. This is interestingly a potential positive as it shows a return to a more normalized, stable and predictable industry with fewer performance outliers.
Continued low oil prices should begin to carry through to retail sales in 2016. There is a strong correlation between declining oil prices and increased consumer spending – but usually only after 18 – 24 months of sustained oil price drops.
16. Food & Staples Retailing (Same Store Sales)
Forecast: Sectors appear stable despite ST negative cyclicality
While same store sales shows a ST downward tendency, this is driven by difficult comps and equity market volatility (which leads to consumer uncertainty) more than a fundamental shift.
Traditional supermarkets and supercenters / warehouse clubs continue their battle for the US food & staples consumer. Supermarkets in particular continue capital spending programs in order to improve the store experience as a differentiating competitive factor.
Promotional activity continues at a relatively high pace given that consumers continue to be value-oriented, even when perhaps moving to higher-priced channels.
Drug stores set to continue steady performance although the tailwind of the 2012 / 2013 patent cliff impact and initial Obamacare impact is beginning to abate.
(Source: Bloomberg) (Unit: Y/Y %)
-25-20-15-10-505
1015
'06 '07 '08 '09 '10 '11 '12 '13 '14 '15 '16
Specialty Apparel RetailersOff-Price RetailersDepartment StoresHigh-End Department Stores
(Source: Bloomberg) (Unit: Y/Y %)
-8-6-4-202468
1012
'06 '07 '08 '09 '10 '11 '12 '13 '14 '15 '16
SupermarketsSupercenters/Warehouse ClubsDrug Stores

US Industry Monitor | 1ST APRIL 11
17. Hospital Volume Growth / CPI Forecast: Obamacare impact beginning to wane combining with weak flu season
Increasing levels of insurance coverage and falling unemployment continues to bode well for improvements in hospital utilization and admissions.
Anniversarying of Obamacare implementation means that its impact is beginning to plateau. Additionally, 2015/2016 flu season has been extremely mild – which compared to last year’s stronger season is combining to show a slow-down in admissions growth.
Profitability continues its strong expansion on the back of both volume and pricing (as seen in CPI – Medical Care Services) growth.
Despite diminishing impact, over the next two to four years the impacts of Obamacare should continue to be a positive tailwind.
LT the stabilizing economy and rising tax receipts reduces acute funding pressure, but ST funding pressures always exist. So far, healthcare has not emerged as a major issue in the 2016 Presidential elections.
18. Pharmaceutical Shipment / PPI Forecast: Pharma continues its strong growth path
The US pharmaceutical industry continues to benefit from both strong pricing growth and increasing volumes.
Pharma pipelines continue to strengthen, particularly in oncology and other specialty therapeutic areas. The number of new drug approvals (particularly for specialty products) once again continued at a record pace in both the US and EU.
Spending pressure remains from both government and private payors. Given this, expectations are solidifying that pricing growth may begin to plateau and even retreat from current high levels. Smaller pricing increases may become more common as the industry falls under moral suasion given recent high-profile single-drug price increases.
M&A activity has taken a pause and equity market valuations have fallen dramatically. However, with still historically low interest rates, we believe these factors will combine to reignite acquisitions – albeit more from traditional large pharma companies who are looking to add individual products and technology platforms, rather than larger mergers.
(Source: Bloomberg, company reports, and MUB Corporate Research)
(5%)(4%)(3%)(2%)(1%)
0%1%2%3%4%5%
1Q081Q091Q101Q111Q121Q131Q141Q151Q16
Inpatient Admissions (Y/Y)Equivalent Admissions (Y/Y)
(Source: US Bureau of Labor Statistics)
0%
2%
4%
6%
8%
250
300
350
400
450
500
'06 '07 '08 '09 '10 '11 '12 '13 '14 '15 '16
CPI - Medical Care ServicesGrowth Rate (Y/Y)
(Base Period: 1982-84=100)
(Source: U.S. Census Bureau) (Unit: Billion US$)
-30%
-20%
-10%
0%
10%
20%
30%
02468
1012141618
'06 '07 '08 '09 '10 '11 '12 '13 '14 '15 '16
Pharmaceutical Shipments
Growth Rate (Y/Y)
(Source: US Bureau of Labor Statistics)
0%
2%
4%
6%
8%
10%
200
250
300
350
400
450
500
'06 '07 '08 '09 '10 '11 '12 '13 '14 '15 '16
PPI - Pharmaceutical and Medicine MfgGrowth Rate (Y/Y)
(Base: 12/82=100)

US Industry Monitor | 1ST APRIL 12
19. Medical Equipment (Electromed-Instrument Manufacturing / PPI)
Forecast: MedTech continues to suffer from a lack of innovation and differentiation
Volumes are maintaining their (barely) positive trend, driven by the growth in healthcare utilization, due to a somewhat stronger economy and the impact of reform on increased health insurance coverage.
Innovation continues to be seriously lacking in the industry’s product portfolio which continues to lead to an erosion in pricing as product commoditization continues to advance. Additionally, provider (and increasingly payor) consolidation also leads to softer pricing.
Product recalls and their impact on industry credibility continue to be a major headwind as well.
M&A continues apace and is increasingly becoming a major growth driver from anticipated synergies as opposed to top line benefits.
Emerging market weakness has removed the main driver of expected future growth. While in many cases volumes continue to grow, mix between lower- and higher-priced devices is sliding towards cheaper products.
20. PC Shipment / Media Tablet and Smartphone Shipments
Forecast: PC and tablet shipments weaken, while smartphone demand remains resilient
PC market trends deteriorate. The pace of PC market shipment declines accelerated in 2015 to 10%, as many enterprise customers already upgraded their PCs in 2014 due to Windows XP end of life support. Shipments are set to fall in the mid-single digits during 2016, reflecting longer-PC lifecycles and weak global demand from currency devaluation. Demand headwinds should begin to lessen in 2H16 amid better acceptance of Windows 10 and greater availability of new Skylake processor devices.
Tablet shipments turn negative. The tablet market continues to weaken amid increasing market saturation and higher competition from large screen smartphones. Market unit shipments fell some 10% in 2015 in contrast to the 5% growth posted in 2014. Shipment declines should moderate to the low-single digits in 2016, due to growing demand for 2-in-1 detachable devices.
Smartphone growth boosted by emerging markets. Driven by the continued success of low-cost devices in emerging markets, smartphone shipments increased a healthy 10% in 2015. With the majority of market growth centered on the price sensitive emerging markets, however, vendor profitably will likely be pressured on falling smartphone average selling prices.
(Source: U.S. Census Bureau) (Unit: Billion US$)
-30%
-20%
-10%
0%
10%
20%
30%
40%
0
2
4
6
8
10
12
'06 '07 '08 '09 '10 '11 '12 '13 '14 '15 '16
Value of Shipments Growth Rate (Y/Y)
(Source: US Bureau of Labor Statistics)
-0.5%
0.0%
0.5%
1.0%
1.5%
2.0%
2.5%
3.0%
100
105
110
115
120
'06 '07 '08 '09 '10 '11 '12 '13 '14 '15 '16
PPI - Medical Equipment & SuppliesGrowth Rate (Y/Y)
(Base: 12/03=100)
PC Shipments
(Source: BI Intelligence, Bloomberg) (Unit: Millions)
-20%
-10%
0%
10%
20%
30%
0
20
40
60
80
100
120
1Q09 1Q10 1Q11 1Q12 1Q13 1Q14 1Q15 1Q16
PC Shipments Y/Y Growth
Connected Device Shipments
(Source: BI Intelligence, Bloomberg) (Unit: Millions)
0
100
200
300
400
500
'09 '10 '11 '12 '13 '14 '15 '16
Smartphone Uni t Shipments
Media Tablet Unit Shipments
US Industry Monitor | 1ST APRIL 13
21. Semiconductor Shipment / Equipment Bookings
Forecast: Semiconductor market to return to modest growth in 2016
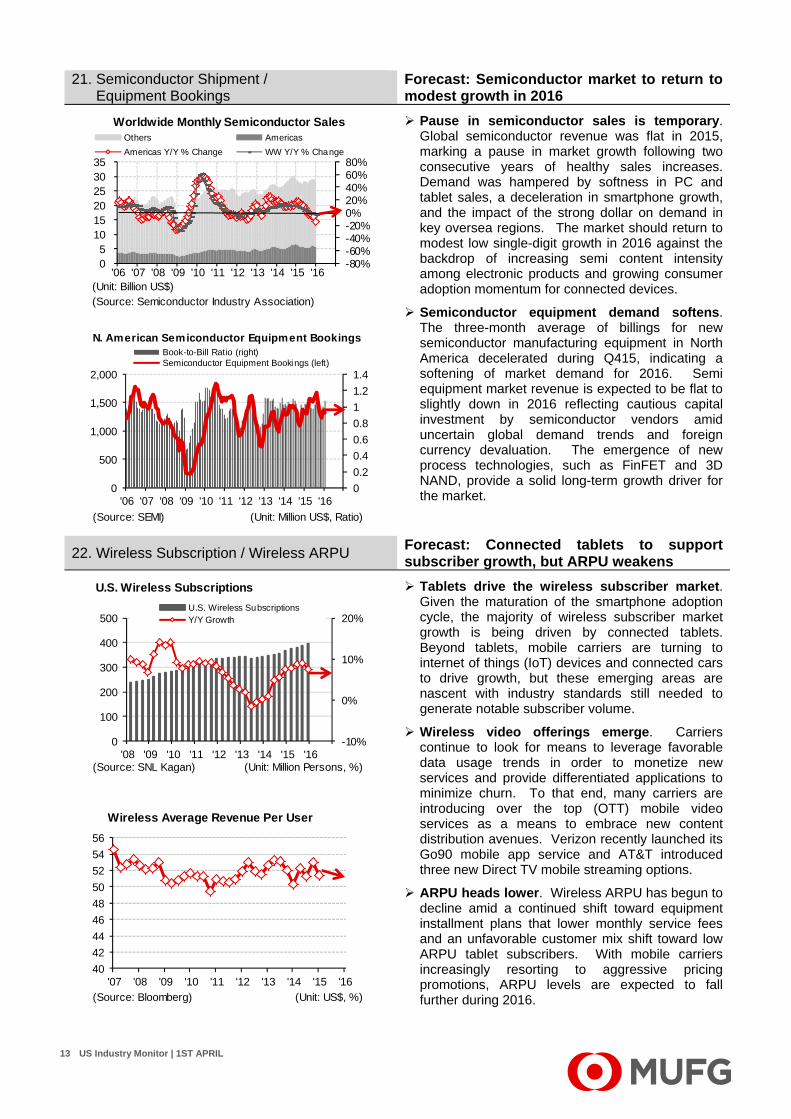
Pause in semiconductor sales is temporary. Global semiconductor revenue was flat in 2015, marking a pause in market growth following two consecutive years of healthy sales increases. Demand was hampered by softness in PC and tablet sales, a deceleration in smartphone growth, and the impact of the strong dollar on demand in key oversea regions. The market should return to modest low single-digit growth in 2016 against the backdrop of increasing semi content intensity among electronic products and growing consumer adoption momentum for connected devices.
Semiconductor equipment demand softens. The three-month average of billings for new semiconductor manufacturing equipment in North America decelerated during Q415, indicating a softening of market demand for 2016. Semi equipment market revenue is expected to be flat to slightly down in 2016 reflecting cautious capital investment by semiconductor vendors amid uncertain global demand trends and foreign currency devaluation. The emergence of new process technologies, such as FinFET and 3D NAND, provide a solid long-term growth driver for the market.
22. Wireless Subscription / Wireless ARPU Forecast: Connected tablets to support subscriber growth, but ARPU weakens
Tablets drive the wireless subscriber market. Given the maturation of the smartphone adoption cycle, the majority of wireless subscriber market growth is being driven by connected tablets. Beyond tablets, mobile carriers are turning to internet of things (IoT) devices and connected cars to drive growth, but these emerging areas are nascent with industry standards still needed to generate notable subscriber volume.
Wireless video offerings emerge. Carriers continue to look for means to leverage favorable data usage trends in order to monetize new services and provide differentiated applications to minimize churn. To that end, many carriers are introducing over the top (OTT) mobile video services as a means to embrace new content distribution avenues. Verizon recently launched its Go90 mobile app service and AT&T introduced three new Direct TV mobile streaming options.
ARPU heads lower. Wireless ARPU has begun to decline amid a continued shift toward equipment installment plans that lower monthly service fees and an unfavorable customer mix shift toward low ARPU tablet subscribers. With mobile carriers increasingly resorting to aggressive pricing promotions, ARPU levels are expected to fall further during 2016.
Worldwide Monthly Semiconductor Sales
(Unit: Billion US$) (Source: Semiconductor Industry Association)
-80%-60%-40%-20%0%20%40%60%80%
05
101520253035
'06 '07 '08 '09 '10 '11 '12 '13 '14 '15 '16
Others Americas
Americas Y/Y % Change WW Y/Y % Change
N. American Semiconductor Equipment Bookings
(Source: SEMI) (Unit: Million US$, Ratio)
0
0.2
0.4
0.6
0.8
1
1.2
1.4
0
500
1,000
1,500
2,000
'06 '07 '08 '09 '10 '11 '12 '13 '14 '15 '16
Book-to-Bill Ratio (right)Semiconductor Equipment Bookings (left)
U.S. Wireless Subscriptions
(Source: SNL Kagan) (Unit: Million Persons, %)
-10%
0%
10%
20%
0
100
200
300
400
500
'08 '09 '10 '11 '12 '13 '14 '15 '16
U.S. Wireless SubscriptionsY/Y Growth
Wireless Average Revenue Per User
(Source: Bloomberg) (Unit: US$, %)
40
42
44
46
48
50
52
54
56
'07 '08 '09 '10 '11 '12 '13 '14 '15 '16
US Industry Monitor | 1ST APRIL 14
23. Electricity Retail Sales / Wholesale Price Forecast: Power sales and pricing remain challenged
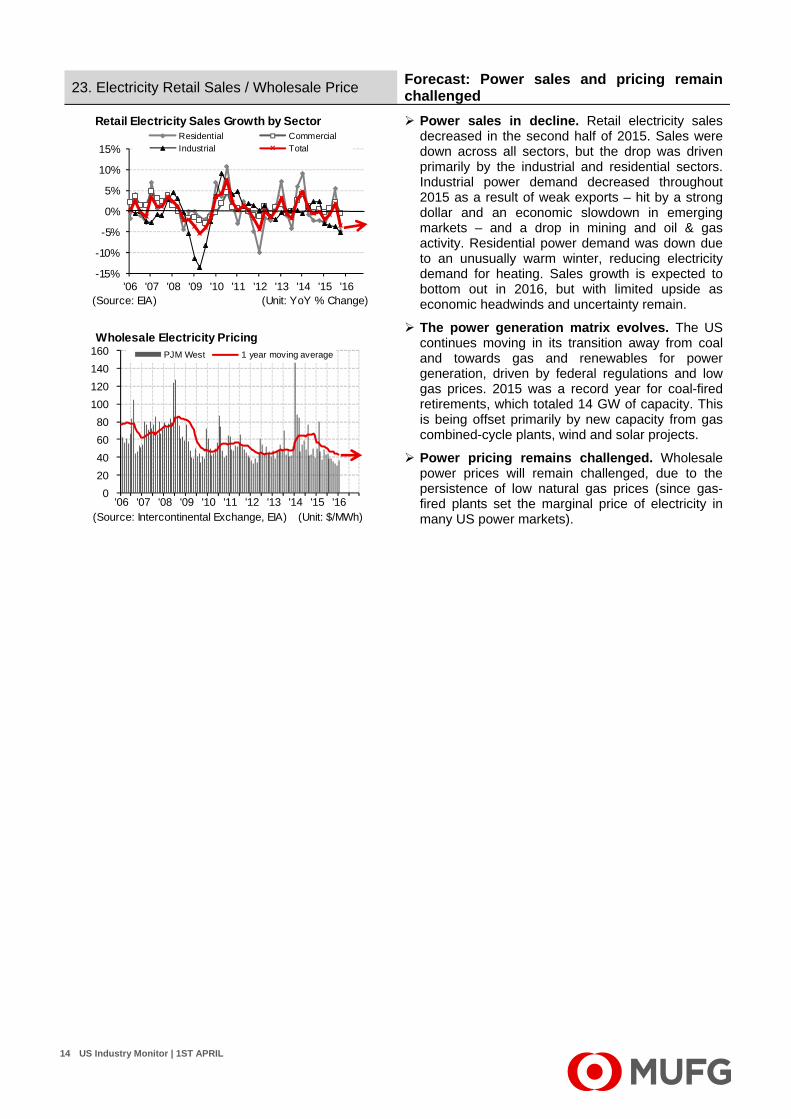
Power sales in decline. Retail electricity sales decreased in the second half of 2015. Sales were down across all sectors, but the drop was driven primarily by the industrial and residential sectors. Industrial power demand decreased throughout 2015 as a result of weak exports – hit by a strong dollar and an economic slowdown in emerging markets – and a drop in mining and oil & gas activity. Residential power demand was down due to an unusually warm winter, reducing electricity demand for heating. Sales growth is expected to bottom out in 2016, but with limited upside as economic headwinds and uncertainty remain.
The power generation matrix evolves. The US continues moving in its transition away from coal and towards gas and renewables for power generation, driven by federal regulations and low gas prices. 2015 was a record year for coal-fired retirements, which totaled 14 GW of capacity. This is being offset primarily by new capacity from gas combined-cycle plants, wind and solar projects.
Power pricing remains challenged. Wholesale power prices will remain challenged, due to the persistence of low natural gas prices (since gas-fired plants set the marginal price of electricity in many US power markets).
Retail Electricity Sales Growth by Sector
(Source: EIA) (Unit: YoY % Change)
-15%
-10%
-5%
0%
5%
10%
15%
'06 '07 '08 '09 '10 '11 '12 '13 '14 '15 '16
Residential CommercialIndustrial Total
Wholesale Electricity Pricing
(Source: Intercontinental Exchange, EIA) (Unit: $/MWh)
0
20
40
60
80
100
120
140
160
'06 '07 '08 '09 '10 '11 '12 '13 '14 '15 '16
PJM West 1 year moving average
US Industry Monitor | 1ST APRIL 15
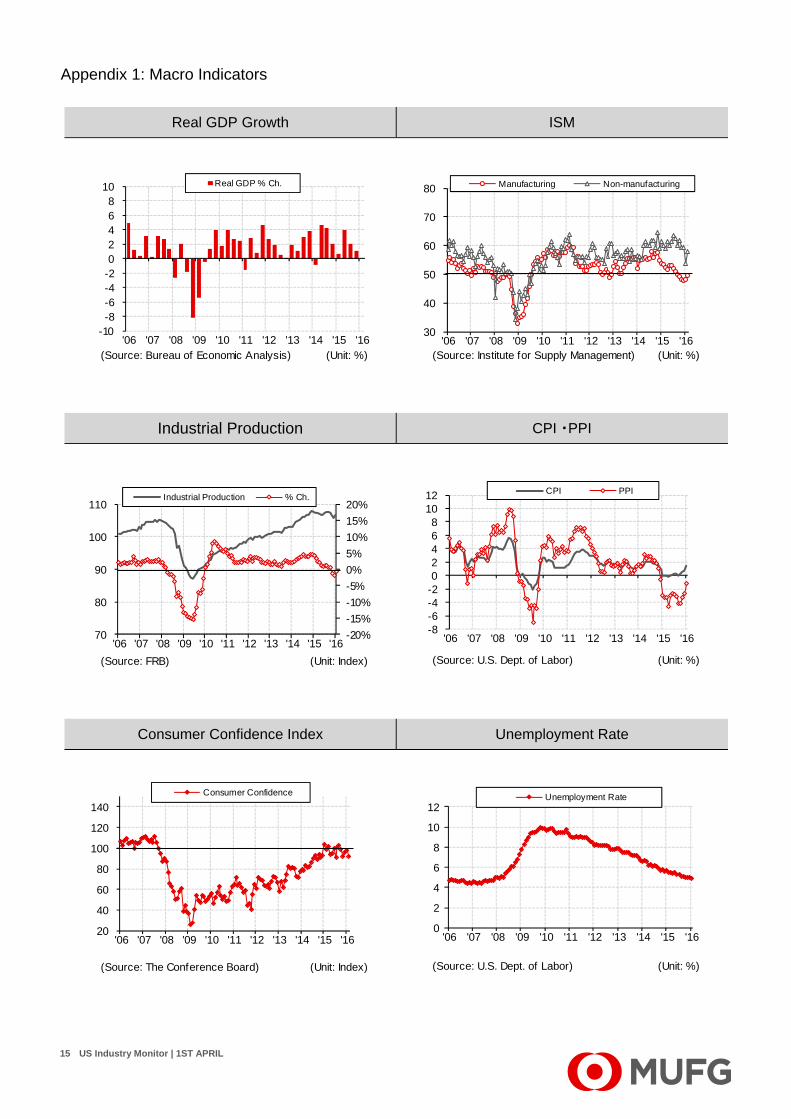
Real GDP Growth ISM
Industrial Production CPI ・PPI
Consumer Confidence Index Unemployment Rate
(Source: Bureau of Economic Analysis) (Unit: %)
-10-8-6-4-202468
10
'06 '07 '08 '09 '10 '11 '12 '13 '14 '15 '16
Real GDP % Ch.
(Source: Institute for Supply Management) (Unit: %)
30
40
50
60
70
80
'06 '07 '08 '09 '10 '11 '12 '13 '14 '15 '16
Manufacturing Non-manufacturing
(Source: FRB) (Unit: Index)
-20%
-15%
-10%
-5%
0%
5%
10%
15%
20%
70
80
90
100
110
'06 '07 '08 '09 '10 '11 '12 '13 '14 '15 '16
Industrial Production % Ch.
(Source: U.S. Dept. of Labor) (Unit: %)
-8-6-4-202468
1012
'06 '07 '08 '09 '10 '11 '12 '13 '14 '15 '16
CPI PPI
(Source: The Conference Board) (Unit: Index)
20
40
60
80
100
120
140
'06 '07 '08 '09 '10 '11 '12 '13 '14 '15 '16
Consumer Confidence
(Source: U.S. Dept. of Labor) (Unit: %)
0
2
4
6
8
10
12
'06 '07 '08 '09 '10 '11 '12 '13 '14 '15 '16
Unemployment Rate
Appendix 1: Macro Indicators

US Industry Monitor | 1ST APRIL 16
Euro British Pound
Canadian Dollar Japanese Yen
(Source: Bloomberg)
0.70
0.90
1.10
1.30
1.50
1.70
'06 '07 '08 '09 '10 '11 '12 '13 '14 '15 '16
Euro to US Dollar
(Source: Bloomberg)
1.25
1.50
1.75
2.00
2.25
'06 '07 '08 '09 '10 '11 '12 '13 '14 '15 '16
British Pound to US Dollar
(Source: Bloomberg)
0.80
1.00
1.20
1.40
1.60
1.80
'06 '07 '08 '09 '10 '11 '12 '13 '14 '15 '16
US Dollar to Canadian Dollar
(Source: Bloomberg)
60
80
100
120
140
160
'06 '07 '08 '09 '10 '11 '12 '13 '14 '15 '16
US Dollar to Japanese Yen
Appendix 2: Exchange Rates

US Industry Monitor | 1ST APRIL 17
Opinions, views and projections in this document have been made by Bank of Tokyo-Mitsubishi UFJ Corporate Research and do not necessarily reflect the view of other business units. They represent our perceptions at the date of publication and are subject to change without notice. This document has been prepared solely for the information purposes of professional investors and non-private customers of Bank of Tokyo-Mitsubishi UFJ and is not intended to constitute an offer or solicitation to buy or sell securities. Bank of Tokyo-Mitsubishi UFJ and its subsidiaries trade in securities, futures and other financial instruments and may have a position in any of the financial products, securities or instruments mentioned in this commentary. Information appearing in this document is obtained from sources believed to be reliable. However, we cannot guarantee its accuracy and no liability is accepted whatsoever for any direct or consequential loss arising from its use. Bank of Tokyo-Mitsubishi UFJ is regulated by the Financial Services Authority. Copyright © The Bank of Tokyo-Mitsubishi UFJ, Limited 2016 No part of this publication may be reproduced, stored in a retrieval system or transmitted without the prior written permission of The Bank of Tokyo-Mitsubishi UFJ Limited.
Publisher: BTMU Corporate Research
Tomoo Nishina +1-212-782- 5706 [email protected] Head of Corporate Research (New York)
Mayuko Hiramatsu 5707 [email protected] Auto & Autoparts
Vera Kalina-Levine 5705 [email protected] Chemicals, Industrials
Katia Tavarez 4057 [email protected] Consumer Related (LatAm), Agribusiness, Metals & Mining
Javed Siddique 4108 [email protected] Energy, Utilities
Robert Murillo 4260 [email protected] Energy, Utilities
Andreas Josef Dirnagl 5694 [email protected] Healthcare, Consumer Related (US/Canada)
Myrvet A. Cocoli 4826 [email protected] Healthcare, Consumer Related (US/Canada)
Ari Bensinger 5704 [email protected] Telecom, Media, Technology
Satoshi Kondo 5703 [email protected] Latin America & Asia
Yusuke Akiyama 4988 [email protected] Latin America & Asia (Asia Desk)
Yukiko Otteson 5700 [email protected] Data Researcher, Translator