nzx half year 2016 results analyst presentation€¦ · markets highlights 11 listing fees •...
TRANSCRIPT

NZX 2016 Half Year Results Presentation 17 August 2016

Summary of 1H 2016 performance
2

3
Summary 1H 2016 result (1/2)
1H 2016
($m)
1H 2015
($m)
Change
($m)
Change
(%)
Operating Revenue 37.9 34.4 3.5 10.3
Operating Expenditure 27.1 22.7 4.4 19.7
EBITDA 10.8 11.7 (0.9) (8.0%)
EBITDA Margin 28.0% 34.0%
NPAT ex Link NZ gain, impairment
and earnout adjustment4.0 6.2 (2.2) (34.9%)
Gain on sale of Link NZ - 11.8
Impairment and earnout adjustment 0.4 -
Reported NPAT 3.6 18.0 (14.4) (80.1%)
Fully Diluted EPS 1.3c 6.8c
Fully Diluted EPS ex Link NZ gain,
impairment & earnout adjustment1.5c 2.3c

Summary 1H 2016 result (2/2)
• 1H 2016 EBITDA, excluding the costs of Ralec litigation, was up 5.3% to $13.7m
- Markets EBITDA was up 10.2% to $19.1m with demonstrated operating leverage in the business
- Funds Services EBITDA was down 77.8% to $0.4m reflecting investment in both the growth of ETFs
and the NZX Wealth Technologies business
- Agri business EBITDA was down 37.0% to $0.3m
• Excluding the sale of Link NZ in 2015, the impairment of Agri brands and reassessment of potential
earn out payments, NPAT was down 34.7% to $4.0m due to:
- Lower operating earnings as a result of the growth in Ralec costs
- Higher amortisation expense following the acquisition of Apteryx (now NZX Wealth Technologies)
- Higher interest costs reflecting higher debt levels
- The cessation of associate earnings following the sale of Link NZ
4

1H 16 operational performance
• Strong performance from Markets business
- Substantial growth in trading activity - volumes up 35.8% over 1H 2015
- Listing and capital raising activity well up - $0.8b of new equity capital listed in 1H 2016, up 438.1% on 1H 2015
- Significant progress in broadening the franchise
▪ Continued rapid growth of debt market has seen market capitalisation of debt grow 71.1% in past 12 months
▪ Two NXT Market listings in 1H 2016 with good pipeline of further prospects
▪ Very successful launch of NZ milk price futures
- Deepening of markets highlighted by ratio of equity market capitalisation to GDP surpassing 50% in July 2016
• Growth in Funds Services business reflects strategic investments made in 2015
- SuperLife FUM growing strongly, particularly in high value KiwiSaver segment with FUM up 26.6%
- Smartshares growth from new suite of ETFs launched in 2014 and 2015, now 23 funds in portfolio across all major
asset classes
- NZX Wealth Technologies added to the portfolio, first major new client announced August
• Weak dairy sector weighed on performance of Agri business
• Costs inflated by Ralec trial expenses and costs of scaling up ETFs and NZX Wealth Technologies businesses
- Ralec trial completed in July, judgment expected Q4
- NZX Wealth Technologies making excellent progress towards profitability with new client win and a strong client
pipeline
5

6
$-
$2
$4
$6
$8
$10
$12
$14
$16
2015EBITDA
Growth inlisting fees
Growth insecurities
trading andclearing
Impact ofNZXWT
Impact ofnew ETFs
Decline inagri
publicationsbusiness
Other 2016EBITDA
before Raleccost increase
Increase inRalec costs
2016EBITDA
(M)
Drivers of change in 2016 EBITDA v 2015
Greatest impacts were from growth in capital markets and Ralec costs

Delivering against strategic objectives
7
“Capturing the opportunities” – Investor Day June 2015
Business Area Objective June 2015 Status
Markets Grow NXT Market 2 new listings in 1H 2016
Good pipeline of potential listing candidates
Bid on NZClear tender RBNZ decided to retain ownership of NZClear
Integrated settlement offer currently being developed
Create liquid milk hedging
tools
NZ milk price futures and options contracts launched
Early trading volumes very encouraging
Add to pool of clearing
participants in derivatives
5 clearers now participating in derivatives market
Funds Services Target 20+ ETFs 23 ETFs now offered by Smartshares covering all
major asset classes
Merge KiwiSaver schemes
and reinvigorate
smartkiwi merged into SuperLife
27% year on year growth in SuperLife KiwiSaver FUM
Grow group superannuation
business
4 new group superannuation mandates won in 2016
7% growth in superannuation FUM

Delivering against strategic objectives - continued
8
“Capturing the opportunities” – Investor Day June 2015
Business Area Objective June 2015 Status
Funds Services (cont.) Improve funds infrastructure Apteryx renamed NZX Wealth Technologies
First major new NZXWT client signed August 2016
Agri business Shift to corporate customer
base in agri data
21% year on year growth in agri data revenue, vast
majority coming from corporate segment
Manage print to online
transition in agri
New online subscription news product – AgriHQ Pulse
– launched 1H 2016
Industry conditions have eroded value from the print
franchise

Business area results
9

10
Results by business area
1H 2016 Markets
$m
Funds
services
$m
Agri
$m
Corporate1
$m
Group
$m
Revenue 25.3 6.5 6.1 - 37.9
Direct expenses (6.2) (6.1) (5.8) (9.0) (27.1)
EBITDA 19.1 0.4 0.3 (9.0) 10.8
1H 2015 Markets
$m
Funds
services
$m
Agri
$m
Corporate1
$m
Group
$m
Revenue 23.5 4.8 6.1 - 34.4
Direct expenses (6.1) (3.2) (5.6) (7.8) (22.7)
EBITDA 17.4 1.6 0.5 (7.8) 11.7
16/15 % change Markets
%
Funds
services
%
Agri
%
Corporate
%
Group
%
Revenue 7.9% 35.1% (0.3%) - 10.3%
Direct expenses 1.2% 91.4% 2.7% 16.6% 19.7%
EBITDA 10.2% (77.8%) (37.0%) 16.6% (8.0%)
1Includes Ralec costs
MarketsHighlights
11
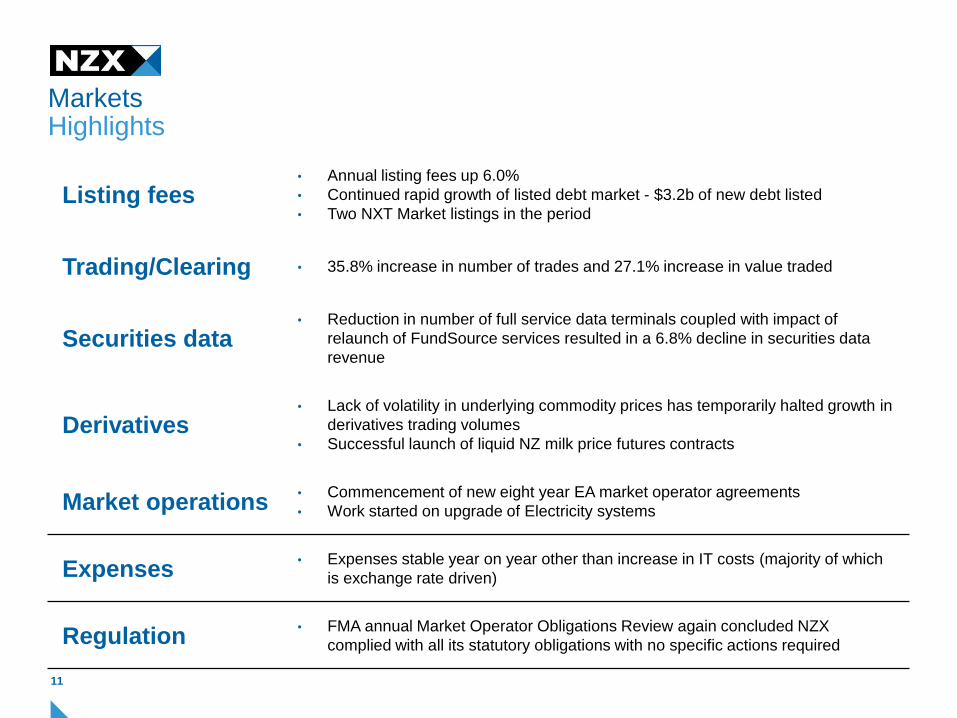
Listing fees• Annual listing fees up 6.0%
• Continued rapid growth of listed debt market - $3.2b of new debt listed
• Two NXT Market listings in the period
Trading/Clearing • 35.8% increase in number of trades and 27.1% increase in value traded
Securities data• Reduction in number of full service data terminals coupled with impact of
relaunch of FundSource services resulted in a 6.8% decline in securities data
revenue
Derivatives• Lack of volatility in underlying commodity prices has temporarily halted growth in
derivatives trading volumes
• Successful launch of liquid NZ milk price futures contracts
Market operations• Commencement of new eight year EA market operator agreements
• Work started on upgrade of Electricity systems
Expenses• Expenses stable year on year other than increase in IT costs (majority of which
is exchange rate driven)
Regulation• FMA annual Market Operator Obligations Review again concluded NZX
complied with all its statutory obligations with no specific actions required
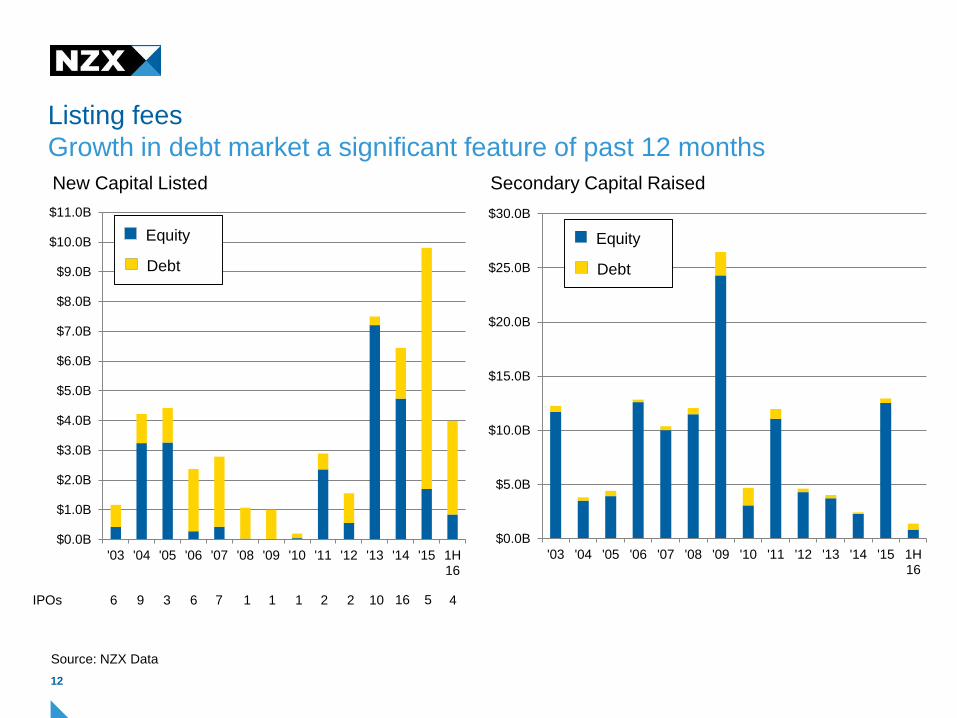
Listing fees
12
Growth in debt market a significant feature of past 12 months
$0.0B
$5.0B
$10.0B
$15.0B
$20.0B
$25.0B
$30.0B
'03 '04 '05 '06 '07 '08 '09 '10 '11 '12 '13 '14 '15 1H16
Source: NZX Data
$0.0B
$1.0B
$2.0B
$3.0B
$4.0B
$5.0B
$6.0B
$7.0B
$8.0B
$9.0B
$10.0B
$11.0B
'03 '04 '05 '06 '07 '08 '09 '10 '11 '12 '13 '14 '15 1H16
Secondary Capital RaisedNew Capital Listed
Equity
Debt
6 9 3 6 7 1 1 1021 2IPOs
Equity
Debt
16 5 4

0
5
10
15
20
25
HY2012 HY2013 HY2014 HY2015 HY2016
Value traded ($billion)
-
100
200
300
400
500
600
700
800
900
1,000
HY2012 HY2013 HY2014 HY2015 HY2016
Number of trades (000s)
Trading and clearing
13
Substantial growth in volume and value traded in 1H 2016
Source: NZX Data
25%
growth
36%
growth

14
Data terminals, derivatives
Drop in data terminal numbers impacts on data revenues, derivatives
slowed by lack of volatility in underlying commodity prices
6,200
6,400
6,600
6,800
7,000
7,200
7,400
7,600
7,800
Jan
-13
Ap
r-1
3
Jul-
13
Oct
-13
Jan
-14
Ap
r-1
4
Jul-
14
Oct
-14
Jan
-15
Ap
r-1
5
Jul-
15
Oct
-15
Jan
-16
Ap
r-1
6
Total terminal numbers
-
5,000
10,000
15,000
20,000
25,000
30,000
35,000
40,000
Jan
-11
Ma
y-1
1
Se
p-1
1
Jan
-12
Ma
y-1
2
Se
p-1
2
Jan
-13
Ma
y-1
3
Se
p-1
3
Jan
-14
Ma
y-1
4
Se
p-1
4
Jan
-15
Ma
y-1
5
Se
p-1
5
Jan
-16
Ma
y-1
6
Derivatives lots traded
Source: NZX Data

Funds ServicesHighlights
15
SuperLife• 26.6% growth in KiwiSaver FUM, 13.1% growth in total FUM
• Gained 4 new corporate superannuation clients during the period
Smartshares• $1.1b of SuperLife FUM now invested through Smartshares products
• 6.9% growth in external FUM
• 145.8% year on year growth in total units on issue
NZX Wealth
Technologies
• First major new client for NZX Wealth Technologies signed, with Craigs selecting
NZX as system provider for its KiwiSaver funds. Implementation project commenced
2H 2016
• Breakeven expected 1H 2017
Expenses• Increase in costs as a result of the acquisition of NZX Wealth Technologies and the
costs of operating new ETFs launched in 2015
Regulation
• Smartshares granted licence by FMA to operate as a manager of a registered
scheme under the Financial Markets Conduct Act (also covers SuperLife)
• Smartshares and SuperLife legal entities to amalgamate in 2H 2016 (brands to
remain separate)

16
Funds Under Management Growth
Smartshares ETFs
-
200
400
600
800
1,000
1,200
1,400
1,600
2014 2015 2016
FUM as at 30 June ($m)
KiwiSaver Superannuation
-
200
400
600
800
1,000
1,200
1,400
1,600
1,800
2014 2015 2016
FUM as at 30 June ($m)
External SuperLife
SuperLife
7%
growth
27%
growth 7%
growth
572%
growth
AgriHighlights
17
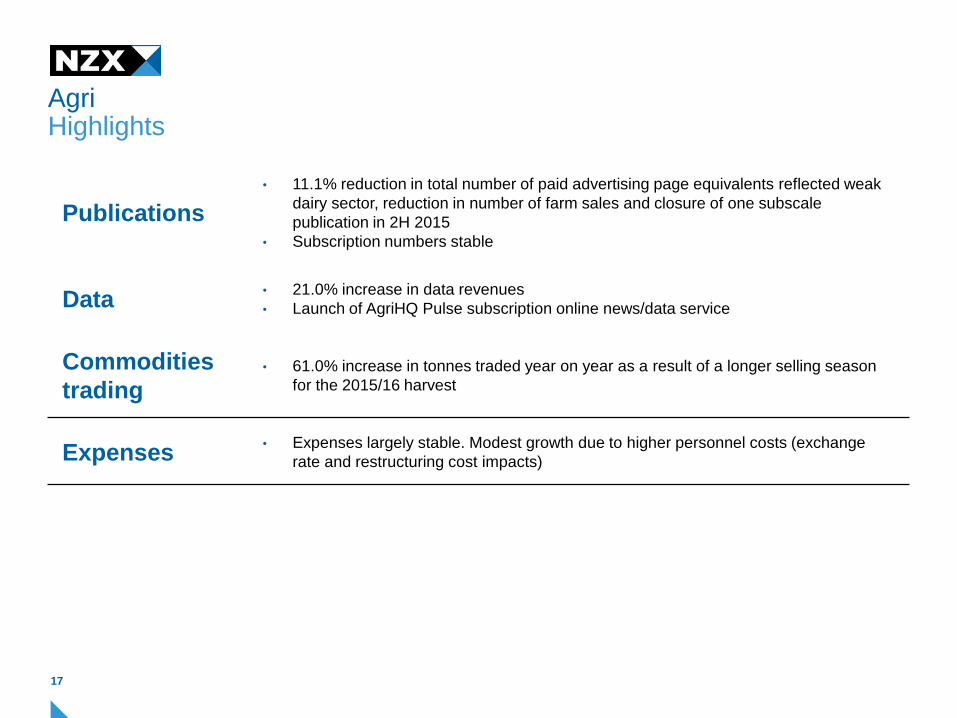
Publications
• 11.1% reduction in total number of paid advertising page equivalents reflected weak
dairy sector, reduction in number of farm sales and closure of one subscale
publication in 2H 2015
• Subscription numbers stable
Data• 21.0% increase in data revenues
• Launch of AgriHQ Pulse subscription online news/data service
Commodities
trading• 61.0% increase in tonnes traded year on year as a result of a longer selling season
for the 2015/16 harvest
Expenses• Expenses largely stable. Modest growth due to higher personnel costs (exchange
rate and restructuring cost impacts)

Agri information
18
Weak dairy prices continue to impact on advertising revenues
Period of drought
600
700
800
900
1,000
1,100
1,200
1,300
1,400
1,500
-25.0%
-20.0%
-15.0%
-10.0%
-5.0%
0.0%
5.0%
10.0%
15.0%
20.0%
25.0%
Q1 Q2 Q3 Q4 Q1 Q2 Q3 Q4 Q1 Q2 Q3 Q4 Q1 Q2 Q3 Q4 Q1 Q2
Advertising revenue change v PCP (LHS) GDT Price Index (RHS)
2012 2013 2014 2015 2016

Operating and capital expenditure
19
20
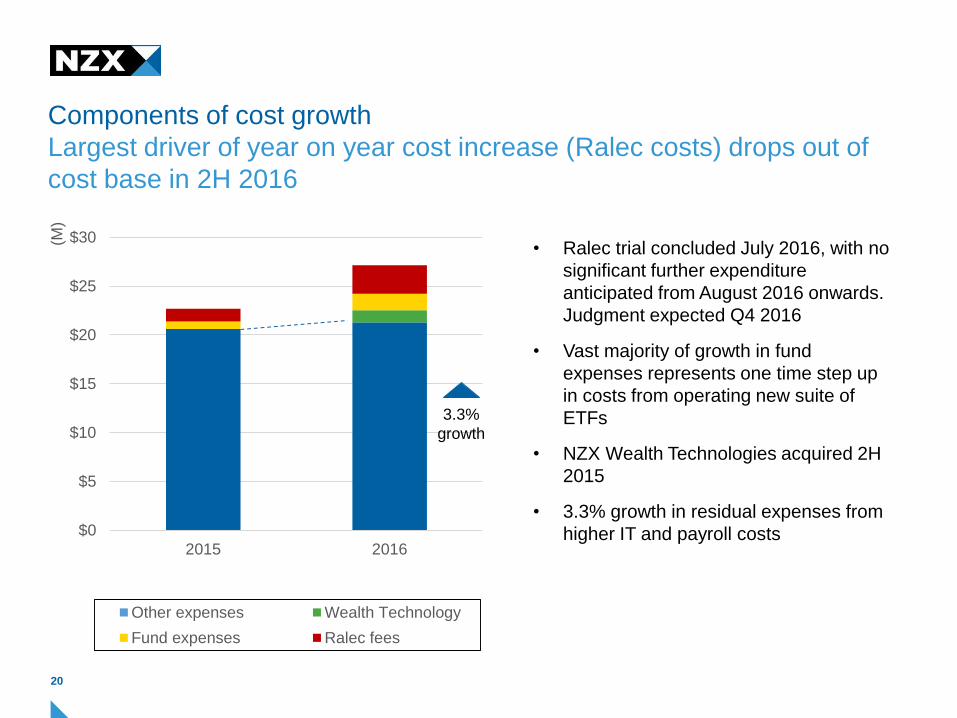
Components of cost growth
Largest driver of year on year cost increase (Ralec costs) drops out of
cost base in 2H 2016
$0
$5
$10
$15
$20
$25
$30
2015 2016
(M)
Other expenses Wealth Technology
Fund expenses Ralec fees
• Ralec trial concluded July 2016, with no
significant further expenditure
anticipated from August 2016 onwards.
Judgment expected Q4 2016
• Vast majority of growth in fund
expenses represents one time step up
in costs from operating new suite of
ETFs
• NZX Wealth Technologies acquired 2H
2015
• 3.3% growth in residual expenses from
higher IT and payroll costs
3.3%
growth

21
• The upgrade of NZX’s clearing system (BaNCS)
continued during 1H 2016 with approximately
$1.7m of costs capitalised. Completion is
currently expected in late 2016/early 2017
• The upgrade of the EA systems commenced
during the period with $0.5m of spend. This
project is scheduled to run through to late 2018
• SuperLife expenditure in 1H 2016 of $0.5m
included $0.35m for the upgrade and relocation
of SuperLife’s core infrastructure which was
completed in May 2016
• For the FY 2016, the Group currently anticipates
capital expenditure of $7m to $8m
Capex
Clearing systems upgrade, commencement of EA systems upgrade and
funds services activity key drivers of 1H 2016 capex
0
2
4
6
8
10
12
14
16
18
20
(M)
PP&E Other software Trading system
Clearing House Clear Grain M-co/EA systems
SuperLife NZX Wealth Tech

Outlook
22

Outlook for 2016Revenues
23
Business Area 2H 2016 Outlook
Markets • Capital raising
• Trading and clearing
• Good pipeline of small to medium sized listing candidates, outcomes will
be dependent on market conditions. Debt raising activity expected to
continue at levels above historical averages in 2H
• $785m of secondary equity capital raising occurred in July 2016 compared
to $832m in all of 1H 2016. Therefore expect uplift in secondary capital
raising in 2H 2016
• Sky TV/Vodafone NZ merger (and resulting substantial issue of new
capital by Sky TV) may complete before the end of 2016, timing
dependent on Commerce Commission approvals
• Annual listing fees
• Participant services
• Securities data
• Increase in market capitalisation and listing fee increases applicable 1 July
2016 will increase annual listing fees by approximately 10% relative to 1H
2016
• Securities data revenue expected to continue to be below 2015 levels in
2H 2016 due to lower terminal numbers and shift in product mix seen in
1H
• Dairy derivatives • Direction for derivatives volumes dependent on volatility in commodity
prices. If recent upturn in GDT prices continues, this would be expected to
flow through into higher derivatives volumes
• Launch of NZ milk price futures unlikely to have a significant impact in
2016 year
• Market operations • Similar levels of activity relative to 1H 2016 expected in 2H

Outlook for 2016Revenues
24
Business Area 2H 2016 Outlook
Funds Services • SuperLife
• Smartshares
• Growth potentially impacted by direction of equity markets, as significant
proportion of revenue based on % of FUM fees. July saw 4.4% increase
in FUM for the month on the back of momentum in equity markets
• Net funds inflow expected to maintain current trends
• NZX Wealth
Technologies
• Operating revenues from Craigs contract will commence in 1H 2017
Agri • Data
• Publications
• No meaningful improvement in advertising volumes anticipated until
there is a sustained lift in dairy prices and the forecast milk payout
• Data expected to continue to grow steadily

Outlook for 2016Expenses
25
Area 2H 2016 Outlook
Personnel costs • Additional development resources required in NZX Wealth Technologies to
customise platform for one client, however much of this cost will be capitalised
• Other staffing levels expected to be consistent with 1H
IT costs • Expect 2H costs to be in line with 1H trends
Professional fees • Ralec fees cease from August 2016 onwards. Total FY2016 spend expected to to
be around the top-end of $2.5m to $3.0m range due to an additional 3 weeks of trial
duration relative to initial expectations
• Some spend for FMCA transition in 2H 2016, otherwise costs will return to historical
levels ex Ralec
Marketing, print and
distribution
• Increase in marketing costs expected to promote funds management products
Fund expenses • Expect to be largely consistent with 1H as vast majority of costs of operating ETFs
are fixed
Other expenses • Largely in line with 1H
Outlook
• NZX continues to expect FY 2016 EBITDA to be in the range of $22.5m to $26.5. This is subject to
market outcomes, particularly with respect to IPOs, secondary capital raising, trading and clearing
volumes for equities and derivatives, and grain trading volumes
• Guidance assumes no material adverse events, significant one-off expenses or major accounting
adjustments
• It also assumes no acquisitions or divestments
26
Summary

Other information
27

1H 2016 dividend and capital structure
• Interim 2016 dividend of 3.0 cents declared
• Dividend to be fully imputed
• To be paid on 16 September for holdings as at 2 September
• Currently carrying higher cash balances than has historically been the case. No change
to capital structure expected in the current year, but will review position further in 2H 2016
28

Investor Information
29
For more information please contact:
www.nzx.com
nzxgroup.com
Tim Bennett Bevan Miller Hannah Lynch
CEO CFO Communications Manager
Email: [email protected] [email protected] [email protected]
Direct Line: +64 4 498 2817 +64 4 498 2271 +64 9 308 3710
Mobile: +64 27 518 5526 +64 21 276 7359 +64 21 252 8990