o l . 6, is s u e 2, ma y - o 2016 issn : 2249-5762 (online ... · pdf fileijrmet vo l. 6, is...
TRANSCRIPT

IJRMET Vol. 6, IssuE 2, May - ocT 2016 ISSN : 2249-5762 (Online) | ISSN : 2249-5770 (Print)
w w w . i j r m e t . c o m 36 INterNatIONal JOurNal Of reSearch IN MechaNIcal eNgINeerINg & techNOlOgy
FE Analysis of Joint Interfaces of FPSO Topside Module Through 1D to 3D Sub-Modeling Technique
Naveen AgrawalFE Analyst, Vadodara, Gujarat, India
AbstractFPSO is a floating vessel used for production, storage and offloading of oil. FPSO deck consists topside module structures which are large in size and every time need validation for stress concentration at their joint interfaces. Most of the engineers prefer to model large structures in Finite Element Analysis (FEA) using beam elements which is convenient and economical. However, it is difficult to extract the correct stresses at critical locations from beam model. To overcome this problem, the present paper is written to explain the integration of 1D model of global structure with 3D sub model of joint interface and evaluation of joint interfaces using sub-modeling technique where cut boundaries are taken from 1D global model of structures. Sub-modeling is a technique to provide more detailed and accurate stress results at area of interest. This technique allows fine mesh at critical location to capture correct geometry so that 3D model can provide more accurate results and can be used for further evaluation. Where existing traditional modeling approaches like 1D modeling does not give accurate stress results and 3D modeling approach is time consuming and expensive, proposed 1D to 3D modeling approach is the best fit for accurate stress results in less time. Hence current paper also focuses on comparing 1D to 3D sub-modeling technique with traditional 3D to 3D sub-modeling approach.
KeywordsFPSO, FEA, 1D, 3D, Sub-modeling, Offshore Structure
I. IntroductionFloating Production Storage and Offloading vessels (FPSO) are offshore production facilities that typically have processing equipment as well as storage for extracted crude oil. Offshore topside modules consist several parts which are the combination of beams and columns. Junction of beams and columns forms a joint interface. These joint interfaces experience stress concentrations which are a concern in structural integrity of system. Hence engineers and analyst experience the challenge to design and validate by analysis techniques of this structure.Offshore structures are generally validated using Finite Element Analysis (FEA) method. FE analysis operates on the concept of minimum error of approximation. This means that FEA algorithms tried to capture geometry as accurate as to minimize the chances of approximation. The key challenge with FEA is to get reliable, accurate and most economical results which is almost possible by using 3D elements like solid & shell. Hence 3D analysis is highly preferred and suggested. Though 1D elements like beam can produce most economical results but not reliable and accurate results. Creating 3D model of entire structure is time consuming task which in turn increase the computational time and cost as well. To overcome this problem, sub-modeling technique [1] is the most suitable solution where sub-model is created in 3D for joint interface and cut boundaries are taken from 1D global structure model. Sub-modeling is a technique to provide more detailed and accurate stress results at area of interest. This technique allows fine
mesh at critical location to capture correct geometry so that 3D model results can be more accurate and used for further evaluation. There is some approximation because cut boundaries are not taken from 3D global model, so there will be certain variation in results. This paper provides detailed explanation on sub-modeling technique which integrates 1D model of global structure with 3D sub model of joint interface. Along with this, paper focuses on comparing 1D to 3D sub-modeling technique with traditional 3D to 3D sub-modeling approach.
II. FPSO Structural ModelGenerally FPSO structures are mega structures which are built by joining several modules together. For current study, a simplified FPSO topside module is generated for analysis purpose which is made of structural steel. It is representation of general topside module structure. Basic dimensions of FPSO module [2] are:
Total structural members – 1421. European wide flange beams - HE600A & HE400A2. Standard channels for supports- RHS300x16, RHS200x83. Total height (elevation) - 14 m. 4. North (longitudinal) – 16 m.5. West (transvers) -8 m. 6.
The representative model of offshore topside module is illustrated in fig. 1.
Fig. 1: Representative Offshore Topside Module
III. Proposed Approach (1D-3D Sub-Modeling)
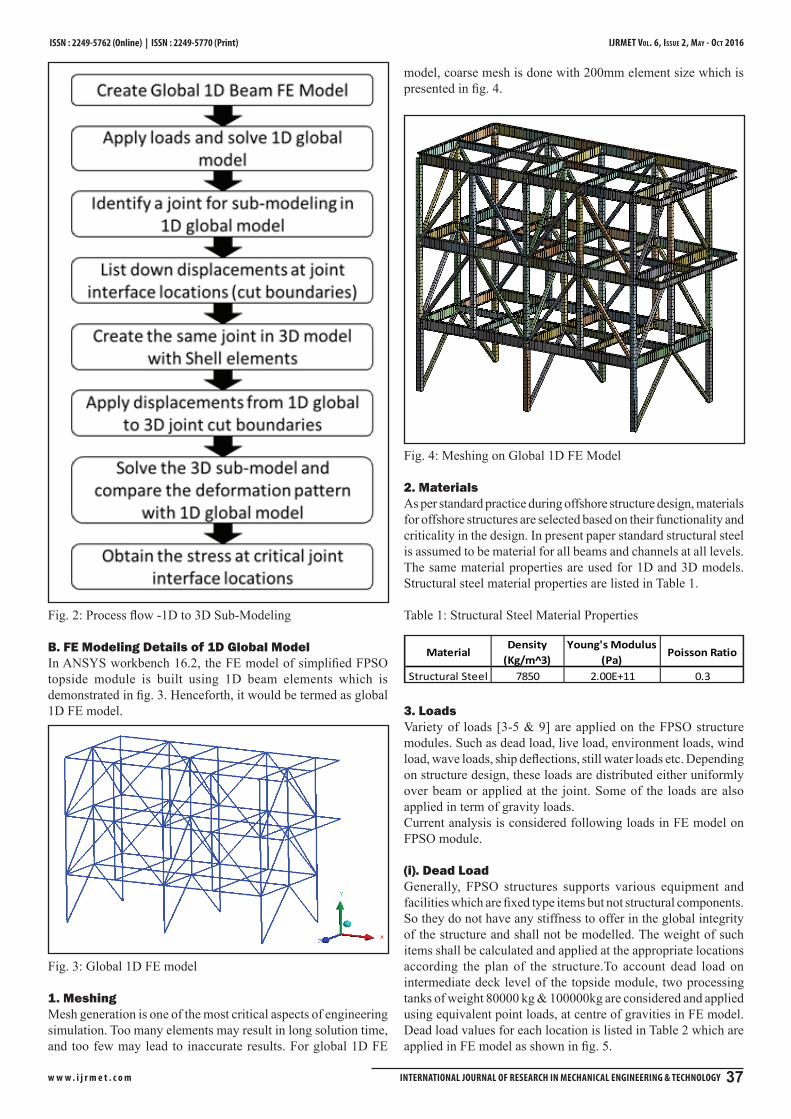
A. Process FlowSince 1D model is not suitable for stress evaluation and 3D global model creation is time consuming activity, hence 1D to 3D integration is the best suitable solution to overcome this problem. This section describes the step by step process [7] to perform 1D to 3D sub-modeling technique which is captured in fig. 2.
IJRMET Vol. 6, IssuE 2, May - ocT 2016
w w w . i j r m e t . c o m INterNatIONal JOurNal Of reSearch IN MechaNIcal eNgINeerINg & techNOlOgy 37
ISSN : 2249-5762 (Online) | ISSN : 2249-5770 (Print)
Fig. 2: Process flow -1D to 3D Sub-Modeling
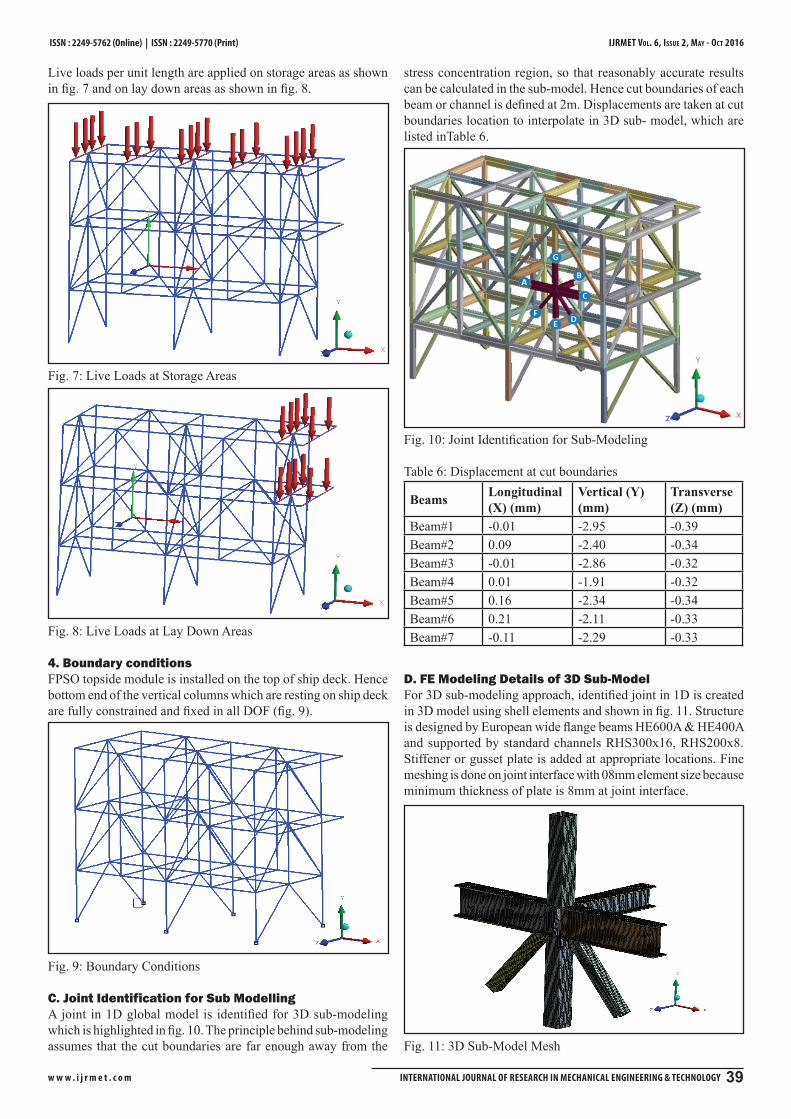
B. FE Modeling Details of 1D Global ModelIn ANSYS workbench 16.2, the FE model of simplified FPSO topside module is built using 1D beam elements which is demonstrated in fig. 3. Henceforth, it would be termed as global 1D FE model.
Fig. 3: Global 1D FE model
1. MeshingMesh generation is one of the most critical aspects of engineering simulation. Too many elements may result in long solution time, and too few may lead to inaccurate results. For global 1D FE
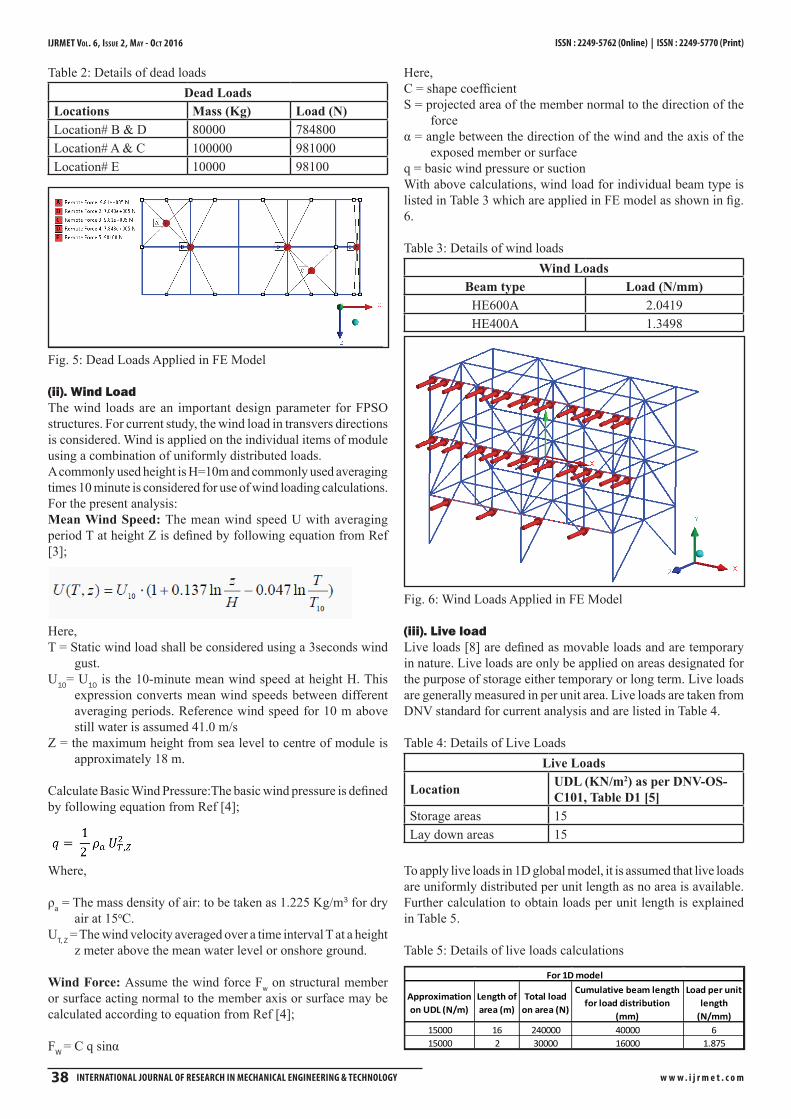
model, coarse mesh is done with 200mm element size which is presented in fig. 4.
Fig. 4: Meshing on Global 1D FE Model
2. MaterialsAs per standard practice during offshore structure design, materials for offshore structures are selected based on their functionality and criticality in the design. In present paper standard structural steel is assumed to be material for all beams and channels at all levels. The same material properties are used for 1D and 3D models. Structural steel material properties are listed in Table 1.
Table 1: Structural Steel Material Properties
MaterialDensity
(Kg/m^3)Young's Modulus
(Pa)Poisson Ratio
Structural Steel 7850 2.00E+11 0.3
3. LoadsVariety of loads [3-5 & 9] are applied on the FPSO structure modules. Such as dead load, live load, environment loads, wind load, wave loads, ship deflections, still water loads etc. Depending on structure design, these loads are distributed either uniformly over beam or applied at the joint. Some of the loads are also applied in term of gravity loads.Current analysis is considered following loads in FE model on FPSO module.
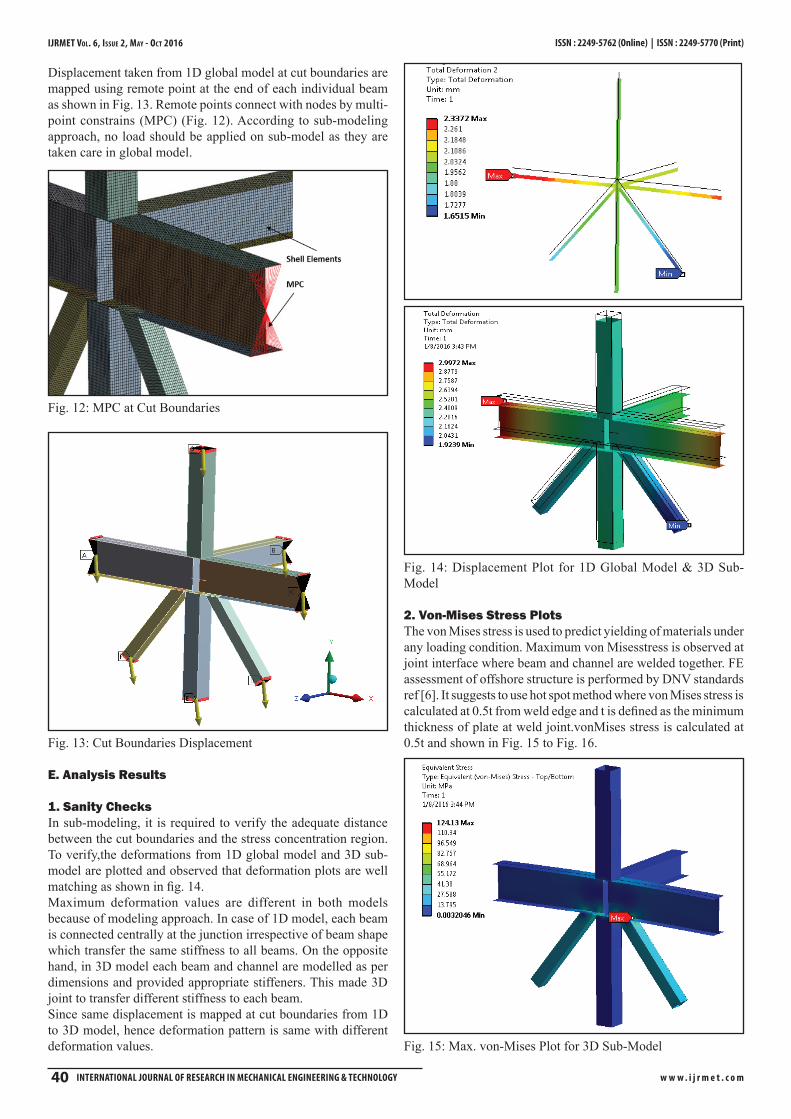
(i). Dead LoadGenerally, FPSO structures supports various equipment and facilities which are fixed type items but not structural components. So they do not have any stiffness to offer in the global integrity of the structure and shall not be modelled. The weight of such items shall be calculated and applied at the appropriate locations according the plan of the structure.To account dead load on intermediate deck level of the topside module, two processing tanks of weight 80000 kg & 100000kg are considered and applied using equivalent point loads, at centre of gravities in FE model. Dead load values for each location is listed in Table 2 which are applied in FE model as shown in fig. 5.
IJRMET Vol. 6, IssuE 2, May - ocT 2016 ISSN : 2249-5762 (Online) | ISSN : 2249-5770 (Print)
w w w . i j r m e t . c o m 38 INterNatIONal JOurNal Of reSearch IN MechaNIcal eNgINeerINg & techNOlOgy
Table 2: Details of dead loadsDead Loads
Locations Mass (Kg) Load (N)Location# B & D 80000 784800Location# A & C 100000 981000Location# E 10000 98100
Fig. 5: Dead Loads Applied in FE Model
(ii). Wind Load The wind loads are an important design parameter for FPSO structures. For current study, the wind load in transvers directions is considered. Wind is applied on the individual items of module using a combination of uniformly distributed loads.A commonly used height is H=10m and commonly used averaging times 10 minute is considered for use of wind loading calculations. For the present analysis:Mean Wind Speed: The mean wind speed U with averaging period T at height Z is defined by following equation from Ref [3];
Here,T = Static wind load shall be considered using a 3seconds wind
gust.U10= U10 is the 10-minute mean wind speed at height H. This
expression converts mean wind speeds between different averaging periods. Reference wind speed for 10 m above still water is assumed 41.0 m/s
Z = the maximum height from sea level to centre of module is approximately 18 m.
Calculate Basic Wind Pressure:The basic wind pressure is defined by following equation from Ref [4];
Where,
ρa = The mass density of air: to be taken as 1.225 Kg/m3 for dry air at 15oC.
UT, Z = The wind velocity averaged over a time interval T at a height z meter above the mean water level or onshore ground.
Wind Force: Assume the wind force Fw on structural member or surface acting normal to the member axis or surface may be calculated according to equation from Ref [4];
FW = C q sinα
Here,C = shape coefficientS = projected area of the member normal to the direction of the
forceα = angle between the direction of the wind and the axis of the
exposed member or surfaceq = basic wind pressure or suctionWith above calculations, wind load for individual beam type is listed in Table 3 which are applied in FE model as shown in fig. 6.
Table 3: Details of wind loadsWind Loads
Beam type Load (N/mm)HE600A 2.0419HE400A 1.3498
Fig. 6: Wind Loads Applied in FE Model
(iii). Live loadLive loads [8] are defined as movable loads and are temporary in nature. Live loads are only be applied on areas designated for the purpose of storage either temporary or long term. Live loads are generally measured in per unit area. Live loads are taken from DNV standard for current analysis and are listed in Table 4.
Table 4: Details of Live LoadsLive Loads
Location UDL (KN/m2) as per DNV-OS-C101, Table D1 [5]
Storage areas 15Lay down areas 15
To apply live loads in 1D global model, it is assumed that live loads are uniformly distributed per unit length as no area is available. Further calculation to obtain loads per unit length is explained in Table 5.
Table 5: Details of live loads calculations
Approximation on UDL (N/m)
Length of area (m)
Total load on area (N)
Cumulative beam length for load distribution
(mm)
Load per unit length
(N/mm)15000 16 240000 40000 615000 2 30000 16000 1.875
For 1D model
IJRMET Vol. 6, IssuE 2, May - ocT 2016
w w w . i j r m e t . c o m INterNatIONal JOurNal Of reSearch IN MechaNIcal eNgINeerINg & techNOlOgy 39
ISSN : 2249-5762 (Online) | ISSN : 2249-5770 (Print)
Live loads per unit length are applied on storage areas as shown in fig. 7 and on lay down areas as shown in fig. 8.
Fig. 7: Live Loads at Storage Areas
Fig. 8: Live Loads at Lay Down Areas
4. Boundary conditionsFPSO topside module is installed on the top of ship deck. Hence bottom end of the vertical columns which are resting on ship deck are fully constrained and fixed in all DOF (fig. 9).
Fig. 9: Boundary Conditions
C. Joint Identification for Sub ModellingA joint in 1D global model is identified for 3D sub-modeling which is highlighted in fig. 10. The principle behind sub-modeling assumes that the cut boundaries are far enough away from the
stress concentration region, so that reasonably accurate results can be calculated in the sub-model. Hence cut boundaries of each beam or channel is defined at 2m. Displacements are taken at cut boundaries location to interpolate in 3D sub- model, which are listed inTable 6.
Fig. 10: Joint Identification for Sub-Modeling
Table 6: Displacement at cut boundaries
Beams Longitudinal (X) (mm)
Vertical (Y) (mm)
Transverse (Z) (mm)
Beam#1 -0.01 -2.95 -0.39Beam#2 0.09 -2.40 -0.34Beam#3 -0.01 -2.86 -0.32Beam#4 0.01 -1.91 -0.32Beam#5 0.16 -2.34 -0.34Beam#6 0.21 -2.11 -0.33Beam#7 -0.11 -2.29 -0.33
D. FE Modeling Details of 3D Sub-ModelFor 3D sub-modeling approach, identified joint in 1D is created in 3D model using shell elements and shown in fig. 11. Structure is designed by European wide flange beams HE600A & HE400A and supported by standard channels RHS300x16, RHS200x8. Stiffener or gusset plate is added at appropriate locations. Fine meshing is done on joint interface with 08mm element size because minimum thickness of plate is 8mm at joint interface.
Fig. 11: 3D Sub-Model Mesh
IJRMET Vol. 6, IssuE 2, May - ocT 2016 ISSN : 2249-5762 (Online) | ISSN : 2249-5770 (Print)
w w w . i j r m e t . c o m 40 INterNatIONal JOurNal Of reSearch IN MechaNIcal eNgINeerINg & techNOlOgy
Displacement taken from 1D global model at cut boundaries are mapped using remote point at the end of each individual beam as shown in Fig. 13. Remote points connect with nodes by multi-point constrains (MPC) (Fig. 12). According to sub-modeling approach, no load should be applied on sub-model as they are taken care in global model.
Fig. 12: MPC at Cut Boundaries
Fig. 13: Cut Boundaries Displacement
E. Analysis Results
1. Sanity ChecksIn sub-modeling, it is required to verify the adequate distance between the cut boundaries and the stress concentration region. To verify,the deformations from 1D global model and 3D sub-model are plotted and observed that deformation plots are well matching as shown in fig. 14.Maximum deformation values are different in both models because of modeling approach. In case of 1D model, each beam is connected centrally at the junction irrespective of beam shape which transfer the same stiffness to all beams. On the opposite hand, in 3D model each beam and channel are modelled as per dimensions and provided appropriate stiffeners. This made 3D joint to transfer different stiffness to each beam. Since same displacement is mapped at cut boundaries from 1D to 3D model, hence deformation pattern is same with different deformation values.
Fig. 14: Displacement Plot for 1D Global Model & 3D Sub-Model
2. Von-Mises Stress PlotsThe von Mises stress is used to predict yielding of materials under any loading condition. Maximum von Misesstress is observed at joint interface where beam and channel are welded together. FE assessment of offshore structure is performed by DNV standards ref [6]. It suggests to use hot spot method where von Mises stress is calculated at 0.5t from weld edge and t is defined as the minimum thickness of plate at weld joint.vonMises stress is calculated at 0.5t and shown in Fig. 15 to Fig. 16.
Fig. 15: Max. von-Mises Plot for 3D Sub-Model

IJRMET Vol. 6, IssuE 2, May - ocT 2016
w w w . i j r m e t . c o m INterNatIONal JOurNal Of reSearch IN MechaNIcal eNgINeerINg & techNOlOgy 41
ISSN : 2249-5762 (Online) | ISSN : 2249-5770 (Print)
Fig. 16: Von-Mises Plot at t &0.5t Distance (Cont.)
III. Traditional Approach (3D-3D Sub-Modeling)
A. FE Modeling DetailsProposed approach of 1D to 3D sub-modeling maps inputs from 1D model which may have variation in values as compared to 3D model. To believe on results, a comparison is done with traditional approach where global model is made with 3D elements and cut boundaries of sub-model is mapped with displacement values from 3D global model. Global 3D model is meshed with same element size of 200mm which is captured inFigure 17. Same dead load, wind load & live loads are applied on global 3D modelwhich are shown in Figure 18.On shell model of 1D beam, uniformly distributed loads are converted in to force & applied over shell body in terms of force magnitude. Same boundary conditions on 3D global model is applied as explained in section [II.D].
Fig. 17: Meshed 3D Global Model
For traditional 3D sub-modelling approach, same 3D sub-model is taken as described in section [4]. In this case, displacements from the global 3D model are mapped to cut boundaries of the sub-model as shown in Fig. 19.
Fig. 18: Loading Details on 3D Global Model
Fig. 19: Displacement Mapping at Cut Boundaries in Sub-Model

IJRMET Vol. 6, IssuE 2, May - ocT 2016 ISSN : 2249-5762 (Online) | ISSN : 2249-5770 (Print)
w w w . i j r m e t . c o m 42 INterNatIONal JOurNal Of reSearch IN MechaNIcal eNgINeerINg & techNOlOgy
B. Analysis Results
1. Sanity ChecksSimilar verification is done as mentioned in section [V.A]. Hence deformations from 3D global model & sub-model for joint interface are plotted and found that deformation pattern is identical with equal maximum displacement value (Fig. 20).
Fig. 20: Comparative Displacements
Another verification on reaction forces at fixed boundary condition can be done for 1D and 3D global models. It is found in Table 7 that reaction forces obtained from 1D global model are in line with reactions forces from 3D global model which confirms the same applied loading in both the models.
Table 7: Reaction force details
Model Fx (N) Fy (N) Fz (N)
1D Global Model 0 3929700 103410
3D Global Model 0 3929700 103410
2. Von-Mises Stress PlotsMaximum von-Mises stresses from 3D global model and sub-model are shown in fig. 21 & fig. 22. Both models are exhibiting different maximum stress values. It is because of mesh size. Global model is meshed with very coarse mesh of 200mm size whereas sub-model is meshed with fine meshing of 8mm sizing. So coarse mesh model shows less stress as compared to fine mesh model (Table 8) which is desired outcome from sub-modeling technique. von-Mises stress is calculated at 0.5t in sub-model which is shown in fig. 23.
Table 8: Comparative von-Mises Stresses(MPa) Details
Stress locations 3D Global Model
3D Sub model
Maximum stress at same location of 1D model 69.5 116.2
Maximum stress at 0.5tdistance 69.1 110
Fig. 21: von-Mises plot for 3D global model
Fig. 22: von-Mises Plot for 3D Sub-Model
Fig. 23: von-Mises plot at 0.5t distance (Cont.)
IJRMET Vol. 6, IssuE 2, May - ocT 2016
w w w . i j r m e t . c o m INterNatIONal JOurNal Of reSearch IN MechaNIcal eNgINeerINg & techNOlOgy 43
ISSN : 2249-5762 (Online) | ISSN : 2249-5770 (Print)
IV. Comparison of Proposed Approach With Traditional ApproachThe comparative study between proposed approach (1D-3D sub-modeling) and traditional approach (3D-3D sub-modeling) shows following observations:
The models are behaving in similar fashion which is justified 1. by deformation pattern (Fig. 14 & Fig. 20). Therefore it is confirmed that both models are simulated accurately and analogous to each other. Higher von-Mises stresses in proposed sub-modeling 2. technique is observed as compared to traditional sub-modeling technique, keeping sub-modeling approach same. Therefore it is confirmed that proposed sub-modeling technique is more conservative in nature. Comparative deformations are listed in Table 9.
Table 9: Comparative von-Mises Stresses
Stress locations
Proposed Sub-Modeling Technique (1D-3D sub model)
Traditional Sub-Modeling Technique (3D-3D sub model)
% Difference
At maximum stress location
124.13 116.2 7%
Maximum stress at 0.5t distance
118 110 7%
3. 3D modeling approach is done with detail joint modeling whereas 1D modeling is done just to represent the joint model. Because of this, global displacements are mapped differently in both sub-modeling approach and found proposed sub-modeling to be more conservative.
V. ConclusionThis paper makes an attempt to provide synopsis of both sub-modeling approaches for structural integrity of offshore structures. Sub-modeling technique is well known technique which is available in all FE software. Hence detailing on sub-modeling technique is kept excluded from this paper. The paper also provides reasoning to select correct technique as per the availability of time & cost for FEA execution of offshore structures. 3D modeling as per drawings and dimensions with appropriate mesh always gives accurate results, which is best suitable when huge time and budget is available. Else 1D modeling is the option with compromising in design factors. Comparative study of both approaches concludes that proposed sub-modeling approach is analogous to traditional approach and it is more conservative as it is ~7% overestimating stress. These results are drawn from a simplified FPSO structure which is comparable to original FPSO structures.Author made an attempt to provide and share his experience in this paper. This paper provides readers to opt any of the technique to analyse offshore structure as per the requirement.
VI. AcknowledgmentsThe author is grateful to all colleagues who supported directly indirectly on my paper work.
References[1] ANSYS. (2015). ANSYS HELP - Release 16.2. Retrieved from
ANSYS HELP VIEWER: help/wb_sim/ds_submodeling.html
[2] Bahar, M. H.,"Analytical & Numerical Analysis of Ship/FPSO Side Structures Subjected to Extreme Loading with Emphasis of Ice Actions", Norwegian: Norwegian University of Science and Technology, pp. 34-35, 2014.
[3] Det Norske Veritas,"Environmental Conditions and Environmental Loads", DNV-RP-C205, pp. 16, 2010.
[4] Det Norske Veritas,"Environmental Conditions and Environmental Loads", DNV-RP-C205, pp. 47, 2010.
[5] Det Norske Veritas,"Design of Offshore Steel Structures, General", DNV-OS-C101, pp. 23, Table D1, 2011.
[6] DET NORSKE VERITAS. (2012). Fatigue Design of Offshore Steel Structures. DNV-RP-C203, pp. 46-55.
[7] EdzardBrünner, H. v.,"Fatigue Analysis and condition assessment of FPSO structures", TSCF Shipbuilding Meeting, pp. 1-2, TSCF, 2007.
[8] Lars O. Henriksen, B. D.,"Structural Design and analysis of FPSO Topside Module", ABS Technical Paper, pp. 157, 2008.
[9] T. Terpstra, B. D.,"FPSO Design and Conversion: A Desiger’s Approach", OTC 13210. OTC, 2001.
Naveen Agrawal received his B.Tech. degree in Mechanical Engineering from National Institute of Technology Calicut, Kerala, India, in 2005, and the PGDBA in Operation Management from Symbiosis Centre for Distance Learning, Pune, India, in 2014. He has worked for TATA Motors Ltd, Cummins Research & Technology India Ltd and Larsen & Toubro Ltd in 2005, 2008 & 2013 respectively. He has extensive
work experience in engine domain, industrial products, oil & gas domain & FPSO structures. His research interests include FEA, ANSYS, Model reduction techniques, Dynamics & Vibration. At present, He is engaged in rotor dynamics analysis and its application.