o shore pro t shifting and domestic productivity measurement · pdf fileo shore pro t shifting...
TRANSCRIPT

Offshore Profit Shifting and
Domestic Productivity Measurement∗
Fatih Guvenen†, Raymond J. Mataloni Jr.‡, Dylan G. Rassier§, Kim J. Ruhl¶
Abstract
Official statistics display a significant slowdown in U.S. aggregate productivity
growth that begins in 2004. In this paper, we investigate a source of mismeasure-
ment in official statistics, which arises from offshore profit shifting by multinational
enterprises operating in the United States. This profit shifting causes part of the
economic activity generated by these multinationals to be attributed to their foreign
affiliates, leading to an understatement of measured U.S. gross domestic product.
Profit-shifting activity has increased significantly since the mid-1990s, resulting in
an understatement of measured U.S. aggregate productivity growth. We construct
adjustments to correct for the effects of profit shifting on measured gross domestic
product. The adjustments raise aggregate productivity growth rates by 0.1 percent
annually for 1994–2004, 0.25 percent annually for 2004–2008, and leave productivity
unchanged after 2008; Our adjustments mitigate, but do not overturn, the produc-
tivity slowdown in the official statistics. The adjustments are especially large in
R&D-intensive industries, which are most likely to produce intangible assets that are
easy to move across borders. The adjustments boost value added in these industries
by as much as 8.0 percent annually in the mid-2000s.
JEL Codes: E01, F23, O4
Keywords: Tax havens, formulary apportionment, productivity slowdown
∗Date: March 27, 2017. We thank Alberto G. Ramon for his assistance with the statistical analysis. The statistical anal-
ysis of firm-level data on U.S. multinational companies and companies engaged in international transactions was conducted
at the Bureau of Economic Analysis, U.S. Department of Commerce, under arrangements that maintain legal confidential-
ity requirements. The views expressed in this paper are solely those of the authors and not necessarily those of the U.S.
Department of Commerce, the Bureau of Economic Analysis, or the Federal Reserve Bank of Minneapolis.†University of Minnesota, FRB of Minneapolis, and NBER; [email protected]‡Bureau of Economic Analysis; [email protected]§Bureau of Economic Analysis; [email protected]¶Pennsylvania State University; [email protected]

1 Introduction
Economists have long understood the pivotal role of aggregate productivity growth as the
engine of long-run economic growth. A wide range of macroeconomic policy questions hinge
on the forecasts of future productivity growth, making the future path of productivity a
crucial input into policy analysis. Thus, it is not surprising that the news of a signifi-
cant slowdown in U.S. productivity growth, starting around 2004, generated widespread
concern about the growth prospects of the U.S. economy. Perhaps more surprisingly, this
productivity slowdown took place (according to official statistics) primarily in sectors that
either produce or use information technology (IT) services intensively. This finding has
raised skepticism among some economists, who point to the major innovative products
and technologies introduced in the last decades, and conjecture that the appearance of a
slowdown might be caused by mismeasurement in official statistics.1 For the growth rate
of productivity to be biased, however, mismeasurement alone (no matter how large) is not
sufficient; the problem must be worsening over time, which is a harder fact to establish. A
recent literature addressing productivity measurement has focused mainly on official price
indexes as a source of mismeasurement. While the jury is still out, many of these studies
find this type of mismeasurement to have modest effects on productivity growth.2
In this paper, we study another potential source of mismeasurement, one often acknowl-
edged but not investigated thoroughly in the existing literature. This mismeasurement
arises from the offshore profit shifting by domestic and foreign multinational enterprises
(MNEs) operating in the United States. As we will show, this profit shifting understates
measured U.S. gross domestic product in official statistics. Further, as this profit shifting
has increased significantly in the last two decades, the mismeasurement has worsened, giv-
ing the impression of a larger slowdown in the GDP growth rate and, consequently, the
aggregate productivity growth rate. To explain the source of mismeasurement and why it
has worsened over time, we begin with two important facts.
First, the total economic activity generated by U.S. MNEs is very large and has grown
significantly in the past 20 years. The total global value added of U.S. MNEs was $4.66
trillion in 2012, making them equivalent to the fourth largest economy in the world, tied
1Some important examples include the widespread availability of broadband Internet; the rise of in-novative business models and products in companies such as Apple, Google, Facebook, Amazon, Uber,and AirBnB; and new products and technologies such as smartphones, electric cars, cloud computing, andsoftware-as-a-service.
2Aeppel (2015), Alloway (2015), Brynjolfsson and McAfee (2011), Byrne, Oliner, and Sichel (2015),Feldstein (2015), Hatzius and Dawsey (2015), Mokyr (2014), and Smith (2015) have explored measurementerror in productivity. Syverson (2016) and Byrne, Fernald, and Reinsdorf (2016) argue that it is unlikelythat measurement error is large enough to account for the productivity slowdown.
1

with Japan and trailing only the United States, the European Union, and China. In the
same year, their domestic value added was $3.26 trillion, accounting for 26.9 percent of U.S.
business-sector value added. Furthermore, in the last 20 years, U.S. MNEs have increased
their global operations substantially: Earnings on U.S. direct investment abroad (USDIA)
averaged less than 1 percent of U.S. business-sector value added from 1973 to 1993 but
grew to 3.7 percent ($450 billion) of business-sector value added by 2012.
Second, MNEs own significant stocks of intangible capital (intellectual property,
blueprints, brands) and have a presence in countries that vary widely in corporate tax
rates. These characteristics allow MNEs to take advantage of differences in national tax
regimes to shift profits from high-tax jurisdictions — such as the United States — to low-
tax jurisdictions — such as Bermuda. Increasingly common profit-shifting practices include
transfer pricing and complex global structuring related to intangible capital, in which an
MNE effectively underprices intangible capital when “sold” from one of its entities in a
high-tax jurisdiction to another of its entities in a low-tax jurisdiction or engages in a
series of transactions among subsidiaries that are strategically located in order to reduce
the MNE’s effective global tax rate.3 For U.S. MNEs, these strategies allow them to book
earnings in low-tax foreign affiliates in ways that are disproportionate to the economic
activity carried out in those affiliates.4 These tax strategies have generated discussion
among official statistics compilers and users of official statistics regarding the treatment of
transactions within MNEs and their effect on national statistics.5
The measurement problem can be illustrated through a concrete example. Consider
the iPhone, which is developed and designed in California but assembled by an unrelated
company in China with components manufactured in various (mostly Asian) countries.
Taking some hypothetical ballpark figures, suppose the bill of materials and labor costs
of assembly amount to $250 per iPhone and the average selling price is $750, for a gross
profit of $500 per phone. For simplicity, assume that there are no further costs of retailing
and that all iPhones are sold to customers outside of the United States.
3Another common strategy is to have subsidiaries in high-tax jurisdictions borrow funds from thesubsidiaries in low-tax ones, thereby reducing the profits in the former and raising in the latter.
4See, for example, Bartelsman and Beetsma (2003), Bernard, Jensen, and Schott (2006), Clausing(2003), Grubert and Mutti (1991), and Hines and Rice (1994).
5See, for example, Lipsey (2009; 2010), Rassier (forthcoming), United Nations, Eurostat, and Or-ganisation for Economic Co-operation and Development (2011), and United Nations (2015). Althoughthe OECD’s transfer pricing guidelines call for an “arm’s-length principle,” which requires firms to ap-ply market prices to related-party transactions, this is difficult to do in practice because many intrafirmtransactions do not have market values. For example, how should Apple value the intellectual property,marketing, and brand associated with the iPhone, when these are developed in the United States but usedin foreign subsidiaries? These intangibles are not traded in organized markets, so it is very hard to judgewhether the assigned values are correct.
2

Two important questions arise from this simple scenario: First, defining GDP as total
domestic value added, how much should each iPhone contribute to U.S. GDP? Second,
given the profit-shifting practices described above, how much of each iPhone’s gross profit
is actually included in U.S. GDP?
To answer the first question, note that the $250 paid to contract manufacturers and
suppliers in Asia is not part of U.S. GDP, whereas how much of the $500 gross profit should
be attributed to U.S. GDP depends on where that value is created. If consumers are willing
to pay a $500 premium over the production cost for an iPhone, it is because they value
the design, software, brand name, and customer service embedded in the product. If we
assume these intangibles were developed by managers, engineers, and designers at Apple
headquarters in California (Apple, U.S.), then the entire $500 should be included in U.S.
GDP. In the national accounts, the $500 would be a net export in expenditure-based GDP,
matched by an increase in Apple’s earnings in income-based GDP. To the extent that some
intangible assets were created outside of the United States, only the appropriate share of
the gross profit and related net export would accrue to the United States.
As to the second question, the gross profit actually included in U.S. GDP may be very
small. If Apple generates intangible assets in the United States and legally transfers them
to a foreign affiliate (e.g., one in Ireland), payments for the use of intellectual property
should accrue to Apple U.S. as a net export in U.S. expenditure-based GDP, which are
matched by an increase in Apple U.S.’s earnings in U.S. income-based GDP. As a result of
profit shifting, however, payments for the use of intellectual property may be underpriced
or not made at all, which means that the returns to Apple U.S.’s intangible assets are
attributed to an Apple affiliate outside the United States and not included in U.S. GDP.
In this case, the returns are captured in “earnings on USDIA,” which is included in U.S.
gross national product. Thus, relative to the conceptual measure, U.S. net exports and
GDP are understated and earnings on USDIA are overstated.
To illustrate the magnitude of this problem, Table I reports, by host country, the total
assets (cash, receivables, plant, property, equipment, etc.) owned by the foreign affiliates
of U.S. MNEs relative to several production-related measures. The ratio of total assets
to physical capital (plant, property, and equipment) for U.S.-owned foreign affiliates in
Canada is 6.4. This ratio averages almost 300 for European tax havens Ireland, Lux-
embourg, the Netherlands, and Switzerland, and more than 90 for Barbados, Bermuda,
and the U.K. Caribbean Islands. Measuring assets relative to employment (number of
employees) or compensation yields similar patterns.6
6These cross-border strategies can wreak havoc in the official statistics of even relatively large economies
3

Table I – Assets in U.S.-owned foreign affiliates, 2012
Ratio of U.S.-owned foreign affiliate total assets to
PPE Compensation Employment(mil. USD)
World 16.8 39.0 1.8Canada 6.4 21.2 1.2
Ireland 20.0 142.7 10.9Luxembourg 1,109.6 1,380.0 121.6Netherlands 97.7 115.3 8.7Switzerland 59.9 60.0 7.7
Barbados 41.8 1,444.7 43.3Bermuda 130.8 1,475.5 155.8U.K.I., Caribbean 101.2 3,330.2 199.8
Hong Kong 40.3 39.3 2.7Singapore 18.6 50.3 3.1
Notes: Total assets are the sum of all financial (e.g., cash, receivables) and non-financial (e.g.,property, plant, and equipment, inventories) assets on a historic cost basis — that is, amountsreported on firms’ financial statements under U.S. generally accepted accounting principles(GAAP). United Kingdom Islands (U.K.I.), Caribbean, consist of the British Virgin Islands,Cayman Islands, Montserrat, and Turks and Caicos Islands.
The goal of this paper is to obtain a more accurate measurement of U.S. domestic
productivity growth by correcting for the mismeasurement in value added introduced by
MNE offshore profit shifting. For this purpose, we use confidential MNE survey data,
collected by the Bureau of Economic Analysis (BEA) for the period 1982–2014.7 The
survey data cover the worldwide operations of U.S. MNEs and contain, among other key
measures, information on their employment, sales, and R&D expenditures. We also use
annual data for transactions in income on direct investment published by BEA in the
International Transactions Accounts (ITA), also available for 1982–2014.
Using these data, we reattribute earnings on USDIA among a U.S. parent and its
foreign affiliates, based on factors that reflect economic activity, under a method of for-
mulary apportionment. Under this method, the total worldwide earnings of an MNE are
attributed to locations based on apportionment factors that aim to capture the true loca-
like Ireland and the Netherlands. As one example, annual Irish GDP growth in 2015 was 26 percent,compared to a consensus forecast by economists of 7.8 percent. This large discrepancy was almost entirelydue to foreign affiliates in Ireland booking larger than expected earnings in the country (Eurostat, 2016).
7The firm-level survey data, which by law are confidential, are collected for the purpose of producingpublicly available aggregate statistics on the activities of multinational enterprises.
4
tion of economic activity. As apportionment factors, we use, in each geographical location,
a combination of (i) labor compensation and (ii) sales to unaffiliated parties, as they are
likely to be good proxies for the actual economic activity taking place in each location.
We use the results of formulary apportionment to compute a corrected measure of
domestic business-sector value added and consequent labor productivity growth for the
United States, for 1973–2014.8 Since the aggregate earnings of U.S. MNEs are dispropor-
tionately booked to low-tax jurisdictions with little true economic activity, our adjustment
reattributes their earnings toward the United States and other higher-tax jurisdictions,
thereby increasing measured U.S. GDP and labor productivity growth.
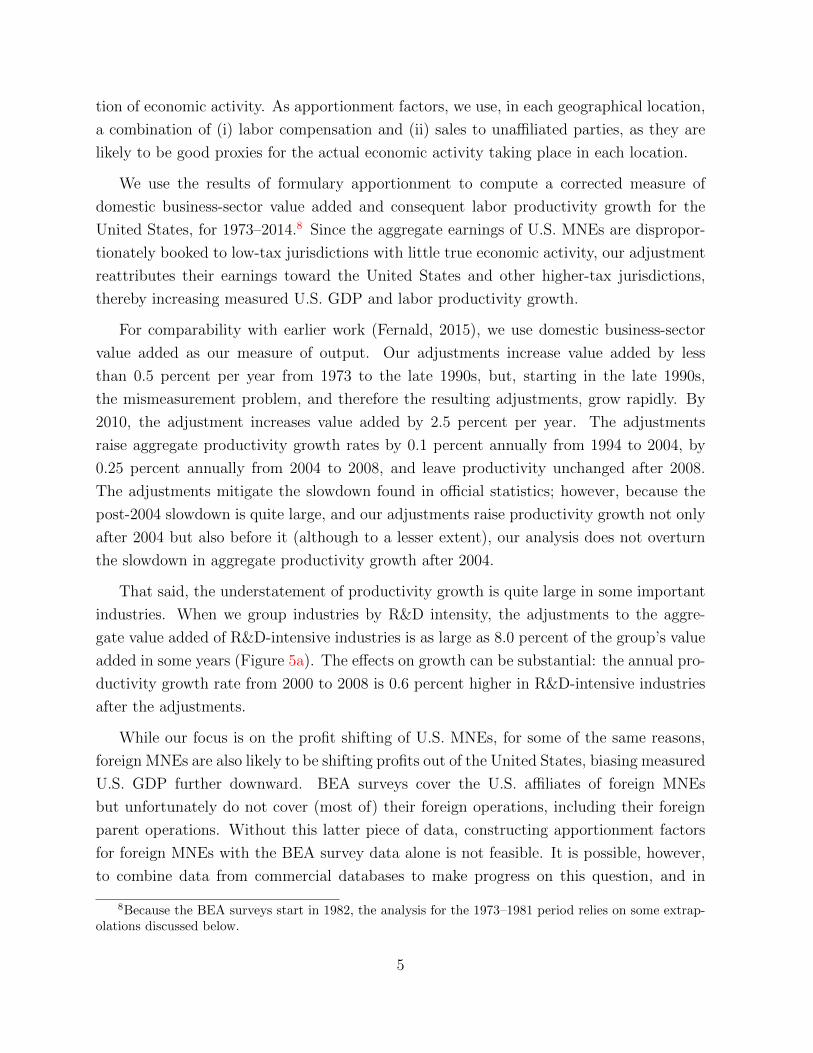
For comparability with earlier work (Fernald, 2015), we use domestic business-sector
value added as our measure of output. Our adjustments increase value added by less
than 0.5 percent per year from 1973 to the late 1990s, but, starting in the late 1990s,
the mismeasurement problem, and therefore the resulting adjustments, grow rapidly. By
2010, the adjustment increases value added by 2.5 percent per year. The adjustments
raise aggregate productivity growth rates by 0.1 percent annually from 1994 to 2004, by
0.25 percent annually from 2004 to 2008, and leave productivity unchanged after 2008.
The adjustments mitigate the slowdown found in official statistics; however, because the
post-2004 slowdown is quite large, and our adjustments raise productivity growth not only
after 2004 but also before it (although to a lesser extent), our analysis does not overturn
the slowdown in aggregate productivity growth after 2004.
That said, the understatement of productivity growth is quite large in some important
industries. When we group industries by R&D intensity, the adjustments to the aggre-
gate value added of R&D-intensive industries is as large as 8.0 percent of the group’s value
added in some years (Figure 5a). The effects on growth can be substantial: the annual pro-
ductivity growth rate from 2000 to 2008 is 0.6 percent higher in R&D-intensive industries
after the adjustments.
While our focus is on the profit shifting of U.S. MNEs, for some of the same reasons,
foreign MNEs are also likely to be shifting profits out of the United States, biasing measured
U.S. GDP further downward. BEA surveys cover the U.S. affiliates of foreign MNEs
but unfortunately do not cover (most of) their foreign operations, including their foreign
parent operations. Without this latter piece of data, constructing apportionment factors
for foreign MNEs with the BEA survey data alone is not feasible. It is possible, however,
to combine data from commercial databases to make progress on this question, and in
8Because the BEA surveys start in 1982, the analysis for the 1973–1981 period relies on some extrap-olations discussed below.
5

Section 5 we take a first look at this issue using a preliminary data set on the largest 98
technology-intensive foreign MNEs that have operations in the United States. Our results
indicate a similar profit-shifting behavior by these corporations, further biasing U.S. GDP
and labor productivity measures. In our preliminary analysis, we find the magnitudes of
the biases for foreign MNEs to be smaller than those for U.S. MNEs.
1.1 Related literature
The formulary apportionment approach we use to reattribute earnings within the MNE
has been primarily applied in multijurisdictional tax practice. The treatment of global
income under formulary apportionment is widely explored in multidisciplinary research,
and formulary apportionment has been proposed as an alternative to the complexity and
subjectivity of transfer pricing for the allocation of international tax obligations within
MNEs.9 From a tax policy perspective, a potential problem with formulary apportionment
is the endogenous response of firms to the formulary rules of the tax system.10 To the extent
that MNEs do not make operating or investment decisions based on surveys intended solely
for statistical purposes, formulary apportionment applied to economic accounting faces
fewer challenges compared to its use in international taxation.
Our approach follows Rassier and Koncz-Bruner (2015), which proposes formulary ap-
portionment as an alternative method for attributing the profits component of income-
based value added to foreign affiliates of U.S. MNEs. The formulary adjustment reduces
distortions created by excess profits attributed to tax haven countries (Lipsey, 2010).
Rassier (2014) treats the reduction in earnings on USDIA under formulary apportion-
ment as an implied increase in U.S. GDP, which is a necessary counterpart to the related
increase in domestic income. The author, however, does not construct a time series of
adjusted domestic business-sector value added and does not consider the consequences for
productivity measures or the differential impacts on R&D- and IT-intensive industries.
McGrattan and Prescott (2010) and Bridgman (2014) seek to explain the higher rate
of return earned by U.S. MNEs on their direct investments abroad compared with the
rate of return earned by foreign-owned MNEs on their investments in the United States.
Their explanations for the rate of return differential focus on the use of intangible capital
by MNEs in their foreign affiliates. These studies use general equilibrium models and
estimates of intangible assets to account for the rate of return differentials. The aggregate
9See, for example, Avi-Yonah (2010), Avi-Yonah and Benshalom (2011), Avi-Yonah and Clausing(2007), Fuest, Hemmelgarn, and Ramb (2007), and Runkel and Schjelderup (2011).
10See, for example, Altshuler and Grubert (2010), Anand and Sansing (2000), Goolsbee and Maydew(2000), Gordon and Wilson (1986), Gresik (2001), Hines (2010), Martens-Weiner (2006), and Roder (2012).
6

analyses in these papers are complementary to our estimates derived from the firm-level
data.
In Section 2, we present a simple model of an MNE to highlight the source of mis-
measurement and discuss our empirical methodology. In Section 3 we report the impact
of our adjustments on aggregate productivity, and in Section 4, we show how our adjust-
ments matter more for R&D- and IT-intensive industries. Section 5 takes a first look
at mismeasurement due to foreign MNEs operating in the United States, and Section 6
concludes.
2 Conceptual framework
In this section we provide a conceptual framework to demonstrate how the ownership
of intangible assets — regardless of where they are used — affects the measurement of
aggregate output and productivity. Our data cover U.S. parents and their foreign affiliates,
so our focus here is on the measurement of U.S. aggregate output and productivity.
The MNE consists of a parent (m) located in the United States and one wholly owned
foreign affiliate (a). The parent and affiliate produce nontraded final goods (y) using physi-
cal capital (k), skilled and unskilled labor (`s, `u), and intangible capital (h).11 We assume
that physical capital and labor can be freely adjusted and are obtained from perfectly
competitive factor markets. Intangible capital is non-rivalrous but subject to ownership.
The final-good production function for the parent is
ym = f(zm, km, `sm, `um, h), (1)
where z is total factor productivity. The final-good production function for the affiliate is
ya = f(za, ka, `sa, `ua, h). (2)
We assume that both production functions are homogeneous of degree one. Note that
intangible capital does not have a subscript that denotes its physical location. This is
an advantageous characteristic of intangible capital: It can be used to produce in each
location, regardless of its location of ownership.
11In the data, firms produce both goods and services. For simplicity, we refer to the output of firms asgoods.
7

2.1 Accounting
We map the production framework specified above into the economic accounting framework
used by BEA, which is based on international statistical guidelines. To do so, we need to
assign economic ownership of the firm’s intangible capital. We assume that the MNE
assigns ownership share λ of the stock of intangible capital to the parent and 1 − λ to
the foreign affiliate. This decision does not affect production but determines the location
in which the returns to intangible capital are booked. The firm may assign ownership
of its intangible capital to the affiliate for several reasons, including taxation, regulation,
confidentiality, property rights protection, and exchange rate management (Organisation
for Economic Co-operation and Development, 2008a). For our purposes, we do not need
to model the firm’s choice of λ.
Given our assumptions, affiliate earnings are
πa = pya − ws`sa − wu`ua − rkka − rh(1− λ)h− rhλh+ rh(1− λ)h = rh(1− λ)h, (3)
where p is the price of the final good, ws and wu are the wage rates, rk is the return
on physical capital, and rh is the return on intangible capital. We assume that factor
and goods prices are the same in the parent and affiliate. The term −rh(1 − λ)h is the
impairment of affiliate intangible assets; the term−rhλh is the payment from the affiliate
to the parent for the use of λh; and the term rh(1−λ)h is the payment from the parent to
the affiliate for the use of (1−λ)h. The second equality in (3) follows from the assumption
that inputs are paid their marginal products and that the production function has constant
returns to scale.
Parent earnings are
πm = pym − ws`sm − wu`um − rkkm − rhλh− rh(1− λ)h+ rhλh = rhλh, (4)
where the term −rhλh is the impairment of the parent intangible assets; the term −rh(1−λ)h is the payment from the parent to the affiliate for use of (1− λ)h; and the term rhλh
is the payment from the affiliate to the parent for use of λh. Again, the second equality in
(4) follows from the assumption that inputs are paid their marginal products and that the
production function has constant returns to scale.
8

2.2 Accounting with multinational enterprises
How do the ownership shares of intangible capital affect aggregate output measures? In
the United States, expenditure-based GDP is
Y E = pym + rhλh− rh(1− λ)h, (5)
where the last two terms are the exports and imports of intangible capital services. Income-
based GDP is
Y I = ws`sm + wu`um + rkkm + 2rhλh = pym − rhh+ 2rhλh, (6)
where the second equality follows from pym = ws`sm +wu`um + rkkm + rhh. The payment
from the affiliate to the parent (rhλh) is reported in BEA surveys on transactions in
services as “receipts by U.S. reporters [parents] on the use of intellectual property by
foreign persons.” In the aggregate accounting, these receipts are a part of earnings on U.S.
direct investment abroad. In our framework, earnings on USDIA is simply
Y USDIA = πa = rh(1− λ)h. (7)
Note that rh(1−λ)h is counted as earnings on USDIA, whether or not the earnings are paid
as cash dividends to the parent. Earnings not paid as dividends are treated in economic
accounts as paid and immediately reinvested in the foreign affiliate. The earnings are not
included in GDP.
Unadjusted aggregate labor productivity is
A =Y E
`m=pym + 2rhλh− rh
`m, (8)
where `m = `sm + `um is total employment in the United States. Suppose that all of the
intangible capital was created in the United States. When the parent retains all of the
firm’s intangible capital (λ = 1), the entire return to intangible capital would be counted
in GDP. When λ < 1, some of the return to intangible capital gets attributed to earnings
on USDIA rather than GDP, and the productivity measure in (8) would be smaller. This
mismeasurement grows larger as λ decreases or intangible capital becomes more important.
2.3 Formulary apportionment method
The simple framework presented in the previous section made it easy to see the source of
mismeasurement and a practical solution: Attribute MNE earnings to the entities of the
9

firm in a way that reflects the location of production. We use a formulary apportionment
approach for this attribution.
Formulary apportionment begins by constructing, for each entity in the firm, an ap-
portionment weight, ωn, that reflects the entity’s share of the total apportionment factors.
We use sales to unaffiliated parties and labor compensation as our apportionment fac-
tors. The market presence of the entity is captured by the sales measure, and restricting
sales to unaffiliated parties mitigates problems with transfer pricing and global structur-
ing. Compensation reflects labor’s contribution to production in the entity. To account for
differences in labor quality across entities, we use compensation rather than employment.
Weighting the two factors equally, the apportionment weights in our framework are
ωn =1
2× ws`sn + wu`unws`sm + wu`um + ws`sa + wu`ua
+1
2× pynpym + pya
n = a,m. (9)
We use these weights to allocate the MNE’s consolidated earnings across the entities,
πωn = ωn(πa + πm) n = a,m, (10)
which yields πωn , the earnings attributed to entity n under formulary apportionment. The
formulary adjustment to each entity is simply
εn = πωn − πn. (11)
The formulary adjustment reflects the additional earnings (which could be negative) due
to the entity. We use the formulary adjustment for the parent to adjust GDP,
Y E = Y E + εm = pym + rhλh− rh(1− λ)h+ εm. (12)
The adjusted GDP in (12) is the numerator in adjusted aggregate labor productivity,
A =Y E
`m=pym + rhλh− rh(1− λ)h+ εm
`m. (13)
While standard in the multijurisdictional tax literature, the formulary adjustment will
not generally provide an exact measure of the missing payment to the parent. The accuracy
of our adjustment depends upon the extent to which inputs are substitutable: With fixed-
proportions production functions, the adjustment exactly reattributes profits in proportion
to output. We experiment with different apportionment factors to generate a range of
adjustments.
10

3 Aggregate productivity
We begin with an analysis of U.S. aggregate productivity. In Section 4, we study produc-
tivity in industries grouped by their R&D expenditure and their use and production of
information technology.
3.1 Data and variable construction
We construct unadjusted labor productivity for 1973–2014 using annual domestic business-
sector value added from the national income and product accounts (NIPA) published by
BEA and annual total hours worked from the Labor Productivity and Costs series published
by the U.S. Bureau of Labor Statistics (BLS). In Section 2, for clarity, we used GDP as
our measure of output. In our empirical implementation, we use the more appropriate
business-sector value added measure, which abstracts from the household, government, and
non-profit sectors of the economy. In addition, we use the annual survey data collected
by BEA on U.S. MNEs to construct productivity measures adjusted for transactions in
earnings on USDIA based on the formulary framework outlined in Section 2.3.
While the productivity series span 1973–2014, the survey-level data are only available
for 1982–2014. Furthermore, some requisite survey-level data on U.S. parents were not
collected for 1983–1988 and 1990–1993. However, aggregate statistics on transactions in
income (direct investment income and portfolio income) are available for all years. Thus, we
extrapolate backward the nominal adjustment prior to 1982 using the aggregate statistics
as an indicator. In addition, we linearly interpolate the nominal adjustment for 1983–1988
and 1990–1993.
Before turning to our results, we briefly discuss the construction of our productivity
series. More details are available in the appendix.
3.1.1 Unadjusted productivity measures
To construct unadjusted labor productivity, we follow Fernald (2015) and take the ge-
ometric average of the income-based and expenditure-based measures of business-sector
value added, which we deflate with an implicit price deflator derived from business-sector
value added. We divide our real value added measure by total hours worked to yield the
unadjusted labor productivity defined in (8).
3.1.2 Adjusted productivity measures
To construct adjusted labor productivity, we need the apportionment factors and profits
for each entity in each MNE. These data are collected in the BEA MNE surveys and
11

used to generate the formulary adjustment in (11). The survey data include financial and
operating activities based on income statement and balance sheet information reported
under U.S. GAAP for U.S. parents and their foreign affiliates. These surveys are required
to be completed for all U.S. parents, and surveys are required to be completed for all foreign
affiliates based on thresholds for assets, sales, and net income. These surveys report, for
each parent and affiliate, compensation and sales to unaffiliated parties, which we use to
construct the apportionment factors. The surveys are also the source of earnings reported
on U.S. parents and foreign affiliates, as well as the U.S. parent’s reported voting interest
in a foreign affiliate.12
Apportionment factors
We use compensation of employees and sales to unaffiliated parties as apportionment fac-
tors to construct the apportionment weights in (9) for each MNE. Each apportionment
factor has advantages and disadvantages. Compensation reflects both the number of em-
ployees and their wages. If workers are paid their value marginal product, compensation
reflects variation in economic activity across industries and countries. As an apportionment
factor, compensation yields relatively more production attributable to high-margin indus-
tries and high-wage countries and relatively less production attributable to low-margin
industries and low-wage countries. In addition, compensation is based on market trans-
actions rather than financial accounting conventions, which may affect our other appor-
tionment factor, unaffiliated sales. Thus, apportionment weights constructed using only
compensation may provide the most objective measure of economic activity. Compensa-
tion, however, may not reflect the actual economic owner of intangible capital and may
not reflect the provision of services through means such as digital technology, which do not
require a physical presence.
While unaffiliated sales may be affected by revenue recognition rules under financial
accounting conventions, an advantage of using sales as an apportionment factor is that
it reflects activity at a location regardless of physical presence, which may be a better
indicator of economic activity for some products.13 For example, unaffiliated sales may
reflect intangible capital actually employed by a foreign affiliate. In addition, sales is a
12Transactions in income on USDIA include earnings and net interest. Earnings include a U.S. parent’sshare of its foreign affiliate’s net income adjusted for capital gains and depletion. Earnings are eitherdistributed as dividends or reinvested as further direct investment. Net interest is very small relative toearnings, so we do not include it in our adjustments.
13The OECD’s work on base erosion and profit shifting recommends that the taxable presence of anentity be determined primarily by the location of “significant people functions” in the case of non-financialenterprises or by the location of “key entrepreneurial risk takers” in the case of financial enterprises. In thecase of electronic commerce, the commentary to the OECD model tax convention clarifies that computerequipment at a location may constitute a taxable presence even if no personnel are required to operate
12

measure of local output that results from production, whereas compensation is a measure
of local inputs employed in production.
Economic profits
Our measure of profits reflects current production that is consistent with the profits com-
ponent of GDP calculated by the factor income approach. Profits of U.S. parents are
calculated as net income minus capital gains and losses, minus profits of their foreign affil-
iates on which the U.S. parent has a claim, plus charges for depletion of natural resources.
Profits of foreign affiliates on which the U.S. parent has a claim — our measure of foreign
profits — are calculated as foreign affiliate net income minus capital gains and losses, mi-
nus profits of other foreign affiliates on which they have a claim, plus charges for depletion
of natural resources, the result of which is multiplied by the parent’s direct and indirect
voting interest in the foreign affiliate.
We compute the entity-level adjustments according to (11) and aggregate the par-
ents’ adjustments for all U.S. MNEs. We add this aggregate adjustment to nominal
expenditure-based business-sector value added and to nominal income-based business-
sector value added. Let M be the set of all U.S. MNEs and Y VA be either income- or
expenditure-based nominal value added. Adjusted value added, Y VA, is
Y VA = Y VA +∑m∈M
εm. (14)
As in the construction of unadjusted labor productivity, we take the geometric average
of the two adjusted value added series and deflate them using the implicit deflator for
business-sector value added. We divide our adjusted real value added measure by total
hours worked to yield the adjusted labor productivity defined in (13).
3.2 Results
Figure 1 presents, as a share of business-sector value added, the aggregate formulary ad-
justments: the sum of the εm from (11). Our baseline formulary adjustment, when the
apportionment weights in (9) are based on sales and employee compensation, is labeled
“weighted adjustment.” We also plot the formulary adjustment when either compensation
or sales is the only factor used to compute the apportionment weights. The adjustments
based on only compensation or sales are similar to each other and, thus, to the weighted
the equipment. However, the attribution of profits to the location would still depend on the performanceof “significant people functions,” which implies little or no profit would be attributed to the location(Organisation for Economic Co-operation and Development, 2008b, paragraph 95).
13

Figure 1 – Aggregate formulary adjustments
(a) As share of business-sector value added
1970 1975 1980 1985 1990 1995 2000 2005 2010 20150.0
0.5
1.0
1.5
2.0
2.5
3.0
3.5
4.0
4.5
share
USDIA Income
Compensation
WeightedAdjustment
Sales
(b) Inflation-adjusted level
1970 1975 1980 1985 1990 1995 2000 2005 2010 20150
100
200
300
400
500
bill
ion U
SD
(2
00
9 b
ase
year)
USDIA Income
Compensation
WeightedAdjustment Sales
adjustment. We plot total income on USDIA for reference. The apportionment factors are
stable over time, so the adjustment series generally follow the pattern of total income on
USDIA.
Although the adjustments grow, from 1973 to 2000 they are less than 1 percent of
value added per year. In the early 2000s, income on USDIA explodes, and the sales-
compensation weighted formulary adjustments grow to about 2.5 percent of value added per
year. The cumulative increase in U.S. GDP from the adjustment is substantial. From 2004
to 2014, the sales-compensation weighted formulary adjustment adds $2.6 trillion to GDP,
the compensation-based adjustment adds $2.8 trillion, and the sales-based adjustment adds
$2.5 trillion.
We plot cumulative labor productivity growth for 1973–2014 (normalizing 1973 to zero)
in Figure 2a. In what follows, we compute growth rates using natural logarithms. The
unadjusted cumulative labor productivity series is consistent with Fernald (2015), except
for 2012–2014, where we have incorporated revised NIPA data. The average annual un-
adjusted labor productivity growth rate for 1973–2014 is 1.9 percent. The productivity
data are often broken into three periods: 1973–1994, 1994–2004, and 2004–2014. The
average annual unadjusted labor productivity growth rates for 1973–1994 and 2004–2014
are roughly equivalent at 1.5 percent and 1.4 percent, respectively. The average annual
unadjusted productivity growth rate for 1994–2004 increases to 3.0 percent. We report
cumulative and average annual productivity growth rates in Table II.
In Figure 2a, we plot the cumulative growth of labor productivity adjusted by the
weighted formulary adjustment shown in Figure 1, and in Figure 3, we plot the difference
14

Figure 2 – Aggregate cumulative labor productivity growth
(a) 1973–2014
1970 1975 1980 1985 1990 1995 2000 2005 2010 201510
0
10
20
30
40
50
60
70
80
perc
ent
Adjusted
Unadjusted
(b) 1994–2014
1990 1995 2000 2005 2010 20150
10
20
30
40
50
perc
ent
Adjusted
Unadjusted
Figure 3 – Increase in aggregate cumulative labor productivity growth
(a) 1994–2014
1990 1995 2000 2005 2010 20150.0
0.5
1.0
1.5
2.0
perc
ent
(b) 2004–2014
2004 2006 2008 2010 2012 20140.0
0.2
0.4
0.6
0.8
1.0
perc
ent
between the two series. By the end of the period, cumulative labor productivity is higher
in the adjusted series. Adjusted cumulative labor productivity growth for 1973–2014 is 1.8
log points higher than the unadjusted cumulative labor productivity growth.
From Figure 2a, it is clear that the formulary adjustment does not affect aggregate
productivity in a substantial way until the 1990s, with most of the adjustment occurring
after 2000. In Figure 2b, we plot aggregate cumulative productivity growth since 1994 to
highlight the period of increased productivity growth (1994–2004) and the productivity
growth slowdown (2004–2014). From 1994 to 2014, the formulary adjustment adds 1.6 log
points to cumulative labor productivity growth. The adjustment increases the productivity
15

Table II – Labor productivity growth rates (percent)
Cumulative growth rate Average annual growth rate
Unadjusted Adjusted Unadjusted Adjusted
1973–2014 76.7 78.5 1.87 1.911973–1994 32.2 32.5 1.53 1.551994–2014 44.5 46.0 2.23 2.302002–2014 20.9 21.9 1.74 1.83
growth rate during the period of increased productivity growth, but the adjustment has
its largest effects during the productivity growth slowdown. In some years, this effect is
dramatic. From 2006 to 2008, for example, adjusted productivity grew 1.5 percent, while
unadjusted productivity grew only 0.6 percent.
3.3 Adjustment for other countries
Our adjustments are reattributions of earnings among the parent and foreign affiliates
of each U.S. MNE. As evident in Figure 1, almost 65 percent of earnings on USDIA are
reattributed to the United States. From which countries did this income originate? Almost
92 percent of the reattribution to the United States is concentrated in ten countries, and
the largest reattributions were away from countries that are considered to be havens for
MNE profit shifting (Table III and Figure 4). Consistent with the popularity of the“double
Irish with a Dutch sandwich” tax reduction strategy (Sanchirico, 2015), the Netherlands
is the largest source (27.8 percent) and Ireland is the third largest source (10.5 percent) of
income reattributed to the United States. The top ten also includes tax havens Bermuda,
Luxembourg, Singapore, Switzerland, and the U.K. Caribbean Islands.14
Canada and the United Kingdom are also in the top ten sources of reattributed income;
however, these countries are major hosts of U.S.-owned affiliate employment. In 2012,
Canada accounted for 8.4 percent of all employment in the foreign affiliates of U.S. parents,
and the United Kingdom accounted for 10.3 percent.
The fact that adjustments are negative for some countries does not necessarily suggest
that the GDP of those countries is overstated. Some of the larger countries are home to
14The adjustments may be larger than GDP due to national accounting practices in some host countriesthat exclude the income from certain foreign-owned companies from GDP. Bermuda, for example, doesnot include exempted companies — companies that are located in Bermuda but do not do business inBermuda — in its national account statistics. Lipsey (2009) provides a sense of scale: In 1999, the foreignaffiliates of U.S. MNEs in Bermuda reported sales of services to parties outside of Bermuda of $13,908million; however, total service exports as reported in Bermudian official statistics are only $1,163 million.
16

Figure 4 – Geographical reattribution of earnings of U.S. MNEs, 2012 (bil. USD)
United States: +$280.1
Canada: –$13.7
Bermuda: –$32.4
Ireland: –$29.5United Kingdom: –$14.7
Luxembourg: –$23.6Netherlands: –$73.0Switzerland: –$12.7
U.K.I. Caribbean: –$22.0
Singapore: –$19.0
Qatar–$10.0
Notes: The United Kingdom Islands (U.K.I.), Caribbean,are made up of the British Virgin Islands, Cay-
man Islands, Montserrat, and Turks and Caicos Islands.
indigenous MNEs, and reattribution of those companies’ global profits may very well raise
the GDP of those countries.
Our adjustments are positive for some countries (besides the United States) as well,
although the increases are small. The adjustments, in fact, are too small to be reported
given the confidentiality of the BEA survey data. The ten countries with the largest
positive reattribution of income on USDIA are, in order from highest to lowest: Japan,
France, Italy, Russia, Argentina, Greece, Turkey, Libya, Germany, and Kenya. Among this
set of countries, Japan, France, Italy, Greece, and Germany have tax rates that generally
exceed the OECD average. Overall, the reattribution pattern supports the concern that
measurement error arises as a result of income on USDIA being shifted to affiliates in
countries with relatively low tax rates.
17

Table III – Adjustments in other countries, 2012
Country Adjustment Adjustment(share of total) (share GDP)
Decrease in GDP 1.00Netherlands 0.28 0.10Bermuda 0.12 5.91Ireland 0.11 0.14Luxembourg 0.08 0.43U.K.I., Caribbean 0.08 4.76Singapore 0.07 0.07United Kingdom 0.06 0.01Switzerland 0.05 0.02Canada 0.05 0.01Qatar 0.04 0.06Remaining 178 countries 0.08
Notes: The adjustment to U.S. GDP in 2012 is an increase of $280.1 billion. This table reportsthe offsetting adjustments (decreases in GDP) to the top 10 counterpart countries by sizeof adjustment. The United Kingdom Islands (U.K.I.), Caribbean, include the British VirginIslands, Cayman Islands, Montserrat, and Turks and Caicos Islands. They are members ofCARICOM, which publishes a comprehensive set of national accounts data.
4 Productivity in R&D- and IT-intensive industries
Attributing the return to intangible capital correctly is likely to make a bigger difference
in industries in which intangible capital is more important. To investigate this hypothesis,
we construct adjusted productivity measures for industries grouped by their R&D and IT
intensities.
We use data on value added by industry from the Annual Industry Accounts (AIA)
published by BEA and hours worked by industry from the Labor Productivity and Costs
database published by BLS. As before, we use the BEA survey of MNEs to construct value
added adjusted for transactions in earnings on USDIA based on the formulary framework
outlined in Section 2.3.
We use the survey data to calculate R&D and IT intensity at the enterprise level —
the U.S. parent and all of its foreign affiliates. We calculate R&D intensity by dividing
enterprise-level R&D expenditures, aggregated across all available years, by enterprise-
level sales to unaffiliated parties, aggregated across all available years. We consider an
enterprise to be R&D intensive if its R&D intensity is at or above the 75th percentile. In
18
most cases, R&D-intensive enterprises include U.S. parents and foreign affiliates classified
into industries that are considered to be R&D intensive as defined in Moylan and Robbins
(2007).
We calculate IT intensity separately for IT usage and IT production. We first catego-
rize industries as IT using, as defined in Bloom, Sadun, and Van Reenen (2012), or as IT
producing, as defined in Fernald (2015). We consider an enterprise to be IT-using intensive
if the share of its total unaffiliated sales generated by entities classified into IT-using in-
dustries is greater than 50 percent. We consider an enterprise to be IT-producing intensive
if the share of its total unaffiliated sales generated by entities classified into IT-producing
industries is greater than 50 percent.
A complete list of industry groups is reported in appendix Table A.1. Note that a
number of industries are included in more than one group. Information industries (NAICS
51) are included in both IT-using and IT-producing groups, and computer and electronic
product manufacturing industries (NAICS 334) and computer systems design industries
(NAICS 5415) are grouped with both IT-producing industries and R&D-intensive indus-
tries. Likewise, transportation and equipment manufacturing industries (NAICS 336) and
scientific research and development industries (NAICS 5417) are grouped with both IT-
using industries and R&D-intensive industries. IT-producing and R&D-intensive indus-
tries overlap the most — IT-producing industries are almost a subset of R&D-intensive
industries. In contrast, IT-using industries include a number of industries that are not
included in either the IT-producing industries or the R&D-intensive industries, including
well-measured industries such as wholesale trade (NAICS 42) and retail trade (NAICS
44–45).
4.1 Unadjusted productivity measures
The value added by industry data published in the AIA include nominal and real measures
as well as the related price indexes (base year is 2009). We group industries according to
their R&D or IT intensities and compute each group’s real value added using the relevant
Tornqvist price index. We divide the group’s real value added by the group’s hours worked
to yield unadjusted labor productivity.
4.2 Adjusted productivity measures
We adjust nominal value added for industries grouped by R&D intensity and IT intensity.
To compute, for example, adjusted value added for the R&D-intensive industries, we begin
with the MNEs that are identified as R&D intensive. For each of these enterprises, we use
19

the survey data collected by BEA to compute the apportionment weights as in (9) and the
formulary adjustments as in (11).
We sum the formulary adjustments and add them to the nominal value added of the
R&D-intensive industries. If IRD is the set of R&D-intensive industries and MRD is the set
of R&D-intensive enterprises, then the adjusted nominal value added of the R&D-intensive
industries is
Y RD =∑i∈IRD
Yi +∑
m∈MRD
εm, (15)
where Yi is nominal value added in industry i and εm is the formulary adjustment of
enterprise m defined in (11). We deflate nominal adjusted value added by a Tornqvist
index of the price indexes from the industries in IRD. We divide the industry group’s real
value added by the group’s hours worked to yield adjusted labor productivity.
Proceeding in this way, we compute adjusted labor productivity for R&D-intensive
industries, non-R&D-intensive industries, IT-using industries, non-IT-using industries, IT-
producing industries, and non-IT-producing industries.
4.3 Industries that engage in R&D
In Figure 5a, we plot, as a share of unadjusted value added, the formulary adjustment for
R&D-intensive and non-R&D-intensive industries. The formulary adjustments for R&D-
intensive industries are hump shaped in the 1980s and then grow strongly in the 2000s. The
formulary adjustments for R&D-intensive enterprises are substantially larger than those for
non-R&D-intensive enterprises, with the adjustment for R&D-intensive enterprises peaking
in 2008 at 8.0 percent of nominal value added.
The impact of our adjustments on productivity growth by R&D intensity is evident in
Figure 5b, in which we plot cumulative labor productivity growth. From 1973 to 2014,
productivity growth in the R&D-intensive industries is about three times that in the non-
R&D-intensive industries. Adjusting for offshore profit shifting in the R&D-intensive in-
dustries adds about 5.4 log points to cumulative growth, but only a little more than 1 log
point in non-R&D-intensive industries. As we observed in the aggregate data, the largest
effects on productivity growth occurred in the 2000s. The annual growth rate from 2000 to
2007 is 0.6 log points higher in the R&D-intensive industries after the adjustments (Table
IV).
4.4 IT-producing industries
In Figure 6a, we plot the formulary adjustments as a share of value added for those in-
dustries that produce IT and those industries that do not. While quantitatively smaller,
20

Figure 5 – Industries by R&D intensity
(a) Formulary adjustment
1970 1975 1980 1985 1990 1995 2000 2005 2010 20150
1
2
3
4
5
6
7
8
share
of
gro
up's
unadju
sted v
alu
e a
dded (
perc
ent)
R&D intensive
non-R&D intensive
(b) Cumulative productivity growth
1990 1995 2000 2005 2010 201520
0
20
40
60
80
100
120
perc
ent
Adjusted, R&D intensive
Unadjusted,R&D intensive
Adjusted, non-R&D intensive
Unadjusted, non-R&D intensive
the adjustment for IT-producing industries is similar to that in R&D-intensive industries.
The adjustments are hump shaped in the 1980s and grow strongly during the 2000s. The
IT-producing industries are almost all R&D-intensive industries, so this is not surprising.
Adjusting for offshore profit shifting adds 3.6 log points to cumulative labor productivity
growth in IT-producing industries over the sample period, with all of the added growth
coming after 1994 (Figure 6b, Table IV). Our adjustments add 1.6 log points to cumulative
labor productivity growth in the industries that do not produce IT.
4.5 IT-using industries
When we classify industries by their use of IT, we find that the formulary adjustments
in industries that use IT intensively are smaller than, but quantitatively similar to, those
in the industries that do not use IT intensively (Figure 6c, Table IV). Offshore profit
shifting is often achieved through the location of intangible assets; if industries that use
IT intensively — which include wholesale and retail trade — also have fewer intangible
assets, we would expect to see a smaller adjustment in these industries.
In Figure 6d, we plot the cumulative labor productivity growth in the industries grouped
by IT usage. Since 1994, adjusting productivity for offshore profit shifting adds about 1.7
log points to productivity in the industries that use IT intensively and 1.8 log points to
industries that do not use IT intensively.
21

Table IV – Cumulative labor productivity growth
1973–2014 1973–1994 1994–2014 2002–2014
R&D intensiveAdjusted 157.0 58.2 98.8 43.9Unadjusted 151.6 57.1 94.5 41.3
Non-R&D intensiveAdjusted 54.1 25.6 28.5 12.9Unadjusted 53.0 25.5 27.6 12.2
IT producingAdjusted 242.1 96.1 146.0 79.6Unadjusted 238.5 96.2 142.3 76.7
Non-IT producingAdjusted 51.0 24.2 26.8 11.0Unadjusted 49.4 23.9 25.5 10.2
IT usingAdjusted 126.6 52.7 73.9 33.6Unadjusted 124.9 52.4 72.5 32.1
Non-IT usingAdjusted 58.2 29.2 29.0 11.6Unadjusted 56.4 28.9 27.5 10.8
22
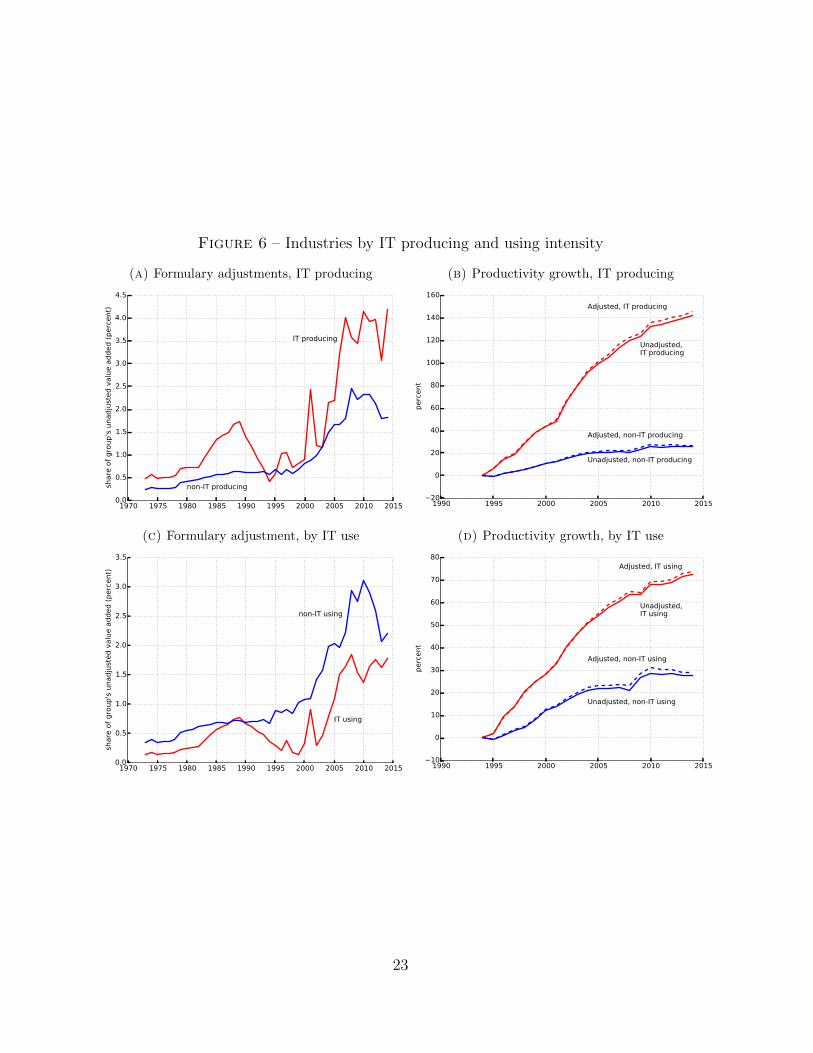
Figure 6 – Industries by IT producing and using intensity
(a) Formulary adjustments, IT producing
1970 1975 1980 1985 1990 1995 2000 2005 2010 20150.0
0.5
1.0
1.5
2.0
2.5
3.0
3.5
4.0
4.5
share
of
gro
up's
unadju
sted v
alu
e a
dded (
perc
ent)
IT producing
non-IT producing
(b) Productivity growth, IT producing
1990 1995 2000 2005 2010 201520
0
20
40
60
80
100
120
140
160
perc
ent
Adjusted, IT producing
Unadjusted,IT producing
Adjusted, non-IT producing
Unadjusted, non-IT producing
(c) Formulary adjustment, by IT use
1970 1975 1980 1985 1990 1995 2000 2005 2010 20150.0
0.5
1.0
1.5
2.0
2.5
3.0
3.5
share
of
gro
up's
unadju
sted v
alu
e a
dded (
perc
ent)
IT using
non-IT using
(d) Productivity growth, by IT use
1990 1995 2000 2005 2010 201510
0
10
20
30
40
50
60
70
80
perc
ent
Adjusted, IT using
Unadjusted,IT using
Adjusted, non-IT using
Unadjusted, non-IT using
23

5 Foreign MNEs in the United States
Although the primary focus of this paper is the apportionment of the worldwide profits
of U.S.-owned MNEs, profit shifting by the U.S. affiliates of foreign-owned MNEs can also
affect measures of U.S. production and labor productivity.
The fact that the United States continues to earn net positive investment income vis-
a-vis the rest of the world, even though its international investment position has been
negative since 1989 has been interpreted as evidence of profit shifting by foreign-owned
U.S. businesses. Likewise, the rate of return on foreign-owned U.S. businesses is lower
than that of other U.S. businesses and is lower still than U.S.-owned businesses abroad.
In 2012, for example, foreign-owned U.S. businesses earned an average return on sales
of 3.1 percent, compared with 6.5 percent for domestic-owned U.S. businesses and 17.9
percent for U.S.-owned businesses abroad. Most of the literature on the relatively low
rate of return of foreign-owned businesses acknowledges that part of this rate-of-return
gap reflects economic factors, such as a maturation effect reflecting the time required for
foreign investors to realize efficiencies in their operations as they engage in learning-by-
doing (Grubert, Goodspeed, and Swenson, 1993, and Grubert, 1998), and a market-power
effect reflecting the fact that foreign investors do not tend to acquire market leaders in
the U.S. industries in which they invest (Mataloni, 2000). Nevertheless, these studies
also recognize that a significant portion of the rate-of-return gap cannot be explained by
economic factors.
Another possible explanation for the rate-of-return gap is that some foreign direct in-
vestors use accounting devices to artificially reduce the profitability of their U.S. affiliates.
Some foreign-owned MNEs have an incentive to reduce the reported profits of their U.S.
operations because the statutory U.S. federal corporate tax rate (35 percent) is signifi-
cantly higher than the domestic tax rates in major investing countries, such as the United
Kingdom (20 percent), the Netherlands (20–25 percent), and Ireland (12.5 percent). More-
over, most other countries employ a territorial tax regime in which a resident corporation’s
tax liability is limited to income earned within the country’s borders, whereas the United
States employs a global tax regime in which the global profits of U.S. resident corporations
are taxed at the statutory U.S. rate. Each year, the U.S. Internal Revenue Service prose-
cutes foreign-owned U.S. companies, under Section 482 of the U.S. Treasury Regulations,
for overcharging their U.S. affiliates for goods and services provided by the foreign parent
group. Testimony before the U.S. Congress has documented some of the types of charges
used for profit shifting, including overpricing of goods, interest charges, and head office
charges, such as marketing and accounting (House Committee on Ways and Means, 1990).
24

Studies that have tried to quantify the significance of profit shifting have focused on
measuring the share of the rate-of-return gap that can be explained by quantifiable eco-
nomic factors, so the remainder might be considered an upper bound on the effects of profit
shifting. Grubert, Goodspeed, and Swenson (1993) control for the effects of maturation,
exchange rates, and asset valuation, and find them to account for about half of the rate-
of-return gap in a cross section of firms covering 1987. Grubert (1998) controls for these
effects and more, and finds that economic factors account for more than half of the gap,
perhaps as much as 75 percent. Nevertheless, even 25 percent of the rate-of-return gap
can represent tens of billions of dollars in profits that could be escaping official measures
of value added in the United States.
We hope to eventually apply the methods used in this paper for U.S.-owned MNEs to
U.S. affiliates of foreign-owned MNEs, but have not yet been able to do so because of data
challenges. Whereas the BEA direct investment surveys cover the worldwide operations
of U.S.-owned MNEs, for U.S. affiliates of foreign-owned MNEs, BEA does not have legal
authority to collect data on their worldwide operations. Collecting the data would require
combining BEA data on their U.S. operations with data on their worldwide operations
from a commercial data set such as Bureau van Dijk’s Orbis data set. A particularly
challenging aspect of this work is creating a match between companies in the two data
sets. A common numeric identifier does not exist in the two data sets, so the linking must
be done by name matching, which, because of inconsistencies and ambiguities in company
names, is time consuming.
Figure 7 – Foreign-owned MNEs
(a) 2007
0.0 0.1 0.2 0.3 0.4 0.5 0.6 0.7U.S. share of worldwide production
0.0
0.1
0.2
0.3
0.4
0.5
0.6
0.7
U.S
. sh
are
of
worl
dw
ide p
rofit
45-degree line
OLS fitted value
Lowess smoothed value
(b) 2012
0.0 0.1 0.2 0.3 0.4 0.5 0.6 0.7U.S. share of worldwide production
0.0
0.1
0.2
0.3
0.4
0.5
0.6
0.7
U.S
. sh
are
of
worl
dw
ide p
rofit
45-degree line
OLS fitted value
Lowess smoothed value
Nevertheless, to give a sense of the potential significance of profit shifting by foreign-
25

owned U.S. businesses, we develop a link between the BEA and Orbis data sets for 98
large technology-intensive foreign-owned U.S. businesses and collected the data needed to
conduct an apportionment exercise. In 2012, these 98 businesses accounted for 58 percent
of the R&D performed by, and 11 percent of the employment of, all foreign-owned U.S.
businesses. As reported in Figure 7b, the U.S. share of the worldwide profits of those busi-
nesses tended to be less than proportional to the U.S. share of their worldwide production,
as measured by employee compensation and net property, plant, and equipment. That is,
if U.S. profits were proportional to U.S. production, the two measures would fall on the
45-degree line. For the most part, however, the U.S. share of profits is significantly below
the 45-degree line. The locally weighted scatterplot (Lowess smoothed values) suggests
that, for foreign-owned businesses with less than 20 percent of their worldwide production
in the United States, their U.S. profits are roughly proportional to their U.S. production.
However, the U.S. profits of foreign-owned businesses with 40 percent or more of their
worldwide production in the United States are significantly understated relative to their
production in the United States. Of the 98 businesses, 16 have a U.S. share of worldwide
production greater than 30 percent. Altogether, if the profits of these 98 foreign-owned
businesses were reattributed using employee compensation and net property, plant, and
equipment as equally weighted apportionment factors, their U.S. profits would have been
$20.7 billion higher.
We repeat this exercise for 68 large technology-intensive foreign-owned U.S. businesses
in 2007 and find similar results. In 2007, the 68 businesses accounted for 52 percent of the
R&D performed by, and 10 percent of the employment of, all foreign-owned U.S. businesses.
The patterns in the graph for 2007 (Figure 7a) are similar to those in the graph for 2012,
suggesting that foreign-owned businesses with a large share of their global production in the
United States are particularly prone to understate their U.S. profits. Of the 68 businesses,
12 have a U.S. share of worldwide production greater than 30 percent. Altogether, if the
profits of these 68 foreign-owned businesses were reattributed using employee compensation
and net property, plant, and equipment as equally weighted apportionment factors, their
U.S. profits would have been $13.3 billion higher.
These patterns suggest that profits of foreign-owned MNEs are being shifted out of
the United States. If this is true, our findings from the U.S. MNE data (Section 3) are
the lower bounds of the mismeasurement of U.S. GDP caused by offshore profit shifting.
We leave for future work the quantification of foreign-owned MNE profit shifting and the
extent to which this profit shifting has changed over time.
26

6 Concluding remarks
Using firm-level data on U.S. MNEs, we find increasing profit shifting activity by U.S.
MNEs, leading to an understatement of measured gross domestic product. Our adjustments
mitigate the productivity slowdown found in official statistics. The adjustments raise
aggregate productivity growth rates by 0.1 percent annually from 1994 to 2004, by 0.25
percent annually from 2004 to 2008, and leave productivity unchanged after 2008.15 While
the worsening of the mismeasurement seems to have subsided after 2008, the problem
itself still persists: From 2008 to 2014, domestic business-sector value added in the United
States, on average, is understated by slightly more than 2 percent — or about $280 billion
— per year. The worst mismeasurement is found in industries that are R&D intensive or
that produce information technology; the very industries that have been singled out for
being the most responsible for the aggregate productivity slowdown.
The upward adjustments to U.S. value added imply downward adjustments to value
added in some other countries. For small countries with very low tax rates, such as Bermuda
and U.K.I, Caribbean, the adjustment is 5 to 6 times their annual GDP. Even for some
relatively large economies, such as Ireland and the Netherlands, the adjustments are as
large as 10–14 percent of their annual GDP.
We also examine the other component of mismeasurement — profit shifting by the
U.S. subsidiaries of foreign MNEs. The data used to analyze these companies is not as
complete as the BEA survey data that we use for U.S. MNEs, so we are not able to
provide a definitive assessment. That said, our preliminary findings — especially Figure 7
— suggest a similar pattern. Further work on this topic is warranted.
References
Aeppel, T. (2015): “Silicon valley doesn’t believe U.S. productivity is down,” Wall Street
Journal, July 17.
Alloway, T. (2015): “Goldman: how Grand Theft Auto explains one of the biggest
mysteries of the U.S. economy,” Bloomberg Business, May 26.
Altshuler, R., and H. Grubert (2010): “Formula apportionment: is it better than
the current system and are there better alternatives?,” National Tax Journal, 63(4),
1145–1184.
15It is not clear whether the apparent plateauing in profit shifting activity is related to corporateinversions, which cause some firms to exit the BEA survey sample used in this paper.
27

Anand, B. N., and R. Sansing (2000): “The weighting game: formulary apportionment
as an instrument of public policy,” National Tax Journal, 53(2), 183–200.
Avi-Yonah, R. S. (2010): “Between formulary apportionment and the OECD guidelines:
a proposal for reconciliation,” World Tax Journal, 2(1), 3–18.
Avi-Yonah, R. S., and I. Benshalom (2011): “Formulary apportionment — myth’s
and prospects,” World Tax Journal, 3(3), 371–399.
Avi-Yonah, R. S., and K. A. Clausing (2007): “Reforming corporate taxation in a
global economy: a proposal to adopt formulary apportionment,” Hamilton Project
Discussion Paper 2007-08, Brookings Institution.
Bartelsman, E. J., and R. M. W. J. Beetsma (2003): “Why pay more? Corporate tax
avoidance through transfer pricing in OECD countries,”Journal of Public Economics,
87(9-10), 2225–2252.
Bernard, A. B., J. B. Jensen, and P. K. Schott (2006): “Transfer pricing by
U.S.-based multinational firms,” NBER Working Paper 12493, National Bureau of
Economic Research.
Bloom, N., R. Sadun, and J. Van Reenen (2012): “Americans do IT better: U.S.
multinationals and the productivity miracle,” American Economic Review, 102(1),
167–201.
Bridgman, B. (2014): “Do intangible assets explain high U.S. foreign direct investment
returns?,” Journal of Macroeconomics, 40(A), 159–171.
Brynjolfsson, E., and A. McAfee (2011): Race against the Machine: How the Digital
Revolution Is Accelerating Innovation, Driving Productivity, and Irreversibly Trans-
forming Employment and the Economy. Digital Frontier Press.
Byrne, D. M., J. G. Fernald, and M. B. Reinsdorf (2016): “Does the United
States have a productivity slowdown or a measurement problem?,” Brookings Papers
on Economic Activity, Spring, 109–157.
Byrne, D. M., S. D. Oliner, and D. E. Sichel (2015): “How fast are semiconductor
prices falling?,”NBER Working Paper 21074, National Bureau of Economic Research.
Clausing, K. A. (2003): “Tax-motivated transfer pricing and U.S. intrafirm trade prices,”
Journal of Public Economics, 87(9-10), 2207–2223.
Eurostat (2016): “Irish GDP revision,” cso.ie/en/media/csoie/newsevents/
documents/EurostatIrishGDPcommunication.pdf.
Feldstein, M. (2015): “The U.S. underestimates growth,” Wall Street Journal, May 18.
Fernald, J. G. (2015): “Productivity and potential output before, during, and after the
Great Recession,” in NBER Macroeconomics Annual 2014, ed. by J. A. Parker, and
M. Woodford, vol. 29, pp. 1–51. University of Chicago Press.
28

Fuest, C., T. Hemmelgarn, and F. Ramb (2007): “How would the introduction of an
E.U.-wide formula apportionment affect the distribution and size of the corporate tax
base? An analysis based on German multinationals,” International Tax and Public
Finance, 14(5), 605–626.
Goolsbee, A., and E. L. Maydew (2000): “Coveting thy neighbor’s manufacturing:
the dilemma of state income apportionment,” Journal of Public Economics, 75(1),
125–143.
Gordon, R., and J. D. Wilson (1986): “An examination of multijurisdictional cor-
porate income taxation under formula apportionment,” Econometrica, 54(6), 1357–
1373.
Gresik, T. A. (2001): “The taxing task of taxing transnationals,” Journal of Economic
Literature, 39(3), 800–838.
Grubert, H. (1998): “Another look at the low taxable income of foreign-controlled com-
panies in the United States,” Proceedings. Annual Conference on Taxation and Min-
utes of the Annual Meeting of the National Tax Association, 91, 157–175.
Grubert, H., T. Goodspeed, and D. L. Swenson (1993): “Explaining the low taxable
income of foreign-controlled companies in the United States,” in Studies in Interna-
tional Taxation, ed. by A. Giovannini, R. G. Hubbard, and J. Slemrod, pp. 237–270.
University Chicago Press.
Grubert, H., and J. Mutti (1991): “Taxes, tariffs and transfer pricing in multinational
corporate decision making,” Review of Economics and Statistics, 73(2), 285–293.
Hatzius, J., and K. Dawsey (2015): “Doing the sums on productivity paradox v2.0,”
Goldman Sachs U.S. Economics Analyst, 15(30).
Hines, Jr., J. R. (2010): “Income misattribution under formula apportionment,” Euro-
pean Economic Review, 54(1), 108–120.
Hines, Jr., J. R., and E. M. Rice (1994): “Fiscal paradise: foreign tax havens and
American business,” Quarterly Journal of Economics, 109(1), 149–182.
House Committee on Ways and Means (1990): “Hearing before the Subcommit-
tee on Oversight, 101th Cong., statement of Patrick G. Heck, Assistant Counsel,
Subcommittee on Oversight, Committee on Ways and Means,” July 10.
Lipsey, R. E. (2009): “Measuring international trade in services,” in International Trade
in Services and Intangibles in the Era of Globalization, ed. by M. Reinsdorf, and M. J.
Slaughter, pp. 27–74. University of Chicago Press.
(2010): “Measuring the location of production in a world of intangible productive
assets, FDI, and intrafirm trade,” Review of Income and Wealth, 56(1), S99–S110.
Martens-Weiner, J. (2006): Company Tax Reform in the European Union: Guidance
29

from the United States and Canada on Implementing Formulary Apportionment in
the E.U. Springer.
Mataloni, Jr., R. J. (2000): “An examination of the low rates of return of foreign-owned
U.S. companies,” Survey of Current Business, 80(3), 55–73.
McGrattan, E. R., and E. C. Prescott (2010): “Technology capital and the U.S.
current account,” American Economic Review, 100(4), 1493–1522.
Mokyr, J. (2014): “Secular stagnation? Not in your life,” in Secular Stagnation: Facts,
Causes and Cures, ed. by C. Teulings, and R. Baldwin. CEPR Press.
Moylan, C. E., and C. A. Robbins (2007): “Research and Development Satellite
Account Update,” Survey of Current Business, 87(10), 49–64.
Organisation for Economic Co-operation and Development (2008a): OECD
benchmark definition of foreign direct investment. Organisation for Economic Co-
operation and Development.
(2008b): Report on the attribution of profits to permanent establishments. Organ-
isation for Economic Co-operation and Development.
Rassier, D. G. (2014): “Formulary measures for the U.S. current account: accounting
for transactions attributable to special purpose entities of multinational enterprises,”
Journal of Economic and Social Measurement, 39(4), 257–281.
(forthcoming): “Improving the SNA treatment of multinational enterprises,” Re-
view of Income and Wealth.
Rassier, D. G., and J. Koncz-Bruner (2015): “A formulary approach for attributing
measured production to foreign affiliates of U.S. parents,” in Measuring Globalization:
Better Trade Statistics for Better Policy, ed. by S. N. Houseman, and M. J. Mandel,
pp. 229–262. W.E. Upjohn Institute for Employment Research.
Roder, E. (2012): “Proposal for an enhanced CCTB as alternative to a CCCTB with
formulary apportionment,” World Tax Journal, 4(2), 125–150.
Runkel, M., and G. Schjelderup (2011): “The choice of apportionment factors under
formula apportionment,” International Economic Review, 52(3), 913–934.
Sanchirico, C. W. (2015): “As American as Apple Inc.: international tax and ownership
nationality,” Tax Law Review, 68(2), 207–274.
Smith, N. (2015): “The Internet’s hidden wealth,” Bloomberg View, June 6.
Syverson, C. (2016): “Challenges to mismeasurement explanations for the U.S. pro-
ductivity slowdown,” NBER Working Paper 21974, National Bureau of Economic
Research.
United Nations (2015): Guide to measuring global production. United Nations.
United Nations, Eurostat, and Organisation for Economic Co-operation
30

and Development (2011): The impact of globalization on national accounts.
United Nations.
A Appendix
A.1 Data and variable construction details
Data sources and productivity series
We construct annual and cumulative series of labor productivity growth for 1973–2014.
We use annual domestic business sector data published by the U.S. Bureau of Economic
Analysis (BEA) and by the U.S. Bureau of Labor Statistics (BLS) to construct unadjusted
series. The BEA data include aggregate value added in the national income and product
accounts (NIPA) and value added by industry in the Annual Industry Accounts (AIA)
for the entire period 1973–2014. The BLS data include, from the Labor Productivity and
Costs (LPC) database, aggregate number of hours worked for 1973–2014 and number of
hours worked by industry for 1987–2014. We also use annual data for transactions in
income on direct investment published by BEA in the International Transactions Accounts
(ITA), which are available for 1982–2014. In addition, we use annual survey-level data
collected by BEA on MNEs for 1982–2014 to construct an adjustment series based on
the formulary framework outlined in Section 2.3. We construct aggregate adjusted and
unadjusted productivity growth series that are consistent with Fernald (2015), and we also
construct adjusted and unadjusted productivity growth series grouped by R&D-intensive
industries and IT-intensive industries in order to more clearly observe the effects of our
adjustments for transactions in direct investment income attributable to intangible capital.
The NIPA data and the AIA data are current as of the annual revision of the NIPA
released on July 30, 2015. The LPC data we use were released on June 4, 2015. The ITA
data are current as of the annual revision of the ITA released on June 18, 2015. The MNE
survey data we use include surveys conducted for 1982, 1989, and 1994–2014.
The NIPA data and the AIA data that we use include real and nominal measures. We
use real measures to construct growth rates for the unadjusted series, and we use nominal
measures deflated to real measures to construct growth rates for the adjusted series. Real
measures from both the NIPA and the AIA are based on a chained Fisher formula with a
base year of 2009. We deflate nominal measures using either an actual or implicit deflator in
cases of business-sector aggregates or industry groups for which actual or implicit deflators
31

are available. In cases of industry groups for which actual or implicit deflators are not
published, we calculate growth rates using a Tornqvist formula.
While the productivity series span 1973–2014, the survey-level data are only available
for 1982–2014. Furthermore, some requisite survey-level data on U.S. parents were not
collected for 1983–1988 and 1990–1993. However, aggregate statistics on transactions in
income (i.e., direct investment income and portfolio income) are available for all years.
Thus, we extrapolate backward the nominal adjustment prior to 1982 using the aggregate
statistics as an indicator. In addition, we linearly interpolate the nominal adjustment for
1983–1988 and 1990–1993.
Aggregate unadjusted series with business sector data
Aggregate business-sector value added published in the NIPA includes nominal value added
published in NIPA table 1.3.5 and real value added published in NIPA table 1.3.6, which
yield an implicit deflator for business-sector value added. We derive an implied aggre-
gate nominal income-based measure of business-sector value added by subtracting nom-
inal expenditure-based value added for the non-business sector published in NIPA table
1.3.5 from aggregate nominal income-based GDP published in NIPA table 1.10. We de-
flate the implied aggregate nominal income-based measure using the implicit deflator for
business-sector value added. Thus, aggregate business-sector value added includes a real
expenditure-based measure and a real income-based measure from which we generate sep-
arate growth rates and then average across the expenditure- and income-based measures.
We then subtract the growth in the number of hours worked from the growth in value
added to construct annual and cumulative unadjusted series of aggregate labor productiv-
ity growth.
Aggregate adjusted series with business sector data
We apply survey-level data collected by BEA on MNEs to (11). The survey-level data
include financial and operating activities based on income statement information and bal-
ance sheet information reported for U.S. parents and their foreign affiliates on U.S. direct
investment abroad (USDIA). Depending on the year, the data are reported on either the
Annual Survey of U.S. Direct Investment Abroad (form BE-11) or the Benchmark Survey
of U.S. Direct Investment Abroad (form BE-10).
The survey-level data provide a source for apportionment factors on U.S. parents and
foreign affiliates. The apportionment factors include compensation and unaffiliated sales.
In addition, the survey-level data provide a source for earnings reported on U.S. parents
and foreign affiliates and provide a source for the U.S. parent’s reported voting interest in
32

a foreign affiliate. We infer a parent’s share of a foreign affiliate’s earnings under separate
accounting by multiplying earnings reported for the foreign affiliate by the U.S. parent’s
reported voting interest.
We generate an adjustment for aggregate nominal expenditure-based business-sector
value added and for our implied aggregate nominal income-based business-sector value
added by aggregating the survey-level adjustments obtained from (11). We then deflate
the adjusted nominal measures using the implicit deflator for business-sector value added
and construct annual and cumulative adjusted series of aggregate labor productivity growth
by averaging across the adjusted expenditure- and income-based measures and then sub-
tracting the same growth in the number of hours worked that we used in the unadjusted
aggregate series.
R&D intensity and IT intensity
The survey-level data allow us to calculate R&D intensity and IT intensity at the firm level
(i.e., U.S. parents and foreign affiliates for a given U.S. MNE). We calculate R&D intensity
by dividing firm-level R&D expenditures aggregated across all available years by firm-
level unaffiliated sales aggregated across all available years. We consider R&D-intensive
firms and industries to be those with R&D intensity at or above the 75th percentile. We
calculate IT intensity separately based on IT usage and IT production. IT-using firms are
determined by the proportion of unaffiliated sales generated by entities within a firm that
are classified to industries characterized as IT using in Bloom, Sadun, and Van Reenen
(2012). IT-producing firms are determined by the proportion of unaffiliated sales generated
by entities within a firm that are classified to industries characterized as IT producing in
Fernald (2015). In each case, IT-using firms and IT-producing firms include firms with
an unaffiliated sales proportion greater than 50 percent. Using the survey-level data, we
apply adjustments for R&D-intensive firms and IT-intensive firms to the industry-level
data to construct the adjusted labor productivity growth series for comparison with the
unadjusted series.
Unadjusted series
Value added by industry published in the AIA includes nominal and real measures as well
as the related chained Fisher price indexes. We generate the growth in unadjusted real
value added separately for industries grouped by R&D intensity and IT intensity using
the Tornqvist formula. We also generate the growth in the number of hours worked for
each group of industries. We then subtract the growth in the number of hours worked
from the Tornqvist growth in unadjusted real value added to construct separate annual
33

and cumulative unadjusted series of labor productivity growth for R&D industries, non-
R&D industries, IT-using industries, non-IT-using industries, IT-producing industries, and
non-IT-producing industries.
Adjusted series
We adjust nominal value added for industries grouped by R&D intensity and IT intensity.
We generate separate adjustments for R&D-intensive industries and IT-intensive industries
by first applying the survey-level data collected by BEA on MNEs to (11) and then aggre-
gating the survey-level adjustments for R&D-intensive firms, IT-using firms, IT-producing
firms, and the respective residual firms. We then generate the growth in adjusted nominal
value added for each group of industries, and we also generate the growth in prices for each
group using the Tornqvist formula. We subtract the growth in prices from the growth in
adjusted nominal value added to derive the growth in adjusted real value added. Finally, we
subtract the same growth in number of hours worked that we used in the unadjusted series
from the growth in adjusted real value added to construct separate annual and cumulative
adjusted series of labor productivity growth for R&D industries, non-R&D industries, IT-
using industries, non-IT-using industries, IT-producing industries, and non-IT-producing
industries.
34

A.2 Figures and tables
Table A.1 – Industry groupings
NAICS Codes Description
R&D Intensive 325 Chemical Manufacturing334 Computer and Electronic Product Manufacturing336 Transportation and Equipment Manufacturing511 Publishers5415 Computer Systems Design5417 Scientific R&D Services
IT Producing 334 Computer and Electronic Product Manufacturing51 Information5415 Computer Systems Design
IT Using 315 Apparel Manufacturing333 Machinery Manufacturing335 Electrical Equipment, Appliance, and Component Man.336 Transportation and Equipment Manufacturing337 Furniture and Related Product Manufacturing339 Miscellaneous Manufacturing42 Wholesale Trade44-45 Retail Trade51 Information532 Rental and Leasing Services5417 Scientific Research and Development Services
Notes: The IT-producing classification is from Fernald (2015). The IT-using classification is from Bloom,
Sadun, and Van Reenen (2012). The R&D classification is from Moylan and Robbins (2007). ISIC or SIC
codes have been converted to the NAICS-based ISI classification used by BEA in its surveys of MNEs.
35

Figure A.1 – Industry group shares of total gross output
(a) By R&D intensity
1970 1975 1980 1985 1990 1995 2000 2005 2010 20150.0
0.2
0.4
0.6
0.8
1.0
share
of
tota
l busi
ness
-sect
or
gro
ss o
utp
ut
R&D intensive
non-R&D intensive
(b) By IT-using intensity
1970 1975 1980 1985 1990 1995 2000 2005 2010 20150.0
0.2
0.4
0.6
0.8
1.0
share
of
tota
l busi
ness
-sect
or
gro
ss o
utp
ut
IT using
non-IT using
(c) By IT-producing intensity
1970 1975 1980 1985 1990 1995 2000 2005 2010 20150.0
0.2
0.4
0.6
0.8
1.0
share
of
tota
l busi
ness
-sect
or
gro
ss o
utp
ut
IT producing
non-IT producing
36

Figure A.2 – Industry group shares of total value added
(a) By R&D intensity
1970 1975 1980 1985 1990 1995 2000 2005 2010 20150.0
0.2
0.4
0.6
0.8
1.0
share
of
tota
l busi
ness
-sect
or
valu
e a
dded
R&D intensive
non-R&D intensive
(b) By IT-using intensity
1970 1975 1980 1985 1990 1995 2000 2005 2010 20150.0
0.2
0.4
0.6
0.8
1.0
share
of
tota
l busi
ness
-sect
or
valu
e a
dded
IT using
non-IT using
(c) By IT-producing intensity
1970 1975 1980 1985 1990 1995 2000 2005 2010 20150.0
0.2
0.4
0.6
0.8
1.0
share
of
tota
l busi
ness
-sect
or
valu
e a
dded
IT producing
non-IT producing
37
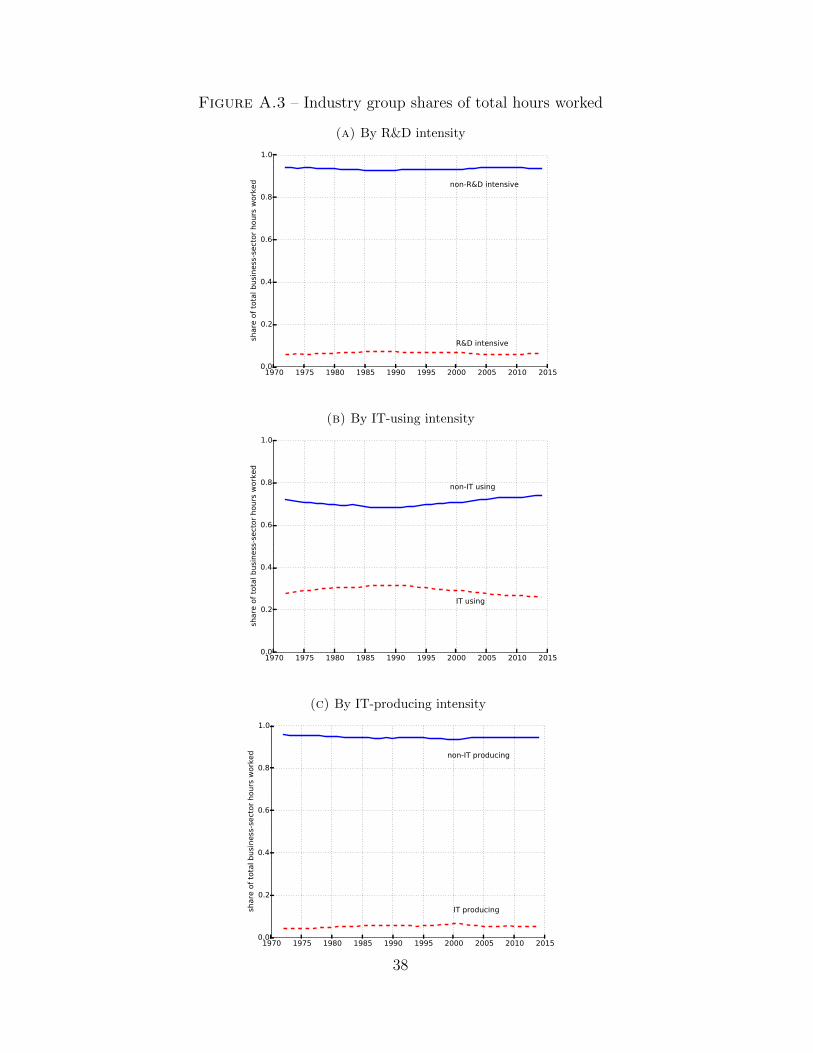
Figure A.3 – Industry group shares of total hours worked
(a) By R&D intensity
1970 1975 1980 1985 1990 1995 2000 2005 2010 20150.0
0.2
0.4
0.6
0.8
1.0
share
of
tota
l busi
ness
-sect
or
hours
work
ed
R&D intensive
non-R&D intensive
(b) By IT-using intensity
1970 1975 1980 1985 1990 1995 2000 2005 2010 20150.0
0.2
0.4
0.6
0.8
1.0
share
of
tota
l busi
ness
-sect
or
hours
work
ed
IT using
non-IT using
(c) By IT-producing intensity
1970 1975 1980 1985 1990 1995 2000 2005 2010 20150.0
0.2
0.4
0.6
0.8
1.0
share
of
tota
l busi
ness
-sect
or
hours
work
ed
IT producing
non-IT producing
38