o3 manual 1.0.2 nov2009 - weber state...
TRANSCRIPT

O3
REFERENCE MANUAL
DIGITAL OZONE AND RADIOSONDE DATA ACQUISITION AND PROCESSING SOFTWARE
FOR USE WITH EN-SCI CORPORATION MODEL 2Z ECC OZONESONDE INCORPORATING THE
INNOVATIVE SYSTEM DESIGNS V7 INTERFACE
Version 1.0.2 November 2009
EN-SCI Corporation P.O. Box 3234
Boulder, Colorado 80307 U.S.A. Telephone: (303) 494-1448 Fax: (303) 494-0478

Disclaimer:
Every effort has been made to provide the user with error-free documentation and software. These are supplied, however, without warranty, either expressed or implied. Suggestions from users for improving the software and documentation are welcome. Copyright © 1992-2009 by : James W. Wendell Innovative System Designs 20 Deer Hollow Lyons, Colorado 80540 [email protected]
Table of Contents 1.0 System Overview 1
2.0 The Ground System 2
3.0 System Requirements 2
4.0 Software Installation 3
4.1 Customizing Your Configuration 3
5.0 Starting a New Flight 4
6.0 Data Acquisition 7
6.1 Surface 7
6.2 Flight 9
7.0 Resuming a Flight 12
Appendix A - Binary Radiosonde Packet Definition 13
Appendix B – Radiosonde Commands 16
Appendix C - O3 RAW Data File Format 19
Appendix D - Default o3.ini File Entries 20
Appendix E - Correction Files 21
1
1.0 System Overview
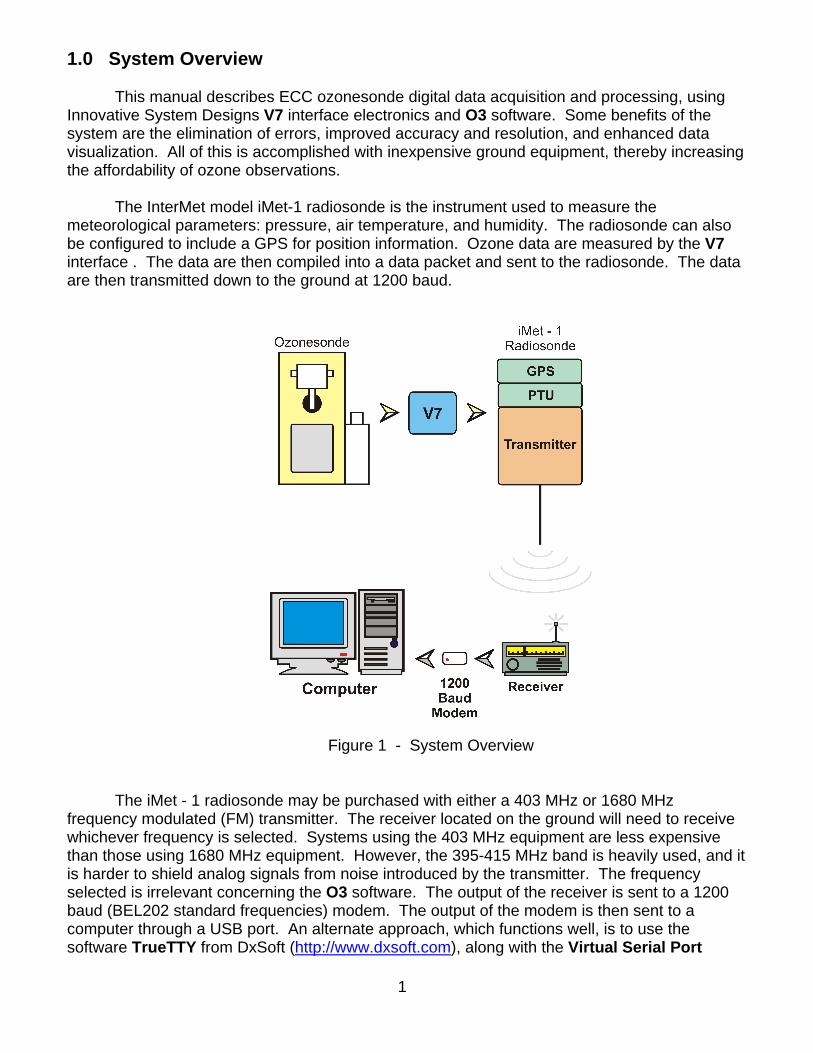
This manual describes ECC ozonesonde digital data acquisition and processing, using Innovative System Designs V7 interface electronics and O3 software. Some benefits of the system are the elimination of errors, improved accuracy and resolution, and enhanced data visualization. All of this is accomplished with inexpensive ground equipment, thereby increasing the affordability of ozone observations.
The InterMet model iMet-1 radiosonde is the instrument used to measure the meteorological parameters: pressure, air temperature, and humidity. The radiosonde can also be configured to include a GPS for position information. Ozone data are measured by the V7 interface . The data are then compiled into a data packet and sent to the radiosonde. The data are then transmitted down to the ground at 1200 baud.
Figure 1 - System Overview
The iMet - 1 radiosonde may be purchased with either a 403 MHz or 1680 MHz frequency modulated (FM) transmitter. The receiver located on the ground will need to receive whichever frequency is selected. Systems using the 403 MHz equipment are less expensive than those using 1680 MHz equipment. However, the 395-415 MHz band is heavily used, and it is harder to shield analog signals from noise introduced by the transmitter. The frequency selected is irrelevant concerning the O3 software. The output of the receiver is sent to a 1200 baud (BEL202 standard frequencies) modem. The output of the modem is then sent to a computer through a USB port. An alternate approach, which functions well, is to use the software TrueTTY from DxSoft (http://www.dxsoft.com), along with the Virtual Serial Port
2
Emulator software from Eterlogic (http://www.eterlogic.com) to replace the modem. The TrueTTY program allows the operator to use the computers sound card to demodulate the signal from the receiver. The Virtual Serial Port Emulator program is required to map a virtual serial port receiving the output from TrueTTY to another virtual serial port to send this data stream to the O3 program. A computer running the O3 software under Windows XP is used for collecting data on the ground.
The O3 data acquisition software is designed to be easy to operate, yet it is a powerful data collection package with built-in safeguards. These help new users learn the procedures associated with ozonesonde data collection. Multiple data files are generated during a flight, the .raw file contains date and time stamped comma-separated ASCII data. This file contains the original data transmitted from the iMet radiosonde and other instruments connected to it. A separate .cfg file contains the configuration information specific to the flight. Both the .raw and the .cfg files are required to post-process a flight. The O3 program will also create a few ASCII data files if the “Enable ASCII Logs” box is checked, under the “acquisition” tab, when configuring the software before data collection starts. The ASCII log files are; .ptu for pressure, temperature, and humidity data from the radiosonde, .gps for data from the GPS showing the package location and GPS time, .wnd for wind data if a GPS is installed, and .o3 for ozone data. These ASCII log files contain the unprocessed data transmitted from the devices. 2.0 The Ground System
The ground system is composed of the equipment required to receive and store data from the radiosonde/ozonesonde package. The ground system shown in Figure 1 consists of a receiver, modem, and computer. Other configurations are possible for the ground system as discussed in the previous section. A receiver is required to receive the transmission and a modem, or demodulation software, are required to demodulate the data.
A computer is used to record the information demodulated by the modem or demodulation software. The current version of O3 is written for a PC compatible computer running Windows XP. If using an external modem, the computer must have a USB port for the data stream input. If using demodulation software, such as TrueTTY, then the computer must have a compatible sound card. 3.0 System Requirements
An important part of the ground system is the receiver. Good reception will translate to fewer corrupted data packets. There are many different receiver manufacturers available to choose from for both 403 MHz and 1680 MHz frequencies. Best results will be obtained by selecting a receiver with high sensitivity and selectivity. A directional antenna and preamp are highly recommended for good reception throughout the flight.
The data transmitted from the iMet radiosonde is modulated using frequency-shift-keying (FSK). Two distinct frequencies are used to represent binary data. The frequencies used by the BEL202 protocol are 1200 Hz for a mark (1) and 2200 Hz for a space (0).

3
The ground computer should be a PC compatible running Windows XP to use the O3
software package. At least one USB port is required to connect the computer to the modem. If using the TrueTTY software instead of the modem, then the USB port is not required, instead the computer must have a compatible sound hardware. 4.0 Software Installation
The O3 software CD contains a setup program that is used to install the program. Run the O3_v1.0.2.msi program to install the O3 program and associated files. The installation will create a shortcut on the desktop from which you may start the program.
There is also a folder named “drivers” located on the disk containing the driver for the
modem which is required for Windows XP. Windows XP will want to search for a valid driver when the modem is first plugged into the computer. Instead of having Windows search for the driver, point to this folder so that the driver supplied will be loaded. 4.1 Customizing Your Configuration
The configuration information for the O3 program are stored in the o3.ini file located in the Windows directory. The operator can set almost all of the parameters from within the program. There are however a few settings that must be changed by directly editing the o3.ini file. Editing the file is done using a text editor such as notepad which is included with Windows. In the configuration file, each section starts with a section name enclosed in square brackets. Under a section there are entries set to some value. The section name and entry are not case sensitive. Any text appearing after a semicolon is considered a comment and is ignored. A complete o3.ini file is listed in Appendix C.
The entries in the o3.ini file that are not editable from within the O3 program are:
[acq] files="'C:\Program Files\o3\data\bldr_'yyyymmdd" reqSFC=5 launchDetPr=3.0 launchDetHgt=10.0 burstDet=10 The “files” entry is used to define what the default data filename format will be. In the example listed above, the “yyyymmdd” will be replaced with the current year month and day automatically. The operator can over-ride this default filename at flight time. The “reqSFC” entry is used to determine the required length of time, in minutes, that the operator must stay in the Surface Mode of data collection before moving on to Flight Mode. Setting “reqSFC=0” will allow the operator to move to Flight Mode as soon as possible, but it will not allow the operator to switch to Flight Mode immediately. A minimum of at least 15 values of pressure, temperature, and humidity (PTU) data must be collected in Surface Mode, which will be used to calculate surface data, before allowing the operator to switching to Flight Mode.
4
If the radiosonde is equipped with a pressure sensor then the “launchDetPr” is used to detect when the balloon is launched. If the radiosonde does not have a pressure sensor then the GPS height data and “launchDetHgt” will be used to detect when the balloon is launched. The “burstDet” entry is used to detect when the balloon has popped and is descending. This value is used to eliminate false descent detection. 5.0 Starting a New Flight
Making an ozone flight requires thorough preparation of the ozonesonde before flight time. The radiosonde does not require any preparation before flight unless you know that you want to modify the radiosonde from it’s default configuration.
Remember if using the radiosonde equipped with a GPS that the radiosonde requires a
clear view of the sky with no obstructions to acquire an accurate position. The time required for the GPS to lock on to it’s current position is directly related to it’s view of the sky. Obstructions will limit the number of satellites the GPS can receive data from, and will therefore require more time. It is important to have the GPS position acquired before launching the balloon, especially if the radiosonde is operating without a pressure sensor. Usually the GPS should acquire it’s position while the package is placed outside to acquire surface data. However, there are times when solar activity will prevent the GPS from receiving signals from satellites. Solar activity data can be obtained from the National Weather Service Space Weather Prediction Center at http://www.swpc.noaa.gov.
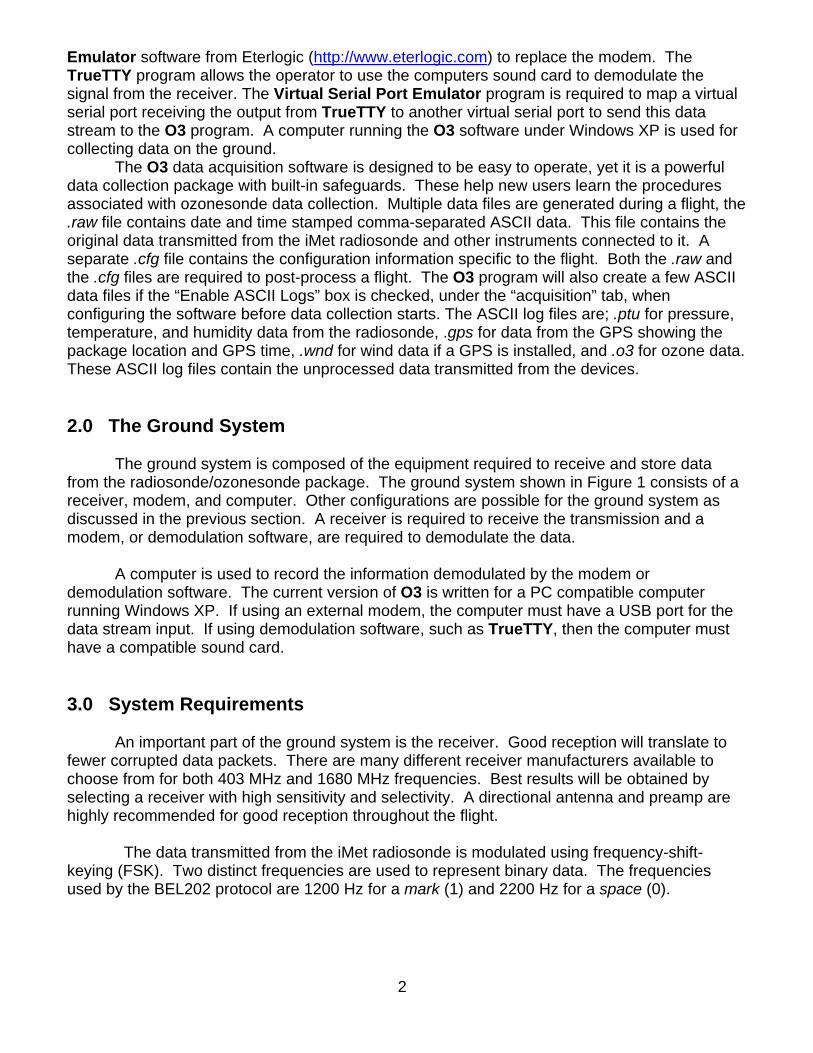
Start the O3 program by clicking on the desktop icon. After briefly showing the program
logo, the main window will open which will look like the image shown in figure 2. When you are ready to start a new flight press the “Start” button. The other three “... Text Data” buttons are used to display the appropriate data streams in simple ASCII text. Note that no data will be displayed in these windows until the software enters acquisition mode.
Figure 2 – O3 Program Main Window

5
Once the “Start” button is pressed the main window will close, and in it’s place will be displayed a configuration window as shown in figure 3 below. The configuration window contains four tabs; Station, Radiosonde, Ozonesonde, and Acquisition. You should check the settings in each of the four tabs before pressing the “Ok” button.
Figure 3 - Station Configuration The “Station” tab contains information about where you will be launching the balloon from. Once the station information is set it is rarely change.
Figure 4 - Radiosonde Configuration

6
The “Radiosonde” tab contains information about the radiosonde configuration. Many times the “Probe ID” is not visible and cannot be read without disassembling the radiosonde. In this case you may simply leave it blank, it is for information purposes only. The O3 program is written such that the radiosonde must at least have a pressure sensor or a GPS installed. It may have both sensors, but it must have at least one. Check the appropriate box depending on the radiosonde configuration.
Figure 5 - Ozonesonde Configuration
The “Ozonesonde” tab contains information for up to 4 ozonesondes. Use the “<” and “>” buttons to navigate through the ozonesonde configuration data. The same Bkg Correction and Pump Efficiency files are used when processing ozone data from all ozonesondes. The Bkg Correction and Pump Efficiency files are text files that can be edited with a text editor such as notepad. Changing this data should be a very rare event.
Figure 6 - Acquisition Configuration

7
The “Acquisition” tab is where the serial port for the data stream from the modem is selected along with the baudrate or speed. Both of these settings will depend on your hardware and software configuration. The baudrate should be set to 1200 when using the USB modem. The date field is automatically set based on the PC’s clock. The base data filename is automatically generated based on the setting in the o3.ini file. The different files generated by the O3 program will all have this name, and the extension will be used to identify the different files. The Wind Interval is used to determine how often wind data is calculated. Too short of an interval will lead to noisier data. Wind data is displayed in real-time based on this interval. If you wish to see the ASCII log files of the incoming data then you should check the box enabling the logs. 6.0 Data Acquisition There are two phases of data collection; Surface and Flight. The Surface phase collects surface data and will require that the flight package be placed outside in a representative location. The data collected during this phase should be compared with other surface instruments, if available, to confirm proper operation before the instrument is flown. It is important to note that the user should never launch any instrument unless they are satisfied with its performance on the ground. The data from a malfunctioning instrument will seldom improve during a flight. The last phase of data collection is the flight itself. The software will not terminate the flight when the balloon bursts, thus allowing the user to collect ascent and descent data. The data plot colors will change when the software detects that the balloon has popped to facilitate easier viewing of ascent and descent data. The user should terminate the flight manually when enough data has been collected. 6.1 Surface The first phase of data collection records surface data. The ozonesonde should be prepared for flight using the actual batteries that will be used in flight. The user should also verify that the radiosonde frequency is clear and make any frequency adjustments at this time to prevent interference. The instrument package should be placed in an appropriate location for measuring surface data and receiving GPS satellites if installed. The ozonesonde pump temperature should be monitored to prevent overheating in warm climates or cooling too much in cold climates. This may involve placing the instrument package in a shaded location and/or removing the ozonesonde cover. If removed, the ozonesonde cover must be reattached prior to launching the instrument. The Surface window should look similar to the window shown in figure 10. Figure 11 is an example of a plot showing surface pressure data.

8
Figure 10 - Surface Acquisition
For good GPS data you should have reception from at least 4 satellites (nSatellites). The more satellites that the GPS can receive the better the location information will be. The time reported by the GPS will also be indicated. GPS time is not UTC time. The GPS specification made no prevision for leap seconds. Currently, GPS time leads UTC time by 14 seconds.
Figure 11 – Surface Pressure Plot
The toolbar located at the top of the window shown in Figure 11 perform the following functions (from left to right):

9
Resume - Continue plot monitoring to keep the trace(s) in the plot window. Axis Pan - Move the selected axis. Axis Scale - Expand or shrink the selected axis scale. Zoom Out - Expand both X and Y axis scales by a factor of 2. Zoom In - Shrink both X and Y axis by a factor of 2. Zoom Box - Zoom in on the selected area. Cursor - activate the cursor to display data values. Save - Save the current plot as an image.
The “Flight” button will be disabled until sufficient time has elapsed. The time required is set by the “reqSFC” parameter in the o3.ini file (see section 4.1 above). Once the required amount of time has elapsed, the “Flight” button will be enabled. At that point you may continue on to the flight acquisition phase of data collection. At any time you may press the “Abort” button which will stop data collection and revert back to the very beginning as if the O3 program had just been started.
When you are satisfied with the surface data collected, but before launching the balloon,
press the “Flight” button to advance to flight acquisition. Before the flight acquisition windows are opened, you will first be prompted for surface PTU data as measured by a standard set of instruments. The surface data window will appear as shown in figure 12. This standard data can be used to confirm the accuracy of the radiosonde data. If the radiosonde is not equipped with a pressure sensor then the surface pressure and GPS data will be used to calculate pressure. In this case, the accuracy of the surface pressure is very important. If you do not have surface standards available then you may leave the values blank. If the surface pressure does not match the radiosonde pressure, you will be required to confirm that you wish to continue. You may cancel this window and return back to surface acquisition by pressing the “Cancel” button, or you may accept the values entered and continue to flight acquisition by pressing the “Accept” button.
Figure 12 - Standard Surface Data 6.2 Flight The final phase of data collection will record data as the instrument package is flown on the balloon. After verifying that the instruments are still operating properly, the radiosonde and ozonesonde package should be tied to the balloon per instructions provided by EN-SCI. The software will detect the balloon launch by the change in pressure transmitted from the

10
radiosonde. If the radiosonde is not equipped with a pressure sensor then the software will use the GPS height data to determine when the balloon is launched. The user should monitor the signal strength on the receiver and tune the receiver if necessary throughout the flight. The operator will also need to aim the antenna during the flight when using a directional antenna. The “Balloon Direction” field located in the lower right section of the Flight window can be used to assist the operator in aiming the antenna if the radiosonde is equipped with GPS. Wind data will also be calculated in real-time when a GPS is installed. The wind data is located in the lower left section of the Flight window.
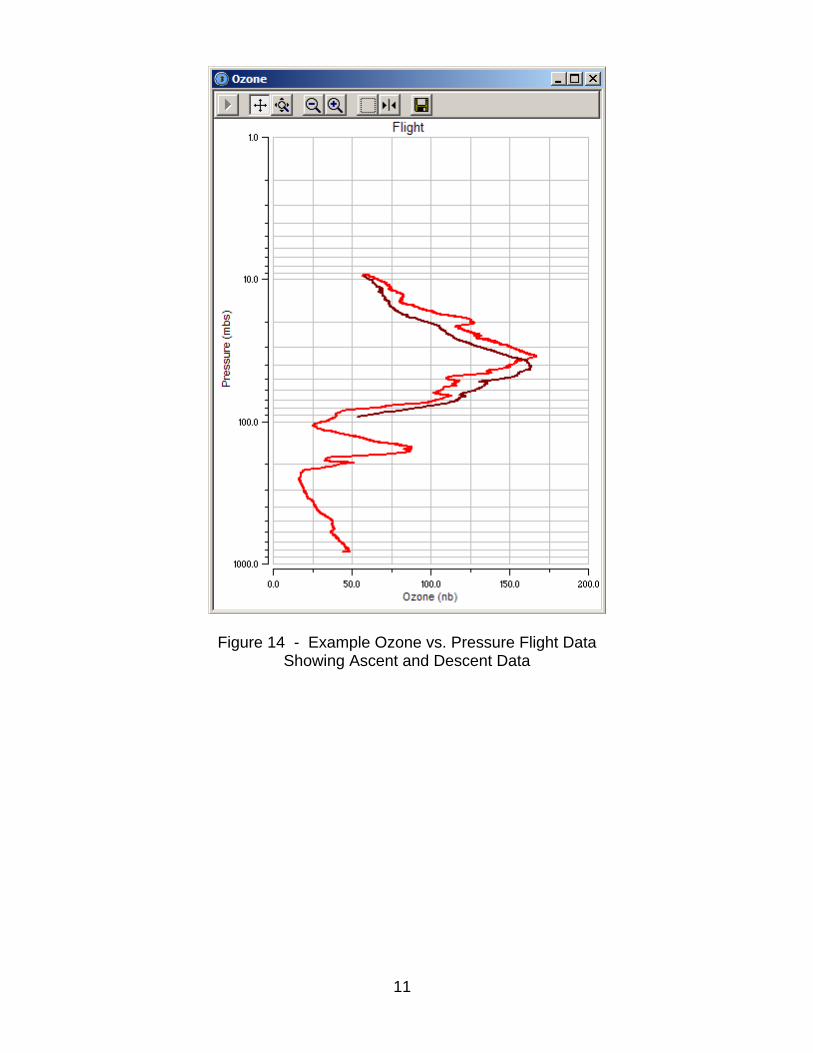
Figure 13 - Flight Acquisition The Flight window is similar in appearance to the Surface window. Balloon direction and wind data are included in the Flight window and appear at the bottom. A new button now appears in the “Radiosonde” section. The button is shown in figure 13, which only contains the text “P”. This button is used to define the vertical axis in all flight plots. When the button is pressed, the text will toggle between “P” and “H”. When the button text is “P”, all data plots will use pressure as the vertical axis. When the button text is “H”, all plots will use height as the vertical axis. Figure 14 shows what a typical ozone plot will look like when plotted against pressure, while figure 15 shows what it would look like plotted against height. To terminate the flight you must press the “End” button. Do not press this button until you are certain that you do not want to collect any more data. There is no resume feature built in to the software when the program has terminated normally.
11
Figure 14 - Example Ozone vs. Pressure Flight Data Showing Ascent and Descent Data

12
Figure 15 - Example Ozone vs. Height Flight Data Showing Ascent and Descent Data
7.0 Resuming a Flight In the unfortunate circumstance that data acquisition is terminated before the end of the flight due to an abnormal program close by the operating system, the user may continue data collection by restarting the O3 program. The program will detect that it did not terminate properly and prompt the operator if they wish to continue the flight. If you select to continue the flight the program will reload all of the previous data and then start collecting flight data again.

13
Appendix A - Binary Radiosonde Packet Definition PTU data packet:
offset bytes description 0 1 SOH = 0x01 1 1 PKT_ID = 0x01 2 2 PKT = packet number 4 3 P, mbs (P = n/100) 7 2 T, °C (T = n/100) 9 2 U, % (U = n/100)
11 1 Vbat, V (V = n/10) 12 2 CRC (16-bit)
packet size = 14 bytes transmission time at 1200 baud = 117 mSec PTU (enhanced) data packet:
offset bytes description 0 1 SOH = 0x01 1 1 PKT_ID = 0x04 2 2 PKT = packet number 4 3 P, mbs (P = n/100) 7 2 T, °C (T = n/100) 9 2 U, % (U = n/100)
11 1 Vbat, V (V = n/10) 12 2 Tint, °C (Tint = n/100) 14 2 Tpr, °C (Tpr = n/100) 16 2 Tu, °C (Tu = n/100) 18 2 CRC (16-bit)
packet size = 20 bytes transmission time at 1200 baud = 167 mSec

14
GPS data packet:
offset bytes description 0 1 SOH = 0x01 1 1 PKT_ID = 0x02 2 4 Latitude, +/- deg (float) 6 4 Longitude, +/- deg (float)
10 2 Altitude, meters (Alt = n-5000) 12 1 nSat (0 - 12) 13 3 Time (hr,min,sec) 16 2 CRC (16-bit)
packet size = 18 bytes transmission time at 1200 baud = 150 mSec GPS (enhanced) data packet:
offset bytes description 0 1 SOH = 0x01 1 1 PKT_ID = 0x05 2 4 Latitude, +/- deg (float) 6 4 Longitude, +/- deg (float)
10 2 Altitude, meters (Alt = n-5000) 12 1 nSat (0 - 12) 13 4 East-West velocity, m/s (float) 17 4 North-South velocity, m/s (float) 21 4 Up-Down velocity, m/s (float 25 3 Time (hr,min,sec) 28 2 CRC (16-bit)
packet size = 30 bytes transmission time at 1200 baud = 250 mSec

15
Extra data packet:
offset bytes description 0* 1 SOH = 0x01 1* 1 PKT_ID = 0x03 2* 1 N = number of data bytes to follow ... ... Data (50 bytes max)
3 + N* 2 CRC (16-bit) * = automatically generated by radiosonde packet size = N+5 bytes (55 bytes max) Ozonesonde data (using extra data packet):
offset bytes description 0* 1 SOH = 0x01 1* 1 PKT_ID = 0x03 2* 1 N = 8 3 1 Instrument_type = 0x01 4 1 Instrument_number (1-255) 5 2 Icell, uA (I = n/1000) 7 2 Tpump, °C (T = n/100) 8 1 Ipump , mA (255 mA max)
10 1 Vbat, V (V = n/10, 25.5 V max) 11* 2 CRC (16-bit)
* = automatically generated by radiosonde packet size = 12 bytes transmission time at 300 baud = 400 mSec, 1200 baud = 100 mSec

16
Appendix B - Radiosonde Commands When equipped with an external cable, the iMet radiosonde can transmit data to the ground system from a large assortment of sensors. Some of the radiosonde settings can also be programmed through this cable. Communications with the iMet radiosonde are at 9600 baud, no parity, 8 data bits, and 1 stop bit (9600,n,8,1). It is important to note that the signals are at 3.3V levels and connect directly to the microprocessor. A small USB adapter is available from EN-SCI which is designed to allow a computer to communicate directly with the radiosonde through the external cable. With a null-modem style cable, this USB adapter can also be used to communicate with the V7 board located in the 2Z ozonesonde. The following commands are recognized by the iMet radiosonde, they are not case sensitive. All commands are terminated by a carriage return (Enter) and will generate a response from the radiosonde. SID – The SID (sonde ID) command will get or set the radiosonde id. The maximum length of the SID data is 12 characters. The SID is the main number used to identify the radiosonde and is located on the Styrofoam box cover as well as the power switch. (ie. “sid=S1234”) PID – The PID (probe ID) command will get or set the probe id. The maximum length of the PID data is 12 characters. The PID is located on the sensor arm near the end that connects to the main board of the radiosonde. The number may not be visible unless the Styrofoam box is disassembled. (ie. “pid=P1234”) TXRF – The TXRF (RF transmitter) command is used to turn the transmitter power amplifier on or off. If the transmitter is turned off then data cannot be received at the ground system. (ie. “txrf=on” or "txrf=off") DATA – The DATA command is used to turn on or off the serial data streams for pressure, temperature, and humidity (PTU), position (GPS), and status (STAT). Once a data steam is turned on, the data will be sent from the radiosonde at a 1-second interval over the external cable (9600,n,8,1). (ie. "data=on" or "data=off") PTU – The PTU command is used to turn on or off the serial data stream for pressure, temperature, and humidity (PTU). Once a data steam is turned on, the data will be sent from the radiosonde at a 1-second interval over the external cable (9600,n,8,1). (ie. "ptu=on" or "ptu=off") The PTU data is sent in the following format: PTU: pressure(mbs), air_temperature(°C), humidity(%) STAT – The STAT command is used to turn on or off the serial data stream for radiosonde status information. Once a data steam is turned on, the data will be sent from the radiosonde at a 1-second interval over the external cable (9600,n,8,1). (ie. "stat=on" or "stat=off") The status information is sent in the following format: STAT: battery_voltage(V), T_internal(°C)

17
GPS – The GPS command is used to turn on or off the serial data stream for radiosonde position information. Once a data steam is turned on, the data will be sent from the radiosonde at a 1-second interval over the external cable (9600,n,8,1). (ie. "gps=on" or "gps=off") The position information is sent in the following format: GPS: latitude(deg), longitude(deg), altitude(M), number_of_sats, hh:mm:ss Note – The time included in this message is the GPS time, not UTC time. GPS time does not account for leap-seconds. GPS time is currently 14 seconds ahead of UTC time. HSP – The HSP (heater set-point) command is used to get or set the minimum temperature inside the radiosonde. When the internal temperature drops below the heater set-point, internal heaters will be activated. The heaters consume power from the radiosonde battery pack and will shorten battery life if the temperature is set too high. (ie. "hsp=-10") LEDS – The LEDS command is used to enable or disable the light emitting diodes (LEDs). The LEDs are used to indicate proper radiosonde operation. The LEDs do not consume a large amount of power, but may be turned off to maximize battery life. (ie. “leds=on" or "leds=off") PTURR – The PTURR (PTU report rate) command is used to get or set the pressure, temperature, and humidity (PTU) report rate (in seconds). This controls the interval between successive PTU packets transmitted by the radiosonde. It does not control the report rate over the external serial cable. Setting the PTURR to 0 (“pturr=0”) will disable PTU data transmissions. (ie. "pturr=1") GPSRR – The GPSRR (GPS report rate) command is used to get or set the GPS report rate (in seconds). This controls the interval between successive GPS packets transmitted by the radiosonde. It does not control the report rate over the external serial cable. Setting the GPSRR to 0 (“gpsrr=0”) will disable GPS data transmissions. (ie. "gpsrr=1") TXFREQ – The TXFREQ (transmitter frequency) command is used to get or set the transmission frequency assigned to each position of the main switch. The default frequencies are 402 MHz, 403 MHz, 404 MHz and 405 MHz, for the 403 MHz transmitter. ( ie. "txfreq=403.5" to assign switch pos 1, "txfreq=401.0,401.5,403,403.5" to assign all switch positions)

18
XDATA – The XDATA (external data) command is used to transmit data from an external instrument, like an ozonesonde, to the ground system. Binary data are sent to the radiosonde using the external cable (9600,n,8,1) in an ASCII format. Two characters are used to represent each byte of data in a hexidecimal format. The maximum amount of data that can be sent in one message is 50 bytes (100 characters). The radiosonde uses Xon/Xoff handshaking to prevent buffer overflows, so the external device should listen for these characters to prevent corrupt data transmissions. There is no need to include a checksum byte in the data stream because the radiosonde will append the necessary bytes to the data transmission, which includes a 16-bit CRC. Refer to Appendix A for more information on the format of the external data packets as sent by the radiosonde. (ie. "xdata=0102030405060708090A") It is not mandatory, but highly recommended, that any new instrument follow the example of the ozonesonde data packet and include instrument type and instrument number as the first two bytes in each data string (packet). This information will allow the ground software to distinguish the instrument type and order (if multiple instruments flown). PTUX – The PTUX command is used to turn on or off the enhanced pressure, temperature, and humidity (PTU) data stream that is transmitted to the ground system (ie. "ptux=on" or “ptux=off"). GPSX – The GPSX command is used to turn on or off the enhanced GPS data stream that is transmitted to the ground system (ie. "gpsx=on" or "gpsx=off"). SAVE – The SAVE command is used to save the current configuration to non-volatile (NV) memory. Changes to the radiosonde settings may be made, and tested, without fear of changing the default configuration because the changes will not be committed to NV memory until the save command is executed. If changes were made to the radiosonde configuration that you do not wish to keep, simply cycle the radiosonde power and the default values will be restored. Once the SAVE command has been executed, the current configuration will become the default configuration used when power is applied.

19
Appendix C - O3 RAW Data File Format The O3 program will save all data with a valid CRC into a .raw file. Listed below are a few lines from such a file. Each data packet appears on a single line that is data and time stamped for when the packet was received. The date appears in “year/month/day” format. The time appears in “hour:minute:second” format. The data that follows is the data packet, starting with the SOH character and ending with the CRC. The data are hex bytes formatted for text display. 2009/10/28, 23:42:29.406, 0103080101029E07664B9D0E61 2009/10/28, 23:42:30.812, 010200000000000000008813020000007ED4 2009/10/28, 23:42:31.000, 01042902504201A303561536530729070C04654E 2009/10/28, 23:42:31.609, 0103080101029C07664B9D4AE2 2009/10/28, 23:42:31.812, 010200000000000000008813020000007ED4 2009/10/28, 23:42:32.015, 01042B025D42016203E515355A072707F90395A3 2009/10/28, 23:42:32.609, 0103080101029A07664B9C9746
20
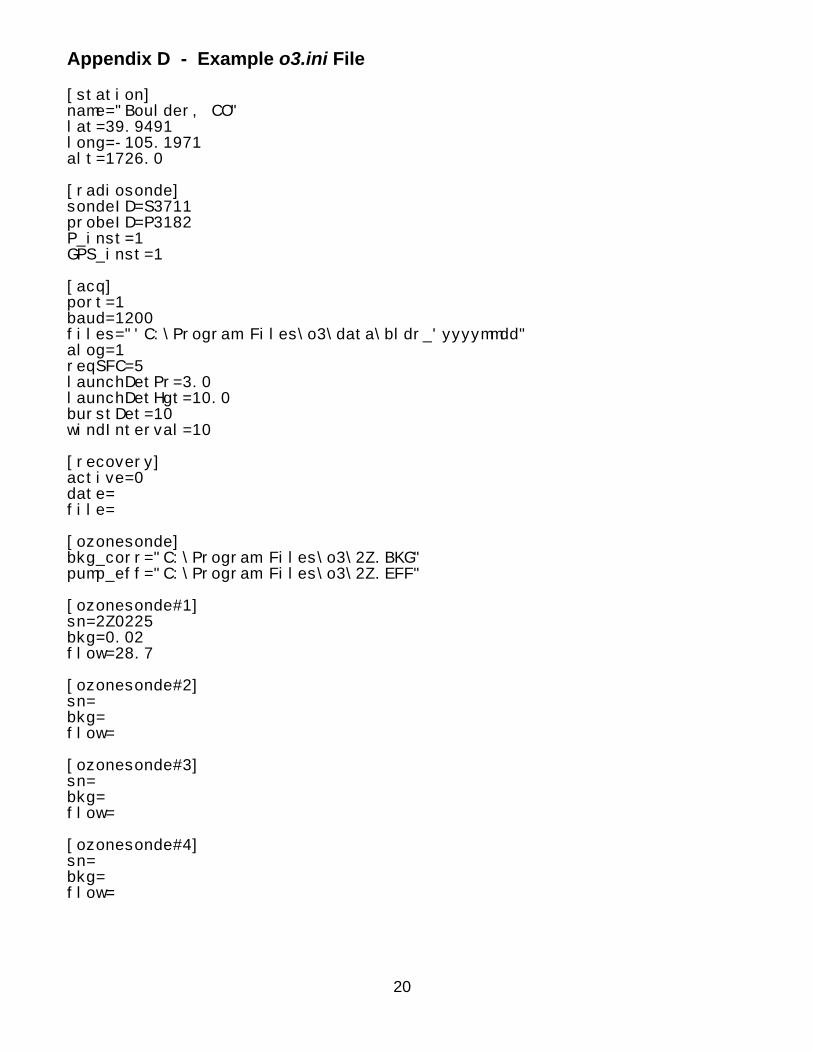
Appendix D - Example o3.ini File [station] name="Boulder, CO" lat=39.9491 long=-105.1971 alt=1726.0 [radiosonde] sondeID=S3711 probeID=P3182 P_inst=1 GPS_inst=1 [acq] port=1 baud=1200 files="'C:\Program Files\o3\data\bldr_'yyyymmdd" alog=1 reqSFC=5 launchDetPr=3.0 launchDetHgt=10.0 burstDet=10 windInterval=10 [recovery] active=0 date= file= [ozonesonde] bkg_corr="C:\Program Files\o3\2Z.BKG" pump_eff="C:\Program Files\o3\2Z.EFF" [ozonesonde#1] sn=2Z0225 bkg=0.02 flow=28.7 [ozonesonde#2] sn= bkg= flow= [ozonesonde#3] sn= bkg= flow= [ozonesonde#4] sn= bkg= flow=
21
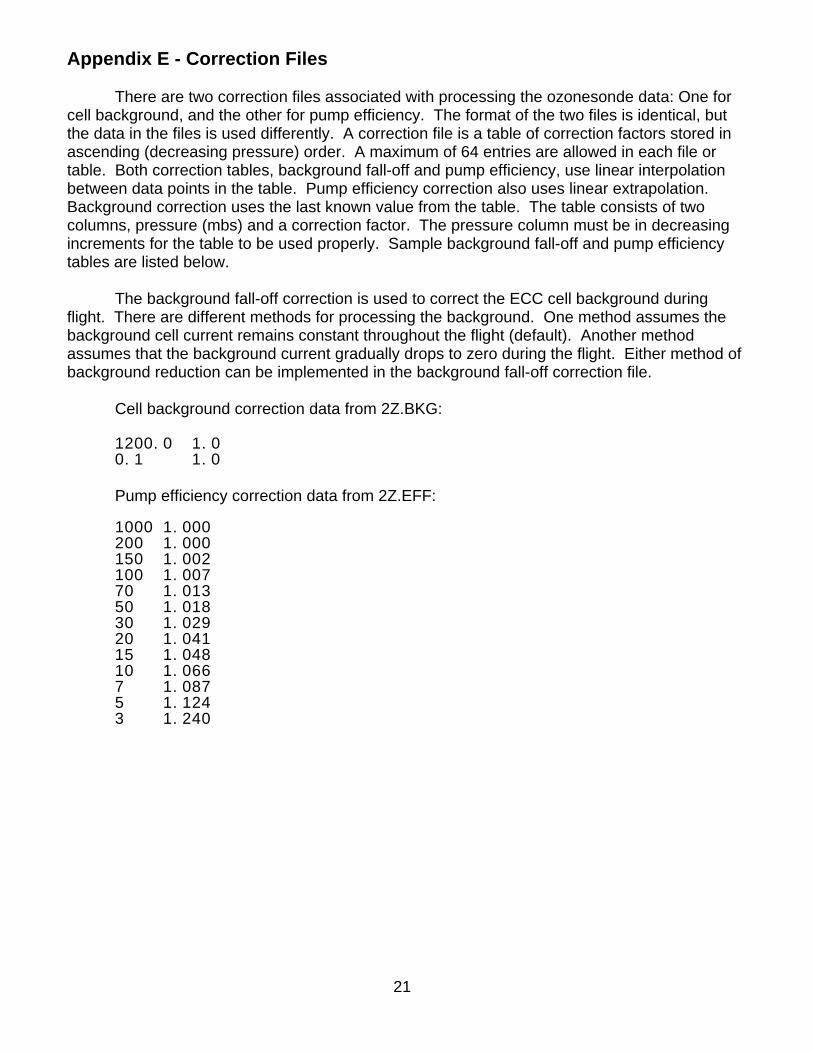
Appendix E - Correction Files
There are two correction files associated with processing the ozonesonde data: One for cell background, and the other for pump efficiency. The format of the two files is identical, but the data in the files is used differently. A correction file is a table of correction factors stored in ascending (decreasing pressure) order. A maximum of 64 entries are allowed in each file or table. Both correction tables, background fall-off and pump efficiency, use linear interpolation between data points in the table. Pump efficiency correction also uses linear extrapolation. Background correction uses the last known value from the table. The table consists of two columns, pressure (mbs) and a correction factor. The pressure column must be in decreasing increments for the table to be used properly. Sample background fall-off and pump efficiency tables are listed below.
The background fall-off correction is used to correct the ECC cell background during flight. There are different methods for processing the background. One method assumes the background cell current remains constant throughout the flight (default). Another method assumes that the background current gradually drops to zero during the flight. Either method of background reduction can be implemented in the background fall-off correction file.
Cell background correction data from 2Z.BKG:
1200.0 1.0 0.1 1.0
Pump efficiency correction data from 2Z.EFF: 1000 1.000 200 1.000 150 1.002 100 1.007 70 1.013 50 1.018 30 1.029 20 1.041 15 1.048 10 1.066 7 1.087 5 1.124 3 1.240