oakland redevelopment agency
TRANSCRIPT


Oakland Redevelopment Agency FY 2009-11 Adopted Budget
Chief Executive Officer Mayor Ronald V. Dellums
Agency Chairperson Jane Brunner (District 1)
Members of the Board Ignacio De La Fuente (District 5) Pat Kernighan (District 2)
Desley Brooks (District 6) Nancy Nadel (District 3) Rebecca Kaplan (At-Large) Jean Quan (District 4)
Larry Reid (District 7)
Agency Administration Dan Lindheim
Marianna Marysheva-Martinez
LaTonda Simmons, Agency Secretary Joe Yew, Agency Treasurer
John Russo, Agency Counsel
Prepared by Office of the City Administrator
Budget Office Cheryl Taylor, Budget Director Kirby Smith, Financial Analyst
Rina Hernandez, Budget & Operations Analyst
Support Staff Michelle Soares
In Conjunction With Community & Economic Development Agency Staff


___________________________________________ TABLE OF CONTENTS
TABLE OF CONTENTS
FINANCIAL SUMMARIES ................................................................................................................... A-1 ORA Financial Summary .......................................................................................................................... A-1
Funding Sources by Project Area / Program - FY 2009-10...................................................................... A-2 Funding Uses by Project Area / Program - FY 2009-10 ................................................................... A-3 Funding Sources by Project Area / Program - FY 2010-11............................................................... A-4 Funding Uses by Project Area / Program - FY 2010-11........................................................................... A-5 Use of Tax Increment Revenue for Mandated Spending - FY 2009-10 ..............................................A-6 Use of Tax Increment Revenue for Mandated Spending - FY 2010-11 ..............................................A-7 Personnel Services and Related Overhead Costs - FY 2009-10.......................................................A-8 Personnel Services and Related Overhead Costs - FY 2010-11.......................................................A-10 Summary of Full-Time Equivalents (FTEs) - FY 2007-09 to FY 2009-11............................................A-12 Debt Service Summary - FY 2009-10.............................................................................................A-16 Debt Service Summary - FY 2010-11.............................................................................................A-17
PROJECT SUMMARIES...................................................................................................................... B-1
Central District Redevelopment Project Area ................................................................................ B-1 Area Map .................................................................................................................................................. B-1 Funding Sources and Uses - FY 2009-11 ................................................................................................ B-2 Project Area Overview.............................................................................................................................. B-3 Operating Reserve Status ............................................................................................................B-5 Downtown Walking Patrol and Police Services Program......................................................................... B-6 Economic Development Program............................................................................................................. B-7 Marketing and Special Events Program ................................................................................................... B-9 Capital Spending – Status of Funds......................................................................................................... B-12 Capital Project Descriptions ..................................................................................................................... B-13 Central District Capital Spending Plan ..................................................................................................... B-22
Coliseum Redevelopment Project Area...................................................................................................... B-23 Area Map .................................................................................................................................................. B-23 Funding Sources and Uses - FY 2009-11 ................................................................................................ B-24 Project Area Overview.............................................................................................................................. B-25 Operating Reserve Status ............................................................................................................B-28 Capital Spending – Status of Funds......................................................................................................... B-29 Capital Project Descriptions ..................................................................................................................... B-30 Central District Capital Spending Plan ..................................................................................................... B-37
i

TABLE OF CONTENTS ________________________________________________
PROJECT SUMMARIES (continued) Acorn Redevelopment Project Area............................................................................................................ B-39
Area Map .................................................................................................................................................. B-39 Funding Sources and Uses - FY 2009-11 ................................................................................................ B-40 Project Area Overview.............................................................................................................................. B-41 Operating Reserve Status ............................................................................................................B-42
Stanford/Adeline Redevelopment Project Area ......................................................................................... B-43 Area Map .................................................................................................................................................. B-43 Funding Sources and Uses - FY 2009-11 ................................................................................................ B-44 Project Area Overview.............................................................................................................................. B-45 Operating Reserve Status ............................................................................................................B-46
Oak Center Redevelopment Project Area................................................................................................... B-47 Area Map .................................................................................................................................................. B-47 Funding Sources and Uses - FY 2009-11 ................................................................................................ B-48 Project Area Overview.............................................................................................................................. B-49 Operating Reserve Status ............................................................................................................B-50
Broadway/MacArthur/San Pablo Redevelopment Project Area ............................................................... B-51 Area Map .................................................................................................................................................. B-51 Funding Sources and Uses - FY 2009-11 ................................................................................................ B-52 Project Area Overview.............................................................................................................................. B-53 Operating Reserve Status ............................................................................................................B-54 Capital Project Descriptions ..................................................................................................................... B-55
Oakland Army Base Redevelopment Project Area.................................................................................... B-57 Area Map .................................................................................................................................................. B-57 Funding Sources and Uses - FY 2009-11 ................................................................................................ B-58 Project Area Overview.............................................................................................................................. B-59 Operating Reserve Status ............................................................................................................B-61
Central City East Redevelopment Project Area ......................................................................................... B-63 Area Map .................................................................................................................................................. B-63 Funding Sources and Uses - FY 2009-11 ................................................................................................ B-64 Project Area Overview.............................................................................................................................. B-65 Operating Reserve Status ............................................................................................................B-67 Capital Spending – Status of Funds......................................................................................................... B-68 Capital Project Descriptions ..................................................................................................................... B-69 Central District Capital Spending Plan ..................................................................................................... B-72
West Oakland Redevelopment Project Area .............................................................................................. B-73 Area Map .................................................................................................................................................. B-73 Funding Sources and Uses - FY 2009-11 ................................................................................................ B-74 Project Area Overview.............................................................................................................................. B-75 Operating Reserve Status ............................................................................................................B-77
ii

___________________________________________ TABLE OF CONTENTS
PROJECT SUMMARIES (continued) Oak Knoll Redevelopment Project Area ..................................................................................................... B-79
Area Map .................................................................................................................................................. B-79 Funding Sources and Uses - FY 2009-11 ................................................................................................ B-80 Project Area Overview.............................................................................................................................. B-81 Operating Reserve Status ............................................................................................................B-82
HOUSING PROGRAMS.......................................................................................................................C-1
Low-Moderate Income Housing................................................................................................................... C-1 Funding Sources and Uses...........................................................................................................C-1 Project Overview .........................................................................................................................C-2 List of Active Projects...................................................................................................................C-3
LEGISLATION......................................................................................................................................D-1 GLOSSARY..........................................................................................................................................E-1
iii

TABLE OF CONTENTS ________________________________________________
NOTES
iv

FINANCIAL SUMMARIES

______________________________________________ FINANCIAL SUMMARIES
FY 2007-08 FY 2008-09 FY 2009-10 FY 2010-11Actual Unaudited Adopted Adopted
Actual Budget BudgetFunding Sources by TypeGROSS Tax Increment $121,784,668 $131,537,727 $133,793,010 $138,004,310Less Set-Asides & Pass Throughs:
AB1290 Pass-Through [A] (22,308,599) (19,909,137) (22,427,090) (23,518,860) ERAF [B] - (5,944,960) (5,889,290)
NET Tax Increment 99,476,069 111,628,590 105,420,960 108,596,160
Capital Funds [C] 15,132,552 40,338,362 7,147,950 7,210,330 Interest & Rental Income 17,893,780 28,415,704 4,158,300 3,236,320 Sale of Land [D] - - - Loan Repayment from Low-Mod 350,000 350,000 350,000 350,000 Subtotal Revenue 132,852,401 180,732,656 117,077,210 119,392,810
Transfer from Fund Balance [E] 2,280,032 15,908,742 8,227,127
Total Revenue $135,132,433 $180,732,656 $132,985,952 $127,619,937
Funding Uses by TypePersonnel Services and Overhead 22,838,399 25,204,946 28,554,022 28,709,391 Programs, Projects, Operations & Maintenance 41,279,880 37,036,089 41,469,121 43,419,594 Capital Projects [F] 23,226,350 35,879,745 17,802,290 8,202,030 Tax Increment Debt [G] 37,803,755 48,631,849 36,854,720 38,962,830 Other Debt
City Center Garage West Debt 1,581,336 17,079,476 - - Acorn Plaza Shopping Center 161,748 161,748 161,750 161,750 Oak Center Repayment to the City 700,000 700,000 400,000 400,000 Subordinated Housing Bond Debt 7,527,522 7,512,083 7,506,110 7,501,420 West Oakland - Willow Park 13,443 13,443 13,450 13,450 Oakland Army Base - Subaru Lot - 775,619 - -
Subtotal Funding Uses 135,132,433 172,994,998 132,761,463 127,370,465
Contribution to/(from) Fund Balance [H] - 7,737,658 224,489 249,472
Total Expenditure/Appropriation $135,132,433 $180,732,656 $132,985,952 $127,619,937
[A]
[B]
[C]
[D][E]
[F][G]
[H]
Oakland Redevelopment AgencyFinancial Summary
For detail on transfers to fund balance by project area/program, see the Funding Uses by Project Area/Program tables on pages A-3, and A-5.
California law (AB-1290) requires that a specified portion of tax increment be returned to affected taxing entities. This requirement applies only to redevelopment project areas created or significantly amended after 1993.The Agency's FY 2009-11 Adopted Budget assumes Educational Revenue Augmentation Fund (ERAF) set-aside based on the contribution made by redevelopment agencies to the State in FY 2008-09. Should this get adopted in the State Budget, the remaining $2.6 million would be funded by reducing the voluntary 5 percent contribution to the Low and Moderate Income Housing Programs. Primarily includes 2009 and 2006 Tax Allocation bond proceeds in Central District, Central City East, Broadway/MacArthur/San Pablo and Coliseum project areas, which will finance capital projects in the next two fiscal years.
Includes projects presented in the FY 2009-11 Adopted Capital Improvement Program.Includes 1992 Central District Tax Allocation Bonds (TAB), 1998 Oakland Tribune Tower, 2003/2005/2006/2009 Central District TAB, 2006 Coliseum TAB, 2006 Central City East TAB and 2006 Broadway/MacArthur/San Pablo TAB.
For detail on the transfers from fund balance by project area, please see the Funding Sources by Project Area/Program tables on pages A-2, and A-4.
Due to current economic downturn no land sales are anticipated for FY 2009-11.
A - 1

FINANCIAL SUMMARIES ______________________________________________
TaxIncrement
[A]
Capital Funds
[B]
Transfers from Fund
Balance
Interfund Transfer + / -
[C]
Misc. Sources
[D] TotalProject Areas
Central District $32,811,740 $7,104,270 $4,127,625 $350,000 $305,510 $44,699,145Coliseum 15,146,270 43,680 4,900,626 - 559,200 20,649,776 Acorn 880,730 - - - 57,010 937,740 Stanford/Adeline 118,730 - - (26,642) 10,000 102,088 Oak Center - - 176,700 - 223,300 400,000 Broadway/MacArthur/ San Pablo
3,020,280 - - - 125,000 3,145,280
Oakland Army Base 3,178,480 - 4,723,852 - 2,293,000 10,195,332 Central City East 11,824,320 - 1,979,939 - 475,000 14,279,259 West Oakland 4,531,120 - - - 110,280 4,641,400 Oak Knoll 461,040 - - - - 461,040 Subtotal Project Areas
71,972,710 7,147,950 15,908,742 323,358 4,158,300 99,511,060
Programs20% Housing Set-Aside
26,758,600 - - (323,358) 350,000 26,785,242
5 % Voluntary Housing Set-Aside
6,689,650 - - - - 6,689,650
10% Voluntary School Set-Aside
- - - - - -
Subtotal Programs 33,448,250 - - (323,358) 350,000 33,474,892
Total Sources $105,420,960 $7,147,950 $15,908,742 $0 $4,508,300 $132,985,952
[A]
[B]
[C]
[D]
Funding Sources by Project Area/ProgramFiscal Year 2009-10
Includes miscellaneous interest, rental income, land sales and reprogrammed funds. Miscellaneous sources for the Oakland Army Base mostly includes lease income.
Net of AB-1290 Pass-Through (20%; applies to project areas created or amended after 1993 only), ERAF Set-Aside (excluding $2.6 million Low and Moderate Income portion from 5 percent Voluntary set-aside), Housing Set-Aside.Includes bond draw downs for the Central District, Broadway/MacArthur/San Pablo, Central City East project areas, and interest and rental revenue from Central District and Coliseum capital projects. Reflects a payment of $350,000 from Low-Moderate Income Housing to the Central District for the Henry J. Robinson Multi-Service Center; transfer of $26,642 from the Stanford/Adeline project area for development of affordable housing.
A - 2

______________________________________________ FINANCIAL SUMMARIES
Personnel Services &
Related Overhead
Projects, Programs,
Operations & Maintenance
Capital Transfer to Fund Balance
Tax Increment
Debt
Other Debt Total
Project AreasCentral District $7,673,285 $2,244,920 $11,120,650 $0 $23,660,290 $0 $44,699,145Coliseum 4,972,926 4,010,500 4,821,640 - 6,844,710 - 20,649,776Acorn 255,176 510,850 - 9,964 - 161,750 937,740Stanford/Adeline 27,628 120 - - 74,340 - 102,088Oak Center - - - - - 400,000 400,000Broadway/MacArthur/ San Pablo
1,119,987 820,890 - 51,593 1,152,810 - 3,145,280
Oakland Army Base 1,399,212 8,796,120 - - - - 10,195,332Central City East 4,048,269 3,248,420 1,860,000 - 5,122,570 - 14,279,259West Oakland 1,792,700 2,788,580 - 46,670 - 13,450 4,641,400Oak Knoll 344,068 710 - 116,262 - - 461,040
21,633,251 22,421,110 17,802,290 224,489 36,854,720 575,200 99,511,060
ProgramsLow and Moderate Income Housing 6,920,771 19,048,011 - - - 7,506,110 33,474,892School Set-Aside - - - - - - - Subtotal Programs 6,920,771 19,048,011 - - - 7,506,110 33,474,892
Total Uses $28,554,022 $41,469,121 $17,802,290 $224,489 $36,854,720 $8,081,310 $132,985,952
Fiscal Year 2009-10Funding Uses by Project Area/Program
Subtotal Project Areas
A - 3

FINANCIAL SUMMARIES ______________________________________________
TaxIncrement
[A]
CapitalFunds
[B]
Transfers from Fund
Balance
Interfund Transfer + / -
[C]
Misc. Sources
[D] TotalProject Areas
Central District $33,693,510 $7,210,330 $281,135 $350,000 $305,510 $41,840,485Coliseum 15,786,080 - 1,508,089 - 559,710 17,853,879 Acorn 910,000 - - - 57,010 967,010 Stanford/Adeline 120,890 - - (103,025) 10,000 27,865 Oak Center - - 400,000 - - 400,000 Broadway/MacArthur/ San Pablo
3,169,750 - - - 125,000 3,294,750
Oakland Army Base 3,249,770 - 5,939,198 - 1,575,800 10,764,768 Central City East 12,089,490 - 98,705 - 483,000 12,671,195 West Oakland 4,608,210 - - - 120,290 4,728,500 Oak Knoll [E] 467,380 - - - - 467,380
Subtotal Project Areas 74,095,080 7,210,330 8,227,127 246,975 3,236,320 93,015,832
Programs20% Housing Set-Aside
27,600,860 - - (246,975) 350,000 27,703,885
5 % Voluntary Housing Set-Aside
6,900,220 - - - - 6,900,220
10% Voluntary School Set-Aside
- - - - - -
Subtotal Programs 34,501,080 - - (246,975) 350,000 34,604,105
Total Sources $108,596,160 $7,210,330 $8,227,127 - $3,586,320 $127,619,937
[A]
[B]
[C]
[D]
Funding Sources by Project Area/ProgramFiscal Year 2010-11
Includes miscellaneous interest, rental income, land sales and reprogrammed funds. Miscellaneous sources for the Oakland Army Base mostly includes lease income.
Net of AB-1290 Pass-Through (20%; applies to project areas created or amended after 1993 only), ERAF Set-Aside (excluding $2.6 million Low and Moderate Income portion from 5 percent Voluntary set-aside), Housing Set-Aside.Includes bond draw downs for the Central District, Broadway/MacArthur/San Pablo, Central City East project areas, and interest and rental revenue from Central District and Coliseum capital projects. Reflects a payment of $350,000 from Low-Moderate Income Housing to the Central District for the Henry J. Robinson Multi-Service Center; transfer of $103,025 from the Stanford/Adeline project area for development of affordable housing.
A - 4

______________________________________________ FINANCIAL SUMMARIES
Personnel Services &
Related Overhead
Projects, Programs, Operations
& Maintenance
Capital Transfer to Fund Balance
Tax Increment
Debt
Other Debt Total
Project AreasCentral District $7,741,455 $2,250,190 $6,009,910 $0 $25,838,930 $0 $41,840,485Coliseum 4,935,309 3,879,720 2,192,120 - 6,846,730 - 17,853,879Acorn 257,001 535,680 - 12,579 - 161,750 967,010Stanford/Adeline 27,745 120 - - - - 27,865Oak Center - - - - - 400,000 400,000Broadway/MacArthur/ San Pablo
1,131,866 952,200 - 57,274 1,153,410 - 3,294,750
Oakland Army Base 1,413,128 9,351,640 - - - - 10,764,768Central City East 4,005,705 3,541,730 - - 5,123,760 - 12,671,195West Oakland 1,802,883 2,850,920 - 61,247 - 13,450 4,728,500Oak Knoll 348,298 710 - 118,372 - - 467,380
Subtotal Project Areas 21,663,390 23,362,910 8,202,030 249,472 38,962,830 575,200 93,015,832
ProgramsLow and Moderate Income Housing 7,046,001 20,056,684 - - - 7,501,420 34,604,105School Set-Aside - - - - - - - Subtotal Programs 7,046,001 20,056,684 0 0 0 7,501,420 34,604,105
Total Uses $28,709,391 $43,419,594 $8,202,030 $249,472 $38,962,830 $8,076,620 $127,619,937
Fiscal Year 2010-11Funding Uses by Project Area/Program
A - 5

FINANCIAL SUMMARIES ______________________________________________
Gross TaxIncrement
AB1290Set-Aside
ERAFSet-Aside
AnnualDebt Service
Mandatory20%
Voluntary5%
NetAvailable [A]
Central District $52,782,130 ($4,064,590) ($2,710,260) ($23,660,290) ($10,556,430) ($2,639,110) $9,151,450Coliseum 34,265,850 (9,302,030) (1,251,090) (6,844,710) (6,853,170) (1,713,290) $8,301,560Acorn 1,271,290 - (72,750) - (254,260) (63,550) $880,730Stanford/Adeline 171,370 - (9,800) (74,340) (34,270) (8,570) $44,390Oak Center - - - - - - $0Broadway/MacArthur/ 5,945,010 (1,189,000) (249,480) (1,152,810) (1,189,000) (297,250) $1,867,470 San PabloOakland Army Base 6,256,400 (1,251,280) (262,540) - (1,251,280) (312,820) $3,178,480Central City East 23,274,560 (4,654,910) (976,690) (5,122,570) (4,654,910) (1,163,730) $6,701,750West Oakland 8,918,900 (1,783,780) (374,270) - (1,783,780) (445,950) $4,531,120Oak Knoll 907,500 (181,500) (38,080) - (181,500) (45,380) $461,040
$133,793,010 ($22,427,090) ($5,944,960) ($36,854,720) ($26,758,600) ($6,689,650) $35,117,990
Low/Mod (from Voluntary 5%) (2,552,040)
Total ERAF $8,497,000
[A]
Low-Moderate Income
Net available tax increment represents revenue that is available for personnel services and operations and maintenance appropriations after all mandatory transfers, set-asides and debt payments have been covered.
Use of Tax Increment Revenue for Mandated Transfers,Set-Asides and Debt Payments By Project Area
Fiscal Year 2009-10
A - 6

______________________________________________ FINANCIAL SUMMARIES
Gross TaxIncrement
AB1290Set-Aside
ERAFSet-Aside
AnnualDebt Service
Mandatory 20%
Voluntary 5%
NetAvailable [A]
Central District $54,339,200 (4,376,010) (2,684,880) (25,838,930) (10,867,840) (2,716,960) $7,854,580Coliseum 35,876,350 (9,881,810) (1,239,370) (6,846,730) (7,175,270) (1,793,820) $8,939,350Acorn 1,309,430 - (72,070) - (261,890) (65,470) $910,000Stanford/Adeline 174,140 - (9,710) - (34,830) (8,710) $120,890Oak Center - - - - - - $0Broadway/MacArthur/ 6,212,540 (1,242,510) (247,140) (1,153,410) (1,242,510) (310,630) $2,016,340 San PabloOakland Army Base 6,381,520 (1,276,300) (260,080) - (1,276,290) (319,080) $3,249,770Central City East 23,740,050 (4,748,010) (967,540) (5,123,760) (4,748,010) (1,187,000) $6,965,730West Oakland 9,052,690 (1,810,540) (370,770) - (1,810,540) (452,630) $4,608,210Oak Knoll 918,390 (183,680) (37,730) - (183,680) (45,920) $467,380
$138,004,310 ($23,518,860) ($5,889,290) ($38,962,830) ($27,600,860) ($6,900,220) $35,132,250
Low/Mod (from additional 5%) ($2,607,710)
Total ERAF $8,497,000
[A] Net available tax increment represents revenue that is available for personnel services and operations and maintenance appropriations after all mandatory transfers, set-asides and debt payments have been covered.
Low-Moderate Income
Use of Tax Increment Revenue for Mandated Transfers,Set-Asides and Debt Payments By Project Area
Fiscal Year 2010-11
A - 7
FINANCIAL SUMMARIES ______________________________________________
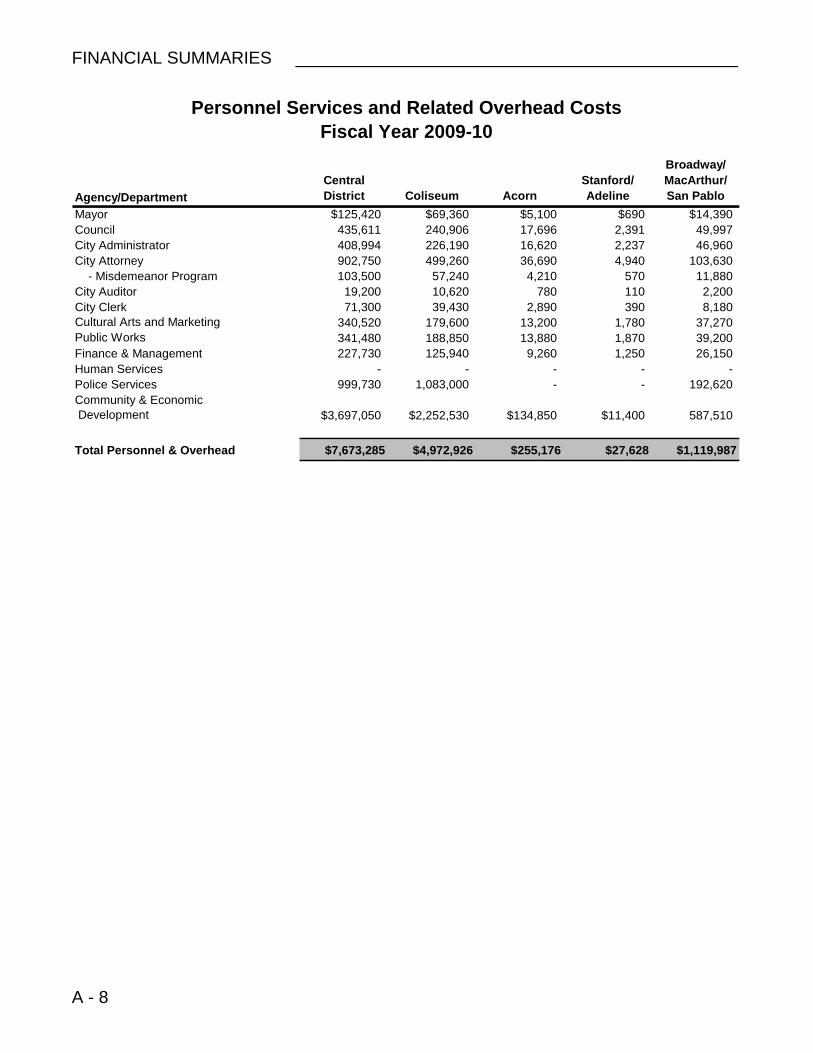
Personnel Services and Related Overhead CostsFiscal Year 2009-10
Agency/DepartmentCentralDistrict Coliseum Acorn
Stanford/Adeline
Broadway/MacArthur/San Pablo
Mayor $125,420 $69,360 $5,100 $690 $14,390Council 435,611 240,906 17,696 2,391 49,997 City Administrator 408,994 226,190 16,620 2,237 46,960 City Attorney 902,750 499,260 36,690 4,940 103,630 - Misdemeanor Program 103,500 57,240 4,210 570 11,880 City Auditor 19,200 10,620 780 110 2,200 City Clerk 71,300 39,430 2,890 390 8,180 Cultural Arts and Marketing 340,520 179,600 13,200 1,780 37,270 Public Works 341,480 188,850 13,880 1,870 39,200 Finance & Management 227,730 125,940 9,260 1,250 26,150 Human Services - - - - - Police Services 999,730 1,083,000 - - 192,620 Community & Economic Development $3,697,050 $2,252,530 $134,850 $11,400 587,510
Total Personnel & Overhead $7,673,285 $4,972,926 $255,176 $27,628 $1,119,987
A - 8

______________________________________________ FINANCIAL SUMMARIES
Personnel Services and Related Overhead CostsFiscal Year 2009-10
Agency/Department
OaklandArmyBase
CentralCityEast
WestOakland Oak Knoll
Low-ModerateIncome Housing Total
Mayor $18,400 $54,740 $26,220 $2,660 $158,730 $475,710Council 63,902 190,119 91,080 9,278 551,351 1,652,331 City Administrator 60,000 178,500 85,530 8,700 517,660 1,551,391 City Attorney 132,400 394,000 188,740 19,200 1,142,600 3,424,210 - Misdemeanor Program 15,180 45,160 21,640 2,200 - 261,580 City Auditor 2,820 8,380 4,010 410 24,300 72,830 City Clerk 10,450 31,120 14,910 1,520 90,240 270,430 Cultural Arts and Marketing 47,630 141,750 67,900 6,910 - 836,560 Public Works 50,080 149,040 71,400 7,260 - 863,060 Finance & Management 33,400 99,390 47,610 4,850 288,240 863,820 Human Services - - - - 544,410 544,410 Police Services - 997,600 373,210 - - 3,646,160 Community & Economic Development $964,950 $1,758,470 800,450 281,080 3,603,240 14,091,530
Total Personnel & Overhead $1,399,212 $4,048,269 $1,792,700 $344,068 $6,920,771 $28,554,022
A - 9

FINANCIAL SUMMARIES ______________________________________________
Personnel Services and Related Overhead CostsFiscal Year 2010-11
Agency/DepartmentCentralDistrict Coliseum Acorn
Stanford/Adeline
Broadway/MacArthur/San Pablo
Mayor $125,650 $69,490 $5,110 $690 $14,430Council 430,541 238,100 17,500 2,360 49,430 City Administrator 410,910 227,260 16,700 2,240 47,170 City Attorney 906,400 501,260 36,840 4,970 104,050 - Misdemeanor Program 105,590 58,400 4,290 580 12,120 City Auditor - - - - - City Clerk 71,512 39,551 2,901 390 8,211 Cultural Arts and Marketing 348,540 183,620 13,500 1,820 38,120 Public Works 346,990 191,900 14,100 1,900 39,830 Finance & Management 229,390 126,860 9,320 1,260 26,330 Human Services - - - - - Police Services 1,019,730 1,016,250 - - 196,130 Community & Economic Development 3,746,202 2,282,618 136,740 11,535 596,045
Total Personnel & Overhead $7,741,455 $4,935,309 $257,001 $27,745 $1,131,866
A - 10

______________________________________________ FINANCIAL SUMMARIES
Personnel Services and Related Overhead Costs
Fiscal Year 2010-11
Agency/Department
OaklandArmyBase
CentralCityEast
WestOakland Oak Knoll
Low-ModerateIncome Housing Total
Mayor $18,430 $54,840 $26,270 $2,670 $164,700 $482,280Council 63,140 187,910 90,020 9,170 564,300 1,652,471 City Administrator 60,260 179,340 85,920 8,740 538,570 1,577,110 City Attorney 132,940 395,600 189,510 19,290 1,187,980 3,478,840 - Misdemeanor Program 15,490 46,090 22,080 2,240 - 266,880 City Auditor - - - - - - City Clerk 10,481 31,211 14,951 1,520 93,721 274,449 Cultural Arts and Marketing 48,690 144,920 69,420 7,060 - 855,690 Public Works 50,890 151,440 72,550 7,380 - 876,980 Finance & Management 33,640 100,120 47,970 4,880 300,660 880,430 Human Services - - - - 548,290 548,290 Police Services - 930,650 372,310 - - 3,535,070 Community & Economic Development 979,167 1,783,584 811,882 285,348 3,647,780 14,280,902
Total Personnel & Overhead $1,413,128 $4,005,705 $1,802,883 $348,298 $7,046,001 $28,709,391
A - 11

FINANCIAL SUMMARIES ______________________________________________
FY 2007-08 FY 2008-09 FY 2009-10 FY 2010-11 Adopted Adopted Adopted Adopted
Position by Classification FTE FTE FTE FT
MayorMa
E
yor 0.50 0.50 0.50 0.50 Mayor's Public Service Employee 14 0.50 0.50 - - Mayor's Public Service Employee 51 0.50 0.50 - - Deputy Director, Prg Planning & Dev 0.15 0.15 Project Manager III 0.50 0.50 0.50 0.50 City Administrator Analyst - - 0.50 0.50 Subtotal 2.00 2.00 1.65 1.65
City CouncilCouncil Member 4.00 4.00 4.00 4.00 Administrative Assistant ICity Council Administrative Assistant 1.36 1.36 1.36 1.36 City Councilmember's Assistant 2.40 2.40 2.40 2.40 Office Assistant IOffice Assistant II - - - - Receptionist To City Council - - - - Senior Council Policy Analyst 0.95 0.95 1.95 1.95 Subtotal 8.71 8.71 9.71 9.71
City AdministratorAccountant II - - 0.30 0.30 Administrative Analyst II 0.50 0.50 - - Administrative Assistant II - - 0.50 0.50 Administrative Services Manager II 1.00 1.00 - - Assistant to the City Administrator 0.90 0.90 1.25 1.25 Assistant City Administrator - - 0.40 0.40 Budget & Grants Administrator 0.25 0.25 - - Budget and Operations Analyst 0.50 0.50 - - Budget Director 0.20 0.20 0.20 0.20 Cable Operations Technician - - 1.00 1.00 Cable TV Production Assistant - - 1.00 1.00 Cable TV Production Assistant, PPT - - 2.85 2.85 Cable TV Station Manager - - 0.11 0.11 City Administrator 0.50 0.50 0.50 0.50 City Administrator Analyst - - 0.50 0.50 Deputy Director, Prg Planning & Dev - - 0.50 0.50 Executive Assistant to Asst City Administrator
0.50 0.50 - -
Executive Assistant to the City Administrator 0.50 0.50 0.50 0.50 Financial Analyst - - 0.50 0.50 Financial Analyst, Principal 0.50 0.50 0.50 0.50 Graphic Design Specialist 1.00 1.00 - -
Summary of Full-Time Equivalents (FTEs)FY 2007-09 to FY 2009-11
A - 12

______________________________________________ FINANCIAL SUMMARIES
FY 2007-08 FY 2008-09 FY 2009-10 FY 2010-11 Adopted Adopted Adopted Adopted
Position by Classification FTE FTE FTE FT
City Administrator (continued)Mayor's PSE 0.50 0.50 Mayor's PSE 14, PT - - 0.50 0.50 Program Analyst II, PPT 0.50 0.50 - - Program Analyst III - - - - Public Information Officer II 1.00 1.00 - - Special Events Coordinator 2.00 2.00 - - Subtotal 9.35 9.35 11.61 11.61
City AttorneyCity Attorney 0.30 0.30 0.30 0.30 Deputy City Attorney II 0.70 0.70 2.20 2.20 Deputy City Attorney III 2.13 2.13 2.13 2.13 Deputy City Attorney IV 2.41 2.41 2.47 2.47 Deputy City Attorney V 2.15 2.15 2.15 2.15 Legal Administrative Assistant 1.60 1.60 1.60 1.60 Paralegal 1.00 1.00 1.00 1.00 Special Counsel 1.00 1.00 1.00 1.00 Subtotal 11.29 11.29 12.85 12.85
City ClerkAdministrative Analyst I - - 0.33 0.33 City Clerk 0.30 0.30 0.33 0.33 City Clerk, Assistant - - 0.33 0.33 Citywide Records Manage
E
r - - 0.33 0.33 Legislative Recorder 0.30 0.30 0.66 0.66 Office Assistant II - - 0.33 0.33 Subtotal 0.30 0.30 2.31 2.31
City AuditorDeputy Auditor I 0.13 0.13 - - Performance Auditor - - 0.15 - Performance Auditor, Sr - - 0.07 - Permformance Audit Manager - - 0.35 - Deputy Auditor III 0.25 0.25 - - Subtotal 0.38 0.38 0.57 -
Finance and ManagementAccountant II 2.00 2.00 1.00 1.00 Accountant III 3.00 3.00 2.00 2.00 Accounting Supervisor - - 1.00 1.00 Agency Director 0.30 0.30 0.30 0.30 Assistant Controller 0.39 0.39 0.40 0.40
Summary of Full-Time Equivalents (FTEs)FY 2007-09 to FY 2009-11 (continued)
A - 13

FINANCIAL SUMMARIES ______________________________________________
FY 2007-08 FY 2008-09 FY 2009-10 FY 2010-11 Adopted Adopted Adopted Adopted
Position by Classification FTE FTE FTE FT
Finance and Management (continued)Controller - - 0.40 0.40 Financial Analyst 1.00 1.00 1.00 1.00 Subtotal 6.69 6.69 6.10 6.10
Human Services Accountant II 0.43 0.43 0.39 0.39 Administrative Assistant II 0.10 0.10 0.15 0.15 Community Housing Service Manage
E
r 0.72 0.72 0.85 0.85 Housing Development Coordinator III 1.32 1.32 1.47 1.47 Program Analyst I 0.43 0.43 0.23 0.23 Program Analyst II 0.93 0.93 1.06 1.06 Subtotal 3.93 3.93 4.15 4.15
Police ServicesSergeant of Police - - 1.00 1.00 Police Officer 3.18 3.18 16.18 16.18 Subtotal 3.18 3.18 17.18 17.18
Public WorksPubilc Works Maintenance Worker - 3.00 3.00 3.00 Street Maintenance Leader - 3.00 3.00 3.00 Traffic Painter - 2.00 2.00 2.00 Subtotal - 8.00 8.00 8.00
Community and Economic DevelopmentAccount Clerk I - - 1.00 1.00 Administrative Analyst I 0.90 0.90 0.72 0.72 Administrative Analyst II 0.20 0.20 2.10 2.10 Administrative Assistant I 2.50 2.50 2.50 2.50 Administrative Assistant II 1.85 1.85 1.85 1.85 Administrative Services Manager I 1.00 1.00 - - Administrative Services Manager II 2.00 2.00 City Council PSE14, PPT 0.50 0.50 - - Community Development Program Coordinator
1.00 1.00 1.00 1.00
Depupty Director, Comm Econ Dev - - 1.40 1.40 Deputy Director, Housing 0.75 0.75 0.75 0.75 Deputy Director, Program Planning & Development
1.00 1.00 - -
Development/Redevelopment Program Mgr 4.53 4.53 6.33 6.33 Drafting Technician 0.50 0.50 - - Executive Assistant to Agency Director 1.50 1.50 1.00 1.00 Graphic Design Specialist 1.00 1.00
Summary of Full-Time Equivalents (FTEs)FY 2007-09 to FY 2009-11 (continued)
A - 14

______________________________________________ FINANCIAL SUMMARIES
FY 2007-08 FY 2008-09 FY 2009-10 FY 2010-11 Adopted Adopted Adopted Adopted
Position by Classification FTE FTE FTE FT
Community and Economic Development (continued)Home Management Counselor III 1.00 1.00 1.00 1.00 Housing Development Coordinator III 5.00 5.00 5.00 5.00 Housing Development Coordinator IV 2.65 2.65 2.65 2.65 Loan Servicing Administrato
E
r 0.80 0.80 0.80 0.80 Loan Servicing Specialist 0.30 0.30 0.30 0.30 Management Assistant 1.10 1.10 1.30 1.30 Manager, Real Estate Services 1.00 1.00 1.00 1.00 Monitoring and Evaluation Supervisor 1.00 1.00 1.00 1.00 Mortgage Loan Supervisor 0.20 0.20 - - Office Assistant II 3.55 3.55 3.55 3.55 Planner III 2.00 2.00 1.00 1.00 Planner III, Hist. Preservation 0.25 0.25 0.25 0.25 Planner IV 1.20 1.20 1.20 1.20 Planning Intern, PT 0.80 0.80 0.80 0.80 Program Analyst I 0.28 0.28 0.28 0.28 Program Analyst I, PPT 0.40 0.40 Program Analyst II 2.00 2.00 1.00 1.00 Program Analyst II, PPT 0.50 0.50 Program Analyst III 2.00 2.00 2.25 2.25 Project Manager 0.50 0.50 1.00 1.00 Project Manager II - - 1.00 1.00 Public Information Officer II 1.00 1.00 Public Service Rep, PPT - - 0.50 0.50 Real Estate Agent 2.60 3.29 4.25 4.25 Real Estate Agent, Supervisor 0.50 0.50 0.50 0.50 Rehabilitation Advisor III 1.25 1.25 1.25 1.25 Special Events Coordinator 2.00 2.00 Student Trainee, PT 4.50 4.50 4.50 4.50 Urban Economic Analyst I 2.00 2.00 4.00 4.00 Urban Economic Analyst II 4.00 4.00 5.00 5.00 Urban Economic Analyst II, PPT 0.80 0.80 - - Urban Economic Analyst III 7.50 7.50 10.65 10.65 Urban Economic Analyst III, PPT 1.00 1.00 0.50 0.50 Urban Economic Analyst IV 7.90 7.90 9.00 9.00 Urban Economic Coordinator 5.60 5.60 6.60 6.60 Subtotal 79.51 80.20 97.68 97.68
Total Authorized Personnel 125.34 134.03 171.81 171.24
Summary of Full-Time Equivalents (FTEs)FY 2007-09 to FY 2009-11 (continued)
A - 15

FINANCIAL SUMMARIES ______________________________________________
Principal Outstanding
7/1/2009 Principal Interest Total
Tax Increment DebtCentral District Debt1992 Central District Senior Tax Allocation Bonds $29,720,000 $5,255,000 $1,634,600 $6,889,6001998 Oakland Tribune Tower 170,000 55,000 9,590 64,5902003 Central District Subordinated Tax Allocation Bonds 100,835,000 3,305,000 5,398,450 8,703,450
[A] 2005 Central District Subordinated Tax Allocation Bond 44,360,000 - 1,598,500 1,598,5002006-T Central District Subordinated Tax Allocation Bond 27,975,000 2,590,000 1,418,210 4,008,210
[B] 2009-T Central District Subordinated Tax Allocation Bond 47,810,000 - 2,395,940 2,395,940
Subtotal Central District Debt 250,870,000 11,205,000 12,455,290 23,660,290
Coliseum Debt2006B-TE Coliseum Tax Allocation Bond 27,765,000 470,000 1,316,730 1,786,7302006B-T Coliseum Tax Allocation Bond 71,160,000 1,180,000 3,877,980 5,057,980Subtotal Coliseum Debt 98,925,000 1,650,000 5,194,710 6,844,710Other Project Areas' DebtStanford Adeline Repayment to the City 106,989 66,160 8,180 74,3402006A-TE Central City East Tax Allocation Bond 13,780,000 - 689,000 689,0002006A-T Central City East Tax Allocation Bond 59,885,000 1,180,000 3,253,570 4,433,5702006C-TE Broadway/MacArthur/SP Tax Allocation Bond 4,945,000 - 247,250 247,2502006C-T Broadway/MacArthur/SP Tax Allocation Bond 11,730,000 265,000 640,560 905,560
Subtotal Tax Increment Debt 440,241,989 14,366,160 22,488,560 36,854,720Other Debt
[C] Acorn Plaza Shopping Center (aka Jack London Gateway Shopping Center)
888,197 64,160 97,590 161,750
Willow Park 149,707 8,380 5,070 13,450Oak Center Repayment to the City 3,452,582 - 400,000 400,000
Subtotal Other Debt 4,490,486 72,540 502,660 575,200
Housing Debt2000 Subordinated Housing Set-Aside Revenue Bond 4,290,000 2,065,000 254,740 2,319,7402006 Subordinated Housing Set-Aside Refunding Revenue Bond - Tax Exempt
2,195,000 - 109,750 109,750
2006 Subordinated Housing Set-Aside Refunding Revenue Bond - Taxable
80,590,000 500,000 4,576,620 5,076,620
Subtotal Housing Debt 87,075,000 2,565,000 4,941,110 7,506,110
Total Debt $531,807,475 $17,003,700 $27,932,330 $44,936,030
Debt Service SummaryFiscal Year 2009-10
FY 2009-10 Payment
A - 16

______________________________________________ FINANCIAL SUMMARIES
Principal Interest Total Principal
Outstanding 7/1/2011
Tax Increment DebtCentral District Debt1992 Central District Senior Tax Allocation Bonds 5,565,000$ 1,345,580$ 6,910,580$ 18,900,000$ 1998 Oakland Tribune Tower 55,000 6,490 61,490 60,000 2003 Central District Subordinated Tax Allocation Bonds 4,720,000 5,197,830 9,917,830 92,810,000
[A] 2005 Central District Subordinated Tax Allocation Bond - 1,598,500 1,598,500 44,360,0002006-T Central District Subordinated Tax Allocation Bond 2,325,000 1,289,150 3,614,150 23,060,000 2009-T Central District Subordinated Tax Allocation Bond 685,000 3,051,380 3,736,380 47,125,000 Subtotal Central District Debt 13,350,000 12,488,930 25,838,930 226,315,000
Coliseum Debt2006B-TE Coliseum Tax Allocation Bond 495,000 1,297,430 1,792,430 26,800,000 2006B-T Coliseum Tax Allocation Bond 1,240,000 3,814,300 5,054,300 68,740,000 Subtotal Coliseum Debt 1,735,000 5,111,730 6,846,730 95,540,000 Other Project Areas' DebtStanford Adeline Repayment to the City - 40,829 2006A-TE Central City East Tax Allocation Bond - 689,000 689,000 12,600,000 2006A-T Central City East Tax Allocation Bond 1,245,000 3,189,760 4,434,760 58,640,000 2006C-TE Broadway/MacArthur/SP Tax Allocation Bond - 247,250 247,250 4,945,000 2006C-T Broadway/MacArthur/SP Tax Allocation Bond 280,000 626,160 906,160 11,185,000
Subtotal Tax Increment Debt 16,610,000 22,352,830 38,962,830 409,265,829 Other Debt
[B] Acorn Plaza Shopping Center (aka Jack London Gateway Shopping Center)
69,180 92,570 161,750 754,857
Willow Park 8,630 4,820 13,450 132,697 Oak Center Repayment to the City - 400,000 400,000 3,452,582
Subtotal Other Debt 77,810 497,390 575,200 4,340,136
Housing Debt2000 Subordinated Housing Set-Aside Revenue Bond 2,225,000 87,000 2,312,000 - 2006 Subordinated Housing Set-Aside Refunding Revenue Bond - Tax Exempt
- 109,750 109,750 2,195,000
2006 Subordinated Housing Set-Aside Refunding Revenue Bond
530,000 4,549,670 5,079,670 79,560,000
Subtotal Housing Bond 2,755,000 4,746,420 7,501,420 81,755,000
Total Debt 19,442,810$ 27,596,640$ 47,039,450$ 495,360,965$
[A] No principal payment is due on the 2005 Central District Subordinated Tax Allocation Bonds until 2020.[B] The Acorn Project Area assumed an Enhanced Enterprise Community (EEC) HUD-108 / Economic Development Inititative (EDI)
Debt Service SummaryFiscal Year 2010-11
FY 2010-11 Payment
A - 17

FINANCIAL SUMMARIES ______________________________________________
NOTES
A - 18

PROJECT SUMMARIES

CENTRAL DISTRICT REDEVELOPMENT PROJECT AREA
__________________________________________ PROJECT SUMMARIES
B - 1

Operating Capital Operating CapitalSOURCESTax Increment 32,811,740 - 33,693,510 - Capital Funds - 7,104,270 - 7,210,330 Interfund Transfer [A] 350,000 - 350,000 - Bond Proceeds - - - - Misc. Sources [B] 305,510 - 305,510 -
Subtotal Sources 33,467,250 7,104,270 34,349,020 7,210,330
USESPersonnel Services & Overhead 7,673,285 - 7,741,455 - Operations & Maintenance 2,244,920 - 2,250,190 - Capital Projects - 11,120,650 6,009,910 Tax Increment Debt 23,660,290 - 25,838,930 - Other Debt - - - -
Subtotal Uses 33,578,495 11,120,650 35,830,575 6,009,910
Transfer to/(from) Fund Balance (111,245) (4,016,380) (1,481,555) 1,200,420 Estimated Beginning Fund Balance 18,352,320 5,539,200 18,241,075 1,522,820 Estimated Year-End Fund Balance 18,241,075 1,522,820 16,759,520 2,723,240
[B] Miscellaneous Sources include interest and rental income.
[A] Includes a transfer of $350,000 in each fiscal year from Low Moderate Income Housing Fund for acquisition of the Henry J. Robinson Multi-Service Center.
FY 2009-10Adopted Budget
FY 2010-11 Adopted Budget
Central District Project AreaFunding Sources and Uses
Fiscal Year 2009-11
PROJECT SUMMARIES __________________________________________
B - 2

Background The Central District Project Area covers approximately 250 city blocks (828 acres) in an area generally bounded by I-980, Lake Merritt, 27th Street and the Embarcadero. Within the Project Area, there are four major redevelopment activity areas: City Center, Chinatown, Old Oakland and the Uptown area. The Project Area is a major economic and transportation hub in the San Francisco-Oakland Metropolitan Area. There are nearly 30 office buildings with approximately 9.5 million total square feet of office space located in the Central District. The Project Area is also at the heart of the Bay Area Rapid Transit (BART) system, with three stations located within its boundaries. More than 40 AC Transit bus lines connect the Central District Project Area with other parts of Oakland and nearby communities. Over the last 10 years, there has been a residential building boom in the Central District, largely attributable to former Mayor Jerry Brown’s and the City Council’s 10K Initiative, an effort to attract 10,000 new residents to downtown Oakland, which led to streamlined development and permitting processes, identification of key opportunity sites and creation of incentives on a case-by-case basis, when necessary. Highlights Several major projects were completed in FY 2009-11. These projects added housing, retail and a new entertainment venue to the Project Area as summarized below:
• Completion of the second phase of Market Square II (formerly Housewives Market), in December of 2007
• Completion of construction on Forest City Residential Development West’s 665-unit Uptown in December of 2008
• Completion of Fox Courts, an 80-unit affordable housing development, behind the Fox Theater, in May
2009
• Completion of the Fox Theater, which includes the renovation and adaptive reuse of a major historic landmark in downtown Oakland into a performing arts center and educational facility for the Oakland School for the Arts, in February of 2009
The 10K Downtown Housing Initiative In general, the 10K Initiative significantly contributed to positioning the Central District as a desirable area for the development of rental and owner-occupied housing. As of July 2009, a total of 4,250 housing units were completed, 310 units are in construction, 2,149 units have planning approvals and 1,829 units are in planning. As a result of the changing housing market environment, the Agency has moved away from implementation of the 10k housing units strategy, and is shifting its redevelopment efforts to other projects aimed at infrastructure improvements, upgrading building facades and attracting retail to the Project Area. Plans for FY 2009 -11 include dealing with the two Agency-sponsored housing projects, City Walk and Forest City’s Parcel 4, that have either stopped construction or have not yet started and need schedule modifications. Downtown Façade Improvement ProgramThe Downtown Façade Improvement Program, which includes the Downtown Historic Façade Improvement Program, provides matching grants and design assistance to existing businesses for the purposes of making storefront and façade improvements. During FY 2007-09, a total of 58 façade projects were completed, and 18 are under construction. The goal for FY 2009-11 is to start and/or complete 55 projects. Façade Program staff will continue to identify new candidates for the program and work closely with property owners to implement the program.
__________________________________________ PROJECT SUMMARIES
B - 3

Downtown Tenant Improvement Program The Downtown Tenant Improvement Program offers up to $90,000 for business owners to remodel and occupy storefronts vacant for more than 6 months. The program also offers free but limited design services. During FY 2007-09, there were 49 tenant improvement projects completed and 15 projects are under construction. The goal for FY 2009-011 is to start and/or complete 35 tenant improvement projects. Plans for FY 2009-11 Adopted FY 2009-11 Capital funding for the Central District is $17.1 million (two-year total). The Agency’s efforts in the Central District Project Area will largely focus on the completion and/or the modification of business terms for existing projects (City Walk and Forest City, City Center and Key), providing additional public parking and continuing to improve building façades and infrastructure. In addition, the Agency is participating in an interdepartmental effort to create a specific plan for the Broadway Retail Corridor that provides for an urban mixed use, mixed-income development with major retail and high density housing development and the appropriate accompanying environmental assessment document. Goals for FY 2009-11 include completion of the Broadway Retail Corridor specific plan and the appropriate environmental assessment document; identification of opportunity sites necessary for the implementation of the plan; identification of opportunity sites necessary for the construction of the public parking; identification of appropriate funding sources for implementation of the strategy; evaluation of blight in the Broadway Retail Corridor for inclusion of the area in an amendment to the Redevelopment Plan for the Central District to extend the time limits relating to the Plan’s effectiveness. The Agency also refinanced $16.0 million of the 2005 Tax Exempt Bonds requiring the Agency to delete $10.0 million in projects, with the remainder coming from carryforward; this will allow the Agency to issue $33.5 million in taxable bonds in order to: 1) payoff the loan from the City for City Center West Garage ($16.0 million), 2) purchase the Telegraph Plaza Garage from the City ($7.0 million), 3) fund site acquisition for the Broadway Retail Strategy ($7.5 million), and fund improvements for the Scotlan Convention Center ($3.0 million).
PROJECT SUMMARIES __________________________________________
B - 4

Anticipated Balance, June 30, 2009 18,352,320$
Projected Sources - FY 2009-10
Tax Increment 32,811,740 Interest on Reserve 93,510 Loan Repayment 350,000 Other Income 212,000 Total 2009-10 Sources 33,467,250
Total Anticipated Available Balance 51,819,570
Projected Uses - FY 2009-10
Debt Service 23,660,290Personnel Services and Related Overhead Costs 7,673,285Projects, Programs and Operations & Maintenance 2,244,920Total 2009-10 Uses 33,578,495
Anticipated Balance, June 30, 2010 18,241,075
Projected Sources - FY 2010-11
Tax Increment $33,693,510Interest on Reserve 93,510 Loan Repayment 350,000 Other Income 212,000 Total 2010-11 Sources 34,349,020
Total Anticipated Available Balance 52,590,095
Projected Uses - FY 2010-11
Debt Service 25,838,930Personnel Services and Related Overhead Costs 7,741,455Projects, Programs and Operations & Maintenance 2,250,190Total 2010-11 Uses 35,830,575
Anticipated Balance, June 30, 2011 16,759,520$
CENTRAL DISTRICTOperating Reserve Status
__________________________________________ PROJECT SUMMARIES
B - 5

Central District Downtown Walking Patrol and Police Services Program
Background The Walking Patrol Program and Police Services Program was established to enhance safety and security above standard police patrol levels in order to facilitate the leasing or sale of office space in the Central District redevelopment areas. Highlights Major accomplishments during FY 2007-09 included providing highly visible walking and mounted patrol services throughout the redevelopment areas. The service rendered an improved perception of security programs by business owners, customers, and workers in the area, and decreased crime rates. Plans for FY 2009-11 Adopted funding for FY 2009-11 is approximately $1 million for each year. These funds cover 5.18 police officers staffing the Walking Patrol Program and 2.0 FTE police officers staffing the Police Services Program. Plans for FY 2009-11 include continuing walking and bicycle patrol activities.
PROJECT SUMMARIES __________________________________________
B - 6

Central District Economic Development Program
Background The mission of the Economic Development Division is to increase investment in Oakland in a way that contributes to the prosperity of businesses and provides sustainable job opportunities for Oakland residents. Oakland’s economic development efforts provide essential support and resources for all businesses, from start-ups to large corporations, through ongoing creation, attraction, expansion and retention services to maintain and expand a robust and diverse economy in Oakland. Efforts are focused in five primary sectors: retail, office, industrial, sustainable and international trade business opportunities. The program serves not only the Central District Redevelopment Area and I-880 corridor, but also other commercial areas and business districts of the City. A primary focus of the program is to assist in the retention and expansion of existing businesses. Business Retention and Expansion services will be a key activity for the Economic Development Division in the next two years. Attraction efforts focus on the creation of new jobs, ranging from entry level to skilled technical and professional positions across all sectors of the local economy. Of priority are industries and jobs that are sustainable over the long-term and add to the overall quality of life for all Oakland residents. Business Services are focused on facilitating investments and developing services to create a business-friendly environment by improving the conditions that make Oakland an attractive place to do business. Services include technical and financial assistance, connecting businesses with the myriad non-City human, technical and financial resources needed to purchase and lease space across all sectors; navigating City permitting requirements; obtaining workforce and equipment tax credits; accessing other City resources including grants and commercial loans; and creating programs, including incentive programs, that facilitate the ease of doing business in Oakland. These activities are designed to retain and strengthen existing businesses through citywide business development strategies including the Retail Enhancement Strategy, the Industrial Business District Strategy, Vacant Downtown Office Space Strategy, International Trade Initiatives, Green Industry Attraction Strategy, and the City’s Business Access Center. Plans for FY 2009-2011 For FY 2009-11, the Economic Development Program will focus on the following major initiatives:
• Implementation of the Citywide Retail Enhancement Strategy. The overall goal of the Oakland Retail Enhancement Strategy is to: increase quality of life by increasing resident access to goods and services; increase sales tax revenue to provide City services and amenities; and increase number of potential jobs and entrepreneurial opportunities. The components of the Strategy are to: Improve the City’s retail tenant mix; develop a major comparison goods retail center in the Upper Broadway Area; attract five grocery stores to underserved neighborhoods in Oakland; and designate sufficient sites for large format comparison goods stores. Other key implementation activities are to encourage sustainable development of locally owned stores; support and strengthen existing retail; develop strong neighborhoods where retail can thrive. Overall, the Strategy has identified 53 retail nodes throughout the City that require retail development support. The City Council and Redevelopment Agency have adopted a strategy to guide transitioning land use in the Upper Broadway Area to create large scale, mixed use development, with an emphasis on major comparison goods retail. This strategy includes the preparation of a Specific Plan to guide land use decisions, urban design standards to ensure that the retail component is consistent with City goals for the area, environmental review, and a parking access/financing plan. Key activities for FY 2009-11 are the completion and adoption of the Upper Broadway Retail Specific Plan and continued marketing and coordination with property owners, major retailers and developers.
__________________________________________ PROJECT SUMMARIES
B - 7

• The Downtown Office Strategy is focused on the attraction of new, financially secure and experienced
business investment into Oakland’s downtown office market by assisting in efforts to create an attractive place for more national and international investment and business location. Upcoming activities include support of the Downtown Oakland and Lake Merritt/Uptown Community Benefit Districts, particularly in the implementation of enhanced security and maintenance programs; continued development of the Business Incentives Program and the Commercial Property Owners Tool Kit, marketing and outreach coordination with various partners such as, the Oakland Chamber of Commerce and the Oakland business community at large. Economic Development staff will also focus on supporting the tenant recruitment efforts for upcoming and recently constructed office developments; modernization and marketing of the Scotlan Convention Center and Henry J. Kaiser Center and the attraction of retail and restaurant amenities to support Oakland’s downtown. A related activity is the creation of the Oakland Business Assistance Center. The proposed Oakland Business Assistance Center (“BAC”) will be a visible, easily accessible, single location for Oakland businesses to obtain support and information on how to operate, grow and sustain their businesses in Oakland. Additionally, the BAC will be a clearinghouse for information on City and other services, including Oakland’s local Business Service Organizations.
• The Sustainable Strategy will provide increasing opportunities for Oakland businesses to develop
sustainable business practices that promote healthy businesses as well as a healthy environment, such as recycling; support for recycling businesses; promotion of green businesses; and developing strategies and resources to attract them to Oakland; and improving business access to effective web marketing resources. Efforts will focus on the creation of a cohesive city attraction & recruitment strategy to retain and grow existing green businesses. Activities will include the coordination of land use planning, transportation infrastructure, business attraction policy, and incentives/tax credits to encourage green building and green tech industry growth.
• Implementation of the Oakland Industrial Development Strategy will focus on retention of existing
Oakland manufacturing businesses that maximize value to Oakland in terms of quality jobs and low-impact on the environment; identify opportunity sites that could attract manufacturing businesses that reflect the transition of U.S. and regional manufacturing to technology and biotechnology production; and identify and secure the business resources, including the creation of incentives, that are needed to attract these value-added companies to Oakland. Efforts will include involvement in the Oakland Estuary Specific Plan Project, continued recruitment and support of specialty food processing companies, development of four (4) industrial business districts, and identification of funds to implement the Industrial Business District Infrastructure Analysis project. The Economic Development Division will also work with the Redevelopment and Strategic Planning Divisions to fully develop marketing and redevelopment profiles for several key opportunity sites that can support major development and job creation.
PROJECT SUMMARIES __________________________________________
B - 8

Central District Marketing and Special Events Program
Background As Oakland moves forward into its 40th year of redevelopment efforts in the Central District amidst an economic crisis, a coordinated economic development marketing program is more essential than ever to communicate the City’s many assets and advantages as a location for business, development and investment. The Marketing & Special Events Program positions Oakland as a center for business in the Bay Area through a comprehensive marketing strategy in the areas of overall image enhancement; business attraction marketing; city promotion; visitor marketing (through the Oakland Convention & Visitors Bureau contract); and film, special events and cultural arts to enhance vitality and fuel continued revitalization. Major functions include creating and implementing marketing campaigns; production of marketing collateral, high-profile special events and business support activities; promoting Oakland at key trade shows and conventions; generating positive publicity, including business-related media coverage; providing marketing technical assistance for small businesses and key cultural attractions; and promoting Oakland as a prime destination for shopping, dining, arts and entertainment. Highlights Shop Oakland The purpose of the annual Shop Oakland campaign is to drive consumers to stores and businesses in Oakland; encourage Oakland residents to buy locally in an effort to capture their dollars and increase sales tax; and promote Oakland as a regional shopping destination in an effort to attract shoppers throughout the Bay Area. In collaboration with the Oakland Merchants Leadership Forum, Marketing & Special Events grew Shop Oakland from a modest holiday promotional effort into a full-scale, year-round marketing campaign. Through the program, Marketing & Special Events also provides marketing grants, street banner design/production and technical assistance to several shopping districts citywide. Oakland’s first-ever citywide shopping guide was published in fall 2007 and in 2008, a new theme “Support Oakland Grown,” was promoted to encourage consumers to purchase goods and services from local businesses and artists. Target Area Marketing Collateral The Marketing & Special Events Program creates strategies to support business businesses and redevelopment efforts in established target areas – retail, technology, food production, biotech, health and life sciences, transportation and logistics, green businesses and creative arts. During FY 2007-08, 30 marketing tools for various project areas were produced that included marketing pieces for Downtown, West Oakland and Coliseum; an Oakland business resource guide; fact sheets on downtown lease and sale properties; homebuyers’ assistance materials; and a green business resource guide for consumers. In 2008, Redeveloping Oakland, a quarterly newsletter chronicling redevelopment activities throughout the City, began production in both print and online formats.
__________________________________________ PROJECT SUMMARIES
B - 9

Major 2007-08 Accomplishments: The 8th Annual Art & Soul Festival has helped fuel downtown revitalization, provided cultural enrichment and showcased Oakland to more than 60,000 attendees from all over the city, Northern California and the Central Valley. The festival covered 88% of its costs by generating $1.0 million in corporate and media sponsors, $800,000 in free positive publicity for Oakland in addition to revenue from admissions, concessions and booth fees. Marketing efforts enriched public spaces, showcased local artists, and improved communities through completion of key public art installations at 66th Avenue Gateway, a new destination park on the Oakland Estuary; Children’s Fairyland by Lake Merritt; and Mandela Gateway Housing in West Oakland. Continued supporting revitalization in the re-emerging Uptown area by partnering with local developers to present The Great Wall of Oakland, a monthly screening of contemporary media works in an outdoor setting in conjunction with the popular First Fridays “Art Murmur” gallery openings. Major FY 2009-11 Goals Through the Oakland Partnership, Cultural Arts & Marketing is leading efforts for the spring 2009 launch of a comprehensive business attraction marketing campaign promoting Oakland as a regional center for business and the arts. The campaign will be implemented through a series of public-private partnerships aimed at improving the City’s image, engaging local residents as ambassadors, showcasing Oakland’s dynamic arts scene and fueling the Mayor’s goal of generating 10,000 new jobs in five years. Complete public art installations in conjunction with capital improvement projects in underserved communities throughout Oakland, including Raimondi Sports Park in West Oakland, 81st Avenue Branch Library and Fremont Pool in East Oakland, and the Rockridge-Temescal Greenbelt project in North Oakland. Through grant funds, add a minimum of one new public art project in each redevelopment district, commissioned through local artists and community organizations. FY 2009-11 Plans/Deliverables: Implement Comprehensive New Marketing Plan As Oakland moves forward to implement a comprehensive economic development strategy through the newly-established Oakland Partnership, a coordinated marketing program will be essential to communicating the City’s many assets and advantages as a location for business, development and investment. Working with the Oakland Metropolitan Chamber of Commerce, the City’s Marketing Division is primed to parlay its successful four-year economic development marketing campaign to support the goals and objectives set forth in the Oakland Partnership. The primary focus of the Oakland marketing campaign would be to position Oakland as a desirable center for business, development and investment regionally, nationally and internationally. The campaign would highlight the City’s many assets including strategic location, global access/connectivity, lower cost of doing business (relative), quality of life, cultural and ethnic diversity, dynamic arts & culture scene, etc. The campaign would also have a local pride component designed to boost morale and civic engagement among Oakland residents. The campaign would feature the Mayor, industry leaders and other influential figures promoting Oakland – through testimonials – as a prime location for business.
PROJECT SUMMARIES __________________________________________
B - 10

Marketing tools to include:
• Produce a business series on KTOP to stream live on various key websites and/or links to live stream from various key websites (City of Oakland/Mayor/Chamber/ Oakland Partnership participating organizations). Excerpts from a DVD presentation placed on key external websites, e.g., My Space, You Tube, etc.
• Create/maintain a business/Oakland Partnership blog; host podcasts on key topics, create Power Point
presentation for use by key officials, staff when pitching new business for Oakland
• Develop schedule of key trade shows and business networking events at which Oakland would be showcased (e.g. Urban Land Institute, International Council of Shopping Centers, etc.)
• Place advertisements in key business, trade, consumer publications
• Develop/implement comprehensive communications/publicity plan to expand editorial coverage on
Oakland in key business, trade, consumer publications and electronic media Small Business Support
• Host marketing workshops for Oakland businesses
• Promote business2oakland.com website (Task Force recommendation)
• Promote a single telephone number for business support: 1-877-2Oakland (Task Force Recommendation)
• Continue Shop Oakland, MeetDowntownOak.com campaigns
__________________________________________ PROJECT SUMMARIES
B - 11

Anticipated Balance, June 30, 2009 5,539,200
Projected Sources - FY 2009-10Interest on Investments 512,457 Loan Repayment 679,700 Miscellaneous Rentals:
City Center Garage West 2,472,000 Multi-Service Center 98,113 Oakland Ice Center 2,205,000 University of California Office of the President Garage 315,000 Telegraph Parking Plaza 616,000 Chinatown Parking Garage 206,000
Total 2009-10 Sources 7,104,270
Total Anticipated Available Balance 12,643,470
Projected Uses - FY 2009-10Projects, Programs and Operations & Maintenance
Central Business District-wide Projects 8,569,087 Uptown Projects 3,073,890 Downtown Projects (522,327)
Total 2009-10 Uses 11,120,650
Anticipated Balance, June 30, 2010 1,522,820
Projected Sources - FY 2010-11Interest on Investments 504,050 Loan Repayment 580,677 Miscellaneous Rentals:
City Center Garage West 2,546,000 Multi-Service Center 98,103 Oakland Ice Center 2,315,000 University of California Office of the President Garage 320,000 Telegraph Parking Plaza 634,500 Chinatown Parking Garage 212,000
Total 2010-11 Sources 7,210,330
Total Anticipated Available Balance 8,733,150
Projected Uses - FY 2010-11Projects, Programs and Operations & Maintenance
Central Business District-wide Projects 836,800 Uptown Projects 2,618,110 Downtown Projects 2,555,000
Total 2010-11 Uses 6,009,910
Anticipated Balance, June 30, 2011 2,723,240$
CENTRAL DISTRICT CAPITAL SPENDING PLANStatus of Funds
PROJECT SUMMARIES __________________________________________
B - 12

Central District Project Area Capital Project and Program Descriptions
The descriptions below are for the capital projects and programs within the Central District, which are summarized at the end of this section.
CENTRAL DISTRICT – DISTRICT-WIDE 1.5 Percent Public Art Program and I-880 Broadway Underpass The Agency’s Public Art Program authorizes the allocation of 1.5 percent of Agency capital construction project funding for the commissioning of public artwork. Agency funds will be used for artwork that is part of the Agency’s Streetscape Improvement projects and for public art installations that will be part of future Agency-assisted development projects. 10K Downtown Housing Initiative In 1999, then Mayor Jerry Brown and the City Council launched the 10K Downtown Housing Initiative. This major downtown redevelopment effort aimed at attracting 10,000 new residents to the Central District by marketing the area, identifying opportunity sites and working with private developers to build housing for these new urban dwellers. In FY 2007-09, major accomplishments for Agency-sponsored projects included:
• Completed the second phase of the 86-unit Market Square II (formerly Housewives Market), in December of 2007.
• Completed construction on Forest City Residential Development West’s 665-unit Uptown in December of
2008
• Completed (May 2009) Fox Courts, an 80-unit affordable housing development, behind the Fox Theater The 10K initiative significantly contributed to positioning the Central District as a desirable area for the development of rental and owner-occupied housing. As of July 2008, a total of 2,802 housing units had been completed, 1,789 units are in construction, 2,246 units have planning approvals and 3,928 units are in planning. Although these 10,765 units exceed the goal of the 10K initiative, the recent severe downturn in the local housing market and the national credit crisis cast doubt on the prospect of starting those residential projects that are not yet under construction. As a result of these changing conditions in the housing markets, the Agency has moved away from implementation of the strategy and is shifting its redevelopment efforts to other projects aimed at infrastructure improvements, upgrading building interiors facades and attracting retail to the Project Area. Plans for FY 2009-11 include amending contracts for the following two Agency-sponsored 10K housing projects that have either stopped construction or have not yet started:
Citywalk (252 residential units and 3,000 square feet of retail)This project stopped construction. The Agency is working with the developer to amend the existing Disposition and Development Agreement (DDA) and is seeking a qualified entity to complete the project.
Uptown Parcel 4 In 2006, the Agency entered into a DDA with Forest City to develop a mid-rise residential project with 175 – 200 units, and 20,000 square feet of retail. The developer was scheduled to start construction in October of 2008, but did not proceed because of the deteriorating conditions in the local housing market. Plans for FY 2009-11 include renegotiating the schedule of performance for the Project and working with Forest City on temporary site improvements.
__________________________________________ PROJECT SUMMARIES
B - 13

Broadway Corridor Small Business Retail Loan Program The Small Business Retail Loan Program provides a revolving loan fund that is made available to small retail and commercial business and property owners along the Broadway corridor. The loan fund is intended to provide capital for physical improvements, including those related to life safety and façade enhancement. Oakland Business Development Corporation (OBDC) has been hired by the City of Oakland Community and Economic Development Agency’s Commercial Lending division to assist small businesses and property owners in the Broadway Corridor Target Area, and provide hands-on business assistance throughout the application process. During FY 2007-09, OBDC made two loans to qualifying businesses. In FY 2009-11 OBDC will continue to provide direct loan packaging and underwriting of these loan program funds. OBDC aims to package and fund at least four new loans to small businesses in the Broadway Corridor in the next two years. Business Improvement District/Community Benefit District The purpose of a Business Improvement District (BID), also know as a Community Benefit District (CBD), is to generate revenues from special assessments that are used to improve the public perception of Oakland’s commercial and mixed-use neighborhoods, including the Central Business District, as a place to work, shop, live and conduct business. BIDs provide enhanced services beyond the baseline services already provided by the City. BID activities include, but are not limited tom private security and ambassador services, enhanced landscaping, sidewalk cleaning, special events, district branding and other marketing activities to support the economic vitality of the district. Within the Central District, major accomplishments include the formation of the Koreatown/Northgate Community Benefit District in July 2007, as well as formation of the Downtown Oakland and Lake Merritt/Uptown Community Benefit Districts in July 2008. Collectively, these three districts generate approximately $2.2 million per year. Plans for FY 2009-11 include working with community representatives interested in exploring the possible formation of a BID within the Old Oakland neighborhood and facilitating the development of policies and procedures which support an effective coordination of efforts between various City divisions (e.g., Public Works, Environmental Services, Oakland Police) and three existing downtown CBD management corporations. Downtown Capital Project Support This program provides equipment, promotional materials and professional services in support of redevelopment activities throughout the Project Area during the next budget cycle. During FY 2007-09, funding from Downtown Capital Support is being used to (1) purchase new computer work stations, (2) provide training for downtown staff, (3) pay for the Public Works Agency’s project management support on the Agency’s Streetscape Improvement District projects, (4) provide funding for consultant contracts related to an amendment to the Redevelopment Plan for the Central District to extend the time limits relating to the Plan’s effectiveness, (5) pay for certain street improvements in the Uptown Area and (6) provide capital support for Agency-owned facilities, (7) litigation support, and (8) funding for the Lake Merritt Specific Plan.
PROJECT SUMMARIES __________________________________________
B - 14

Downtown Façade Improvement Program The Downtown Façade Improvement Program (FIP) was created in 1999 and includes Uptown, Old Oakland/Chinatown and the Lower Broadway area. The program also includes the Downtown Historic Façade Improvement Program. The Downtown FIP provides matching grants and design assistance to existing businesses for the purpose of making storefront and façade improvements. The FIP is intended to restore the exterior of historic buildings, update and modernize the exterior of older buildings for reoccupation, promote retail activity, improve the pedestrian experience and help support other redevelopment projects by enhancing the general appearance of surrounding properties. Eligible work includes the following:
• Painting/wall repair/cleaning • New awnings/canopies • Renovation or repair of windows • Landscaping and exterior lighting • Rehabilitation of historic facades • Doors and storefront systems • Improvement & removal of safety grilles • Removal & replacement of signage
During FY 2007-09, grantees completed 58 façade projects, and 18 are under construction. The goal for FY 2009-11 is to start and/or complete 55 projects. FIP staff will continue to identify new eligible applicants and work closely with property owners during the implementation of each Façade project during implementation of the program. Downtown Tenant Improvement Program (Retail Entertainment Catalyst Project) The Downtown Tenant Improvement Program (TIP) provides incentives to attract businesses to targeted locations in the downtown area. While the market for retail in Downtown has improved over the last few years, in many cases the spaces within buildings that are available require substantial tenant improvements to meet the needs of retailers and restaurant operators. Some property owners are unable to improve their properties in order to attract higher premium-rent tenants, as well as higher end sales customers. The TIP is part of the City’s business CARES strategy (creation, attraction, retention and expansion.) The program offers property and business owners matching grants on a dollar for dollar basis up to $99,000 of Redevelopment Agency assistance for tenant improvements to the interior of retail spaces. Under the TIP incentives can be provided to fund eligible expenses such as:
• Hazardous materials abatement i.e., removal of asbestos • Compliance with the Americans with Disability Act (ADA) • Demolition and shell reconstruction • Plumbing, mechanical, electrical and HVAC • Interior décor and historic restoration of interior materials • The primary focus of the TIP is to help design the interior of vacant retail spaces
During FY 2007-09, a total of 49 tenant improvement projects were completed, and 15 projects are in construction. The goal for FY 2009-11 is to start and/or complete 35 tenant improvement projects.
__________________________________________ PROJECT SUMMARIES
B - 15

Downtown Streetscape Master Plan The Streetscape Master Plan calls for the construction of various public improvements to complement existing and future redevelopment projects, and to attract new public and private investment into the Central District Project Area. The recommendations of the Streetscape Master Plan were guided by the objective of improving the appearance of selected sub-areas of the Project Area. The planned improvements will achieve this goal by creating a definite sense of place, clear gateways, emphatic focal points and an attractive physical design. The improvements consist of repair and/or restoration of existing pavement, widening existing sidewalks, constructing pedestrian bulb-outs, introducing new landscaping such as street trees, improving signage and striping, installing new lighting, modifying existing traffic lane patterns, and creating bicycle lanes. Budgeted Agency funds for the implementation of the Streetscape Master Plan are complemented with local Alameda County Transportation Improvement Authority Measure B grant funding, local Alameda County Congestion Management Agency grant funding, and state grant funding via a voter-approved Proposition 1C bond measure. Ongoing projects include: Telegraph Ave. (16th Street to Thomas L. Berkley Way); the redesign of Latham Square, and Old Oakland (Washington Street, from 7th to 9th Streets). During FY 2007-09, the west side of Telegraph Avenue (from 18th Street to Thomas L. Berkley Way) was completed. Plans for FY 2009-11 include starting construction of the Old Oakland Streetscape Improvement Project, additional work on the Telegraph Avenue Streetscape Improvements, including the 17th Street BART entrance, and Latham Square. Basement Backfill and Repair Program The Central District Basement Backfill and Repair Program (BBRP) is a new program, developed by the Agency, to assist private property owners in the repair of deteriorated sub-sidewalk basement spaces in specific areas in downtown Oakland. The overall purpose of this program is to correct the problems associated with these deteriorated basements – such as leaking, rusted elevator access doors, deteriorated structural elements, rusted rebar, and leaking skylights and sidewalk grilles – so that the City can proceed with construction of several streetscape projects included in the Downtown Streetscape Master Plan. Plans for FY 2009-11 include launching this program in specific areas of Downtown Oakland, and working with those property owners as are interested in pursuing repair of their basements. Citywide Technology Capital Improvement Projects The Citywide Technology Capital Improvement Project allocation covers costs for the Agency's share of the Oracle System and the Sun Server. This technology supports redevelopment activities. The costs are shared among the following redevelopment project areas: Central District, Coliseum, Broadway/MacArthur/San Pablo, Central City East and Oakland Army Base. The total Agency contribution is $900,000 per year for fiscal years 2009-10 and 2010-11. The Central District Capital fund will provide $200,000 annually for technology capital improvements. Redevelopment Merchant Promotions The Redevelopment Merchant Promotions program will enable each Agency Board member to fund discretionary commercial development projects within their districts, and citywide for the At-Large office. Each Board member’s office will receive $5,000 annually for FY 2009-011 from various ORA project area funds. Central District capital will provide $5,000 each for the At-Large and District 2 offices.
PROJECT SUMMARIES __________________________________________
B - 16

UPTOWN RETAIL AND REHABILITATION AREA Fox Theater Master Plan, Renovation and Maintenance The Fox Theater was vacant for many years and represented a blighting influence on the surrounding area. The Fox Theater Master Plan included the renovation and adaptive reuse of this major historic landmark in downtown Oakland into a performing arts center and educational facility for the Oakland School for the Arts. The area surrounding the Fox Theater is being rapidly redeveloped and the Fox Theater Master Plan complemented and enhanced these efforts. The Agency has leveraged significant public and private funding with its capital contribution to the Fox Theater Master Plan. Project construction commenced in September of 2006 and was completed in February of 2009. The Agency has established a non-profit public benefit corporation, Fox Oakland Theater (FOT), to oversee the rehabilitation, lease-up and management of the theater. FOT has executed leases with Another Planet Entertainment and the Oakland School for the Arts. This project will stimulate private investment in surrounding structures, increase property values and property taxes, increase sales taxes, and create new jobs during construction and operation of these new businesses. Touraine Hotel/Henry J. Robinson Multi-Service Center The Henry J. Robinson Multi-Service Center (HRMSC) provides economic benefits to disadvantaged persons living within or near the Project Area by operating major supportive housing services to eliminate homelessness for struggling families through the provision of a two-year transitional housing program, an emergency shelter and drop-in services for the homeless population in Oakland. The HRMSC provides transitional housing for up to 54 families, and gives homeless individuals the opportunity to stabilize their lives while completing, through case management, the work needed to become productive citizens. The Center also provides 8 emergency housing units, a drop-in center, and an award-winning program for children. The programs at the HRMSC are funded by grants, with the Department of Housing and Urban Development (HUD) funding the Supportive Housing Program at the Center. The Redevelopment Agency receives income from leasing the Center, and the funds are utilized for capital improvements and maintenance repairs at the facility. The housing and services provided at the HRMSC feed into the City of Oakland’s Permanent Access to Housing (PATH) Strategy to end homelessness in Oakland. Major accomplishments at the HRMSC during the 2008 year included the provision of transitional housing and other supportive housing services for 390 families with 643 children, emergency housing for 89 families for 1,994 bed nights, 53 families exiting the facility and moving into permanent housing and 11 families moving into other transitional housing programs. In FY 2007-08, major accomplishments included the provision of transitional housing for 74 families with 150 children, emergency housing for 50 families with 86 children, and 69 families exiting the facility and moving into permanent housing. Other clients receiving services, but not housing, totaled 284 families. For FY 2009-11, based on past performance, it is anticipated that 75% of all program participants who come in from the streets or from shelters will move into transitional housing and improve their residential stability 100% of program participants will take part in skill development programs (vocational training, educational enrollment, life skills and money management), and 75 percent of all participants will increase their personal skills in the areas of budget management, decision-making and problem solving. Uptown Project (Phases 1 and 2) In October of 2005, the Agency entered into a Lease Disposition and Development Agreement (LDDA) with Forest City, Inc. and its affiliates to redevelop two underutilized “super blocks” located in the Uptown Area. The Uptown (Phase 1) includes a transit-oriented development consisting of 665 rental apartments, of which 20 percent (133 units) are affordable to households earning 50 percent or less of the area’s median income (AMI) for a period of 55 years. In addition, five percent (33 units) of the 665 units are affordable to households earning incomes not exceeding 120 percent of AMI for a period of 55 years. There are also 9,000 square feet of
__________________________________________ PROJECT SUMMARIES
B - 17

neighborhood-serving retail and a 25,000 square-foot public park. Major accomplishments in 2007-09 included: Completion of 665 units and related improvements and completion of Fox Square, a new park serving the area. In 2006, the Agency entered into a DDA with Forest City, Inc. to develop a mid-rise residential project, the Uptown (Phase 2) with 175 – 200 units, and 20,000 square feet of retail. The developer was scheduled to start construction in October of 2008, but did not proceed because of the deteriorating conditions in the local housing market and the national financial crisis. Plans for FY 2009-11 include renegotiating the schedule of performance for the Project, and entering into a 3-year lease to reconstruct and operate an interim surface parking lot on the site that will serve the Fox Theater and other businesses in the area.
Lastly, the Agency selected Resources for Community Development to develop an 80-unit affordable rental housing project behind the Fox Theater in the Uptown area. This project was completed in April of 2009. Broadway Corridor Retail Project In December 2007, the Oakland City Council reviewed recommendations from the Upper Broadway Strategy – A Component of the Oakland Retail Enhancement Strategy. The report identifies the Broadway Retail Corridor (BRC), which is partially located in the Project Area, as a key area in Oakland for comparison/life-style retail, office and housing mixed use development. The Agency is participating in an interdepartmental effort to create a specific plan for the BRC that provides for an urban mixed-use, mixed-income development with major retail and high density housing components and the appropriate accompanying environmental impact report (EIR). Goals for FY 2009-11 include completion of the specific plan and the EIR, identification of opportunity sites necessary for the implementation of the plan, including identification of sites to provide a new parking garage in the area; identification of appropriate funding sources for implementation of the strategy, and evaluation of blight in the BCR for inclusion of the affected parcels in an amendment to the Redevelopment Plan for the Central District to extend the time limits relative to the Plan’s effectiveness.
PROJECT SUMMARIES __________________________________________
B - 18

DOWNTOWN Public Facilities The Agency manages 4 public garages and the Oakland Ice Center. These public parking facilities include the Franklin 88, UC Office of President, Telegraph Parking Plaza and City Center Garage West. Franklin 88 This 135-space garage serves Chinatown and was completed in October of 2004. The garage also provides overflow parking for the adjacent Courtyard by Marriott Hotel per a parking license agreement with the Agency. The revenues of the garage have recently declined. Staff, in cooperation with the Home Owners Association at Franklin 88, issued a Request for Proposals to parking companies to find a new operator that will pay the Agency a minimum monthly payment, plus a percentage of gross revenues, as opposed to the fee-for service arrangement that is in place with the current operator. Staff hopes that this will improve the performance of the garage and eliminate the need for Agency subsidies. Nevertheless, staff is including financial assistance for the facility in the event that the Agency is unable to enter into a “minimum payment” contract with a parking operator. City Center Garage West This garage continues to provide parking for offices and commercial tenants and workers in the City Center area, including workers in the Federal Building, the State Building, the City Administration Complex, Preservation Park and many other buildings near City Center. The garage is projected to generate annual gross revenues of approximately $2.47 million during FY 2009-10, and $2.55 million during FY 20010-11. Project funding will cover operating costs for the garage. UC Office of President Parking Operations The Agency owns and operates public parking in the UCOP Building at 11th, 12th and Franklin Streets. It is anticipated that this public parking garage will generate approximately $281,000 in net income during FY 2009-11. The Agency is under contract with SKS Broadway LLC to sell the garage once SKS has commenced construction of the Key System project. Telegraph Parking Plaza The Agency acquired Telegraph Parking Plaza from the City during FY 2008-09. There is a need for additional public parking facilities in the Uptown project area since over 1,200 spaces were eliminated in the area as a result of Forest City’s Uptown project. Staff has identified Telegraph Plaza Garage, which is in proximity to the Paramount Theater and the Fox Theater, as a candidate for parking capacity expansion. During FY 2008-09, Agency staff entered into an Exclusive Negotiating Agreement (ENA) with a developer for a mixed-use project, including housing and retail, on the site. However, the current downturn of the regional housing market and the national credit crisis made new private development at the site unlikely in the near term. During FY 2009-11, the Agency will analyze the construction and financial feasibility of significantly upgrading or replacing the garage, and, if deemed feasible, proceed to enlist a developer/contractor to implement this project.
__________________________________________ PROJECT SUMMARIES
B - 19

Oakland Ice Center The Oakland Ice Center (OIC) supports the Agency’s redevelopment efforts in the Uptown Area by providing a recreational ice skating facility that attracts people to this part of downtown Oakland, especially on evenings and weekends. The OIC contributes to the establishment of the Uptown Area as a cultural and entertainment center. In July of 2007, the Agency hired San Jose Arena Management to maintain and operate the facility. The Agency completed major capital improvements at the facility in August of 2007. During FY 2008-09, the OIC generated positive cash flow for the Agency. The Agency is also completing the installation of a new entrance on the 17th Street side of the facility. City Center Site Preparation Originally, this project included four large properties located in the City Center area of downtown. In the past, the Agency transferred the property located at 555 12th Street to the Shorenstein Company for the development of an office tower, and it sold the property known as T-10, located at 14th and Jefferson Street, to the Olson Company for the development of “City Walk”, a for-sale residential project. Olson broke ground for the City Walk project in March of 2005, but the project halted construction in July of 2007. The Agency is working with the Olson Company to amend the existing Disposition and Development Agreement (DDA) and find a qualified entity to complete the project, which has been repositioned as a rental housing development. After completion of 555 12th Street, Shorenstein had options to purchase the sites known as T-5/6, located at 12th Street and Clay Street, and T-12, located at 12th Street and Jefferson Street. Shorenstein acquired T-12 from the Agency in December of 2007, and started construction of the office building in November of 2008. Since then, Shorenstein has removed all hazardous soils from the property, which was overseen and paid for by the Agency. In January of 2009, Shorenstein halted project construction and requested an extension of the completion date by 36 months. Shorenstein cited the national recession and rising vacancies in the Bay Area office market as primary reasons for their action. Plans for FY 2009-11 include negotiation and preparation of the legal documents required for the extension. Key System Building – 12th & Broadway This project includes renovation of the historic Key System building and its integration into a new mixed-use office and retail tower to be developed on an adjacent vacant site. Key accomplishments for FY 2007-09 include obtaining Council authorization to transfer an expanded Owner Participation Agreement (OPA) and a Purchase and Sales Agreement for the UCOP garage to SKS Broadway LLC, and obtaining Council authorization to sell the adjacent 145-space UCOP garage at its fair market value to the developer in order to facilitate the financial feasibility of the project and to maximize the amount of retail space in the new building. The current OPA requires construction of a new office building to start in October of 2009. However, in light of prevailing market conditions, the developer may exercise an option to extend this deadline. Goals for FY 2009-11 include commencement of construction for the project. Central District – Site Acquisition The Agency is considering making purchase offers on various opportunity parcels in the Central District for redevelopment purposes. Opportunity sites include a large Caltrans-owned parcel and two properties in the Central District Project Area. If the Agency is successful in acquiring any of these properties, it will issue Requests for Proposals during FY 2009-11.
PROJECT SUMMARIES __________________________________________
B - 20

Public Parks and Facilities As the population in the Central District grows and public use of parks and facilities increases, there is a need to address deferred maintenance issues at certain public parks and facilities within the Project Area. As a result, the Agency provides capital improvement grants for certain public parks and facilities in the Central District Redevelopment Project Area. In FY 2007-09 the Agency made available up to $2 million in grants to improve the following parks and public facilities:
• Lincoln Square Park (261-11th Street). The Lincoln Square Park project will provide a new synthetic turf field connecting the park to the adjacent Lincoln Elementary School. The school, as well as four day-care centers and two Head Start Programs use Lincoln Square Park as additional play area. Completion date is September 2010.
• Madison Square Park (810 Jackson Street). The existing facilities at Madison Square Park were enhanced to provide a gathering space for community groups who have been using the nearby BART plaza site for various activities. The total project cost was $285,000 and was completed in February 2008.
• Malonga Casquelourd Center for the Arts (1428 Alice Street). The Malonga facility requires major renovation of its building systems and common areas. Rehabilitation began in 2008 and will be completed in 2009.
• Jefferson Square Park (618 Jefferson Street). Jefferson Park will undergo a major renovation to upgrade its tot lot, add a new dog park with separate areas for small and large dogs, relocate an existing full-sized basketball court, and complete general landscaping improvements. Community meetings and completion of the design took place in 2008. Upgrades will begin in 2009.
• Chinese Garden Park (7th and Harrison Streets). Proposed improvements to the Chinese Garden Park include repairs to pathways, a concrete pad at the pavilion, re-soding of the lawn, tree planting and irrigation systems. Design is underway and bids will be accepted in March 2009. Construction is estimated to begin in mid-2009.
• Fox Square. The Agency, with financial assistance for the City, worked with Forest City to create Fox Square, a new 25,000 square-foot public park in the Uptown area. The park was completed in October of 2008. The Agency negotiated with Forest City to provide all maintenance services at this new park at their expense.
Plans for FY 2009-11 include making new funding available for these public facilities in an effort to complete unfunded components of the park’s capital improvement needs. Oakland Convention Center In June of 2007, the CIM Group Oakland acquired Oakland Marriott City Center and the Courtyard Oakland Downtown. The Oakland Marriott City Center is contiguous with the Oakland Convention Center, which CIM manages on behalf of its owner, the City of Oakland. CIM has approached the Agency to provide capital improvement funding to renovate various components of the aging Convention Center. Plans for FY 2009-11 include reaching agreement with CIM over the terms and conditions of such funding and implementation of the work. Developer Funding Assistance The severe downturn in the local housing market and the national financial crisis presented many housing developers with projects in construction a rapidly changing market environment that has forced some of them to convert for-sale to rental housing projects and others into foreclosure. The Agency has received requests for funding assistance from developers to assist them in addressing these problematic circumstances. The Agency has allocated funding for this purpose and will consider requests from developers on a case-by-case basis.
__________________________________________ PROJECT SUMMARIES
B - 21

AreaFY 2008-09 Estimated
Carryforward
ReprogramFY 2008-09
Carryforward
FY 2009-10 Adopted
Allocation
FY 2010-11 Adopted
Allocation
Adopted TotalFY 2009-11Allocation
Central Business District Wide1-1/2% Public Art $1,924,967 $0 $0 $0 $1,924,96710K Housing 187,040 (187,040) (187,040) - - 14th & Broadway Transit Center 318,390 - - - 318,390Small Business Retail (Broadway) Loan 110,843 - 387,630 126,800 625,273Central District Public Facilities - - 5,000,000 - 5,000,000 Lincoln Rec Center Pub Facility 491,809 - - - 491,809 Malonga Public Facility 524,695 - - - 524,695 Jefferson Sq. Public Facility 536,972 - - - 536,972 Chinese Garden Public Facility 210,675 - - - 210,675Downtown Capital Project Support 1,743,673 - 1,000,000 500,000 3,243,673Downtown Façade Improvement Program 372,617 - 1,658,500 - 2,031,117Merchan Promo District 2 & 9 30,000 - 10,000 10,000 50,000Oracle Corp Software License 67,104 - 200,000 200,000 467,104Retail/Entertainment Catalyst Project 1,018,511 - 500,000 - 1,518,511Downtown Streetscape Master Plan 3,053,003 - - - 3,053,003
Subtotal $10,590,299 ($187,040) $8,569,090 $836,800 $19,996,189UptownRoyal Hotel $300,000 ($300,000) ($300,000) $0 $0Fox Theater Master Plan & Dev. 2,700,000 - - - 2,700,000 Fox Theater Master Plan, Maint., Retail/Office
17,463 - - - 17,463
Fox - GASS Grant 892,241 - - - 892,241 Oakland Ice Center - - 2,205,000 2,315,000 4,520,000 Oakland Ice Center 165,855 - - - 165,855 Touraine Hotel/HRMSC 90 - 98,110 98,110 196,310 Telegraph Phase I ORA 1,703,248 - - - 1,703,248 Telegraph Plaza Garage Operations - - 196,000 205,000 401,000 Broadway - West Grand - ORA 400,780 - - - 400,780 Uptown Retail Entertainment Catalyst 374,266 (158,500) (158,500) - 215,766 Uptown Forest City Residential 643,493 (338,490) (338,490) - 305,003 Uptown Retail Entertainment 703,240 (703,240) (703,240) - - Uptown - Forest City DDA 770,994 (600,990) (600,990) - 170,004 Fox Courts DDA - - 170,000 - 170,000 Uptown- Forest City Residential 1,160,000 (494,000) (494,000) - 666,000 Central District Parking Garage Dev. 31,735,000 (8,900,000) (8,900,000) - 22,835,000 Uptown Garage (21st and Telegraph) - - 2,900,000 - 2,900,000 Central District Site Acquisition - - 7,500,000 - 7,500,000 Development Assistance Program - - 1,500,000 - 1,500,000
Subtotal $41,566,670 ($11,495,220) $3,073,890 $2,618,110 $47,258,670DowntownFranklin 88 Garage Operations $1,246,984 ($969,780) ($749,780) $230,000 $727,204City Center Garage West 98,267 (98,270) (98,270) - (3) City Center West Garage Operations 730,488 (730,490) 1,332,010 2,151,000 4,213,498 City Center West Garage Debt 1,033,930 (1,033,930) (1,033,930) - - Rotunda Renovation Project 146,360 (146,360) (146,360) - - UCOP Garage Operations - - 174,000 174,000 348,000
Subtotal $3,256,029 ($2,832,470) ($522,330) $2,555,000 $5,288,699 GRAND TOTAL $55,412,998 ($14,514,730) $11,120,650 $6,009,910 $17,130,560
Central District Project AreaCapital Spending Plan
PROJECT SUMMARIES __________________________________________
B - 22

OAKLAND COLISEUM REDEVELOPMENT PROJECT AREA
__________________________________________ PROJECT SUMMARIES
B - 23
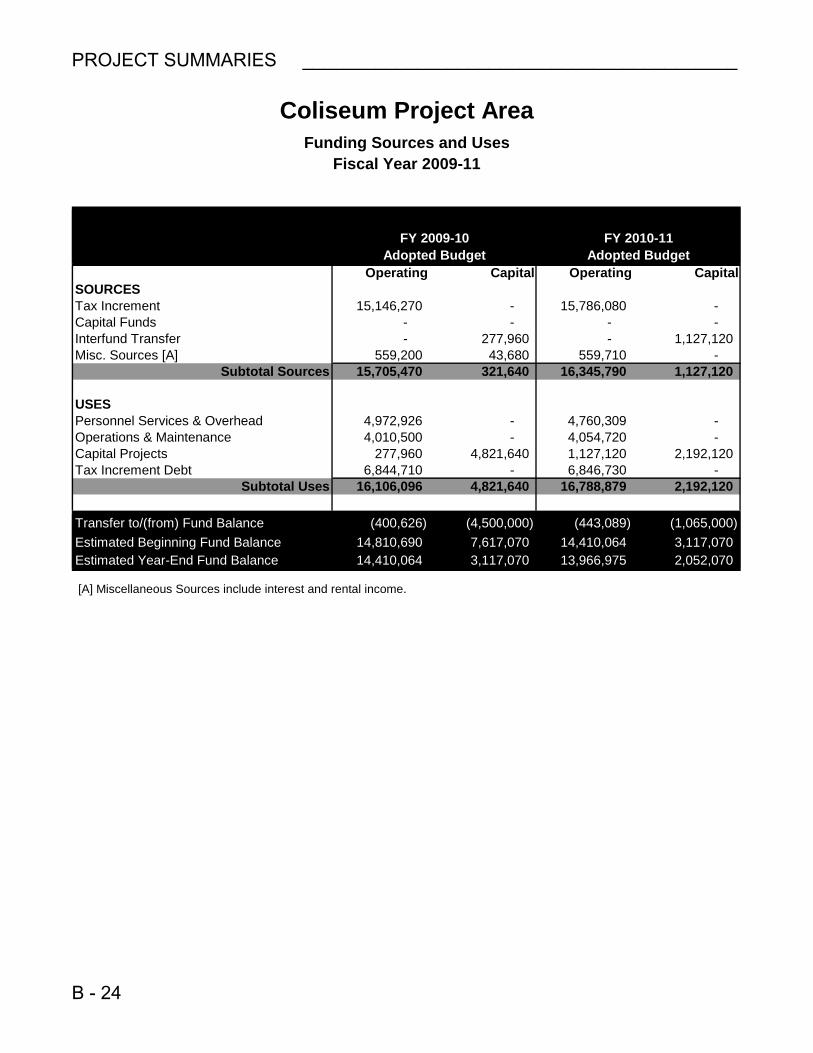
Operating Capital Operating CapitalSOURCESTax Increment 15,146,270 - 15,786,080 - Capital Funds - - - - Interfund Transfer - 277,960 - 1,127,120 Misc. Sources [A] 559,200 43,680 559,710 -
Subtotal Sources 15,705,470 321,640 16,345,790 1,127,120
USESPersonnel Services & Overhead 4,972,926 - 4,760,309 - Operations & Maintenance 4,010,500 - 4,054,720 - Capital Projects 277,960 4,821,640 1,127,120 2,192,120 Tax Increment Debt 6,844,710 - 6,846,730 -
Subtotal Uses 16,106,096 4,821,640 16,788,879 2,192,120
Transfer to/(from) Fund Balance (400,626) (4,500,000) (443,089) (1,065,000) Estimated Beginning Fund Balance 14,810,690 7,617,070 14,410,064 3,117,070 Estimated Year-End Fund Balance 14,410,064 3,117,070 13,966,975 2,052,070
[A] Miscellaneous Sources include interest and rental income.
Coliseum Project AreaFunding Sources and Uses
Fiscal Year 2009-11
FY 2009-10Adopted Budget
FY 2010-11 Adopted Budget
PROJECT SUMMARIES __________________________________________
B - 24

Background
The Coliseum Redevelopment Project Area includes 6,764 acres bounded by 22nd Avenue, International Boulevard, the Oakland-San Leandro city border, and the Oakland International Airport and Estuary. Approximately 75 percent of the total project area consists of commercial, industrial, and airport related uses and the remaining 25 percent is residential.
The principal objective of the Coliseum redevelopment plan is the abatement of physical and economic blight through the redevelopment of vacant and underutilized properties and the replacement of obsolete infrastructure. The Coliseum project contains six target areas of activity:
• Coliseum Shoreline
• Coliseum BART Station area
• Hegenberger Gateway / Oakland Airport area
• Fruitvale BART Station Area
• Neighborhood Project Initiative, an expanded focus on neighborhood capital projects
• International Boulevard Infill area
Highlights During the FY 2007-09 period, major accomplishments in the Coliseum Project Area included the completion of several projects or project phases:
• Infrastructure
- Construction of the Hegenberger East Street Improvements
- Construction of Airport Gateway Doolittle Drive and Airport Gateway Airport Access Road Improvements
- Construction of Lion Creek Crossings (formerly Coliseum Gardens HOPE VI) Phase III infrastructure improvements
- Completion of the Coliseum Transit Hub Streetscape along San Leandro Street
- Construction of temporary BART replacement parking and fencing under the San Leandro.Street overpass
- Full scale construction of the San Leandro Street Utility Undergrounding is underway
- 100% Plans developed for the expanded 66th Avenue Streetscape Improvement, which now includes a bike lane on 69th Avenue
- 100% Plans developed for the Railroad Avenue Phase II project from Louisiana Street to 98th Avenue
• Infill and Transit Oriented Development (TOD)
- Expended $120,000 in matching Infill Incentive Grant funds to assist 10 infill projects
- Awarded two grants for companion TOD projects in the amount of $16 million including $8.485 million state Prop 1C grant for Coliseum BART Transit Village Project infrastructure along with the related $7.525 million state Prop 1C loan for Lion Creek Crossings Phase IV
__________________________________________ PROJECT SUMMARIES
B - 25

• Other Projects and Public Facilities
- Completed Greenman Field renovation (1390 66th Avenue)
- Established Coliseum Façade and Tenant Improvement Projects, distributed $250,000 in matching grants and completed 6 projects
- Design and construction of the replacement park at Lion Creek Crossings, formerly Coliseum Gardens HOPE VI
- Design of the 81st Avenue Community Library project
- Cited approximately 580 code violations via the Tough on Blight Campaign, in cooperation with Building Services Division
- Loaned a total of $420,000 through the Coliseum Commercial Loan Program
- Youth Employment Partnership (YEP) contracted through workforce development to assist in graffiti abatement
- Funded Neighborhood Enforcement Team (NET) and 8L18 Police Department programs to promote public safety
- Established Community Cleanup Corps (CCC) with Department of Human Services using Goodwill
Industries as the homeless training coordinator
- Funded smaller community-initiated projects through the Neighborhood Projects Initiative Program
Plans for FY 2009-11 Adopted funding for FY 2009-11 is $14.9 million over the two year fiscal budget period. In November 2006, the Agency issued the Coliseum Redevelopment Project Area Tax Allocation Bonds Series 2006B. These bonds include tax exempt $28,770,000 bonds and taxable $78,820,000 taxable bond funds. A portion of the 2006B Bond proceeds was used for defeasance and refund of the Series 2003 Bonds, leaving a balance of $69.4 million available for projects. The 2006 Coliseum Redevelopment Tax Allocation bonds will provide funds to implement about 14 proposed projects during the next several years. These projects will mitigate physical and economic blight, contribute to revitalizing the Coliseum Project Area, and include:
• Supporting transit villages at both the Coliseum and Fruitvale BART station areas • Site acquisition in targeted areas:
- Coliseum Shoreline - Hegenberger / I-880 Gateway - Coliseum BART Station area - International Boulevard infill sites
• Designing streetscape and infrastructure improvements for:
- South Coliseum Way, from Hegenberger Road to the south entrance of the Oakland/Alameda County Coliseum Complex
- Edes Avenue, from Hegenberger Road to 85th Avenue - Lion Creek Crossings Phase 4 - Coliseum Transit Village infrastructure
PROJECT SUMMARIES __________________________________________
B - 26

• Installing neighborhood public facilities: - East Oakland Sports Complex - Oakland Public Library Capital Improvements, including new construction of the 81st Avenue Oakland
Public Branch Library - Coliseum BART Plaza - Sobrante Park - Officer William “Willie” Wilkins Memorial Park (98th Avenue and “C” Street) improvements
• Coordinating neighborhood revitalization efforts including:
- International Boulevard Streetscape Improvement Project - Neighborhood Project Initiative Program - Infill Development Incentives Program - Employment of other important economic development tools such as Neighborhood Commercial
Revitalization and Housing Rehabilitation - Partnership with Rebuilding Together Oakland to improve Oakland's existing housing stock
• Continuing Tough on Blight efforts:
- Conduct code enforcement sweep operations with Building Services - Implement program employing homeless individuals for blight abatement - Install security cameras to deter illegal dumping and graffiti - Implement graffiti abatement measures including murals and green walls
• Enhancing security measures for retail, commercial, and industrial areas: - 8L18 Patrol Area & NET program to augment OPD resources - Commercial Security Program for security patrols on commercial corridors - Crime Prevention Through Environmental Design consultations for area businesses
__________________________________________ PROJECT SUMMARIES
B - 27

Anticipated Balance, June 30, 2009 14,810,690$
Projected Sources - FY 2009-10
Tax Increment 15,146,270 Interest on Reserve 549,975 Rental Income 9,225 Total 2009-10 Sources 15,705,470
Total Anticipated Available Balance 30,516,160
Projected Uses - FY 2009-10Debt Service 6,844,710 Personnel Services and Related Overhead Costs 4,972,926 Projects, Programs and Operations & Maintenance 4,010,500 Transfer to Capital Funds 277,960 Total 2009-10 Uses 16,106,096
Anticipated Balance, June 30, 2010 14,410,064
Projected Sources - FY 2010-11
Tax Increment 15,786,080 Interest on Reserve 549,973 Rental Income 9,737 Total 2010-11 Sources 16,345,790
Total Anticipated Available Balance 30,755,854
Projected Uses - FY 2010-11Debt Service 6,846,730 Personnel Services and Related Overhead Costs 4,760,309 Projects, Programs and Operations & Maintenance 4,054,720 Transfer to Capital Funds 1,127,120 Total 2010-11 Uses 16,788,879
Anticipated Balance, June 30, 2011 13,966,975$
COLISEUMOperating Reserve Status
PROJECT SUMMARIES __________________________________________
B - 28
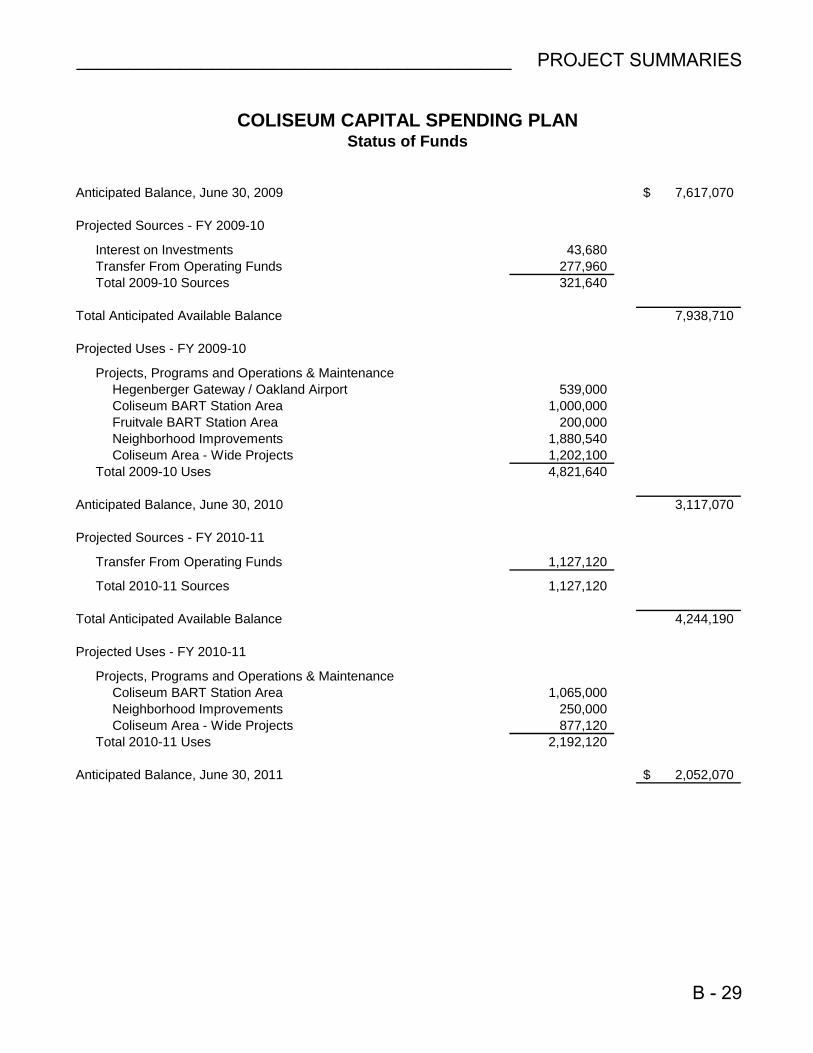
Anticipated Balance, June 30, 2009 7,617,070$
Projected Sources - FY 2009-10
Interest on Investments 43,680 Transfer From Operating Funds 277,960 Total 2009-10 Sources 321,640
Total Anticipated Available Balance 7,938,710
Projected Uses - FY 2009-10
Projects, Programs and Operations & MaintenanceHegenberger Gateway / Oakland Airport 539,000 Coliseum BART Station Area 1,000,000 Fruitvale BART Station Area 200,000 Neighborhood Improvements 1,880,540 Coliseum Area - Wide Projects 1,202,100
Total 2009-10 Uses 4,821,640
Anticipated Balance, June 30, 2010 3,117,070
Projected Sources - FY 2010-11
Transfer From Operating Funds 1,127,120
Total 2010-11 Sources 1,127,120
Total Anticipated Available Balance 4,244,190
Projected Uses - FY 2010-11
Projects, Programs and Operations & MaintenanceColiseum BART Station Area 1,065,000 Neighborhood Improvements 250,000 Coliseum Area - Wide Projects 877,120
Total 2010-11 Uses 2,192,120
Anticipated Balance, June 30, 2011 2,052,070$
COLISEUM CAPITAL SPENDING PLANStatus of Funds
__________________________________________ PROJECT SUMMARIES
B - 29

Coliseum Project Area Capital Project and Program Descriptions
The descriptions below are for the capital projects and programs within the Coliseum, which are summarized at the end of this section.
COLISEUM-WIDE PROGRAMS
NEIGHBORHOOD PROMOTION AND IMPROVEMENT Facade and Tenant Improvement Programs These programs offer architectural assistance and matching grants for improvements to commercial properties on targeted streets in the Redevelopment Area. The Façade Program provides grants for the improvement of building exteriors and the Tenant Improvement Program provides grants for interior spaces. The two programs began in June of 2007 and a total of $1,120,000 has been budgeted to date, with six projects completed, eight underway, and eleven more in the design phase. Some tenant and façade improvements administered by Redevelopment staff are also funded with monies from the federal Community Development Block Grant program. A total of $1,250,000 will be allocated during the next two fiscal years. Rebuilding Together Oakland Rebuilding Together Oakland uses volunteer labor and leverages financial and in-kind donations to rehabilitate the homes of low-income elderly and disabled homeowners at no cost to the homeowners, so that they may live in safety, comfort and independence. Rebuilding Together Oakland also rehabilitates non-profit community facilities that work directly within low-income communities. For fiscal years 2009-10 and 2010-11, $50,000 will be allocated each year to this program. Green Works Development Program Provides a two-year cycle of dedicated matching funds for “green-job” workforce training with connected capital funds for short-term/limited-scale green project installations (e.g., identified public landscaping/park components; neighborhood/residential greening projects) that will utilize up to 40 project area residents in-training as part of a formal green conservation crew. Specific installations are to be identified as augmentations to planned Coliseum Redevelopment Area capital projects or in response to expressed neighborhood/residential need. For fiscal years 2009-10 and 2010-11, $100,000 will be allocated each year to this program. Neighborhood Project Initiative The Neighborhood Project Initiative (NPI) is intended to further blight reduction and beautification efforts in redevelopment areas through the funding of small-scale, community-initiated public/private improvement and infrastructure projects that currently have no other funding source. For fiscal years 2005-06 and 2006-07, $180,000 of Coliseum Area Redevelopment funds was allocated each year to the implementation of this Initiative, and for 2007-08 and 2008-09 the amount was increased to $240,000. These funds have been allocated to 27 small projects since the program’s inception. For fiscal years 2009-10 and 2010-11, $180,000 will be allocated each year to this program.
PROJECT SUMMARIES __________________________________________
B - 30

Infill Development Incentives Program This program offers developers and property owners up to $15,000 in matching funds for predevelopment analysis. The program is intended to encourage the exploration of residential and nonresidential development options for infill areas in the Coliseum Redevelopment Project Area. Major corridors are a particular focus of the program. Nine projects have been completed to date using $60,000 of Coliseum Area Redevelopment funds allocated in fiscal year 2007-08 and $60,000 in 2008-09. For fiscal years 2009-10 and 2010-11, $75,000 will be allocated each year to this program.
SECURITY AND BLIGHT ABATEMENT
Security Enhancement Program Coliseum Area Redevelopment funds support OPD activities in the project area through the Neighborhood Enforcement Team (NET) program and the 8L18 Enhanced Patrol Area, which funds overtime costs for extra police patrols in commercial/industrial areas on nights and weekends. During fiscal years 2009-10 and 2010-2011 a total of $1,827,190 will be allocated to the OPD NET program. For fiscal years 2009-10 and 2010-11, $175,000 will be allocated each year for the OPD 8L18 program. Graffiti Abatement Programs The Coliseum Redevelopment Project abates graffiti through three different programs: an apprenticeship program employing individuals to paint over graffiti, a mural program for highly visible properties where artists work to create murals with at-risk youth, and through the implementation of “green walls”, where trellises and plantings cover walls that are frequently vandalized. For fiscal years 2009-10 and 2010-11, $90,000 will be allocated each year to these efforts. Coliseum Tough on Blight Operation This program is an enhanced blight enforcement operation that aggressively pursues blighted properties and blighting conditions within the Coliseum Project Area in cooperation with the Building Services Division, conducting 2 sweeps of project area streets per year. For fiscal years 2009-10 and 2010-11, $75,000 will be allocated each year to this program. The Community Cleanup Corps Individuals transitioning out of homelessness alleviate blight in Oakland redevelopment areas through a 16-week education, training and paid work experience program. Program participants learn life skills, work readiness skills and safety skills in a classroom setting, and perform field work activities, including light clean-up, weed and blight abatement and limited vegetation management activities. The program alternates days of unpaid formal classroom instruction and paid on-the-job training and work activities. For fiscal years 2009-10 and 2010-11, $50,000 will be allocated each year to this program. Coliseum Commercial Security Program The Coliseum area, in coordination with the Central City East redevelopment area, is committed to public safety along commercial corridors in the Coliseum Project area. For fiscal years 2009-10 and 2010-11, $100,000 will be allocated each year to this program.
__________________________________________ PROJECT SUMMARIES
B - 31

CAPITAL PROJECT SUPPORT
Citywide Technology Capital Improvement Project The Citywide Technology Capital Improvement Project allocation covers costs for the Agency's share of the Oracle System and the Sun Server, in support of redevelopment activities. The costs are shared among the following redevelopment project areas: Central District, Coliseum, Broadway/MacArthur/San Pablo, Central City East and Oakland Army Base. The total Agency contribution is $900,000 per year for fiscal years 2009-10 and 2010-11. The Coliseum Capital fund will provide $200,000 annually for technology capital improvements. Coliseum Capital Project Support This program provides equipment, promotional materials, and professional services in support of redevelopment activities throughout the Coliseum Project Area. Funds are also used for environmental assessments, consultants, appraisals, and legal fees for general infrastructure and offsite improvements which support major redevelopment, neighborhood, and economic catalyst projects. For fiscal years 2009-10 and 2010-11, $100,000 will be allocated each year to this program. Site Acquisitions The Agency will continue to explore site acquisition strategies to facilitate:
• Replacement parking for the development of residential housing on the existing Coliseum BART surface parking
• Development of a major mixed-use commercial center within the area bounded by 66th Avenue, Interstate 880, Hegenberger Road and San Leandro Street
• Continued development of the Coliseum Auto Mile
• Infill projects on International Boulevard
• Neighborhood shopping center sites with grocery store anchors in locations such as San Leandro Street and 66th Avenue
• Greater retail attraction to the Project Area.
PROJECT SUMMARIES __________________________________________
B - 32

FRUITVALE AREA
Fruitvale BART Transit Village The Fruitvale Transit Village, located west of East 12th Street between 33rd and 35th Avenues, is a major mixed-use development project that has revitalized the Fruitvale BART Station area between 33rd and 35th Avenues west of International Boulevard. Three out of four phases, as well as a major public pedestrian plaza that connects the BART station with International Boulevard, have been completed. Phase I included the construction of Las Bougainvilleas, a 68-unit senior housing development. Phase II comprised demolition, utility realignment, and streetscape improvement along East 12th Street. Phase III saw the construction of two major mixed-use buildings flanking the pedestrian plaza. In this phase, the Fruitvale Development Corporation (FDC) provided space for a new senior center, a day care center, senior and family housing, a community resource center, a health clinic, and a shopping and public pedestrian plaza. Phase IV, proposed for construction on the East 12th Street BART supplemental parking lot, will include 275 units of market rate rental housing to complement the transit village’s existing mix of retail and community services. Fruitvale Alive Streetscape Improvements Improvements to this key corridor linking I-580 to I-880 will increase intermodal transit, address pedestrian safety and improve pedestrian connections between transit nodes and commercial centers. The blocks along Fruitvale Avenue between E. 12th and Farnam Streets are within the Coliseum Project Area. The Redevelopment Agency is allocating $200,000 in additional funds for this project in fiscal year 2009-10 to complement grants from the Metropolitan Transportation Commission (MTC).
HEGENBERGER / I-880 GATEWAY
Hegenberger East Gateway Streetscape Improvements Located on Hegenberger Road, from Interstate 880 to the base of the San Leandro Street overpass, the improvements continue the Hegenberger Road Gateway streetscape theme with enhanced lighting, ornamental light poles, landscaping and banners. This project was designed in anticipation of the construction of the Oakland Airport Connector, and to complement the planned 165,000 square feet Coliseum Towne Center retail development. The primary project work was complete in the fall of 2008, with small additional improvements to the project’s edges pending. South Coliseum Way/Edes Avenue Streetscape Design This project is intended to provide a stronger link between the hotels on Edes Avenue and the Coliseum entertainment complex and may include ornamental streetlights, banners and trees. It will extend from the south entrance of Oakland/Alameda County Coliseum to 85th Avenue along South Coliseum Way and Edes Avenue. Project design began in June 2007, and construction drawings are complete to the 35% level with design completion by summer 2009. Additional Coliseum area funds of $900,000 are allocated to this project in FY 2009-10, including $361,000 in reprogrammed funds.
__________________________________________ PROJECT SUMMARIES
B - 33

COLISEUM BART STATION AREA
Coliseum BART Station Transit Village The Coliseum Transit Village is a mixed-use Transit Oriented Development (TOD) at the inter-modal mass transit hub at the Coliseum BART Station. Currently, the City and BART are working with OEDC/MacFarlane Partners on the development, which will replace the existing Coliseum BART parking lot and provide approximately 400 units of housing and about 20,000 sq. ft. of neighborhood-serving retail. The project, together with Lion Creek Crossings Phase IV, was recently awarded $8.5 million in TOD funding from the California Department of Housing and Community Development. A total of $2,065,000 will be allocated to infrastructure improvements supporting the Coliseum Transit Village and Lion Creek Crossings Phase IV in fiscal years 2009-10 and 2010-2011 to partially match the TOD grant. Coliseum Transit Village Replacement Parking Infrastructure As the core of the Coliseum Transit Village is situated on BART parking lots, replacement parking for BART patrons will be temporarily provided by surface parking. This temporary surface parking will ultimately be replaced by a parking garage(s) system. Lion Creek Crossings (formerly Coliseum Gardens HOPE VI) Project The Oakland Housing Authority (OHA), in partnership with EBALDC and Related Companies of California, is developing a mixed-income housing project on 20 acres at San Leandro Street between 66th and 69th Avenues. The project, which received $34.5 million of HUD HOPE VI funding and a $4 million Agency contribution, replaces the Coliseum Gardens public housing project that was demolished in 2004. Phase I, with 115 units, was awarded both the California Redevelopment Association Award for Excellence in Residential New Construction and the National Association of Housing and Redevelopment Officials' National Award for Excellence in Project Design. To date, 366 affordable rental units in Phases I, II and III have been completed. Phase IV recently received $7.5 million in Transit Oriented Development funding from the California Department of Housing and Community Development. The entire five-phase, 466-unit project, including 28 units for home buyers, two new streets, a City park and the restoration of a portion of Lion Creek, will be completed by December 2010. The Agency provided OHA with a $4 million grant for subdivision infrastructure improvements for Phases I through III, and will provide additional support for Phase IV. Lion Creek Crossings Park and Creek Restoration Lion Creek Crossings Park is located within the Lion Creek Crossings housing development, and adjacent to the restored Lion Creek. In March of 2005, the Agency applied for and received a $552,294 Workforce Housing Incentive Grant, $502,294 of which has been allocated to the park and creek. The funds furthered the neighborhood revitalization started by the housing development, and were used for bridges over the restored creek and other improvements to facilitate park access from neighborhood residences. San Leandro Street Utility Undergrounding Undergrounding of utilities along San Leandro Street between 66th and 73rd Avenues will complement the recently completed Coliseum Transit Hub streetscape project and advance the larger redevelopment effort to create a transit-oriented development around the Coliseum BART station area. The undergrounding is currently underway and scheduled to be completed by the summer of 2009. The streetscape improvement and undergrounding
PROJECT SUMMARIES __________________________________________
B - 34

projects for San Leandro Street comprise a $6 million effort, using $3.5 million of Agency funds and $2.5 million of federal, state and local grants. 66th Avenue Streetscape This project is located on 66th Avenue between San Leandro Street and International Boulevard. Leveraging the Lion Creek Crossings and San Leandro Street infrastructure improvements, the project will improve pedestrian access to the transit facilities on both International Boulevard and San Leandro Street. Project design is complete, with construction scheduled to begin in the summer of 2009. Grant funds in the amount of $1,230,000 from the MTC Housing Incentive Program, $387,115 from the Transportation For Clean Air program, and a $1,188,000 Agency contribution from fiscal year 2007-08 and fiscal year 2008-09 will fund improvements to provide better pedestrian linkage to the area's transit, schools and activity centers.
NEIGHBORHOOD IMPROVEMENTS
Streetscapes Many streets in the older industrial and neighborhood commercial districts require improvement to accommodate current pedestrian and vehicle activity. Some of the streets lack sidewalks or other pedestrian amenities, which inhibit the full utilization of adjacent properties. The Coliseum Redevelopment Project aims to transform these districts into vital, functioning areas by upgrading the roadway infrastructure to help support and encourage private development.
• International Boulevard Streetscape Improvement Improvements are planned for three nodes comprising 23 blocks along the thoroughfare from 40th Avenue to 89th Avenue. The Agency and City are seeking regional, state and federal funding to complement existing City funding for the project. Coliseum Redevelopment funds will support project design and administration costs for Public Works capital improvement of International Boulevard, with allocations of $750,000 in FY 2009-10 and $250,000 in FY 2010-11.
• Railroad Avenue Street Improvement Phase II Improvement of Railroad Avenue from Louisiana Street to 98th Avenue will complete Agency efforts to reduce dumping activities and drainage problems on the roadway. Phase I successfully enhanced the appearance and function of Railroad Avenue from 85th Avenue to Louisiana Street for the businesses along that section of the road. Phase II, financed with approximately $2 million of Coliseum Redevelopment funds, will provide the same level of improvements for the residents along the southern portion of Railroad Avenue. Plans are complete and construction of Phase 2 is scheduled to commence summer 2009. The project allocation in FY 2009-10 is $100,000.
• Sunshine Court Improvements Sunshine Court is a severely unimproved street that falls within the Coliseum and Central City East (CCE) Redevelopment Areas. It runs between 74th and 76th Avenue, beginning at International Boulevard and turning south to terminate at 76th Avenue. Redevelopment funds will be used to improve the blighted, damaged and unsafe condition of Sunshine Court. The Oakland Redevelopment Agency and the City of Oakland are in the process of acquiring the road. Improvements to the road will be necessary before it can be dedicated to the City. Coliseum funds in the amount of $1,05 million are allocated for Sunshine Court improvements in FY 2009-10.
__________________________________________ PROJECT SUMMARIES
B - 35

Industrial Zone Improvements: General Coliseum Infrastructure Project The General Coliseum Infrastructure project will provide infrastructure investments in targeted industrial areas to increase jobs in the Coliseum area. Components include utilities and lighting equipment, surface and street improvements, landscape amenities, trees and signage. Targeted areas include the Melrose-Coliseum, Woodland-81st Avenue and Tidewater industrial zones. $1.0 million is allocated to this project in FY 2009-10 and $675,000 in FY 2010-11. Parks and Open Space This project will renovate and upgrade various parks throughout the Coliseum Redevelopment Area to minimize the hazards of outdated and overused park structures and make these public sites safer and more pleasant for community use. This investment in parks will also increase surrounding property values and eliminate blight.
• Officer William “Willie” Wilkins Memorial Park (formerly Elmhurst Plaza Park) Improvements to this park at 9700 C Street will include new lighting, a new play area, new restrooms, a picnic area, lawn, a jogging path with exercise stations and other paths.
• Sobrante Park Improvements to this park at 470 El Paseo Drive will include a new restroom structure and utility connections as well as handicap accessible pathways.
Public Buildings and Facilities The Coliseum Redevelopment Area has many public facilities that are in need of renovations to meet current City Building & Safety standards. This project will refurbish and upgrade various recreation centers and libraries located within the Project Area to make these buildings more usable to the community and more relevant to current activities.
• Teen Center at 5818 International Boulevard Coliseum Redevelopment funds were used to purchase this former day-care facility for use as a teen center. Improvements are being funded by the Agency through the Neighborhood Project Initiative program.
• 81st Avenue Community Branch Library The Agency is contributing $4 million toward the construction of a $10 million public library in East Oakland at 81st Avenue and Rudsdale Street. The new 21,000 square foot facility is a joint project of the Oakland Unified School District and the City of Oakland. When completed in December 2009, it will be the City’s first LEED certified, silver rated public building, sharing space with two new schools, Encompass Academy and Woodland School. The library will serve 11 nearby schools, and provide over 60 computers, a full-service computer training area, as well as job and adult education resources and life-skill programs.
PROJECT SUMMARIES __________________________________________
B - 36

AreaFY 2008-09 Estimated
Carryforward
Reprogram FY 2008-09
Carryforward
FY 2009-10 Amended
Allocation
FY 2010-11 Amended
Allocation
FY 2009-11Amended
AllocationHegenberger Gateway / Oakland AirportDoolittle Drive Streetscape $406,338 ($361,000) ($361,000) $0 $45,338S. Coliseum Way and Edes Streetscape 1,952,974 - 900,000 - 2,852,974 Hegenberger East Streetscape 100,981 - - - 100,981 Airport Access Road Streetscape 88,201 - - - 88,201 Airport Connector 725,000 - - - 725,000 Zhone Technology 24,000 - - - 24,000
Subtotal $3,297,494 ($361,000) $539,000 $0 $3,836,494Coliseum BART Station AreaColiseum Transit Village Infrastructure $0 $0 $1,000,000 $1,065,000 $2,065,00066th Avenue Streetscape 958,411 - - - 958,411 Coliseum Transit Hub Streetscape 22,107 - - - 22,107 Undergrounding 234,797 - - - 234,797 Intercity Rail Platform Coliseum Bond 1,110 - - - 1,110 Coliseum Gardens Hope VI Infrastructure 51,208 - - - 51,208
Subtotal $1,267,633 $0 $1,000,000 $1,065,000 $3,332,633Fruitvale BART Station AreaFruitvale Alive Streetscape $0 $0 $200,000 $0 $200,000Fruitvale Village 27,500 - - - 27,500
Subtotal $27,500 $0 $200,000 $0 $227,500Neighborhood Improvements29th Ave / Chapman Street $19,460 ($19,460) ($19,460) $0 $0Sunshine Court Improvements - - 1,050,000 - 1,050,000 International Boulevard Streetscape - - 750,000 250,000 1,000,000 Railroad Avenue Phase II 1,348,321 - 100,000 - 1,448,321 Railroad Avenue Phase I 22,042 - - - 22,042 NCR Coliseum 80,049 - - - 80,049 Merchant Promo District 4 20,000 - - - 20,000 Merchant Promo District 5 20,000 - - - 20,000 Merchant Promo District 7 20,000 - - - 20,000 Neighborhood Project Initiative 22,758 - - - 22,758
Subtotal $1,552,630 ($19,460) $1,880,540 $250,000 $3,683,170Public FacilitiesRainbow Rec Teen Center $8,443 $0 $0 $0 $8,443Coliseum Public Facilities - Libraries 500,000 - - - 500,000 Brookfield Library 149,547 - - - 149,547 Martin Luther King Jr. Library 299,793 - - - 299,793 Willie Wilkins Park Tot Lot 206,027 - - - 206,027 Sobrante Park Restroom 288,630 - - - 288,630 District 5 Teen Center 500,000 - - - 500,000 81st Avenue Library 500,000 - - - 500,000
Subtotal $2,452,440 $0 $0 $0 $2,452,440Coliseum Area-Wide ProjectsColiseum Capital Contract Contingency $0 $0 $200,000 $200,000 $400,000General Coliseum Infrastructure - - 1,000,000 675,000 1,675,000 Coliseum Land Acquisition 67,933,799 - - - 67,933,799 Oracle Corp Software License 99,523 - - - 99,523 Purchasing Services - 2,100 2,120 4,220
Subtotal $68,033,322 $0 $1,202,100 $877,120 $70,112,542
GRAND TOTAL $76,631,018 ($380,460) $4,821,640 $2,192,120 $83,644,778
Coliseum Project AreaCapital Spending Plan
__________________________________________ PROJECT SUMMARIES
B - 37

NOTES
PROJECT SUMMARIES __________________________________________
B - 38

ACORN REDEVELOPMENT PROJECT AREA
__________________________________________ PROJECT SUMMARIES
B - 39

Operating Capital Operating CapitalSOURCESTax Increment 880,730 - 910,000 - Capital Funds - - - - Misc. Sources [A] 57,010 - 57,010 -
Subtotal Sources 937,740 - 967,010 -
USESPersonnel Services & Overhead 255,176 - 257,001 - Operations & Maintenance 510,850 - 535,680 - Capital Projects - - - - Tax Increment Debt - - - - Other Debt 161,750 - 161,750 -
Subtotal Uses 927,776 - 954,431 -
Transfer to/(from) Fund Balance 9,964 - 12,579 - Estimated Beginning Fund Balance 1,785,220 - 1,795,184 - Estimated Year-End Fund Balance 1,795,184 - 1,807,763 -
[A] Miscellaneous Sources includes interest and rental income.
Acorn Project AreaFunding Sources and Uses
Fiscal Year 2009-11
FY 2009-10Adopted Budget
FY 2010-11 Adopted Budget
PROJECT SUMMARIES __________________________________________
B - 40

Background The Acorn Redevelopment Project Area in West Oakland covers 24.55 acres of land comprising 14 city blocks. It is 10 blocks from Oakland’s downtown area, close to major employment centers in Oakland and San Francisco, with good public transportation access to BART and AC Transit. The area is approximately 50 percent commercial/industrial and 50 percent residential, and has been redeveloped fully in accordance with the original redevelopment plan. Highlights Major accomplishments in FY 2007-09 include the completion of the Disposition and Development Agreement (DDA) between the Agency and Jack London Gateway Associates for improvements to the Jack London Gateway Center (Center). The DDA stipulated several upgrades and improvements to the Center which included a new clock tower, painting in a more attractive and modern color scheme and repaving the parking lot. Improvements to the Center’s Brush Street façade included new signage and landscaping to make the Center more visible and attractive to motorists on Brush Street. Plans for FY 2009-11 Adopted funding for FY 2009-11 is $1.8 million (two-year total). The majority of the appropriation will be used to repay outstanding debt. Jack London Gateway Associates has renovated and modernized the Jack London Gateway Shopping Center and the East Bay Asian Local Development Corporation will finish developing 61 units of senior housing on an underutilized section of the parking lot.
__________________________________________ PROJECT SUMMARIES
B - 41

Anticipated Balance, June 30, 2009 1,785,220$
Projected Sources - FY 2009-10
Tax Increment 880,730 Interest on Reserve 57,010 Total 2009-10 Sources 937,740
Total Anticipated Available Balance 2,722,960
Projected Uses - FY 2009-10Debt Service 161,750 Personnel Services and Related Overhead Costs 255,176 Projects, Programs and Operations & Maintenance 510,850 Total 2009-10 Uses 927,776
Anticipated Balance, June 30, 2010 1,795,184
Projected Sources - FY 2010-11
Tax Increment 910,000 Interest on Reserve 57,010 Total 2010-11 Sources 967,010
Total Anticipated Available Balance 2,762,194
Projected Uses - FY 2010-11Debt Service 161,750 Personnel Services and Related Overhead Costs 257,001 Projects, Programs and Operations & Maintenance 535,680 Total 2010-11 Uses 954,431
Anticipated Balance, June 30, 2011 1,807,763$
ACORNOperating Reserve Status
PROJECT SUMMARIES __________________________________________
B - 42

STANFORD-ADELINE REDEVELOPMENT PROJECT AREA
__________________________________________ PROJECT SUMMARIES
B - 43

Operating Capital Operating CapitalSOURCESTax Increment 118,730 - 120,890 - Capital Funds - - - - Interfund Transfer [A] (26,642) - (103,025) - Misc. Sources [B] 10,000 - 10,000 -
Subtotal Sources 102,088 - 27,865 -
USESPersonnel Services & Overhead 27,628 - 27,745 - Operations & Maintenance 120 - 120 - Capital Projects - - - - Tax Increment Debt 74,340 - - - Other Debt - - - -
Subtotal Uses 102,088 - 27,865 -
Transfer to/(from) Fund Balance - - - - Estimated Beginning Fund Balance 527,450 - 527,450 - Estimated Year-End Fund Balance 527,450 - 527,450 -
[B] Miscellaneous Sources include interest and rental income.
[A] Includes a transfer of $26,642 in FY 2009-10 and $103,025 in FY 2010-11 to Low Moderate Income Housing Fund for development of affordable housing.
Stanford / Adeline Project AreaFunding Sources and Uses
Fiscal Year 2009-10
FY 2009-10Adopted Budget
FY 2010-11 Adopted Budget
PROJECT SUMMARIES __________________________________________
B - 44

Background
The Stanford/Adeline Redevelopment Project Area includes a four block area in North Oakland where three major streets converge. During the late 1970s, the incompatible industrial and commercial areas were removed and replaced with open space. In addition, the confusing interchange of Stanford and Adeline Streets was realigned to make the neighborhood quieter and safer. The Stanford/Adeline Project was completed in 1987.
Highlights
The planned work for this Redevelopment Project Area was completed in 1987. In October 2003, the Agency purchased 1072 55th Street, a two-unit residence, from the City for $415,000. The property was sold in FY 2004-05 and the proceeds were used for the development of affordable housing. The Agency will make the final payment on this loan to the City’s Community Development program in FY 2009-10.
Plans for FY 2009-11
Adopted funding for FY 2009-11 is $164,000 plus $74,341 to repay the debt to the City from the Agency’s acquisition of 1072 55th Street. These funds will cover a portion of the Redevelopment Agency’s staffing costs and the remaining Stanford/Adeline tax increment revenues, which are estimated to be $128,000 during FY 2009-11, will be allotted to the Low and Moderate Income Housing Fund for the development of affordable housing.
__________________________________________ PROJECT SUMMARIES
B - 45

Anticipated Balance, June 30, 2009 527,450$
Projected Sources - FY 2009-10
Tax Increment 118,730 Interest on Reserve 10,000 Transfer to Low Moderate Income Housing Fund (26,642) Total 2009-10 Sources 102,088
Total Anticipated Available Balance 629,538
Projected Uses - FY 2009-10Debt Service 74,340 Personnel Services and Related Overhead Costs 27,628 Projects, Programs and Operations & Maintenance 120 Total 2009-10 Uses 102,088
Anticipated Balance, June 30, 2010 527,450
Projected Sources - FY 2010-11
Tax Increment 120,890 Interest on Reserve 10,000 Transfer to Low Moderate Income Housing Fund (103,025) Total 2010-11 Sources 27,865
Total Anticipated Available Balance 555,315
Projected Uses - FY 2010-11Debt Service - Personnel Services and Related Overhead Costs 27,745 Projects, Programs and Operations & Maintenance 120 Total 2010-11 Uses 27,865
Anticipated Balance, June 30, 2011 527,450$
STANFORD / ADELINEOperating Reserve Status
PROJECT SUMMARIES __________________________________________
B - 46

OAK CENTER REDEVELOPMENT PROJECT AREA
__________________________________________ PROJECT SUMMARIES
B - 47

Operating Capital Operating CapitalSOURCESTax Increment - - - - Capital Funds - - - - Misc. Sources [A] 223,300 - - -
Subtotal Sources 223,300 - - -
USESPersonnel Services & Overhead - - - - Operations & Maintenance - - - - Capital Projects - - - - Tax Increment Debt - - - - Other Debt 400,000 - 400,000 -
Subtotal Uses 400,000 - 400,000 -
Transfer to/(from) Fund Balance (176,700) - (400,000) - Estimated Beginning Fund Balance 702,210 - 525,510 - Estimated Year-End Fund Balance 525,510 - 125,510 -
[A] Miscellaneous Sources includes interest and rental income.
FY 2009-10Adopted Budget
FY 2010-11 Adopted Budget
Oak Center Project AreaFunding Sources and Uses
Fiscal Year 2009-11
PROJECT SUMMARIES __________________________________________
B - 48

Background
The Oak Center Project is a 56-block residential community in West Oakland, adjacent to downtown and the Acorn Project, mainly composed of Victorian structures. These turn-of-the-century buildings were preserved through multiple efforts and a variety of financing techniques. Many structures were not feasible for rehabilitation and were demolished, leaving scattered vacant land for future development. For the most part, the project is complete except for a few parcels that remain to be developed. Highlights of FY 2007-2009
The Oak Center Redevelopment Plan’s activities are mostly completed. The principal remaining activities are monitoring compliance with the Redevelopment Plan and providing support services to the Oak Center Neighborhood Association (OCNA). Projects during FY 2007-09 included repairs and upgrades to the deFremery Park Pool House and Recreation Center and the completion of the Oak Center Historical Marker Project. This latter project consists of signage and markers throughout the area and plaques for individual historic houses that are designated as City landmarks in the Oak Center Project Area. Plans for FY 2009-11
Adopted funding from fund balance and reallocation from completed projects for FY 2009-11 is $800,000 (two-year total). Funding from previous years will be used for renovations to the deFremery House and tennis courts. The tennis courts will be repaved and the roof and dry rot will repaired in deFremery House. Most of the Oak Center appropriations will be used to repay outstanding debt to the City.
__________________________________________ PROJECT SUMMARIES
B - 49

Anticipated Balance, June 30, 2009 702,210$
Projected Sources - FY 2009-10
Return of Prior Year Unspent Balances to Fund Balance 223,300 Total 2009-10 Sources 223,300
Total Anticipated Available Balance 925,510
Projected Uses - FY 2009-10Debt Service 400,000 Total 2009-10 Uses 400,000
Anticipated Balance, June 30, 2010 525,510
Projected Sources - FY 2010-11Total 2010-11 Sources -
Total Anticipated Available Balance 525,510
Projected Uses - FY 2010-11Debt Service 400,000 Total 2010-11 Uses 400,000
Anticipated Balance, June 30, 2011 125,510$
OAK CENTEROperating Reserve Status
PROJECT SUMMARIES __________________________________________
B - 50

BROADWAY / MACARTHUR / SAN PABLO REDEVELOPMENT PROJECT AREA
__________________________________________ PROJECT SUMMARIES
B - 51

Operating Capital Operating CapitalSOURCESTax Increment 3,020,280 - 3,169,750 - Interfund Transfer - - - - Misc. Sources [A] 125,000 - 125,000 -
Subtotal Sources 3,145,280 - 3,294,750 -
USESPersonnel Services & Overhead 1,119,987 - 1,131,866 - Operations & Maintenance 820,890 - 952,200 - Capital Projects - - - - Tax Increment Debt 1,152,810 - 1,153,410 - Other Debt - - - -
Subtotal Uses 3,093,687 - 3,237,476 -
Transfer to/(from) Fund Balance 51,593 - 57,274 - Estimated Beginning Fund Balance 3,778,890 1,033,210 3,830,483 1,033,210 Estimated Year-End Fund Balance 3,830,483 1,033,210 3,887,757 1,033,210
[A] Miscellaneous Sources includes interest and rental income.
Funding Sources and UsesFiscal Year 2009-11
FY 2009-10Adopted Budget
FY 2010-11 Adopted Budget
Broadway / MacArthur / San Pablo Project Area
PROJECT SUMMARIES __________________________________________
B - 52

Background
The Broadway/MacArthur/San Pablo Project Area consists of two distinct areas in North Oakland and comprises 676 acres. The Broadway/MacArthur sub-area incorporates Broadway Auto Row and Telegraph Avenue between 27th and 42nd Streets. The San Pablo sub-area incorporates that portion of San Pablo Avenue between 53rd and 67th Streets. Key elements of the Redevelopment Plan include eliminating blight, encouraging in-fill development and supporting catalyst projects, including the MacArthur Transit Village project. The Project Area Committee (PAC) was approved and seated on March 21, 2000, and the Redevelopment Plan was adopted on July 25, 2000. The PAC has prioritized the MacArthur Transit Village Project, Commercial Façade and Tenant Improvement Programs, and streetscape improvements on 40th Street and San Pablo Avenue for funding in its 5-year implementation plan. The following activities have also been identified as high-priorities for the PAC: infill development within the Project Area and implementation of planned streetscape improvements on Telegraph Avenue, West MacArthur Boulevard, and Martin Luther King, Jr. Way. Highlights
Major accomplishments in FY 2007-09 in the Broadway/MacArthur/San Pablo Project Area include the following:
• MacArthur Transit Village: Final EIR certified and planning entitlements for the project were approved. Secured $34.3 million in State Proposition 1C grants, and $1.3 million in federal grants.
• Completed a 34 unit condominium development at 3860 Martin Luther King, Jr. Way.
• Completed three (3) tenant improvement projects through the Tenant Improvement Grant Program.
• Completed ten (10) façade improvements through the Façade Improvement Grant Program.
• Completed eleven (11) small-scale community based capital projects within the Project Area through the Neighborhood Projects Initiative program.
• Completed the 40th Street streetscape improvement project, which supports the MacArthur BART transit hub.
• Funding allocated, and a consultant group selected, to complete the Upper Broadway Specific Plan.
• San Pablo Pedestrian Streetlight project funded, and construction contract awarded. Plans for FY 2009-11
Adopted funding for FY 2009-11 is $3.95 million. Planned activities during FY 2009-11 include:
• Work with MacArthur Transit Community Partners to acquire properties surrounding the MacArthur BART station.
• Begin construction of the BART replacement garage and interior roadways for the MacArthur Transit Village project.
• Continue the Commercial Façade Improvement, Tenant Improvement, and the Neighborhood Projects Initiative programs.
• Work with Cotter and Coyle, LLC to complete design and construction documents for a 40-unit condominium project at 3884 Martin Luther King, Jr. Way.
• Complete installation of pedestrian street lights on San Pablo Avenue.
• Acquire property within the Project Area for infill development.
• Complete the Upper Broadway Specific Plan.
__________________________________________ PROJECT SUMMARIES
B - 53

Anticipated Balance, June 30, 2009 3,778,890$
Projected Sources - FY 2009-10
Tax Increment 3,020,280 Interest on Reserve 125,000 Total 2009-10 Sources 3,145,280
Total Anticipated Available Balance 6,924,170
Projected Uses - FY 2009-10Debt Service 1,152,810 Personnel Services and Related Overhead Costs 1,119,987 Projects, Programs and Operations & Maintenance 820,890 Total 2009-10 Uses 3,093,687
Anticipated Balance, June 30, 2010 3,830,483
Projected Sources - FY 2010-11
Tax Increment 3,169,750 Interest on Reserve 125,000 Total 2010-11 Sources 3,294,750
Total Anticipated Available Balance 7,125,233
Projected Uses - FY 2010-11Debt Service 1,153,410 Personnel Services and Related Overhead Costs 1,131,866 Projects, Programs and Operations & Maintenance 952,200 Total 2010-11 Uses 3,237,476
Anticipated Balance, June 30, 2011 3,887,757$
BROADWAY / MACARTHUR / SAN PABLOOperating Reserve Status
PROJECT SUMMARIES __________________________________________
B - 54

Broadway / MacArthur / San Pablo Project Area
Capital Project and Program Descriptions
The descriptions below are for the capital projects and programs within the Broadway/MacArthur/San Pablo Redevelopment Project Area, which are summarized in the beginning of this section.
PROJECT AREA-WIDE PROJECTS
Commercial Façade Improvement Program
The Commercial Façade Improvement Program provides façade grants and architectural design assistance to commercial property owners and tenants located on the commercial corridors within the project area (including Telegraph Avenue, San Pablo Avenue, West MacArthur Boulevard, and Broadway). The program offers matching grants – on a one-to-one basis – of up to $30,000 for improvements to storefronts, including new signage, window repair, and exterior painting. To date, 25 projects have been completed and 18 are in the design phase. During FY 2009-11, the program will be funded by the carry-forward from the previous program allocation. The goal for FY 2009-11 is to complete 16 new projects within the Project Area.
Commercial Tenant Improvement Program
The Tenant Improvement Program (TI) is an incentive program that offers business owners matching grants on a dollar-for-dollar basis for tenant improvements to the interiors of vacant retail spaces. The program is designed to assist property owners in attracting retail businesses to locations that are difficult and costly to renovate, and serves as an incentive for new retail businesses to locate within the Project Area. The maximum grant award for each project is based on the square footage of retail space. The program provides grants of up to $10 per square foot, with a total grant not to exceed $45,000. To date, three projects have been completed. At present there are two projects in the design/construction phase of this program. During FY 2009-11, the program will be funded by the carry-forward from the previous program allocation. The goal for FY 2009-11 is to complete four projects within the Project Area.
Neighborhood Projects Initiative (NPI) Program
The NPI program is a community grant program that funds one-time, small-scale, community-initiated physical improvement projects. The program is designed to support existing blight reduction and beautification efforts in the redevelopment project area and to encourage community participation in redevelopment. The NPI program was launched in 2006, and awarded a total of $200,000 to ten community projects. Previously funded projects include median improvements along W. MacArthur Blvd., dog-friendly water fountains at the dog-run facility in Mosswood Park, pedestrian-friendly building lights along Temescal Avenue, banners identifying the KoreaTown/Northgate neighborhood, community monitored surveillance cameras on buildings within crime “hot spots” and a planting project along Aileen Street. During FY 2009-11, $400,000 will be allocated to the program for two additional grant cycles.
__________________________________________ PROJECT SUMMARIES
B - 55

NEIGHBORHOOD IMPROVEMENTS AND INFRASTRUCTURE PROJECTS
San Pablo Pedestrian Street Lights
This project includes the installation of pedestrian-level street lights in the San Pablo Golden Gate neighborhood on San Pablo Avenue between 53rd and 67th Streets. This project has been identified as a high priority by the Broadway/MacArthur/San Pablo Redevelopment Project Area Committee in order to improve safety and pedestrian access to the Golden Gate retail district. The project budget of $1.5 million was funded by bond proceeds in FY 2007-08. Construction will begin in early July or August 2009.
MacArthur BART Station Area
3884 Martin Luther King, Jr. Way
The Agency executed a Disposition and Development Agreement in December 2006 with Cotter and Coyle, LLC to sell the Agency-owned property at 3860 Martin Luther King, Jr. Way (MLK) for $1,060,000 (fair market value) for the development of a 74-unit condominium project at 3860-3884 MLK Way. The property is located immediately west of the MacArthur BART Station. Phase I construction of 34 condominium units on the 3860 MKL property was completed in February 2009. Phase II construction of 40 additional condominium units at 3884 MLK Way will commence in 2009, and be completed in 2011.
MacArthur Transit Village
The MacArthur Transit Village project includes the development of a mixed-use transit village at the MacArthur BART Station, consisting of multi-family housing, neighborhood-serving retail, and community space. The project involves relocating the existing BART surface lot to a parking structure on the site and developing the land that is made available and on surrounding parcels. The Agency entered into a three-way Exclusive Negotiating Agreement with BART and the developer, MacArthur Transit Community Partners, LLC, in November 2004. In July 2008, the Final EIR for this project was certified and planning entitlements were approved. In 2009, the developer will enter into an Owner Participation Agreement (OPA) with the Agency, and a Developer Agreement (DA) with the City, which allow the project to vest its entitlements for an extended period to permit phased development. Throughout FY 2009-11 the Agency will work with the development team to acquire properties adjacent to the MacArthur BART station. Construction of a BART replacement garage and interior roadways is planned to commence in 2011.
PROJECT SUMMARIES __________________________________________
B - 56

OAKLAND ARMY BASE REDEVELOPMENT PROJECT AREA
__________________________________________ PROJECT SUMMARIES
B - 57

Operating Capital Operating CapitalSOURCESTax Increment 3,178,480 - 3,249,770 - Capital Funds - - - - Misc. Sources [A] 2,293,000 - 1,575,800 -
Subtotal Sources 5,471,480 - 4,825,570 -
USESPersonnel Services & Overhead 1,399,212 - 1,413,128 - Operations & Maintenance 8,796,120 - 9,351,640 - Capital Projects - - - -
Subtotal Uses 10,195,332 - 10,764,768 -
Transfer to/(from) Fund Balance (4,723,852) - (5,939,198) - Estimated Beginning Fund Balance 13,947,240 - 9,223,388 - Estimated Year-End Fund Balance 9,223,388 - 3,284,190 -
[A] Miscellaneous Sources includes interest, rental and lease income.
Oakland Army Base Project AreaFunding Sources and Uses
Fiscal Year 2009-11
FY 2009-10Adopted Budget
FY 2010-11 Adopted Budget
PROJECT SUMMARIES __________________________________________
B - 58

Background
The Oakland Army Base Redevelopment Area is comprised of the former Oakland Army Base, plus adjacent areas, totaling approximately 1,800-acres. On July 11, 2000, the Oakland City Council adopted the Oakland Army Base Redevelopment Area Plan by Ordinance No. 12259 C. M. S. The Oakland Army Base Redevelopment Area is divided into three major sub-districts: 16th & Wood Street Sub-district, the Maritime Sub-district, and the Oakland Army Base (OAB) Sub-district. Each area experienced redevelopment activity in the past fiscal cycle.
On August 7, 2006, the Oakland Redevelopment Agency took ownership of 170 acres of former Oakland Army Base land, to develop as the Gateway Development Area. An additional 220 acres was transferred to the Port of Oakland for its Port Development Area. These actions fulfilled the August 7, 2003 Economic Development Conveyance Agreement with the U.S. Army, of former Oakland Army Base property to the Oakland Base Reuse Authority on behalf of the City of Oakland, the Oakland Redevelopment Agency and the Port of Oakland. Redevelopment of the former Army Base property (including both the Redevelopment Agency and the Port land) is expected to generate 8,000 new jobs, hundreds of millions of dollars of private investment, major expansion opportunities for the Port of Oakland, a mixed-use commercial development along the waterfront, a new waterfront park and other community benefits.
Currently, the Redevelopment Agency is underway with a master developer selection process for 108 acres of the Gateway Development Area. In addition, the Agency is negotiating a Lease Disposition and Development Agreement (LDDA) with Oakland Maritime Support Services (OMSS) to develop and operate a maritime trucking services center on 15 acres of the East Gateway Development Area in fulfillment of the Bay Conservation and Development Commission (BCDC) requirement that the Agency and Port each provide at least 15 acres of ancillary maritime support services on the former army base.
The City, Redevelopment Agency and Port are working collaboratively on a number of joint requirements, which include environmental remediation, operation of a joint utility program, planning for infrastructure improvements, and fulfillment of mitigation measures stipulated in the Mitigation Monitoring and Reporting Program (MMRP) of the 2002 Oakland Army Base Redevelopment Area Plan Environmental Impact Report.
The first phases of a private mixed-use residential, commercial, and civic use project are being developed on a 29.2-acre site in the 16th & Wood Street Sub-district. The project sponsors will construct 1,570 residential units, renovate the historic 16th Street Train Station, and develop commercial/retail and public open spaces. The project was approved in June 2005. An important aspect of this project is the restoration and re-use of the historic Train Station at 16th and Wood Streets.
Highlights
Accomplishments in FY 2007-09 included:
• Selected Oakland Maritime Support Services as developer and operator of 15-acre ancillary maritime support services facility within the East Gateway Area.
• Completed major part of Remedial Action Plan (RAP) environmental cleanup and reporting under $13 million Environmental Services Cooperative Agreement (ESCA) between the Agency, the Port of Oakland, the Army, the State Department of Toxic Substances Control (DTSC) and the Regional Water Quality Control Board (RWQCB) to implement the Remedial Action Plan/Risk Management Plan (RAP/RMP) and related environmental remediation activities in order to clean up contamination on the former Army Base property.
• Planned major infrastructure and traffic improvements funded by a $2,400,000 grant from the Economic Development Administration.
• Monitored deconstruction of Building 802 to determine best management practices for deconstruction projects going forward under a joint program with the Port to fulfill Cultural Resources mitigation measures required by Environmental Impact Report.
• Negotiated extension of Caltrans temporary construction easement and access easement for the Bay Bridge construction project.
• Made final installment payment on $8,200,000 purchase of 19-acre former Army Reserve "Subaru Lot" to expand North Gateway Development Area.
__________________________________________ PROJECT SUMMARIES
B - 59

• Conducted land use studies and market analyses for development alternatives that helped guide the master developer selection process.
• Initiated master developer selection process for majority of Gateway Development Area. • Obtained City Council approval of Preferred Development Scenario for Gateway Development Area that
includes local industry clusters: Oakland Film & Media Center and Oakland Produce Market. • Negotiated a tentative agreement with Caltrans for a land exchange to obtain valuable development property
that will expand the Agency's Central Gateway Development Area. • Began multi-agency planning process for the open space amenities at and adjacent to the Bay Bridge open
space that will be developed by Caltrans, the East Bay Regional Parks District, and the Oakland Redevelopment Agency.
• Started phase-out of interim leasing program to vacate area for development. • Commenced construction on two housing projects within the Wood Street Zoning District. • Set aside $616,000 to purchase historic baggage wing of 16th Street Train Station. • Approved $400,000 loan for feasibility study on train station restoration. • Supported formation of nonprofit Train Station Entity. called the Restoration Association for Improving the
Landmark 16th Street Station (RAILS). to oversee restoration project.
Plans for FY 2009-11
Adopted funding for FY 2009-11 is approximately $21.14, counting tax increment and lease revenues. Action plans for FY 2009-11 include the following:
• Implementation of joint deconstruction program with the Port of Oakland to allow for construction. • Construction and operations of OMSS ancillary maritime support services project. • Negotiation and signing of an exclusive negotiation agreement (ENA) with an Army Base Master
Development team to advance the development of the project site. • Performance of all required California Environmental Quality Act (CEQA) as may be required for development
of specific projects. • Planning, design and construction of major public infrastructure improvement projects, and raising of grant,
state bond and federal stimulus funds. • Completion of land use planning and initiation of development agreements for remainder of Gateway areas
not included in Master Developer RFP area. • Completion of predevelopment site preparation, including filling and grading in the Central Gateway
Development Area. • Resolution of issues with adjacent land owners, including CEQA issues with EBMUD. • Implementation of EIR mitigation measures, including development Fair Share Costs, City/Agency/Port
Deconstruction Fair Share Cost Agreement, and cultural resources preservation. • Completion of Phase 2 of the State Lands Commission Public Trust exchange. • Establishment of joint remediation account and program with the Port of Oakland to complete environmental
cleanup. • Preparation of close-out of Economic Development Conveyance Reinvestment Audit and Reporting to U.S.
Army. • Coordination with RAILS to approve development, finance, management, business and community outreach
plans for the redevelopment of the Train Station, including fund development for Train Station construction.
PROJECT SUMMARIES __________________________________________
B - 60

Anticipated Balance, June 30, 2009 13,947,240$
Projected Sources - FY 2009-10
Tax Increment 3,178,480 Interest on Reserve 500,000 Rental Income 1,793,000 Total 2009-10 Sources 5,471,480
Total Anticipated Available Balance 19,418,720
Projected Uses - FY 2009-10
Personnel Services and Related Overhead Costs 1,399,212 Projects, Programs and Operations & Maintenance 8,796,120 Total 2009-10 Uses 10,195,332
Anticipated Balance, June 30, 2010 9,223,388
Projected Sources - FY 2010-11
Tax Increment 3,249,770 Interest on Reserve 500,000 Rental Income 1,075,800 Total 2010-11 Sources 4,825,570
Total Anticipated Available Balance 14,048,958
Projected Uses - FY 2010-11
Personnel Services and Related Overhead Costs 1,413,128 Projects, Programs and Operations & Maintenance 9,351,640 Total 2010-11 Uses 10,764,768
Anticipated Balance, June 30, 2011 3,284,190$
OAKLAND ARMY BASEOperating Reserve Status
__________________________________________ PROJECT SUMMARIES
B - 61

NOTES
PROJECT SUMMARIES __________________________________________
B - 62

CENTRAL CITY EAST REDEVELOPMENT PROJECT AREA
__________________________________________ PROJECT SUMMARIES
B - 63

Operating Capital Operating CapitalSOURCESTax Increment 11,824,320 - 12,089,490 - Capital Funds - 560,000 - - Misc. Sources [A] 475,000 - 483,000 -
Subtotal Sources 12,299,320 560,000 12,572,490 -
USESPersonnel Services & Overhead 4,048,269 - 4,005,705 - Operations & Maintenance 3,248,420 - 3,541,730 - Capital Projects 560,000 1,860,000 - - Tax Increment Debt 5,122,570 - 5,123,760 - Other Debt - - - -
Subtotal Uses 12,979,259 1,860,000 12,671,195 -
Transfer to/(from) Fund Balance (679,939) (1,300,000) (98,705) - Estimated Beginning Fund Balance 12,921,890 1,538,650 12,241,951 238,650
Estimated Year-End Fund Balance 12,241,951 238,650 12,143,246 238,650
[A] Miscellaneous Sources include interest and rental income.
Central City East Project AreaFunding Sources and Uses
Fiscal Year 2009-11
FY 2009-10Adopted Budget
FY 2010-11 Adopted Budget
PROJECT SUMMARIES __________________________________________
B - 64

Background
The Central City East (CCE) Redevelopment Area contains portions of the Eastlake, Fruitvale, Central East Oakland, and the Elmhurst neighborhoods that make up central and eastern Oakland. The CCE Redevelopment Area begins at the southern border of Downtown and extends east to Durant Street, covering 3,339 acres. The goal of the Central City East (CCE) Redevelopment Plan is to revitalize the waterfront, commercial, and residential areas in the CCE Project Area by eliminating blight, improving the physical and economic environment, and addressing the affordable housing goals of the CCE Project Area. These efforts are guided by the CCE Project Area Committee (PAC), an advisory body to the Agency. The CCE Redevelopment area was adopted on July 29, 2003 and the second Five-Year (2008-2013) Implementation Plan for the CCE Project Area was adopted in June 2008. The CCE Implementation Plan includes eight major commercial streetscape improvement projects, a Façade Improvement Program, a Tenant Improvement Program, an Opportunity Sites Program that targets the redevelopment of key parcels within transit commercial corridors, and a Homeownership Rehabilitation Program. The following activities have also been identified as high priorities for the area: a Public Safety Program; Infill Development Incentive Program; Neighborhood Program Initiative; Tough on Blight Program; Sustainability Program; and working with Rebuilding Together Oakland (RTO) program. Highlights
Major accomplishments in FY 2007-09 in the Central City East Project Area include the following:
• Completed 35% to 65% design phases for seven streetscape projects including MacArthur Boulevard, 23rd Avenue, Foothill/Fruitvale, 14th Avenue, East 18th Street, Foothill/High/Melrose, and Fruitvale Alive Project.
• Completed 14 Façade Improvement Projects and 5 Tenant Improvement Projects that impacted the commercial corridors.
• Purchased seven key opportunity properties as part of the CCE Opportunity Sites Program, which identified sites for potential development in the area, including 2777 Foothill Boulevard, Seminary and Foothill Boulevard sites, 73rd and Foothill Boulevard, and the property for the Fire Station at 1700 50th Avenue.
• Completed purchase of property for new Fire Station #18 and began construction documents for the Fire Station.
• The first phase of development for the upgrades of community facilities including three libraries (Melrose, Eastmont, and Bancroft), two parks (Cesar Chavez and Josie de la Cruz), and a swimming pool (Fremont Pool).
• CCE Affordable housing funds were provided for three Affordable housing developments called the Orchards (65 units of senior housing), Posada de Colores (infrastructure improvements to the property with 100 units of senior housing), and Foothill Plaza Apartments (rehabilitation of 54 units of rental housing).
• Other infrastructure improvements included: funding the MacArthur Boulevard Undergrounding project; stabilization of a hillside and demolition of blighted properties on Wallace Street, and demolition of the blighted property at 2777 Foothill Boulevard.
__________________________________________ PROJECT SUMMARIES
B - 65

Plans for FY 2009-11
Adopted funding for FY 2009-11 is $14.9 million. The Agency will continue to work with the CCE PAC to further develop a shared vision for each of the four sub-areas and planning around identified major areas of focus. The CCE Series 2006A Bonds were issued to finance various redevelopment activities to benefit the Central City East Project Area. These bonds, issued as taxable ($61.5 million) and tax-exempt bonds ($14.1 million) were issued in 2006 and approximately $68.3 million remains to fund projects and programs. The taxable bonds are being used to encourage private development including property acquisition, retail recruitment, and direct development assistance and the tax-exempt bonds are being used to fund public infrastructure projects, including streetscape design and construction projects, park renovation, and library facility upgrades.
The Agency will also focus on the implementation and construction of the various streetscape projects in the Central City East area. The locations are: • MacArthur Boulevard between 72nd and 82nd Avenues and between 106th and the City of San Leandro border
• 23rd Avenue between East 12th Street and Foothill Boulevard
• Foothill Boulevard between Rutherford Street and High Street
• Foothill Boulevard and Seminary Avenue
• East 18th Street
• Melrose & Bancroft
• 14th Avenue between East 10th and East 19th Streets
• Fruitvale Alive Project from Farnam to Logan Avenue.
The Agency will continue working on the Facade Improvement Program, the Tenant Improvement Program, the purchase of key Opportunity Sites along commercial corridors in the CCE area, planning for focus areas, the implementation of a Commercial Security Program, the Neighborhood Project Initiative Program, Tough on Blight Program, and the upgrading of Community facilities including the three libraries, two parks and Fire Station #18. The Agency will continue working on the two year process, in partnership with BART and Peralta Community College, on the development of a Specific Plan for the Lake Merritt BART station. The Agency will target key sites for development and renovation throughout the CCE Project Area.
PROJECT SUMMARIES __________________________________________
B - 66

Anticipated Balance, June 30, 2009 12,921,890$
Projected Sources - FY 2009-10
Tax Increment 11,824,320 Interest on Reserve 475,000 Total 2009-10 Sources 12,299,320
Total Anticipated Available Balance 25,221,210
Projected Uses - FY 2009-10Debt Service 5,122,570 Personnel Services and Related Overhead Costs 4,048,269 Projects, Programs and Operations & Maintenance 3,248,420 Transfer to Capital Funds 560,000 Total 2009-10 Uses 12,979,259
Anticipated Balance, June 30, 2010 12,241,951
Projected Sources - FY 2010-11
Tax Increment 12,089,490 Interest on Reserve 483,000 Total 2010-11 Sources 12,572,490
Total Anticipated Available Balance 24,814,441
Projected Uses - FY 2010-11Debt Service 5,123,760 Personnel Services and Related Overhead Costs 4,005,705 Projects, Programs and Operations & Maintenance 3,541,730 Total 2010-11 Uses 12,671,195
Anticipated Balance, June 30, 2011 12,143,246$
CENTRAL CITY EASTOperating Reserve Status
__________________________________________ PROJECT SUMMARIES
B - 67

Anticipated Balance, June 30, 2009 1,538,650$
Projected Sources - FY 2009-10Transfer From Operating Funds 560,000 Total 2009-10 Sources 560,000
Total Anticipated Available Balance 2,098,650
Projected Uses - FY 2009-10Projects, Programs and Operations & Maintenance
Streetscape Improvement Program East 18th Street 600,000 Streetscape Improvement Program MacArthur Blvd 500,000 Streetscape Improvement Program Sunshine Court 350,000 Streetscape Improvement Program Fruitvale Alive 410,000 Streetscape Improvement Program East 18th Street
Total 2009-10 Uses 1,860,000
Anticipated Balance, June 30, 2010 238,650
Projected Sources - FY 2010-11Total 2010-11 Sources -
Total Anticipated Available Balance 238,650
Projected Uses - FY 2010-11Projects, Programs and Operations & Maintenance - Total 2010-11 Uses -
Anticipated Balance, June 30, 2011 238,650$
CENTRAL CITY EAST CAPITAL SPENDINGStatus of Funds
PROJECT SUMMARIES __________________________________________
B - 68

Central City East Project Area Capital Project and Program Descriptions
The descriptions below are for the capital projects and programs within the Central City East Project Area
PROJECT AREA-WIDE PROJECTS
Commercial Façade Improvement Program
The Central City East Façade Improvement Program offers business and property owners in target areas matching grants of up to $30,000 for approved exterior renovations to commercial and mixed-use properties, as well as free architectural assistance. The maximum amount of the grant depends on the size of the property. The program offers matching grants on a one-to-one basis for improvements to storefronts including new signage, window repair, and exterior painting. Commercial Tenant Improvement Program
The Central City East Tenant Improvement Program offers up to $45,000 per vacant storefront, and up to $5,000 per property for design services for tenant improvements to commercial properties in the CCE Redevelopment Area. The Tenant Improvement Program is an incentive program that offers business owners matching grants on a dollar-for-dollar basis for tenant improvements to the interiors of vacant retail spaces. The program is designed to assist property owners in attracting retail businesses to locations that are difficult and costly to renovate, and serves as an incentive for new retail businesses to locate within the Project Area.
Rebuilding Together Oakland
Rebuilding Together Oakland uses volunteer labor and leverages financial and in-kind donations to rehabilitate the homes of low-income elderly and disabled homeowners at no cost to the homeowners, so that they may live in safety, comfort and independence. Rebuilding Together Oakland also rehabilitates non-profit community facilities that work directly within low-income communities. For FY 2009-11, $50,000 will be allocated each year to this program.
Sustainability Program
This program will provide grants for projects that address sustainability in the CCE area that ensure both the long-term economic health and the environmental quality of residents and the community in the CCE Project Area. The CCE Program will coordinate its services with existing City, County, State, and other services focused on sustainable development. This grant will augment the existing Façade and Tenant Improvement Programs and provide grants to property owners that want to upgrade their property to green building standards and grants to property owners to address blighted properties by upgrading with hardscape/landscape, fencing and other sustainable improvements. For FY 2009-11, $100,000 will be allocated each year to this program.
Neighborhood Project Initiative
The Neighborhood Project Initiative (NPI) is intended to further blight reduction and beautification efforts in redevelopment areas through the funding of small-scale, community-initiated public/private improvement and infrastructure projects that currently have no other funding source. For FY 2009-11, $160,000 will be allocated each year to this program.
__________________________________________ PROJECT SUMMARIES
B - 69

Tough on Blight Program
This program is an enhanced blight enforcement operation that aggressively pursues blighted properties and blighting conditions within the Central City East Project Area in cooperation with the Building Services Division. For FY 2009-11, $75,000 will be allocated each year to this program.
Commercial Revolving Loan Program
The Central City East Commercial Revolving Loan Program will be available for eligible candidates interested in capital improvement loans to rehabilitate, develop or build commercial property within the Central City East Redevelopment Project Area. The program will be administered by the Oakland Business Development Corporation with maximum loan amounts not to exceed $250,000.
Infill Development Incentives Program
This program offers developers and property owners up to $15,000 in matching funds for predevelopment analysis. The program is intended to encourage the exploration of residential and nonresidential development options for infill areas in the Central City East Redevelopment Project Area. Major corridors will be a focus of the program. In FY 2009-11, $100,000 will be allocated each year to this program.
Public Safety Program
The Central City East (CCE) area, in coordination with the Coliseum redevelopment area, is committed to public safety along commercial corridors in the two project areas. $125,000 of CCE area funds are budgeted in FY2009-10 and another $125,000 for FY 2010-11.
Opportunity Sites Program and Infill Development
The purpose of the Opportunity Sites Program is to address the re-use and development of blighted underutilized properties in the Central City East Redevelopment Project Area. The acquisition of these properties will benefit the Central City East Redevelopment Project Area by creating future development opportunities to better serve area residents and businesses and improve physical conditions in the Central City East Redevelopment Project Area. Agency staff worked to identify a list of blighted and/or vacant sites within the Redevelopment Area that would be targeted for development. Staff created a substantial list of 40 sites varying in size, location, number of parcels, etc., and identified them as CCE Opportunity Sites. Seven key opportunity sites for development were purchased in FY 2007-09. In FY 2009-11 staff plans to purchase additional key sites for development.
STREETSCAPE IMPROVEMENTS AND INFRASTRUCTURE PROJECTS
Central City East has eight major Streetscape Projects in various stages of development. The CCE bonds will be used to implement streetscape projects that are ready for construction in FY 2009-11.
MacArthur Boulevard
This streetscape project is on MacArthur Boulevard from 72nd Avenue to 82nd Avenue and 106th Avenue to the City of San Leandro border. Undergrounding of the utilities is in progress. The design intent is to create an environment for economic revitalization, enhance the appearance and identity of the area and improve public safety by creating a safe pedestrian environment and traffic calming. The underground construction work began in December of 2005. Once the underground work is completed the streetscape component (above ground work) will begin. Both the streetscape and undergrounding are scheduled to be completed by late 2011.
PROJECT SUMMARIES __________________________________________
B - 70

23rd Avenue
The project area includes 23rd Avenue between East 12th Street and Foothill Boulevard. PGA design, a landscape architectural firm, completed the 35 percent engineering and design documents. Design and Engineering staff will complete 100% construction documents by the fall of 2009. The Agency held several community meetings working with the Lower San Antonio group and the 23rd Avenue Collaborative on the final design for this streetscape.
Foothill/Fruitvale
This project area is located on Foothill Boulevard from Sausal Creek/Rutherford Street to High Street. The firm of Community, Design, & Environment/Wolfe Mason was selected to lead the approximate nine-month project planning and design phases which includes three community workshops. The 35% documents were completed in 2008. In FY 2009-11, 100% documents will be completed.
Foothill/Seminary
This project has a proposed area that is located on Foothill Boulevard from Mason Street to 60th Avenue, and on Seminary Avenue from Bancroft Avenue to Kingsley Circle. The design and engineering documents for the project were completed in February 2006. A survey of conditions and the next phase of design documents, as well as a master plan and engineering documents, will be completed in FY 2009-11.
14th Avenue
The project area is located on 14th Avenue between East 8th Street and East 19th Street and on East 12th Street between 14th and 16th Avenues. In FY 2009-11, the first phase of the project will be targeted for construction from International Boulevard to East 19th Street.
East 18th Street
The streetscape improvements are located in the Parkway Theatre district on the east side of Lake Merritt. CCE staff is partnering with Measure DD staff to link this area to the improvement projects at Lake Merritt and Athol Park. In FY 2009-11, the project will be targeted for construction.
Foothill/High/Melrose This project area includes two separate nodes. The first node has a proposed area that is located on Foothill Boulevard from 42nd Avenue to 45th Avenue and on High Street from Bancroft Avenue to Ygnacio Avenue. The second node is located on Foothill Boulevard from Congress Avenue to Cole Street, on Bancroft Avenue from Fairfax to Cole Street, and on Fairfax Avenue from Foothill Boulevard to Bancroft Avenue. The 35% design and engineering documents will be completed for the two nodes, and a conceptual design that connects the two areas will be completed along Foothill Boulevard from 45th Avenue to Fairfax Avenue, in FY 2009-11.
5th Avenue
The proposed project area will include 5th Avenue from East 18th Street to the Embarcadero, on East 12th Street from 2nd to 5th Avenue, and on International Boulevard from 2nd to 5th Avenue.
__________________________________________ PROJECT SUMMARIES
B - 71

Fruitvale Alive
The project area is along Fruitvale Avenue between East 12th Street and Coloma Street with the portion in the Central City East area from Farnam to Logan Avenue. The plans call for pedestrian safety, traffic calming and street/sidewalk amenities to improve the inter-modal usage, commercial viability of existing shopping nodes and the walk ability of the corridor. This project will be targeted for construction in the FY 2009-11 timeframe.
Sunshine Court
Sunshine Court is a severely unimproved street that falls within the Central City East (CCE) and Coliseum Redevelopment Areas. It runs between 74th and 76th Avenue, beginning at an intersection with International Boulevard before making a southeasterly turn to terminate at 76th Avenue. Redevelopment funds will be used to improve the blighted, damaged and unsafe condition of Sunshine Court. The Oakland Redevelopment Agency and the City of Oakland are in the process of acquiring the road. Improvements to the road will be necessary before it can be dedicated to the City.
AreaFY 2008-09 Estimated
Carryforward
ReprogramFY 2008-09
Carryforward
FY 2009-10 Adopted
Allocation
FY 2010-11 Adopted
Allocation
Adopted Total
FY 2009-11 Streetscape, Facilities and Infrastructure Projects
Central City East Land Acquisition $46,000,000 $0 $0 $0 $46,000,000Fire Station 18 8,000,000 - - - 8,000,000 Streetscape Improvement Program East 18th Street - - 100,000 - 100,000 MacArthur Blvd - - 500,000 - 500,000 Sunshine Court - - 350,000 - 350,000 Fruitvale Alive - - 110,000 - 110,000 East 18th Street - - 500,000 - 500,000 23rd Avenue 3,000,000 - - - 3,000,000 Foothill Fruitvale 4,000,000 - - - 4,000,000 Foothill Seminary 3,126,000 - - - 3,126,000 Eastlake 14th Ave. 1,000,000 - - - 1,000,000 East 18th Street 1,500,000 - - - 1,500,000 Fruitvale Alive - - 300,000 - 300,000
GRAND TOTAL $66,626,000 $0 $1,860,000 $0 $68,486,000
Central City East Project AreaCapital Spending Plan
PROJECT SUMMARIES __________________________________________
B - 72

WEST OAKLAND REDEVELOPMENT PROJECT AREA
__________________________________________ PROJECT SUMMARIES
B - 73

Operating Capital Operating CapitalSOURCESTax Increment 4,531,120 - 4,608,210 - Capital Funds - - - - Misc. Sources [A] 110,280 - 120,290 -
Subtotal Sources 4,641,400 - 4,728,500 -
USESPersonnel Services & Overhead 1,792,700 - 1,802,883 - Operations & Maintenance 2,788,580 - 2,850,920 - Capital Projects - - - - Tax Increment Debt - - - - Other Debt 13,450 - 13,450 -
Subtotal Uses 4,594,730 - 4,667,253 -
Transfer to/(from) Fund Balance 46,670 - 61,247 - Estimated Beginning Fund Balance 4,778,710 - 4,825,380 - Estimated Year-End Fund Balance 4,825,380 - 4,886,627 -
[A] Miscellaneous Sources include interest and rental income.
West Oakland Project AreaFunding Sources and Uses
Fiscal Year 2009-11
FY 2009-10Adopted Budget
FY 2010-11 Adopted Budget
PROJECT SUMMARIES __________________________________________
B - 74

Background
The West Oakland Redevelopment Project was adopted on November 18, 2003. This is the fourth and newest of the four redevelopment areas in West Oakland. The West Oakland Redevelopment Project Area comprises 565 acres and is divided into the three sub areas. The sub-areas are Prescott/South Prescott, Clawson/McClymonds/Bunche and West MacArthur/Hoover. The 2008-2013 Five-Year Implementation Plan contains goals and objectives that will aid in the elimination of blighted conditions in the Project Area through planning, redesign, reconstruction and rehabilitation.
The City Council adopted Resolution No. 76841 C.M.S. in 2001, authorizing the formation of the West Oakland Project Area Committee (WOPAC), which advises the City Council on redevelopment activities throughout the Project Area. The WOPAC has met monthly since its inception, and has also met in subcommittees to address specific issues.
Highlights
Accomplishments in FY 2007-09 included:
• WOPAC approval of a tenant improvement grant of $75,000 for the Brown Sugar Kitchen restaurant.
• WOPAC continued support for façade improvement and tenant improvement programs with $75,000 for design funding and $250,000 for grants.
• Completion of 7 Façade Improvement and 1 Tenant Improvement projects.
• WOPAC approval of a tenant improvement grant of $200,000 for the future Mandela Foods Market.
• WOPAC outreach activities such as annual picnics, forums and newsletters.
• WOPAC approval of funding of the local match for a MTC grant for the construction of the Seventh Street Streetscape Project.
• WOPAC approval of $200,000 for security cameras.
• WOPAC approval of a $100,000 grant for the development of Fitzgerald Park Community Farm.
• WOPAC approval and completion of $1,574,910 for Phase I of Raimondi Park improvements.
• WOPAC approval or $200,000 and development of a Neighborhood Project Initiative Program.
• WOPAC approval of a $100,000 construction job training grant to the Alliance for West Oakland Development.
• WOPAC approval and completion of a $45,000 graffiti abatement program.
• WOPAC approval of a $25,000 illegal encampment program.
• WOPAC review of several privately funded development projects in the Project Area.
• Coordination of development activities related to the West Oakland Transit Village Plan around the West Oakland BART station.
• Support of development projects in the West Oakland Transit Village Project Area for grant funding.
__________________________________________ PROJECT SUMMARIES
B - 75

Plans for FY 2009-11 Adopted funding for FY 2007-09 is $9.1 million (two-year total). Plans include:
• Ongoing coordination of WOPAC activities.
• Continued WOPAC outreach activities such as annual picnics, forums and newsletters.
• Streetscape project on Martin Luther King Jr Way.
• Streetscape project on Peralta Street.
• Completion of Phase One of the 7th Street Streetscape Project.
• Completion of the Alliance for West Oakland’s Construction Job Training Grant.
• Completion of 4 Façade Improvement Projects and 2 Tenant Improvement Projects.
• Completion of the Brown Sugar Kitchen Tenant Improvement Grant.
• Completion of the Mandela Foods Tenant Improvement Grant.
• Implementation of the Neighborhood Project Initiative Program.
• Completion of Fitzgerald Park Community Farm.
• Completion of the Security Camera Project.
PROJECT SUMMARIES __________________________________________
B - 76

Anticipated Balance, June 30, 2009 4,778,710$
Projected Sources - FY 2009-10
Tax Increment 4,531,120 Interest on Reserve 110,280 Total 2009-10 Sources 4,641,400
Total Anticipated Available Balance 9,420,110
Projected Uses - FY 2009-10Debt Service 13,450 Personnel Services and Related Overhead Costs 1,792,700 Projects, Programs and Operations & Maintenance 2,788,580 Total 2009-10 Uses 4,594,730
Anticipated Balance, June 30, 2010 4,825,380
Projected Sources - FY 2010-11
Tax Increment 4,608,210 Interest on Reserve 120,290 Total 2010-11 Sources 4,728,500
Total Anticipated Available Balance 9,553,880
Projected Uses - FY 2010-11Debt Service 13,450 Personnel Services and Related Overhead Costs 1,802,883 Projects, Programs and Operations & Maintenance 2,850,920 Total 2010-11 Uses 4,667,253
Anticipated Balance, June 30, 2011 4,886,627$
WEST OAKLANDOperating Reserve Status
__________________________________________ PROJECT SUMMARIES
B - 77

NOTES
PROJECT SUMMARIES __________________________________________
B - 78

OAK KNOLL REDEVELOPMENT PROJECT AREA
__________________________________________ PROJECT SUMMARIES
B - 79

Operating Capital Operating CapitalSOURCESTax Increment 461,040 - 467,380 -
Subtotal Sources 461,040 - 467,380 -
USESPersonnel Services & Overhead 344,068 - 348,298 - Operations & Maintenance 710 - 710 - Capital Projects - - - - Tax Increment Debt - - - - Other Debt - - - -
Subtotal Uses 344,778 - 349,008 -
Transfer to/(from) Fund Balance 116,262 - 118,372 - Estimated Beginning Fund Balance (118,090) - (1,828) - Estimated Year-End Fund Balance (1,828) - 116,544 -
Oak Knoll Project AreaFunding Sources and Uses
Fiscal Year 2009-11
FY 2009-10Adopted Budget
FY 2010-11 Adopted Budget
PROJECT SUMMARIES __________________________________________
B - 80

Background The Oak Knoll Redevelopment Area spans roughly 183 acres of hillside property north of Highway 580 between Keller Avenue and Golf Links Road. The former Naval Hospital was decommissioned in 1996 and was designated as a Redevelopment Area that same year. Following several efforts to convey the property, the Department of the Navy sold 167 acres of Oak Knoll to SunCal Oak Knoll, LLC for $100.5 million. The remainder of the land was conveyed to Seneca Center, Sea West Credit Union and the Redevelopment Agency, which owns 5.45 acres on the site. Highlights City and Agency staff worked extensively with the developer, SunCal Companies, on the master planning process for a community of 960 housing units of various types and sizes. The site was to also include more than 80,000 square feet for commercial retail, a refurbished mission style club house for community uses, a restored and day-lighted creek, trails, parks and playfields. Planning has reached the point where SunCal commenced abatement on more than 90 buildings on the site, including the 11-story hospital. Staff has assembled a team of consultants to begin the formation process for a Community Facilities District. The terms for the sale of the Agency’s property at market rate were finalized, and the conditions of an Owner Participation Agreement are being completed. The project had been before the Planning Commission several times and is slated to return to the Planning Commission and City Council for final approvals in the first half of 2009. Currently the project is on hold due to SunCal Oak Knoll, LLC’s bankruptcy hearings. Plans for FY 2009-11 Adopted funding for FY 2009-11 is $0.93 million. Staff will continue to work with the Fire Services Agency and Building Services on blight and safety related issues. Staff will also continue to gather information and present options for how the Agency can assist in the resumption of development activities on the site, which is currently tied up in bankruptcy court.
__________________________________________ PROJECT SUMMARIES
B - 81

Anticipated Balance, June 30, 2009 (118,090)$
Projected Sources - FY 2009-10
Tax Increment 461,040 Total 2009-10 Sources 461,040
Total Anticipated Available Balance 342,950
Projected Uses - FY 2009-10Debt ServicePersonnel Services and Related Overhead Costs 344,068 Projects, Programs and Operations & Maintenance 710 Total 2009-10 Uses 344,778
Anticipated Balance, June 30, 2010 (1,828)
Projected Sources - FY 2010-11
Tax Increment 467,380 Total 2010-11 Sources 467,380
Total Anticipated Available Balance 465,552
Projected Uses - FY 2010-11Personnel Services and Related Overhead Costs 348,298 Projects, Programs and Operations & Maintenance 710 Total 2010-11 Uses 349,008
Anticipated Balance, June 30, 2011 116,544$
OAK KNOLLOperating Reserve Status
PROJECT SUMMARIES __________________________________________
B - 82

HOUSING PROGRAMS

_________________________________________________ HOUSING PROGRAM
Operating Capital Operating CapitalSOURCESTax Increment 33,448,250 - 34,501,080 Capital Funds - - - - Interfund Transfer [A] (323,358) - (246,975) - Misc. Sources [B] 350,000 - 350,000 -
Subtotal Sources 33,474,892 - 34,604,105 -
USESPersonnel Services & Overhead 6,920,771 - 7,046,001 - Operations & Maintenance 19,048,011 - 20,056,684 - Capital Projects - - - - Tax Increment Debt - - - - Other Debt 7,506,110 - 7,501,420 -
Subtotal Uses 33,474,892 - 34,604,105 -
Transfer to/(from) Fund Balance - - - - Estimated Beginning Fund Balance - - - - Estimated Year-End Fund Balance - - - -
[B] Miscellaneous Sources include interest and rental income.
[A] Includes a transfer of $350,000 in each fiscal year to Central District for acquisition of the Henry J. Robinson Multi-Service Center; and $26,642 in FY 2009-10 and $103,025 in FY 2010-11 from Stanford / Adeline for development of affordable housing.
Low-Moderate Income Housing
Funding Sources and UsesFiscal Year 2009-11
FY 2009-10Adopted Budget
FY 2010-11 Adopted Budget
C - 1

HOUSING PROGRAM _________________________________________________
Low and Moderate Income Housing Projects
Background Beginning in FY 1988-89, the Agency, in accordance with State law, commenced setting aside in a separate fund, 20 percent of all tax increments received for the development of low to moderate income housing throughout the City. Beginning in FY 2002-03, the Agency increased that amount to 25 percent pursuant to Agency Resolution 01-85 adopted on December 11, 2001. The Agency’s low and moderate income housing program consists of the use of the set aside funds for various housing projects and programs which provide for preservation and construction of adequate housing and expansion of first-time homeownership opportunities.
Highlights During FY 2007-09, the Agency used Low and Moderate Income Housing Funds, including proceeds of an Agency affordable housing bond issued in FY 2005-06 for affordable housing activities. Over $53 million in ORA money, sometimes in conjunction with other local funds, was committed to develop or preserve 1,276 affordable housing units. Using Agency financing, 219 units completed construction. As of early 2009, nearly 1,300 units of Agency-financed affordable housing were either in predevelopment or under construction (see table at end of this section). The Mortgage Assistance Program provided approximately $9.7 million in financial assistance to approximately 139 home buyers and provided homeownership counseling and education to over 1,000 citizens. An additional $5.6 million was committed to assist low to moderate income households purchase market-rate units in the Wood Street development. A total of $600,000 was reserved for development of permanent supportive housing, $843,000 was provided for tenant assistance for residents properties owned by Oakland Community Housing, Inc. (OCHI), and $500,000 was provided for operating subsidies for existing OCHI-owned properties.
Plans for FY 2009-11 Adopted funding in FY 2009-11 is $68.08 of which $15.01 is dedicated to debt service payments for the 2000 and 2006 Housing Set Aside Bonds and partial payment of Central District bonds for the Henry J Robinson transitional housing facility for the homeless. The Adopted Budget includes payments of $2.6 million (FY 2009-10) and $2.7 million (FY 2010-11) for the Low and Moderate Income Housing Fund’s “share” of the projected ERAF payment. However, because this is not an eligible use of Low and Moderate Income Housing Funds, the Agency must reduce the voluntary 5% contribution in each year by an amount sufficient to cover these payments, so that the ERAF payments are paid from “non-housing” funds. This will require that the Agency make an exception to the provisions of Agency Resolution 01-85 that require deposits of 25 percent of gross tax increment proceeds to the Low and Moderate Income Housing Fund. A total of $5 million in funding for the Mortgage Assistance Program will be provided from the Low and Moderate Housing fund in order to make 70 homes affordable to new homeowners. Additional funding for homebuyer assistance will become available to the extent that existing homebuyer loans are repaid during this period. A total of $28.1 million will be available for (a) the City-wide NOFA for housing development, (b) operations support (mortgage payments) for the East Oakland Community Project transitional housing facility, and (c) various housing programs identified in the Five-Year Implementation Plans for the Central City East and West Oakland Project Areas. A portion of these funds may be used to support the issuance of bonds to finance the affordable housing components of the Wood Street, Oak to Ninth and MacArthur BART housing developments. The Redevelopment Plans for the West Oakland and Central City East Project Areas restrict the use of low and moderate income housing funds generated from those areas to activities located in those areas, including development, rehabilitation and homebuyer assistance.
C - 2

_________________________________________________ HOUSING PROGRAM
Low and Moderate Income Housing Projects
Property Name Property Address Units Type Funds 1574-1590 7th Street (7th and Peralta) 1574-1590 7th Street 5 Homeownership $127,327 3701 MLK Jr. (Site Acq) 3701 MLK Jr. TBD Homeownership 109,909 720 E. 11th Street Project 720 E. 11th Street 55 Families 4,859,833 Altenheim Phase II 1720 MacArthur 81 Senior 1,753,000 Byron Ave Homes (10211 Byron--Site Acq) 10211 Byron 10 Homeownership 386,550 Edes Avenue Homes, Phase B 10800 Edes Avenue 25 Homeownership 3,601,000 Emancipation Village 3800 Coolidge Avenue 37 Special Use 1,652,000 Fairmount Apartments 401 Fairmount Avenue 31 Families 3,400,000 Faith Housing 1662 7th Street TBD Homeownership 689,598 Foothill Plaza Apartments 6311 Foothill Blvd 54 Families 2,910,000 Fox Courts 1807-1829 Telegraph
Avenue80 Families 4,950,000
Harrison Senior 1644 Harrison St & 321 17th Street
74 Senior 5,133,000
Hills Elmhurst Plaza Senior Housing 9415-9437 International Blvd
64 Senior 7,128,222
Ironhorse at Central Station 14th Street at Wood Street 99 Families 8,379,000
Jack London Gateway Senior 900 Market Street 55 Senior 4,900,000 Lion Creek Crossing-Rental Phase III 928-998 66th Avenue 59 Families 3,000,000 Lion Creek Crossing-Rental Phase IV 66th Ave at San Leandro
Street 51 Families 2,980,547
Posada de Colores 2221 Fruitvale Ave 100 Senior 188,500 Project Pride 2577-79 San Pablo Ave 42 Transitional Housing 4,450,000
Redwood Hill 4858-68 Calaveras 20 Homeownership 3,858,424 Saint Joseph Ownership Phase IIa 2647 International Blvd 16 Families 3,584,000 Saint Joseph Senior 2647 International Blvd 78 Senior 3,789,000 Sausal Creek 2464 26th Ave 17 Homeownership 2,329,000 Tassafaronga Homeownership 949 85th Avenue 22 Homeownership 1,868,000 Tassafaronga Village, Rental Phase I 919 85th Avenue 50 Families 3,000,000 Wood Street Mixed Use Wood Street at 18th to
20th Streets170 8,050,000
TOTAL 1,295 $87,076,910
List of Active Projects
C - 3

HOUSING PROGRAM _________________________________________________
NOTES
C - 4

LEGISLATION

_________________________________________________ LEGISLATION
D - 1

LEGISLATION _________________________________________________
D - 2

_________________________________________________ LEGISLATION
D - 3

LEGISLATION _________________________________________________
D - 4

_________________________________________________ LEGISLATION
D - 5

LEGISLATION _________________________________________________
D - 6

_________________________________________________ LEGISLATION
D - 7

LEGISLATION _________________________________________________
D - 8

_________________________________________________ LEGISLATION
D - 9

LEGISLATION _________________________________________________
D - 10

_________________________________________________ LEGISLATION
D - 11

LEGISLATION _________________________________________________
D - 12

_________________________________________________ LEGISLATION
D - 13

LEGISLATION _________________________________________________
D - 14

_________________________________________________ LEGISLATION
D - 15

LEGISLATION _________________________________________________
D - 16

_________________________________________________ LEGISLATION
D - 17

LEGISLATION _________________________________________________
D - 18

_________________________________________________ LEGISLATION
D - 19

LEGISLATION _________________________________________________
D - 20

_________________________________________________ LEGISLATION
D - 21

LEGISLATION _________________________________________________
D - 22

_________________________________________________ LEGISLATION
D - 23

LEGISLATION _________________________________________________
D - 24

_________________________________________________ LEGISLATION
D - 25

LEGISLATION _________________________________________________
D - 26

GLOSSARY

_________________________________________________________ GLOSSARY
GLOSSARY Assessed Value The value of real property determined by the County Tax Assessor for tax
purposes. Assessed value multiplied by the tax rate determines property tax. Base Year A term used in tax increment financing that refers to the taxable assessed
value of the project area at the time a redevelopment project is established. The “base year” assessed value and the property tax revenue resulting from it continue to be available to all local taxing agencies that shared property tax revenue prior to establishment of the redevelopment area.
Blight A combination of physical and economic conditions that prevent private
enterprise from occurring, which may benefit from redevelopment in the interest of the health, safety, and general welfare of the people of the community. Blighted conditions could include: unhealthy or unsafe buildings, adjacent incompatible commercial uses, high crime, excessive residential crowding, abnormally high commercial vacancies, and stagnant or declining property values. Agencies must show blighted conditions in a geographic area as a requirement of redevelopment project area designation.
California Environmental Quality Act (CEQA) The California Environmental Quality Act (CEQA), enacted in 1970, requires
state and local agencies to identify the significant environmental impacts of their actions and to avoid or mitigate those impacts, if feasible. CEQA applies to projects undertaken, funded or requiring an issuance of a permit by a public agency. CEQA is a self-executing statute. Public agencies are entrusted with compliance with CEQA and its provisions are enforced, as necessary, by the public through litigation and the threat thereof. While the State of California Resources Agency is charged with the adoption of CEQA Guidelines, and may often assist public agencies in the interpretation of CEQA, it is each public agency’s duty to determine what is and is not subject to CEQA.
California Community Redevelopment Law (CCRL) Redevelopment Law of the State contained in California Health and Safety
Code, Division 24, Part 1 (Section 33000 et seq). Disposition and Development Agreement An agreement between a redevelopment agency and a developer for the sale
and development of property in the project area. Common elements of a DDA include: sale of land, development, architectural review, agency assistance (such as public financing), financing provisions, use covenants and remedies. The DDA contains all terms and conditions relating to the sale and development of property. It becomes the legally binding instrument that governs the relationship between the agency and developer until development is complete.
Environmental Impact Report (EIR) A report that thoroughly describes and analyzes the known significant
environmental effects of a proposed project, and discusses approaches to mitigating or avoiding those effects.
E - 1

GLOSSARY _________________________________________________________ Educational Revenue Augmentation Fund (ERAF) A fund into which a portion of property tax revenue (from local entities
including redevelopment agencies) is shifted to provide increased local support for public schools. ERAF was enacted in FY 1992-93 to help the State balance its General Fund Budget while maintaining its commitment to fund public education under Proposition 98.
Exclusive Negotiating Agreement (ENA) While not legally required, redevelopment agencies and developers enter into
Exclusive Negotiating Agreements (ENAs) to provide structure to the negotiation process. ENAs define specific time periods within which agencies and developers negotiate terms of the sale and development of certain property within a redevelopment area or DDAs (see above). The developer, is therefore reassured that it can invest its time and money to determine a project’s feasibility without fear that a competitor will seize the opportunity. Agencies typically require developers to make good faith deposits in connection with the execution of an ENA. In this way, the agency is reassured of the developer’s commitment to the proposed development. Some agencies use good faith deposits to recoup staff and consultant time expended during negotiations. Although an ENA should be formally approved by the agency, it does not require a public hearing.
Fiscal Year The Agency’s fiscal year is July 1 through June 30. Frozen Assessed Value A term used in conjunction with tax increment financing that refers either to the
base year assessed value (frozen base), or to the assessed value increment that results from increases in assessed value over the base year and which increment is reserved (frozen) until all redevelopment indebtedness has been repaid.
Housing Set-Aside Requires that twenty percent (20%) of gross tax increment be set aside to
improve the quantity and/or quality of housing for very low-, low- and moderate-income families. The Agency voted to increase the low- and moderate-income housing set-aside to 25 percent of gross tax increment.
Infrastructure Public improvements which support development, including street lighting,
street construction, storm drain systems, utility lines, etc. Project Area Committee (PAC) A committee elected by and composed of residential and commercial property
owners and tenants, as well as community organizations in a proposed redevelopment project area. If a PAC is a required condition of redevelopment project area adoption, then the Agency must consult with the PAC during after plan adoption.
Project The term “Project” with a capital P means the undertaking of the Agency
pursuant to a specifically adopted Redevelopment Area Plan. The term “project” with a lower case p refers to an undertaking or action within a Project. This terminology is used frequently in the Central District Project with its individual action areas or projects.
E - 2

_________________________________________________________ GLOSSARY
Project Area That area within a city or county for which a redevelopment plan has been adopted by the local legislative body.
Redevelopment Agency State statutes prescribe for the establishment of redevelopment agencies by
cities and counties. An agency must first be activated through the adoption of an ordinance by the City Council or the County Board of Supervisors. The authority to engage in redevelopment activities, to incur debt, and to utilize tax increment financing is provided to the redevelopment agency.
Redevelopment Plan The written plan adopted and approved by the Agency, which describes the
actions to be taken by the Agency in redeveloping the project area defined in the Plan. It is a legal document setting forth project boundaries, development objectives, general land use plan, planning criteria, renewal techniques, land acquisition, land disposition, development controls, duration of controls and plans, and methods of financing.
Survey Area Geographic area found by the legislative body to qualify for redevelopment
study purposes. A redevelopment project area must be formed from within a survey area (see above).
Tax Allocation Bonds Bonds issued by a redevelopment agency and secured solely and directly by
the pledge of tax increments from the redevelopment project. Tax Increment Property taxes collected from the portion of the net assessed value (NAV) of
the Project Area that represents the difference between the “base value” of that Project Area and the total NAV for that Area. The “base value” refers to the taxable assessed value of the project area at the time a redevelopment project is established. When the redevelopment project is established, the base value becomes frozen, and the property tax revenue generated from this base value continues to be available to all local taxing agencies (e.g. the City, the School District, the County, etc.), while the revenue growth accrues to the Redevelopment Agency (net of applicable transfers and pass throughs).
Tax Increment Financing A method of financing authorized by the State constitution and Statutes as a
way of repaying indebtedness incurred by local redevelopment agencies to carry out projects. As a financial tool, it provides that the assessed value of a redevelopment project area may be frozen upon establishment of a project. The frozen base continues to be available to all local taxing agencies through the duration of the redevelopment project. However, any growth in assessed value over the frozen base is reserved for the repayment of indebtedness incurred by the redevelopment agency in redeveloping the area. The property tax rates of local agencies continue to apply to this assessed value increment but the revenue resulting there from is not available to other local taxing agencies until all project indebtedness has been retired.
Taxing Entity Any city, county, school district, or special district which levies property taxes to
raise revenues.
E - 3

GLOSSARY _________________________________________________________
NOTES
E - 4