obesity and local food environment · analyse patterns 2 5km (5min) ratio of 2.5km (5min) 5km...
TRANSCRIPT
Ob it d l l f dObesity and local food environmentA Perth Metropolitan Study
Dr Grace Yun – Senior Research Analyst GIS Public HealthDr Grace Yun Senior Research Analyst GIS, Public Health
Dr Laura Miller – Spatial Analysis Research Officer, Child and Adolescent Community Health
Shannon Carter – Research Analyst GIS, Public Health
Dr Sarah Joyce – A/Manager, Health Survey Unit, Public Health
Department of Health, Western Australia
Delivering a Healthy WA

WA Health DepartmentWA Health Department
Western Australia's public health system aims:Western Australia s public health system aims:
• To ensure healthier, longer and better lives for ll W t A t liall Western Australians
• To protect the health of our community by providing a safe, high quality, accountable and sustainable health care system

Epidemiology BranchDepartment of HealthDepartment of Health Western Australia
GISOur Aim: GIS
To monitor, assess and report on health profiles and service utilisation for the WA population.
Epidemiological AnalysisWe provide information to:
Guide policy development
Health Surveys
Identify emerging issues Prioritise service deliveryEvaluate health system performance
Health Surveys
F i f i it htt // bli h lthEmail: [email protected] more info visit: http://www.public.health.wa.gov.au
GIS in WA Health DepartmentGIS in WA Health Department
• Epidemiology Branch within Public Health Division
• 3 FTE + 0.4 contractor position
• Historically MapInfo domain changed to ESRI• Historically MapInfo domain, changed to ESRI suite due to increased spatial analysis requirementrequirement

USAUSAUSAUSA AustraliaAustralia•~3,790,000sq mi •~3,000,000 sq mi•310, 467,000 people•~80 ppl/sq mi•Spend 13 5%
•21,000,000 people•~7 ppl/sq mi•Spend 8 5% of •Spend 13.5%
GDP on Health•Life expectancy ~78
•Spend 8.5% of GDP on Health•Life expectancy ~82


OverviewOverview
• Background• Background
• Data source• Data source
Research methods• Research methods
P li i lt d f t l• Preliminary results and future plan
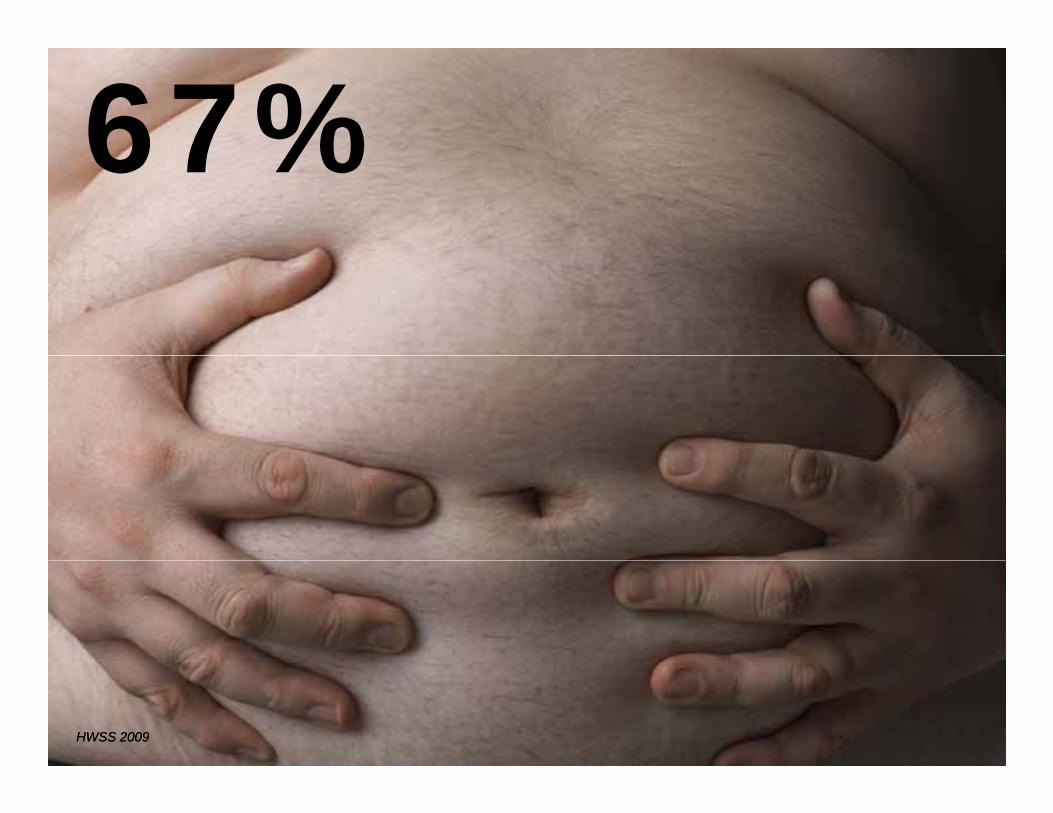
67%67%
HWSS 2009HWSS 2009

$41,000,000,000,000, , , ,“ obesity is worsening throughout the throughout the developed world and becoming the top public health concern”public health concern

StrokeC
DiabetesCancer
O t th itiHeart Disease
Osteoarthritis

GPs
Nursing homes
Hospitals
Pharmaceuticals
Nursing homes
Pharmaceuticals

CarersCarersEquipment
UnemploymentT l tTax revenue lost
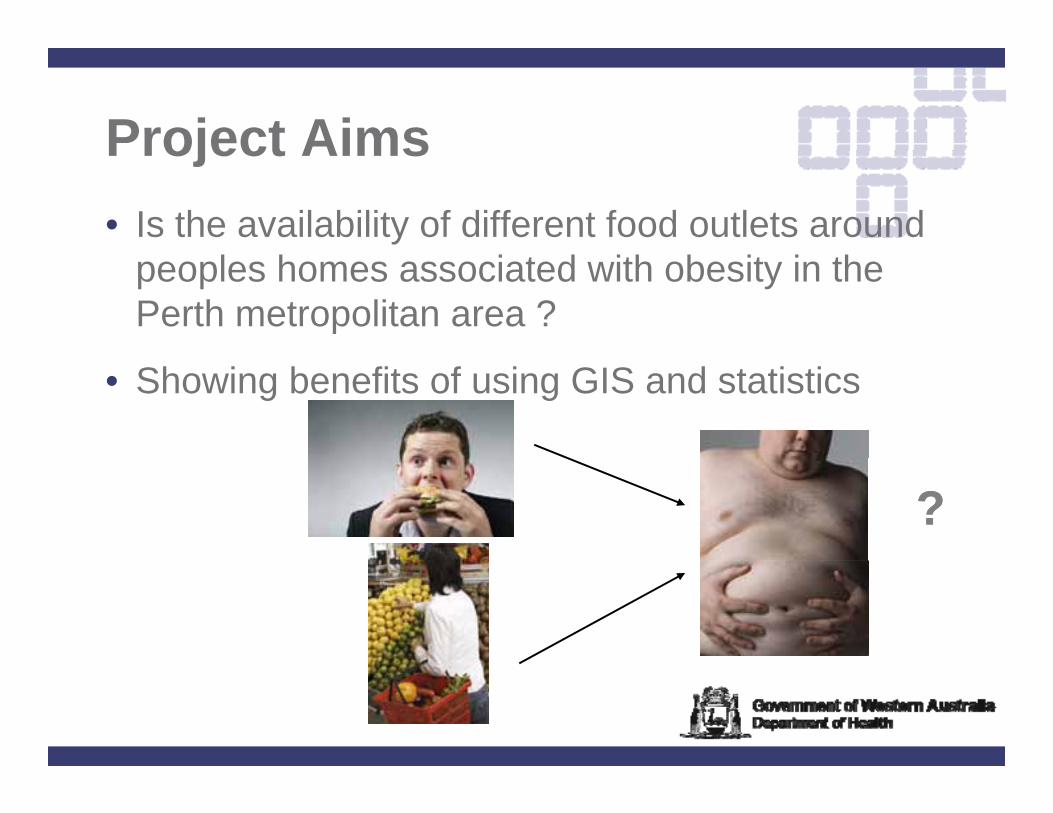
Project AimsProject Aims• Is the availability of different food outlets around
peoples homes associated with obesity in the Perth metropolitan area ?
• Showing benefits of using GIS and statistics
??

People living in neighbourhoods d d ith f t f d dcrowded with fast-food and
convenience stores but relatively few grocery or produce outlets are at significantly higher risk of suffering from obesity and diabetes
California, USACalifornia, USA
(California Center for Public Health Advocacy (CCPHA) report, 2008)
The Lower the ratio of fast-food restaurants and convenience stores to grocery stores and produceto grocery stores and produce vendors near people’s home, the lower the odds of being obese.
(Spence et al 2009)Edmonton, CanadaEdmonton, Canada (Spence et al 2009) Edmonton, CanadaEdmonton, Canada

Data SourcesData Sources• HWSS - WA Health and Wellbeing Surveillance
SystemSystem• Continuous data collection system.• Collected using a Computer Assisted TelephoneCollected using a Computer Assisted Telephone
Interview (CATI) • People are interviewed throughout the year with an
accumulated sample of 7000 annuallyaccumulated sample of 7000 annually.• People aged 18+ was used in this study (9204 people
from 2006-2008 survey)
• Food outlet dataset from all 39 Local Government Authorities
Types of foods usedTypes of foods used
• Fast food (FF)
• Restaurant food (RE)
H lth f d (HF)• Healthy food (HF)
– Supermarkets, fruit and veg shops, butchers

Individual peopleIndividual peopleF t F d F t F d Fast Food Fast Food
Restaurant Restaurant Healthy FoodHealthy Food
Distance to Distance to
yy
Road Road Distance to Distance to nearest nearest FF/HF/REFF/HF/RE
Road Road networknetwork
Density of Density of FF/RE/HFFF/RE/HF
foodfood
Analyse Analyse patternspatterns
2 5km (5min)2 5km (5min) foodfood
Ratio of Ratio of
2.5km (5min)2.5km (5min)
5km (10min)5km (10min)
FF/HFFF/HF

Density of Obese or Overweight people and Fast Food locations
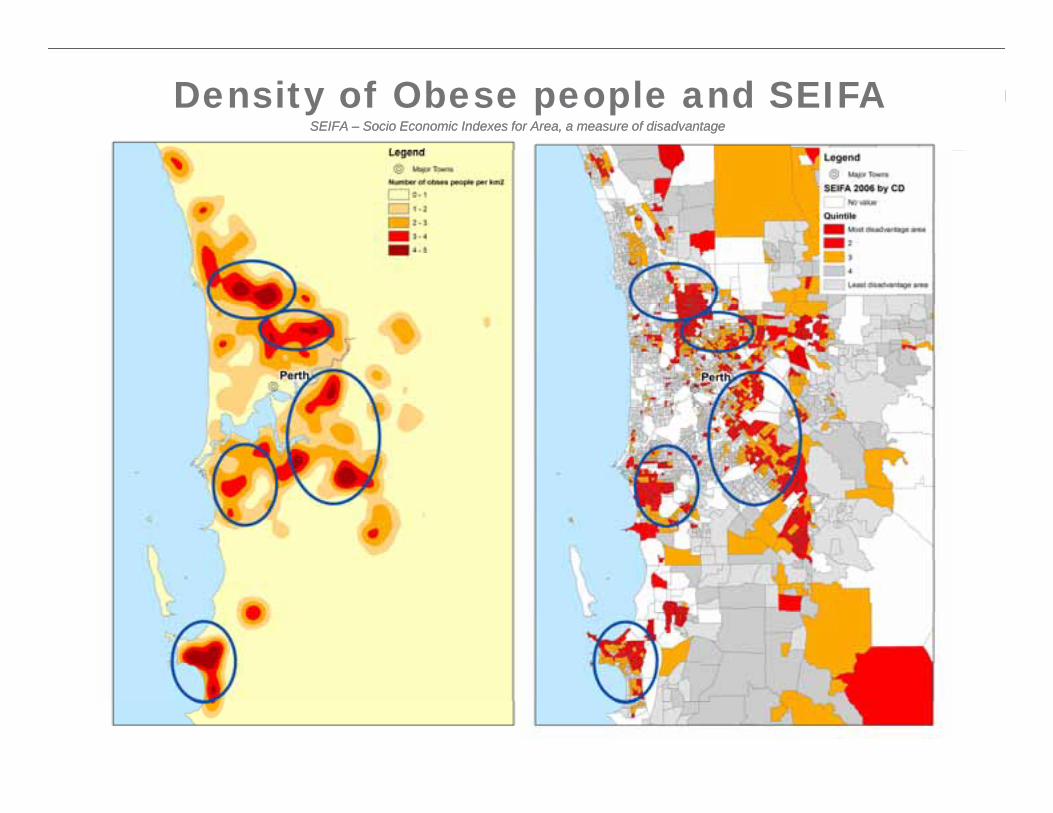
Density of Obese people and SEIFASEIFA SEIFA –– Socio Economic Indexes for Area, a measure of disadvantageSocio Economic Indexes for Area, a measure of disadvantage

Statistical analysisStatistical analysis
• Logistic regression analysisLogistic regression analysis
– Obesity as outcome variableControlled for age sex self reported fruit veg &– Controlled for age, sex, self reported fruit, veg & takeaway consumption, area disadvantage
• Spatial Variables of Interest
– Distance to nearest FF, HF & RE– Density of FF, HF & RE (in 2.5 & 5km buffers)– Ratio of FF to HF

Preliminary ResultsPreliminary Results
• More likely to be obese if you are 40+

Preliminary ResultsPreliminary Results
• More likely to be obese if you consume more takeaway

Preliminary ResultsPreliminary ResultsOdds Ratios of being Obese by SEIFA Quintile
2.500
•More likely to be obese if you consume more takeaway each week1.500
2.000
ng O
bese
• More likely to be obese if you
takeaway each week
0 500
1.000
Odd
s R
atio
of b
ein
live in more deprived areas
0.000
0.500
1Most Disadvantaged
2 3 4 5Least Disadvantaged(Reference Category)
SEIFA Disadvantage Quintile
SEIFA SEIFA –– Socio Economic Indexes for Area, a measure of your disadvantageSocio Economic Indexes for Area, a measure of your disadvantage
Preliminary ResultsPreliminary Results
No relationship found with:
• SexSe
• Fruit & veg consumption
Took these variables out of the analysis as they t i ifi twere not significant

Preliminary Results Cont.Preliminary Results Cont.
Odds of being obese is lower:g• Where high density of FF within 2.5km
– (OR: 0 996 CI: 0 994 - 0 997)(OR: 0.996 CI: 0.994 0.997)• Where high density of HF within 2.5km
– (OR: 0.990 CI: 0.985 - 0.994)Wh hi h d it f RE ithi 2 5k• Where high density of RE within 2.5km
– (OR: 0.987 CI: 0.981 - 0.992)
Th i bl i t d l b thThese variables were run in separate models because they were strongly correlated.
NO relationship with distance to nearest or FF/HF ratioNO relationship with distance to nearest or FF/HF ratio

Preliminary ConclusionsPreliminary Conclusions
Probability of being obese is lower where high density of food options within 2.5km
• Perhaps the greater range of food outlets close by means more healthy options are chosen?
• Perhaps people walk more to get food?Perhaps people walk more to get food?Limitations:
• Only ~7% of variation in obesity accounted for • Model fit is OK but not good at determining categories• Availability of food outlets only plays a small part in
predicting obesity (small effect size)predicting obesity (small effect size)
Where next??Where next??
• Improving the obesity models
– Use multiple linear regressionp g– Control for more explanatory variables e.g.
physical/sedentary activity, individual income, occupation etcoccupation etc
• Sharing information
– Back to local bodies so they can make informed planning decisions