obiee overview
DESCRIPTION
OBIEE OVERVIEWTRANSCRIPT

Oracle® Business Intelligence Answers, Delivers, and Interactive Dashboards User Guide
Version 10.1.3.2December 2006

Part Number: B31767-01
Copyright © 2006, Oracle. All rights reserved.
The Programs (which include both the software and documentation) contain proprietary information; they are provided under a license agreement containing restrictions on use and disclosure and are also protected by copyright, patent, and other intellectual and industrial property laws. Reverse engineering, disassembly, or decompilation of the Programs, except to the extent required to obtain interoperability with other independently created software or as specified by law, is prohibited.
The information contained in this document is subject to change without notice. If you find any problems in the documentation, please report them to us in writing. This document is not warranted to be error-free. Except as may be expressly permitted in your license agreement for these Programs, no part of these Programs may be reproduced or transmitted in any form or by any means, electronic or mechanical, for any purpose.
If the Programs are delivered to the United States Government or anyone licensing or using the Programs on behalf of the United States Government, the following notice is applicable:
U.S. GOVERNMENT RIGHTS. Programs, software, databases, and related documentation and technical data delivered to U.S. Government customers are "commercial computer software" or "commercial technical data" pursuant to the applicable Federal Acquisition Regulation and agency-specific supplemental regulations. As such, use, duplication, disclosure, modification, and adaptation of the Programs, including documentation and technical data, shall be subject to the licensing restrictions set forth in the applicable Oracle license agreement, and, to the extent applicable, the additional rights set forth in FAR 52.227-19, Commercial Computer Software--Restricted Rights (June 1987). Oracle USA, Inc., 500 Oracle Parkway, Redwood City, CA 94065.
The Programs are not intended for use in any nuclear, aviation, mass transit, medical, or other inherently dangerous applications. It shall be the licensee's responsibility to take all appropriate fail-safe, backup, redundancy and other measures to ensure the safe use of such applications if the Programs are used for such purposes, and we disclaim liability for any damages caused by such use of the Programs.
Oracle, JD Edwards, PeopleSoft, and Siebel are registered trademarks of Oracle Corporation and/or its affiliates. Other names may be trademarks of their respective owners.
The Programs may provide links to Web sites and access to content, products, and services from third parties. Oracle is not responsible for the availability of, or any content provided on, third-party Web sites. You bear all risks associated with the use of such content. If you choose to purchase any products or services from a third party, the relationship is directly between you and the third party. Oracle is not responsible for: (a) the quality of third-party products or services; or (b) fulfilling any of the terms of the agreement with the third party, including delivery of products or services and warranty obligations related to purchased products or services. Oracle is not responsible for any loss or damage of any sort that you may incur from dealing with any third party.

Oracle Business Intelligence Answers, Delivers, and InteractiveDashboards User Guide Version 10.1.3.2
3
Contents
Oracle® Business Intelligence Answers, Delivers, and Interactive Dashboards User Guide 1
Chapter 1: What’s New in This Release
Chapter 2: Getting Started with Oracle Business Intelligence
Overview of Oracle BI for End Users 11
Accessing Oracle BI 13
Performing Common Tasks in Oracle BI 15
Navigating in Oracle BI 20
Using the Oracle BI My Account Page 23
Chapter 3: Basics of Working with Requests in Oracle BI Answers
Overview of Oracle BI Answers 25
Example of an Oracle BI Answers Start Page 27
Using Oracle BI Answers to Create, Modify, and Save Requests 28
Embedding an Oracle BI Request in an Oracle BI Dashboard 38
Accessing and Working with an Oracle BI Request in Microsoft Excel 39
Integrating an Oracle BI Request with Microsoft Excel’s Internet Query Feature 40
Combining Oracle BI Request Criteria Using Set Operations 41
Examining or Editing the Logical SQL Generated for an Oracle BI Request 42
Executing a Direct Database Request in Oracle BI Answers 43
Using Variables to Display Values in Request Results, Dashboards and iBots 44
Chapter 4: Filtering Requests in Oracle BI AnswersUsing Column Filters in an Oracle BI Request 47
Using Prompts to Simplify Filtering in an Oracle BI Request 56
Creating a Dashboard Prompt for Filtering Oracle BI Requests 60
Using a Saved Oracle BI Request as a Filter 64

Oracle Business Intelligence Answers, Delivers, and Interactive Dashboards User Guide Version 10.1.3.2
Contents ■
4
Editing the SQL for a Column Filter in an Oracle BI Request 64
Chapter 5: Formatting Results in Oracle BI AnswersUsing Column Formatting Functions in Oracle BI Answers 67
Editing the Appearance of Column Contents in Oracle BI Answers 67Editing the Layout of Column Contents in Oracle BI Answers 69Formatting Column Content In Oracle BI Answers 71Applying Conditional Formatting to Column Content in Oracle BI Answers 73Saving Your Oracle BI Answers Column Property Settings as the System-Wide Defaults
75
Using Custom Date/Time Format Strings in Oracle BI Answers 75
Applying Cosmetic Formatting to Results and Dashboards 81
Chapter 6: Working with Oracle BI Views in Oracle BI Answers
About Oracle BI Views 85
Performing Common Tasks When Working with Oracle BI Views 91
Assembling Views for Display on a Dashboard Using Oracle BI Compound Layout View 96
Adding Titles to Results Using Oracle BI Title View 98
Adding Tables to Results Using Oracle BI Table View 100
Editing the Formula of a Column 103
Showing Results in Charts Using Oracle BI Chart View 107
Showing Results in Pivot Tables Using Oracle BI Pivot Table View 125
Showing Results as Gauges Using Oracle BI Gauge View 137
Showing Filters Applied to Results Using Oracle BI Filters View 144
Allowing Users to Change Columns in Requests Using Oracle BI Column Selector View 144
Allowing Users to Select a Specific View Using View Selector View 145
Adding a Legend to Results Using Oracle BI Legend View 146
Showing Results in a Funnel Chart Using Oracle BI Funnel Chart View 146
Adding Narrative Text to Results Using Oracle BI Narrative View 148
Showing Results in a Scrolling Ticker Using Oracle BI Ticker View 151
Adding Text to Results Using Oracle BI Static Text View 154
Alerting Users to No Data Using Oracle BI No Results View 157

Contents ■
Oracle Business Intelligence Answers, Delivers, and InteractiveDashboards User Guide Version 10.1.3.2
5
Showing the Logical SQL for a Request Using Oracle BI Logical SQL View 157
Creating Segments in Oracle’s Siebel Marketing Using Oracle BI Create Segment View 158
Creating Lists of Contacts and Accounts Using Oracle BI Create Target List View 159
Chapter 7: Using Oracle BI DeliversOverview of Oracle BI Delivers 161
Accessing Oracle BI Delivers 164
Creating and Managing iBots Using the Oracle BI Delivers Start Page 164
Reviewing Oracle BI Delivers iBot Settings 166
Specifying Oracle BI Delivers iBot Priority, Data Visibility, and Impersonation 166
Selecting a Request to Trigger an Oracle BI Delivers iBot 167
Scheduling an Oracle BI Delivers iBot 168
Selecting Users to Receive an Oracle BI Delivers iBot 170
Specifying the Delivery Content for an iBot 173
Selecting Destinations for an Oracle BI Delivers iBot 177
Specifying Actions to Execute on Completion of an Oracle BI Delivers iBot 179
Viewing, Modifying, Subscribing to and Customizing Oracle BI Delivers iBots 184
Configuring Your Oracle BI Delivers Devices, and Delivery Profiles 186
Using Oracle BI Delivers Delivery Profiles 188
Accessing Oracle BI Alerts 189
Chapter 8: Using Oracle BI Interactive DashboardsOverview of Oracle BI Interactive Dashboards 191
Navigating in Oracle BI Interactive Dashboards 194
Creating a New Oracle BI Interactive Dashboard 195
Adding a New Page to an Oracle BI Interactive Dashboard 196
Adding Content to an Oracle BI Interactive Dashboard 196Working with Oracle BI Interactive Dashboard Pages and Layout Using the Dashboard Editor 197Adding and Displaying Content in an Oracle BI Interactive Dashboard Page Using the Dashboard Editor 200Renaming and Deleting Objects on an Oracle BI Interactive Dashboard Page Using the Dashboard Editor 212Modifying Oracle BI Interactive Dashboard Properties Using the Dashboard Editor 213

Oracle Business Intelligence Answers, Delivers, and Interactive Dashboards User Guide Version 10.1.3.2
Contents ■
6
Changing the Properties of an Oracle BI Interactive Dashboard 214
Creating and Assigning Personal and Shared Saved Selections for an Oracle BI Interactive Dashboard Page 217
Accessing Another Oracle BI User’s Account 220
Working with Oracle BI Publisher Reports 220
Working with Oracle BI Briefing Books 224
About Guided Navigation in Oracle BI 228
Chapter 9: Managing Content in the Oracle BI Presentation Catalog
Managing Folders and Content in the Oracle BI Presentation Catalog 229
Editing Names and Descriptions of Objects in the Oracle BI Presentation Catalog 232
Copying or Moving Folders or Items in the Oracle BI Presentation Catalog 233
Index

Oracle Business Intelligence Answers, Delivers, and InteractiveDashboards User Guide Version 10.1.3.2
7
1 What’s New in This Release
Oracle Business Intelligence Enterprise Edition consists of components that were formerly available from Siebel Systems as Siebel Business Analytics Platform, with a number of significant enhancements.
The Oracle Business Intelligence Answers, Delivers, and Interactive Dashboards User Guide is part of the documentation set for Oracle Business Intelligence Enterprise Edition. This guide contains information about using Oracle’s Answers, Delivers, and Interactive Dashboards applications to organize and present data for making critical and timely business decisions. This guide contains new material and material that was previously published under the title Siebel Analytics User Guide.
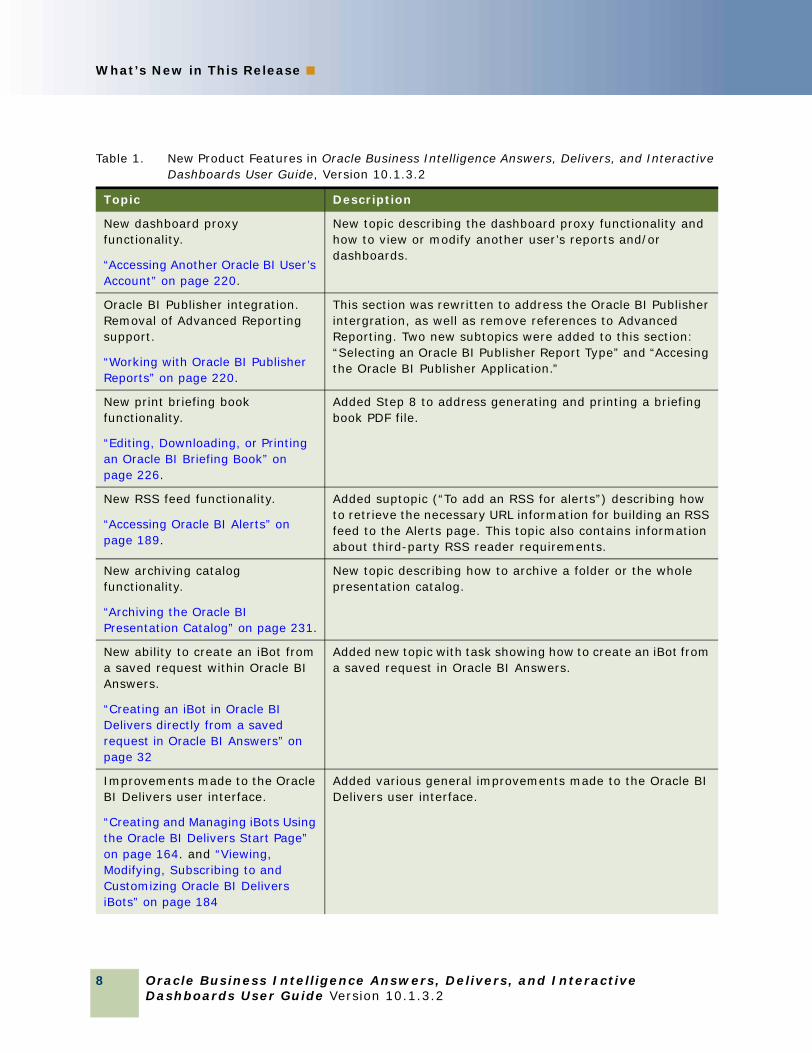
What’s New in Oracle Business Intelligence Answers, Delivers, and Interactive Dashboards User Guide, Version 10.1.3.2Table 1 lists changes described in this version of the documentation to support Release 10.1.3.2 of the software.
Table 1. New Product Features in Oracle Business Intelligence Answers, Delivers, and Interactive Dashboards User Guide, Version 10.1.3.2
Topic Description
All All topics have been updated with new product names.
New time zone support.
“Setting Your Oracle BI Time Zone” on page 24.
Added new subtopic describing how to select a preferred time zone for the user’s account.
New time zone support.
“Editing the Appearance of Column Contents in Oracle BI Answers” on page 67.
Added Step 4 to explain how to apply a specific time zone to a date/time column.
New time zone support.
“Editing the Layout of Column Contents in Oracle BI Answers” on page 69.
Added the “To include the TimeZone icon” subtopic to instruct the user how to add the TimeZone icon to the column.
New RSS feed functionality.
“Adding an RSS Feed Option to a Dashboard Page’s Catalog Folder” on page 209.
New topic describing how to retrieve the necessary URL information for building an RSS feed to a catalog folder. This topic also contains information about third-party RSS reader requirements.
Oracle Business Intelligence Answers, Delivers, and Interactive Dashboards User Guide Version 10.1.3.2
What’s New in This Release ■
8
New dashboard proxy functionality.
“Accessing Another Oracle BI User’s Account” on page 220.
New topic describing the dashboard proxy functionality and how to view or modify another user’s reports and/or dashboards.
Oracle BI Publisher integration. Removal of Advanced Reporting support.
“Working with Oracle BI Publisher Reports” on page 220.
This section was rewritten to address the Oracle BI Publisher intergration, as well as remove references to Advanced Reporting. Two new subtopics were added to this section: “Selecting an Oracle BI Publisher Report Type” and “Accesing the Oracle BI Publisher Application.”
New print briefing book functionality.
“Editing, Downloading, or Printing an Oracle BI Briefing Book” on page 226.
Added Step 8 to address generating and printing a briefing book PDF file.
New RSS feed functionality.
“Accessing Oracle BI Alerts” on page 189.
Added suptopic (“To add an RSS for alerts”) describing how to retrieve the necessary URL information for building an RSS feed to the Alerts page. This topic also contains information about third-party RSS reader requirements.
New archiving catalog functionality.
“Archiving the Oracle BI Presentation Catalog” on page 231.
New topic describing how to archive a folder or the whole presentation catalog.
New ability to create an iBot from a saved request within Oracle BI Answers.
“Creating an iBot in Oracle BI Delivers directly from a saved request in Oracle BI Answers” on page 32
Added new topic with task showing how to create an iBot from a saved request in Oracle BI Answers.
Improvements made to the Oracle BI Delivers user interface.
“Creating and Managing iBots Using the Oracle BI Delivers Start Page” on page 164. and “Viewing, Modifying, Subscribing to and Customizing Oracle BI Delivers iBots” on page 184
Added various general improvements made to the Oracle BI Delivers user interface.
Table 1. New Product Features in Oracle Business Intelligence Answers, Delivers, and Interactive Dashboards User Guide, Version 10.1.3.2
Topic Description

What’s New in This Release ■
Oracle Business Intelligence Answers, Delivers, and InteractiveDashboards User Guide Version 10.1.3.2
9
Additional iBot results formats supported in Oracle BI Delivers.
“Specifying the Delivery Content for an iBot” on page 173
Added new functionality that enables Oracle BI Delivers users to send the results of an iBot as an attachment in Microsoft Excel or Comma Separated Value (CSV) file format.
Improved management of delivery devices and delivery profiles in Oracle BI Delivers.
“Configuring Your Oracle BI Delivers Devices, and Delivery Profiles” on page 186
Altered and simplified how delivery devices and delivery profiles are presented and configured in Oracle BI Delivers.
New ability to create nested folders in Oracle BI Delivers.
“Using the Save iBot Dialog Box to organize your iBots” on page 172
Added new functionality that enables Oracle BI Delivers users to create a new folder in an existing folder.
New ability to search for iBots in Oracle BI Delivers.
“Creating and Managing iBots Using the Oracle BI Delivers Start Page” on page 164
Added new functionality that enables Oracle BI Delivers users to better manage their iBot subscriptions by searching for iBots by name.
New ability to run a custom Java program as part of an iBot in Oracle BI Delivers.
“About Custom Script Action Properties” on page 181
Added new functionality to specify a custom Java program to execute when the current iBot completes in Oracle BI Delivers.
New ability to use Presentation Variables in Oracle BI.
“Using Variables to Display Values in Request Results, Dashboards and iBots” on page 44
Added new functionality to specify presentation variables in requests and iBots in Oracle BI.
Improvements made to the Oracle BI Answers and Interactive Dashboards user interface.
“Overview of Oracle BI Answers” on page 25, and “Overview of Oracle BI Interactive Dashboards” on page 191
Added general improvements to the Oracle BI Answers and Interactive Dashboards user interface.
Table 1. New Product Features in Oracle Business Intelligence Answers, Delivers, and Interactive Dashboards User Guide, Version 10.1.3.2
Topic Description

Oracle Business Intelligence Answers, Delivers, and Interactive Dashboards User Guide Version 10.1.3.2
What’s New in This Release ■
10
New pivot table functionality in Oracle BI Answers.
“Showing Results in Pivot Tables Using Oracle BI Pivot Table View” on page 125
Added new functionality for pivot tables in Oracle BI Answers enabling users to create totals at various grouping levels, suppress section headers, allow page breaks at section level, include column values in total rows, and suppress blank rows.
New drag and drop functionality in Oracle BI Answers compound views.
“Assembling Views for Display on a Dashboard Using Oracle BI Compound Layout View” on page 96
Added new functionality to Oracle BI Answers enabling users to rearrange compound view objects using drag and drop.
New conditional formatting functionality for charts in Oracle BI Answers.
“Formatting the Visual Appearance of Charts” on page 121
Added new functionality to Oracle BI Answers enabling users to apply formatting to charts based on rules.
New functionality to easily insert content into a column formula in Oracle BI Answers.
“Editing the Formula of a Column” on page 103
Added new functionality to Oracle BI Answers enabling users to add functions, filters, columns, and variables to a column formula using a button bar.
New functionality to easily apply conditional aggregates in Oracle BI Answers.
“Editing the Formula of a Column” on page 103
Added new functionality to Oracle BI Answers enabling users to add conditional aggregates (using filter expressions) to a column formula, avoiding the need to create multiple CASE statements.
New functionality to customize fonts in charts in Oracle BI Answers.
“Specifying General Chart Properties in Oracle BI Chart View” on page 113
Added new functionality to Oracle BI Answers enabling users to format the text and numeric values that are displayed in titles, axis titles, and labels of chart views.
Table 1. New Product Features in Oracle Business Intelligence Answers, Delivers, and Interactive Dashboards User Guide, Version 10.1.3.2
Topic Description

Oracle Business Intelligence Answers, Delivers, and InteractiveDashboards User Guide Version 10.1.3.2
11
2 Getting Started with Oracle Business Intelligence
This chapter describes the major features and functions of Oracle Business Intelligence (Oracle BI) that most end users typically work with. It explains how Oracle BI works, provides information about security, explains how to access Oracle BI, and provides procedures for commonly performed tasks. This chapter contains the following topics:
■ “Overview of Oracle BI for End Users” on page 11
■ “Accessing Oracle BI” on page 13
■ “Performing Common Tasks in Oracle BI” on page 15
■ “Navigating in Oracle BI” on page 20
■ “Using the Oracle BI My Account Page” on page 23
Overview of Oracle BI for End UsersTypically, organizations track and store large amounts of data about products, customers, prices, contacts, activities, assets, opportunities, employees, and other elements. This data is often spread across multiple databases in different locations with different versions of database software.
After the data has been organized and analyzed, it can provide an organization with the metrics to measure the state of its business. This data can also present key indicators of changes in market trends and in employee, customer, and partner behavior. Oracle BI helps end users obtain, view, and analyze the data.
This section contains the following topics:
■ “Oracle BI Components” on page 11
■ “If You Are a User of Stand-Alone Oracle BI” on page 13
■ “About Security in Oracle BI” on page 13
Oracle BI ComponentsThis topic provides a broad overview of Oracle BI components, from an end-user perspective.
Oracle BI has two main components:
■ Oracle BI Presentation Services. Oracle BI Presentation Services consists of the following interfaces.

Oracle Business Intelligence Answers, Delivers, and Interactive Dashboards User Guide Version 10.1.3.2
Getting Started with Oracle Business Intelligence ■ Overview of Oracle BI for End Users
12
■ Oracle Business Intelligence Answers. Oracle BI Answers provides answers to business questions. This interface allows users with the appropriate permissions to build and modify reports, also called requests, that let end users explore and interact with information, and present and visualize information using charts, pivot tables, and reports. Your organization may also have purchased prebuilt reports specific to your industry.
The results of an Oracle BI Answers request can be formatted, saved, organized, and shared with others. A report can be configured to refresh results in real-time.
Reports created with Oracle BI Answers can be saved in the Oracle BI Presentation Catalog and integrated into any Oracle BI home page or dashboard. Results can be enhanced through options such as charting, result layout, calculation, and drilldown features.
■ Oracle Business Intelligence Interactive Dashboards. Interactive Dashboards provide points of access for analytics information. When an end user accesses Oracle BI, the user’s default dashboard is typically the first page that appears. Dashboards are typically used to display reports that contain content specific to the needs of individual users or groups. Historical and current data sources can be merged into a single dashboard.
Users with the appropriate permissions can place results from Oracle BI Answers into dashboards for use by end users. Your organization may also have purchased preconfigured dashboards that contain prebuilt reports specific to your industry.
■ Oracle Business Intelligence Delivers. Oracle BI Delivers is the interface used to create Oracle Business Intelligence Alerts based on analytics results. Specific results can be detected within reports and the appropriate people notified immediately through Web, wireless, and mobile communications channels.
Oracle BI Delivers uses intelligence bots called iBots to detect specific results. iBots are software-based agents, driven by schedules or events that can access, filter, and perform analytics on data based on specified criteria.
Users with the appropriate permissions can use Oracle BI Delivers to set up the conditions to trigger an alert. For example, if a user should be notified when a particular event occurs, such as customer account going critical, an alert can be created that will notify the user through a number of delivery options, such as email or cell phone.
■ Oracle Business Intelligence Applications. An Oracle BI application consists of prebuilt, industry-specific Oracle BI interactive dashboards and Oracle BI reports that are built using industry best practices and address key functional areas within an organization. Dashboards and reports are tailored for each end user’s role in an organization. Typically, Oracle BI applications are integrated with and accessible from other operational applications, such as Oracle’s Siebel CRM applications. Oracle BI applications are integrated with operational applications to provide business metrics in reports, in context with an organization’s business function and industry.
Oracle BI applications include Extract Transform Load (ETL) routines to extract, transform, and load data into the Oracle Business Analytics Warehouse. Oracle BI applications also contain metadata that maps to the Oracle Business Analytics Warehouse and a transactional database, and define key measures and metrics for all levels of the organization. These measures and metrics are available to report designers in Oracle BI Answers.
Some organizations may prefer to build their own metadata, Oracle BI Interactive Dashboards and Oracle BI reports. This mode is referred to as stand-alone Oracle BI.
Getting Started with Oracle Business Intelligence ■ Accessing Oracle BI
Oracle Business Intelligence Answers, Delivers, and InteractiveDashboards User Guide Version 10.1.3.2
13
If You Are a User of Stand-Alone Oracle BIStand-alone Oracle BI is not shipped with metadata, preconfigured reports, or preconfigured dashboards. Instead, an administrator in your organization uses Oracle BI to organize corporate data and create subject areas for use in building reports. Administrators also configure user security in stand-alone Oracle BI.
About Security in Oracle BI Oracle BI supports security mechanisms that allow users to access only the data for which they are authorized. The following types of security are typical:
■ Business logic object security. This security mechanism controls access to objects, such as subject areas, tables, and columns. For example, report designers in a particular department can view only the subject areas that belong to their department when using Oracle BI Answers.
■ Presentation Catalog object security. This security mechanism provides security for objects stored in the Oracle BI Presentation Catalog, such as dashboards, dashboard pages, folders, and reports. Users can view only the objects for which they are authorized. For example, a mid-level manager may not be granted access to a dashboard containing summary information for an entire department.
■ Data level security. This security mechanism controls the type and amount of data that is available in a report. When multiple users run the same report, the results that are returned to each user depend on their access rights and roles in the organization. For example, a sales vice president sees results for all regions, while a sales representative for a particular region sees only data for that region.
The security mechanisms in Oracle BI applications can use security hierarchies defined in operational applications such as Siebel CRM applications, minimizing the need for Oracle Business Intelligence administrators to manage multiple security systems. It also allows a high degree of control over access to elements in Oracle BI applications.
Accessing Oracle BIThis section explains how to access and exit Oracle BI. It contains the following topics:
■ “Accessing an Oracle BI Application” on page 13
■ “Accessing Stand-Alone Oracle BI” on page 14
NOTE: Oracle BI requires that the internet browser is set to accept cookies. Oracle BI uses a cookie to track a user’s logged-on session.
Accessing an Oracle BI ApplicationDepending on the options in use at your organization, you may be able to access one or more Oracle BI applications in your operational application. The following procedure is an example of accessing Oracle BI in a Siebel CRM application. Your method of access may be different than the example.

Oracle Business Intelligence Answers, Delivers, and Interactive Dashboards User Guide Version 10.1.3.2
Getting Started with Oracle Business Intelligence ■ Accessing Oracle BI
14
To access Oracle BI in a Siebel CRM application■ Navigate to the Analytics tab for the application and click it.
The default dashboard for your role and responsibilities appears.
Figure 1 shows an example of a dashboard for an Oracle BI application.
Oracle BI applications are organized into dashboards and pages. Each dashboard contains one or more pages that display reports targeted to a specific business industry or group of users. Figure 1 shows an example Pipeline Analytics dashboard from an example Siebel Sales application. In Figure 1, the pages on the Pipeline Analytics dashboard are shown as tabs across the top of the dashboard.
Accessing Stand-Alone Oracle BITo access stand-alone Oracle BI, you use a URL, a user ID, and a password provided by your organization.
Figure 1. Sample Oracle BI Application Default Dashboard
Getting Started with Oracle Business Intelligence ■ Performing Common Tasks inOracle BI
Oracle Business Intelligence Answers, Delivers, and InteractiveDashboards User Guide Version 10.1.3.2
15
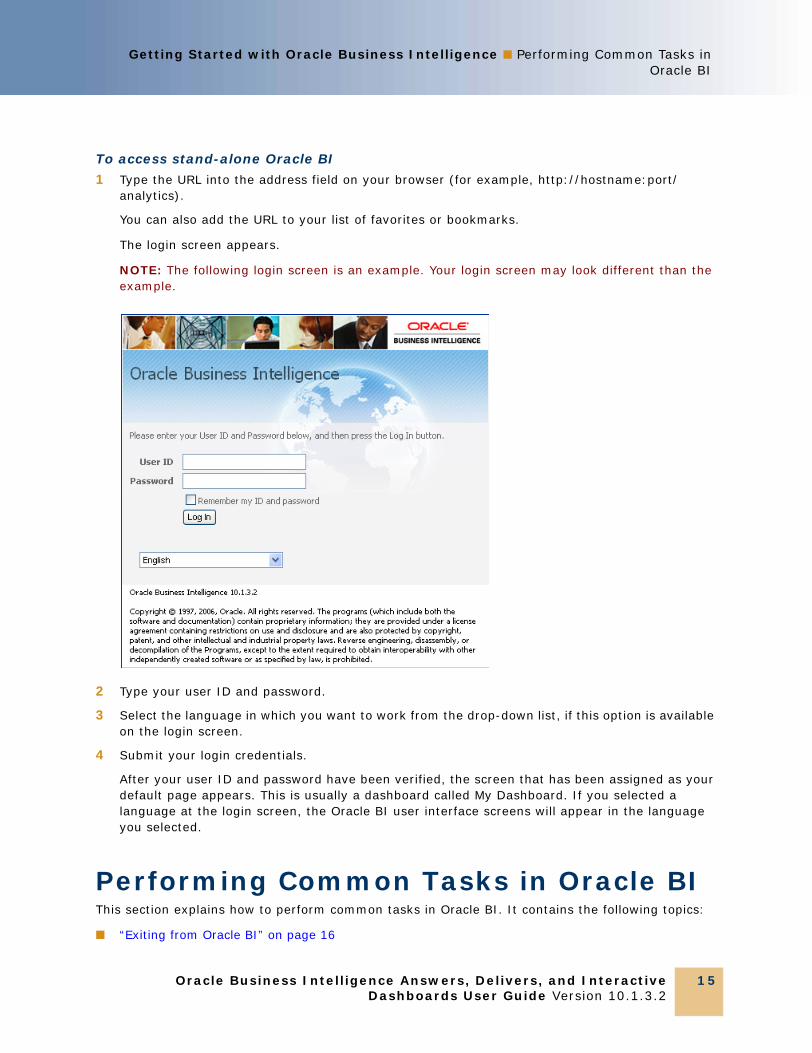
To access stand-alone Oracle BI
1 Type the URL into the address field on your browser (for example, http://hostname:port/analytics).
You can also add the URL to your list of favorites or bookmarks.
The login screen appears.
NOTE: The following login screen is an example. Your login screen may look different than the example.
2 Type your user ID and password.
3 Select the language in which you want to work from the drop-down list, if this option is available on the login screen.
4 Submit your login credentials.
After your user ID and password have been verified, the screen that has been assigned as your default page appears. This is usually a dashboard called My Dashboard. If you selected a language at the login screen, the Oracle BI user interface screens will appear in the language you selected.
Performing Common Tasks in Oracle BIThis section explains how to perform common tasks in Oracle BI. It contains the following topics:
■ “Exiting from Oracle BI” on page 16

Oracle Business Intelligence Answers, Delivers, and Interactive Dashboards User Guide Version 10.1.3.2
Getting Started with Oracle Business Intelligence ■ Performing Common Tasks in Oracle BI
16
■ “Viewing Descriptions of Oracle BI Dashboards and Saved Requests” on page 16
■ “Printing an Oracle BI Dashboard or Saved Request” on page 16
■ “Emailing an Oracle BI Dashboard Page or Request” on page 17
■ “Downloading Oracle BI Results” on page 17
■ “Refreshing an Oracle BI Interactive Dashboard or Oracle BI Request” on page 18
■ “Refreshing Information in the Oracle BI Selection Pane” on page 19
■ “Using a Write-Back Table in an Oracle BI Dashboard Page or Request” on page 19
Exiting from Oracle BIDo not close the browser window to exit from Oracle BI.
To exit from Oracle BI■ From any Oracle BI screen, click the Log Out link.
Viewing Descriptions of Oracle BI Dashboards and Saved RequestsReport and dashboard designers can supply a description when saving a dashboard or request in the Oracle BI Presentation Catalog. If no description is supplied, the description defaults to the name of the dashboard or saved request.
To view the description of a saved request■ Pause the cursor over the title of the saved request in the selection pane in Oracle BI Answers.
To view the description of a dashboard■ Pause the cursor over the name of the dashboard in Oracle BI Interactive Dashboards.
To view the description of a dashboard page, pause the cursor over the page tab.
Printing an Oracle BI Dashboard or Saved RequestYou can display printer-friendly versions of existing dashboards and requests. A printer-friendly version does not contain any extraneous links or other hypertext items.
You can print using HTML or Adobe PDF (Portable Document Format). Adobe PDF is the only print option available for Oracle BI Publisher reports. Adobe Reader 6.0 or greater is required to print using Adobe PDF.
NOTE: The HTML method of printing relies on the print handling capabilities of your browser. If you do not get the results you want, choose PDF to open and then print the dashboard or request.
Getting Started with Oracle Business Intelligence ■ Performing Common Tasks inOracle BI
Oracle Business Intelligence Answers, Delivers, and InteractiveDashboards User Guide Version 10.1.3.2
17
To print a dashboard or a request
1 Navigate to an existing dashboard or request.
2 To print a request, click the Print link, and then choose HTML or PDF. To print a dashboard page, locate and click the Print button at the bottom of the dashboard, and then choose HTML or PDF.
■ For HTML, a new window shows the selected item without the extraneous links.
Choose File > Print on the browser menu.
■ For PDF, use the options available in the Adobe PDF window to save or print the file.
Emailing an Oracle BI Dashboard Page or RequestYou can email a dashboard page or a request as an attachment. The format you use depends on your browser, such as Web Archive, Single File (.mht) in Internet Explorer or Mozilla Archive Format (.maf) in Mozilla and Firefox.
NOTE: The Mozilla Archive Format capability is available as a separately downloaded plug-in.
In any browser, you can also save a dashboard page or request as a collection of HTML files. You can then zip and email the corresponding directory of associated files.
To email a dashboard page or request
1 Navigate to the dashboard page or request that you want to send.
2 To email a request, click the Print link, and then choose HTML or PDF. To email a dashboard page, locate and click the Print button at the bottom of the dashboard, and then choose HTML or PDF
A new browser window opens that contains the dashboard page or the request.
3 From the browser’s toolbar, choose File > Save As.
4 Save the file to the desired location, with the appropriate file type for your browser.
5 Send the saved attachment using an email application.
NOTE: The saved attachments can also be used as a means to archive and restore requests as they exist at a particular point in time.
Downloading Oracle BI ResultsOracle BI provides options for downloading results. These appear in Oracle BI Answers as options for the Download link. The Download link can also appear with a request in a dashboard.
■ Download to Excel
This option makes the request results available to Microsoft Excel or Microsoft Excel 2000 in HTML format, including tables or charts that appear with the results. It also includes any other views included in the report. Excel controls the positioning of the HTML.

Oracle Business Intelligence Answers, Delivers, and Interactive Dashboards User Guide Version 10.1.3.2
Getting Started with Oracle Business Intelligence ■ Performing Common Tasks in Oracle BI
18
■ Download Data
This option downloads results as a tab-separated list of values. The file will have a .csv extension to facilitate opening it in Excel. After downloading a request in tab-delimited format, you can use a third-party application to display the data.
■ Download Web Page (MHTML)
This option downloads results as a Web page. This allows you to download the underlying data for an existing request as a Web page (MHTML) file.
To download results in Microsoft Excel format
1 Navigate to the request.
2 Click the Download link and choose either Download to Excel or Download to Excel 2000.
The File Download dialog box appears.
3 Save the file to the desired location, or open it in Excel.
4 If desired, use Excel to refine the formatted results.
For information, see your Excel documentation.
To download results as a tab-separated list of values
1 Navigate to the request.
2 Click the Download link and choose Download Data, and then save the file on your hard drive.
To download results as a Web page
1 Navigate to the request.
2 Click the Download link and choose Download Web Page (MHTML).
The File Download dialog box appears.
3 Save the file on your hard drive.
Refreshing an Oracle BI Interactive Dashboard or Oracle BI RequestWhen executing an Oracle BI Interactive Dashboard or a request, Oracle BI uses temporary storage areas, called caches, to save frequently accessed or recently accessed results. Storing certain results in cache helps to improve Oracle BI performance. You can use the Refresh feature to make sure that your request bypasses saved information in the Oracle BI Presentation Services cache and is issued to the Oracle Business Intelligence Server for processing.
NOTE: The Oracle BI Server maintains its own cache. This cache is separate from the Oracle BI Presentation Services cache.
Getting Started with Oracle Business Intelligence ■ Performing Common Tasks inOracle BI
Oracle Business Intelligence Answers, Delivers, and InteractiveDashboards User Guide Version 10.1.3.2
19
When you select a specific dashboard or request, Oracle BI Presentation Services checks its cache to determine if the identical results have recently been requested. If so, Oracle BI Presentation Services returns the most recent results, thereby avoiding unnecessary processing by the Oracle BI Server and the back-end database. If not, the request is issued to the Oracle BI Server for processing.
If the Oracle BI Server has cached results that can satisfy your request, the results are returned from that cache. If not, Oracle BI Server issues the request to the back-end database. You cannot force your request past the Oracle BI Server's cache.
Oracle BI administrators can configure cache settings for Oracle BI Presentation Services that control what is cached and for how long. For information, see Oracle Business Intelligence Presentation Services Administration Guide. For information about the Oracle BI Server cache, see Oracle Business Intelligence Server Administration Guide.
To refresh a dashboard or request
1 Navigate to an existing dashboard or request.
2 To refresh a request, click the Refresh link. To refresh a dashboard, click the Refresh button.
Refreshing Information in the Oracle BI Selection PaneThe Oracle BI selection pane appears in Oracle BI Answers and Oracle BI Delivers. When changes have been made to saved content or to the Oracle BI Server metadata, you can refresh the display to access the most current information.
NOTE: The information available in the selection pane is determined by your permissions and responsibilities.
To refresh the information in the selection pane■ To refresh the information for saved requests, filters, briefing books, and dashboard content,
click the Refresh Display link at the bottom of the selection pane.
■ To refresh the view of the Oracle BI Server metadata for subject areas, click the link Reload Server Metadata at the bottom of the selection pane.
Using a Write-Back Table in an Oracle BI Dashboard Page or RequestIf your user name has the appropriate permissions to write back to the back-end database, a write-back button appears below the table. You can then update or write to the back-end database using the write-back capability. For example, you can enter sales targets for the current quarter in a Sales dashboard.
To use a write-back table in a dashboard or request
1 Type a new value in the column box.
New values appear in bold type when you step off the box.

Oracle Business Intelligence Answers, Delivers, and Interactive Dashboards User Guide Version 10.1.3.2
Getting Started with Oracle Business Intelligence ■ Navigating in Oracle BI
20
2 Click the write-back button.
Navigating in Oracle BIThis section explains basic navigation within Oracle BI. It contains the following topics:
■ “What is Available to You After Accessing Oracle BI”
■ “Using Oracle BI Feature Links” on page 21
■ “Working with Oracle BI Pages” on page 22
■ “Drilling Down in Oracle BI” on page 22
What is Available to You After Accessing Oracle BIWhen you access Oracle BI, the first screen presented is usually your personal dashboard, named My Dashboard, or a dashboard for your job function. Dashboards typically contains reports and other information for your area of responsibility.
For more information about dashboards, see Chapter 8, “Using Oracle BI Interactive Dashboards.”
Getting Started with Oracle Business Intelligence ■ Navigating in Oracle BI
Oracle Business Intelligence Answers, Delivers, and InteractiveDashboards User Guide Version 10.1.3.2
21
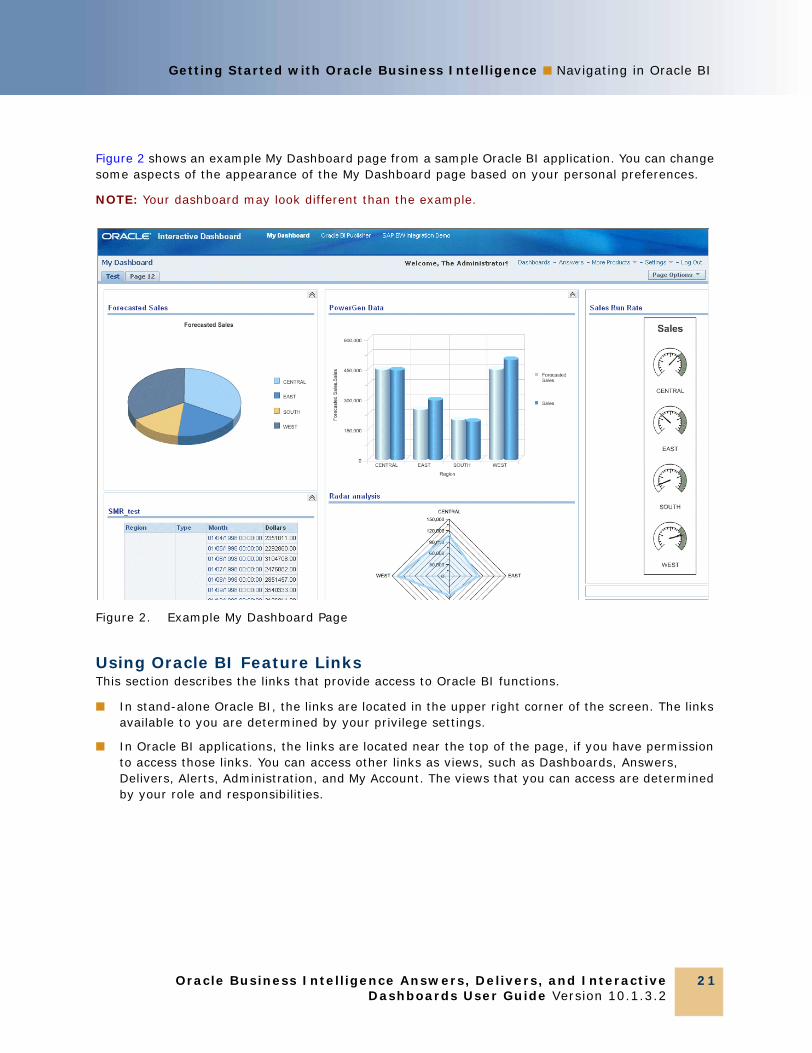
Figure 2 shows an example My Dashboard page from a sample Oracle BI application. You can change some aspects of the appearance of the My Dashboard page based on your personal preferences.
NOTE: Your dashboard may look different than the example.
Using Oracle BI Feature LinksThis section describes the links that provide access to Oracle BI functions.
■ In stand-alone Oracle BI, the links are located in the upper right corner of the screen. The links available to you are determined by your privilege settings.
■ In Oracle BI applications, the links are located near the top of the page, if you have permission to access those links. You can access other links as views, such as Dashboards, Answers, Delivers, Alerts, Administration, and My Account. The views that you can access are determined by your role and responsibilities.
Figure 2. Example My Dashboard Page

Oracle Business Intelligence Answers, Delivers, and Interactive Dashboards User Guide Version 10.1.3.2
Getting Started with Oracle Business Intelligence ■ Navigating in Oracle BI
22
Table 2 describes some of the Oracle BI feature links.
Working with Oracle BI PagesOracle BI is organized into pages. Pages have two components:
■ Panes. Both the Oracle BI Delivers and Oracle BI Answers pages display a left and a right pane. The left pane is the selection pane, used to navigate to, select, and manage saved information. The right pane is used to display and work with the content selected in the left pane.
■ Tabs. Tabs provide access to other pages related to the current page. The tabs appear in the top part of the page. The list of available tabs depends on which page you select.
Oracle BI feature links are used to access these pages. Each feature link provides access to a specific feature or topic. Pages can contain other organization and navigation elements, such as tabs, areas, and panes.
For information about feature links, see “Using Oracle BI Feature Links” on page 21.
Drilling Down in Oracle BIMany of the results that appear in Oracle BI represent hierarchical data structures. Oracle BI metadata specifies these hierarchies, and this allows you to access the different levels of detail within them. For example, information in a sales chart may be categorized by region. Clicking on a specific region in the chart may display each country within that region, if the country is the next level within the hierarchy of the metadata.
You can drill down to an actual item in the database. For example, if you work in sales, you can drill down to the city level within a sales report, and observe that there is a large sale pending in Paris. If you are using an Oracle Siebel operational application, you can then drill down on the pending sale and go directly to that opportunity in the Oracle BI application.
Table 2. Description of Oracle BI Feature Links
Link Description
Alerts! Accesses the Active Alerts page, from which you can view and manage your active alerts. This link appears only if you have active alerts.
Dashboards Accesses the Interactive Dashboard page, from which you can view the dashboards to which you have access.
Answers Accesses Oracle BI Answers, from which you can view, create, and manage requests.
More Products Accesses Oracle BI Publisher, Delivers, Marketing, and Disconnected Analytics.
Settings/My Account
The Settings link accesses the Oracle BI Presentation Services Administration page, the Act As page, and the My Account page. The My Account page enables you to view general account information and set your preferences for the Oracle BI application.
Log Out Used to log out of Oracle BI. Always use this link to log out of Oracle BI.

Getting Started with Oracle Business Intelligence ■ Using the Oracle BI My AccountPage
Oracle Business Intelligence Answers, Delivers, and InteractiveDashboards User Guide Version 10.1.3.2
23
Sorting Columns in Tables in Oracle BIIn a dashboard, the column headers of tables that can be sorted have a slightly raised visual appearance. You can click a column header to sort it.
Using the Oracle BI My Account PageFrom the My Account page in Oracle BI, you can perform the following actions:
■ View general account information, such as your display name and user ID.
■ View and modify your preferences.
■ Set your time zone.
■ View and modify your delivery options for Oracle BI Delivers iBots.
■ View a list of users who can access your reports and dashboards.
Depending on your privilege settings, not all of these options may be available.
To display your account settings
1 Navigate to Oracle BI.
2 Click Settings (if available), and the My Account link.
Your My Account page appears.
Setting Your Oracle BI PreferencesYou can access the Preferences section of the My Account page to specify preferences such as a default dashboard, your locale, and a language in which to view the user interface screens.
To change your preferences
1 Navigate to Oracle BI.
2 Click Settings (if available), and the My Account link.
3 In the Preferences section, perform one of the following actions:
■ In the Default Dashboard drop-down list, select the dashboard you want to display when you log in to Oracle BI.
■ In the Locale drop-down list, select the locale that you want to use for this session.
■ In the User Interface language drop-down list, select the language in which you want Oracle BI to appear.

Oracle Business Intelligence Answers, Delivers, and Interactive Dashboards User Guide Version 10.1.3.2
Getting Started with Oracle Business Intelligence ■ Using the Oracle BI My Account Page
24
Setting Your Oracle BI Time ZoneYou can use the time zone option to choose your Oracle BI account's preferred time zone. This option allows system users who do not reside in the same physical location to override the default time zone that was set by the system administrator. For example, suppose the Oracle BI server that sends you alerts resides in the US Pacific time zone, but your work location is in the US Central time zone. After you set the Central time zone as your preferred time zone setting, the delivered time on your alerts appears in Central time.
Your account's time zone will automatically apply to any items that you create, modify, run, receive, and print.
The date and time columns included in reports appear according to the report designer's specifications. The report designer can force a specific time zone to appear in the column, or allow the user's default time zone to appear in the column. A clock icon will appear in the column heading, and when you mouse over this icon, the name of the time zone used in the column is displayed.
For more information on how the administrator sets the Oracle BI Presentation Server’s time zone, see the Oracle Business Intelligence Presentation Services Administration Guide.
To change your time zone preference
1 Navigate to Oracle BI.
2 Click Settings (if available), and the My Account link.
3 In the preference section, select a time zone from the Time Zone dropdown box.
4 Click Finished.
Setting Your Oracle BI Delivery OptionsThe Delivery Options section of the My Account page allows you to add or modify the devices on which you receive notifications from Oracle BI Delivers.
NOTE: If devices or profiles have been preconfigured for you, do not change them without first consulting your Oracle BI administrator.
For more information about setting your delivery options, see “Configuring Your Oracle BI Delivers Devices, and Delivery Profiles” on page 186.

Oracle Business Intelligence Answers, Delivers, and InteractiveDashboards User Guide Version 10.1.3.2
25
3 Basics of Working with Requests in Oracle BI Answers
Oracle BI Answers is the Oracle BI interface used to query your organization’s data. The results of your request can be saved, organized, shared, and integrated with other content. This chapter provides an overview of Oracle BI Answers and provides the basic procedures used to create, modify, and administer requests. It contains the following topics:
■ “Overview of Oracle BI Answers” on page 25
■ “Example of an Oracle BI Answers Start Page” on page 27
■ “Using Oracle BI Answers to Create, Modify, and Save Requests” on page 28
■ “Embedding an Oracle BI Request in an Oracle BI Dashboard” on page 38
■ “Accessing and Working with an Oracle BI Request in Microsoft Excel” on page 39
■ “Integrating an Oracle BI Request with Microsoft Excel’s Internet Query Feature” on page 40
■ “Combining Oracle BI Request Criteria Using Set Operations” on page 41
■ “Examining or Editing the Logical SQL Generated for an Oracle BI Request” on page 42
■ “Executing a Direct Database Request in Oracle BI Answers” on page 43
■ “Using Variables to Display Values in Request Results, Dashboards and iBots” on page 44
Overview of Oracle BI AnswersOracle BI Answers provides answers to business questions. It allows you to explore and interact with information, and present and visualize information using charts, pivot tables, and reports. You can save, organize, and share the results.
Requests that you create with Oracle BI Answers can be saved in the Oracle BI Presentation Catalog and integrated into any Oracle BI home page or dashboard. Results can be enhanced through charting, result layout, calculation, and drilldown features.
Many features in Oracle BI Answers are self-explanatory, and definitions and summary information appear on each page. When more information is available than will fit on the page, a Help button appears. Click the button to see more detailed information.
Oracle Business Intelligence Answers, Delivers, and Interactive Dashboards User Guide Version 10.1.3.2
Basics of Working with Requests in Oracle BI Answers ■ Overview of Oracle BI Answers
26
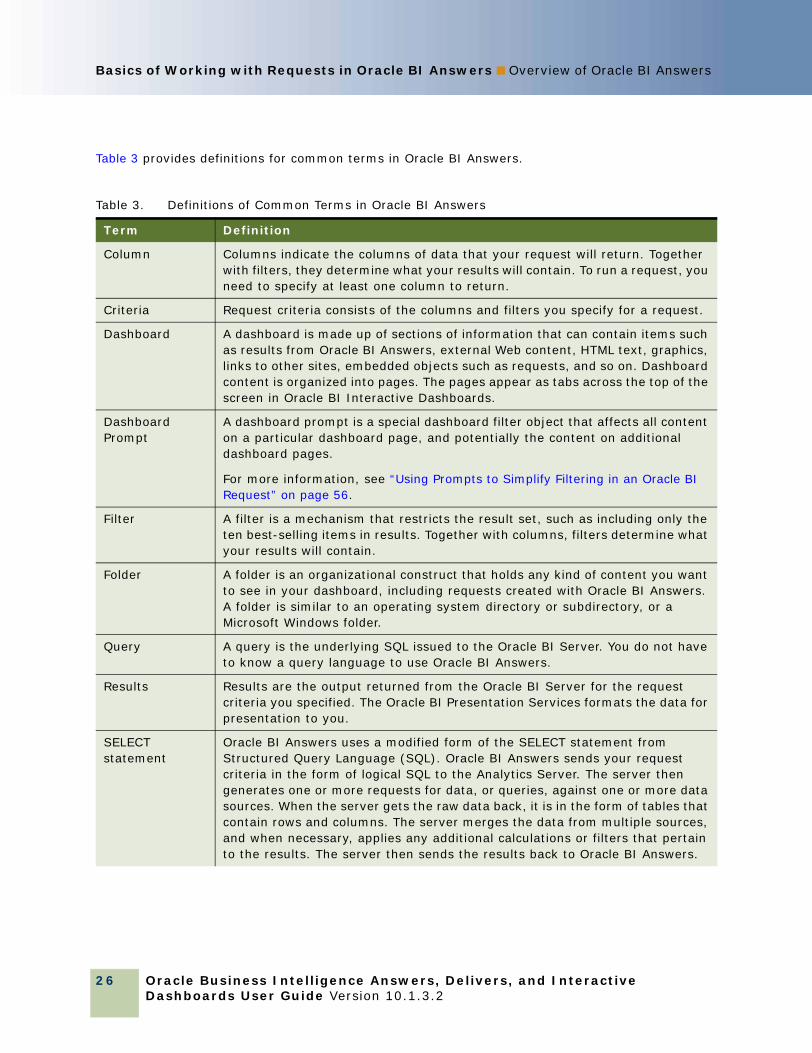
Table 3 provides definitions for common terms in Oracle BI Answers.
Table 3. Definitions of Common Terms in Oracle BI Answers
Term Definition
Column Columns indicate the columns of data that your request will return. Together with filters, they determine what your results will contain. To run a request, you need to specify at least one column to return.
Criteria Request criteria consists of the columns and filters you specify for a request.
Dashboard A dashboard is made up of sections of information that can contain items such as results from Oracle BI Answers, external Web content, HTML text, graphics, links to other sites, embedded objects such as requests, and so on. Dashboard content is organized into pages. The pages appear as tabs across the top of the screen in Oracle BI Interactive Dashboards.
Dashboard Prompt
A dashboard prompt is a special dashboard filter object that affects all content on a particular dashboard page, and potentially the content on additional dashboard pages.
For more information, see “Using Prompts to Simplify Filtering in an Oracle BI Request” on page 56.
Filter A filter is a mechanism that restricts the result set, such as including only the ten best-selling items in results. Together with columns, filters determine what your results will contain.
Folder A folder is an organizational construct that holds any kind of content you want to see in your dashboard, including requests created with Oracle BI Answers. A folder is similar to an operating system directory or subdirectory, or a Microsoft Windows folder.
Query A query is the underlying SQL issued to the Oracle BI Server. You do not have to know a query language to use Oracle BI Answers.
Results Results are the output returned from the Oracle BI Server for the request criteria you specified. The Oracle BI Presentation Services formats the data for presentation to you.
SELECT statement
Oracle BI Answers uses a modified form of the SELECT statement from Structured Query Language (SQL). Oracle BI Answers sends your request criteria in the form of logical SQL to the Analytics Server. The server then generates one or more requests for data, or queries, against one or more data sources. When the server gets the raw data back, it is in the form of tables that contain rows and columns. The server merges the data from multiple sources, and when necessary, applies any additional calculations or filters that pertain to the results. The server then sends the results back to Oracle BI Answers.

Basics of Working with Requests in Oracle BI Answers ■ Example of an Oracle BIAnswers Start Page
Oracle Business Intelligence Answers, Delivers, and InteractiveDashboards User Guide Version 10.1.3.2
27
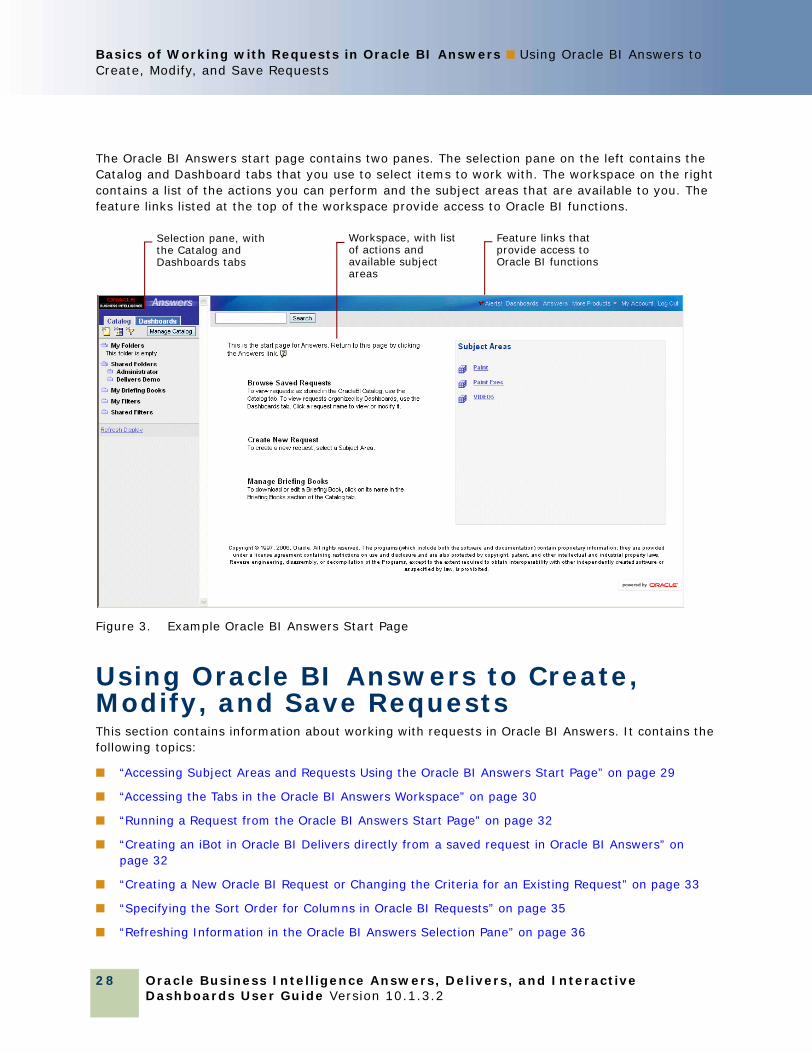
Example of an Oracle BI Answers Start PageFigure 3 shows an example of an Oracle BI Answers start page. This is the first Oracle BI Answers page you see when clicking the Answers link (or accessing Answers from the site map if you have an Oracle BI application).
Subject Area Oracle BI presents data in subject areas. A subject area contains columns that represent information about the areas of your organization’s business, or about groups of users within your organization.
Subject areas have names that correspond to the types of information they contain, for example, Marketing Contracts, Service Requests, and Orders. Columns also have names that indicate the types of information they contain, such as Account and Contact.
Presentation Catalog
The Oracle BI Presentation Catalog stores content created with Oracle BI Answers and Oracle BI Interactive Dashboards. Content can be organized into folders that are either shared or personal. Types of content that can be stored in the Presentation Catalog include requests created with Oracle BI Answers, HTML content, and links to other images, documents, and sites.
Table 3. Definitions of Common Terms in Oracle BI Answers
Term Definition
Oracle Business Intelligence Answers, Delivers, and Interactive Dashboards User Guide Version 10.1.3.2
Basics of Working with Requests in Oracle BI Answers ■ Using Oracle BI Answers to Create, Modify, and Save Requests
28
The Oracle BI Answers start page contains two panes. The selection pane on the left contains the Catalog and Dashboard tabs that you use to select items to work with. The workspace on the right contains a list of the actions you can perform and the subject areas that are available to you. The feature links listed at the top of the workspace provide access to Oracle BI functions.
Using Oracle BI Answers to Create, Modify, and Save RequestsThis section contains information about working with requests in Oracle BI Answers. It contains the following topics:
■ “Accessing Subject Areas and Requests Using the Oracle BI Answers Start Page” on page 29
■ “Accessing the Tabs in the Oracle BI Answers Workspace” on page 30
■ “Running a Request from the Oracle BI Answers Start Page” on page 32
■ “Creating an iBot in Oracle BI Delivers directly from a saved request in Oracle BI Answers” on page 32
■ “Creating a New Oracle BI Request or Changing the Criteria for an Existing Request” on page 33
■ “Specifying the Sort Order for Columns in Oracle BI Requests” on page 35
■ “Refreshing Information in the Oracle BI Answers Selection Pane” on page 36
Figure 3. Example Oracle BI Answers Start Page
Feature links that provide access to Oracle BI functions
Selection pane, with the Catalog and Dashboards tabs
Workspace, with list of actions and available subject areas

Basics of Working with Requests in Oracle BI Answers ■ Using Oracle BI Answers toCreate, Modify, and Save Requests
Oracle Business Intelligence Answers, Delivers, and InteractiveDashboards User Guide Version 10.1.3.2
29
■ “Viewing and Working with Oracle BI Answers Results” on page 37
■ “Saving an Oracle BI Request to a Personal or Shared Folder” on page 37
■ “Saving Oracle BI Reports to a Lotus Notes Database” on page 38
NOTE: For information about working with Briefing Books, see “Working with Oracle BI Briefing Books” on page 224.
Accessing Subject Areas and Requests Using the Oracle BI Answers Start PageThe Oracle BI Answers start page provides access to subject areas and saved requests.
NOTE: What you see in Oracle BI Answers depends on the permissions granted to your user ID, so you may not see everything that is described in this section.
The start page has two main areas:
■ Selection pane. The selection pane, located on the left side of the screen, shows content saved in the Presentation Catalog, such as personal and shared requests and filters, and your briefing books (if your organization licensed this feature).
■ Workspace. The workspace, located to the right of the selection pane, initially shows the subject areas you can work with to create requests.
When you make a selection from the selection pane, such as clicking a saved request, your selection appears in the workspace so you can work with it.
When you click a subject area in the workspace to create a new request, the selection pane changes to show the columns and filters for that subject area that you can include in a request, and the workspace displays the tabs for working with requests.
To view saved requests organized by dashboard
1 Access Oracle BI and click the Dashboard tab.
2 Click the Dashboard tab in the selection pane.
To view saved requests as stored in the Presentation Catalog
1 Access Oracle BI and click the Answers link.
2 Click the Catalog tab in the selection pane.

Oracle Business Intelligence Answers, Delivers, and Interactive Dashboards User Guide Version 10.1.3.2
Basics of Working with Requests in Oracle BI Answers ■ Using Oracle BI Answers to Create, Modify, and Save Requests
30
To search for a saved request■ Type all or part of its name into the Search text box, and then click the Search button.
Search results are listed in the workspace.
NOTE: If you use a backslash character (\) in an iBot name (for example Na\me), the search string used to find it must contain an additional backslash (called an escape character). For example, an iBot called Na\me would require the search string Na\\me, to retrieve details for that iBot. Without the additional backslash an error message is displayed.
To return to the Oracle BI Answers start page■ Click the Answers link from anywhere within Oracle BI.
Accessing the Tabs in the Oracle BI Answers WorkspaceThe Oracle BI Answers workspace displays the following tabs for working with a request:
■ Criteria tab. This tab provides access to the columns selected for the request, and buttons to access the most common view types.
■ Results tab. This tab allows you to work with the results of the request.
■ Prompts tab. This tab allows you to create prompts to filter the request.
■ Advanced tab. This tab allows advanced users to work with the XML and logical SQL for the request.
Each tab contains on-screen information and buttons to help you create, access, and manage requests. On each tab, you can pause your mouse over each button for a description of what it does. Table 4 on page 31 provides additional information about each tab.
To access the tabs in the Oracle BI Answers Workspace■ Click a subject area to create a new request, or modify a saved request.
The workspace displays the tabs for working with the request.

Basics of Working with Requests in Oracle BI Answers ■ Using Oracle BI Answers toCreate, Modify, and Save Requests
Oracle Business Intelligence Answers, Delivers, and InteractiveDashboards User Guide Version 10.1.3.2
31
Table 4 describes the tabs in the Oracle BI Answers workspace.
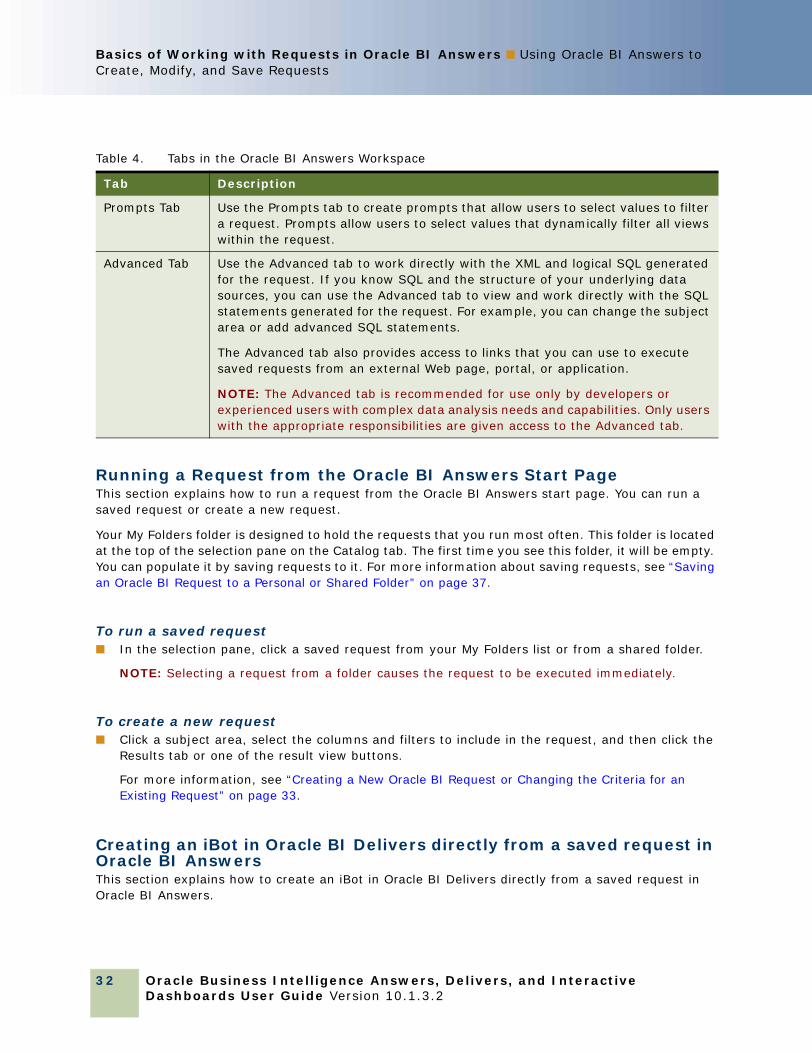
Table 4. Tabs in the Oracle BI Answers Workspace
Tab Description
Criteria Tab Use the Criteria tab to view or change the columns and filters for the request. You can specify the order in which the results should be returned, column subtotals, formatting (such as headings and number of decimal places), and column formulas (such as adding a Rank or Percentile function). You can also add or modify column filters.
Four common views are available from this tab by clicking the appropriate view button:
Displays the compound layout view, where you can combine individual views and arrange them for display on a dashboard.
Displays the table view, where you can show results in a table.
Displays the chart view, where you can show results in different kinds of charts.
Displays the pivot table view, where you can take row, column, and section headings and swap them around to obtain different perspectives.
Results Tab Use the Results tab to work with the results of a request, and create different views of the results such as charts, tickers, and pivot tables. You can add a variety of views, including charts and pivot tables that show the data, plain or formatted text that describes the results, HTML, and more.
The default results view is a simple table with a title. Your Oracle Business Intelligence Presentation Services administrator may have configured a different default results view for your organization.
You can combine views and position them anywhere on the page. For example, you can create side-by-side pivot tables that reflect different views of the data, charts that allow you to explore interrelationships in depth, and filters that limit the results. If the request is embedded in a dashboard, the dashboard page can also include links to additional requests of interest, related graphics, news stories, and so on.
Oracle Business Intelligence Answers, Delivers, and Interactive Dashboards User Guide Version 10.1.3.2
Basics of Working with Requests in Oracle BI Answers ■ Using Oracle BI Answers to Create, Modify, and Save Requests
32
Running a Request from the Oracle BI Answers Start PageThis section explains how to run a request from the Oracle BI Answers start page. You can run a saved request or create a new request.
Your My Folders folder is designed to hold the requests that you run most often. This folder is located at the top of the selection pane on the Catalog tab. The first time you see this folder, it will be empty. You can populate it by saving requests to it. For more information about saving requests, see “Saving an Oracle BI Request to a Personal or Shared Folder” on page 37.
To run a saved request■ In the selection pane, click a saved request from your My Folders list or from a shared folder.
NOTE: Selecting a request from a folder causes the request to be executed immediately.
To create a new request■ Click a subject area, select the columns and filters to include in the request, and then click the
Results tab or one of the result view buttons.
For more information, see “Creating a New Oracle BI Request or Changing the Criteria for an Existing Request” on page 33.
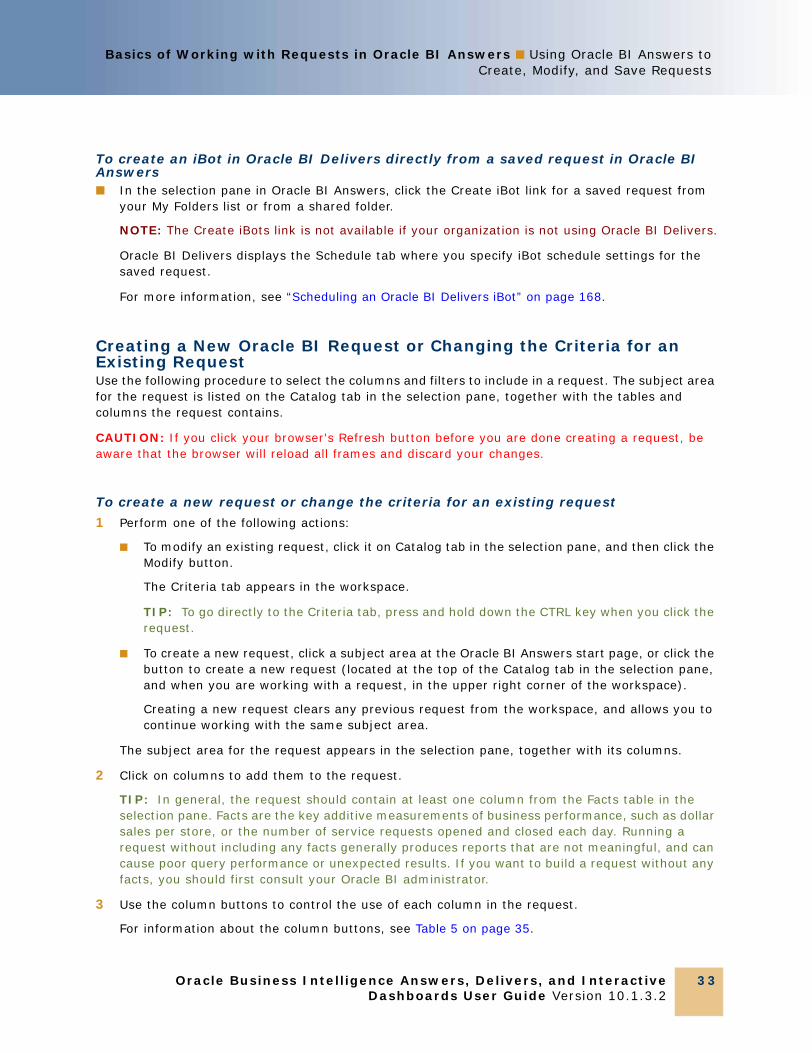
Creating an iBot in Oracle BI Delivers directly from a saved request in Oracle BI AnswersThis section explains how to create an iBot in Oracle BI Delivers directly from a saved request in Oracle BI Answers.
Prompts Tab Use the Prompts tab to create prompts that allow users to select values to filter a request. Prompts allow users to select values that dynamically filter all views within the request.
Advanced Tab Use the Advanced tab to work directly with the XML and logical SQL generated for the request. If you know SQL and the structure of your underlying data sources, you can use the Advanced tab to view and work directly with the SQL statements generated for the request. For example, you can change the subject area or add advanced SQL statements.
The Advanced tab also provides access to links that you can use to execute saved requests from an external Web page, portal, or application.
NOTE: The Advanced tab is recommended for use only by developers or experienced users with complex data analysis needs and capabilities. Only users with the appropriate responsibilities are given access to the Advanced tab.
Table 4. Tabs in the Oracle BI Answers Workspace
Tab Description
Basics of Working with Requests in Oracle BI Answers ■ Using Oracle BI Answers toCreate, Modify, and Save Requests
Oracle Business Intelligence Answers, Delivers, and InteractiveDashboards User Guide Version 10.1.3.2
33
To create an iBot in Oracle BI Delivers directly from a saved request in Oracle BI Answers■ In the selection pane in Oracle BI Answers, click the Create iBot link for a saved request from
your My Folders list or from a shared folder.
NOTE: The Create iBots link is not available if your organization is not using Oracle BI Delivers.
Oracle BI Delivers displays the Schedule tab where you specify iBot schedule settings for the saved request.
For more information, see “Scheduling an Oracle BI Delivers iBot” on page 168.
Creating a New Oracle BI Request or Changing the Criteria for an Existing Request Use the following procedure to select the columns and filters to include in a request. The subject area for the request is listed on the Catalog tab in the selection pane, together with the tables and columns the request contains.
CAUTION: If you click your browser's Refresh button before you are done creating a request, be aware that the browser will reload all frames and discard your changes.
To create a new request or change the criteria for an existing request
1 Perform one of the following actions:
■ To modify an existing request, click it on Catalog tab in the selection pane, and then click the Modify button.
The Criteria tab appears in the workspace.
TIP: To go directly to the Criteria tab, press and hold down the CTRL key when you click the request.
■ To create a new request, click a subject area at the Oracle BI Answers start page, or click the button to create a new request (located at the top of the Catalog tab in the selection pane, and when you are working with a request, in the upper right corner of the workspace).
Creating a new request clears any previous request from the workspace, and allows you to continue working with the same subject area.
The subject area for the request appears in the selection pane, together with its columns.
2 Click on columns to add them to the request.
TIP: In general, the request should contain at least one column from the Facts table in the selection pane. Facts are the key additive measurements of business performance, such as dollar sales per store, or the number of service requests opened and closed each day. Running a request without including any facts generally produces reports that are not meaningful, and can cause poor query performance or unexpected results. If you want to build a request without any facts, you should first consult your Oracle BI administrator.
3 Use the column buttons to control the use of each column in the request.
For information about the column buttons, see Table 5 on page 35.

Oracle Business Intelligence Answers, Delivers, and Interactive Dashboards User Guide Version 10.1.3.2
Basics of Working with Requests in Oracle BI Answers ■ Using Oracle BI Answers to Create, Modify, and Save Requests
34
4 To reorder columns in the workspace, drag and drop a column name from its current location to another location.
5 To preview the results, perform any of the following actions:
■ Click one of the result view buttons for a table, chart, or pivot table near the top of the workspace.
■ Click the preview button to see how results will look on the dashboard:
NOTE: If the preview button is not available, your Oracle BI Presentation Services administrator has suppressed its display.
■ Click the Results tab and choose a view from the drop-down list.
6 To save the request, perform one of the following actions:
■ Click the Save Request button.
For more information, see “Saving an Oracle BI Request to a Personal or Shared Folder” on page 37.
■ Click the Save and Schedule button to save the request in Oracle BI Answers, and create an iBot in Oracle BI Delivers for the saved request.
NOTE: The Save and Schedule button is not available if your organization is not using Oracle BI Delivers.
Oracle BI Delivers displays the Schedule tab for the new iBot.
For more information, see “Scheduling an Oracle BI Delivers iBot” on page 168.
Basics of Working with Requests in Oracle BI Answers ■ Using Oracle BI Answers toCreate, Modify, and Save Requests
Oracle Business Intelligence Answers, Delivers, and InteractiveDashboards User Guide Version 10.1.3.2
35
Specifying the Sort Order for Columns in Oracle BI RequestsIn Oracle BI Answers, you can specify the sort order for one or more columns that appear in a request. When you click the Order By button, it shows a new image to indicate the sort order that the selected column will apply to the results.
To sort a request based on columns in Oracle BI Answers
1 In Oracle BI Answers, display the request with which you want to work.
2 Click the Order By button for the column you want to sort by.
The button changes to indicate the sort order.
3 Continue clicking the Order By button until the sort order you want appears.
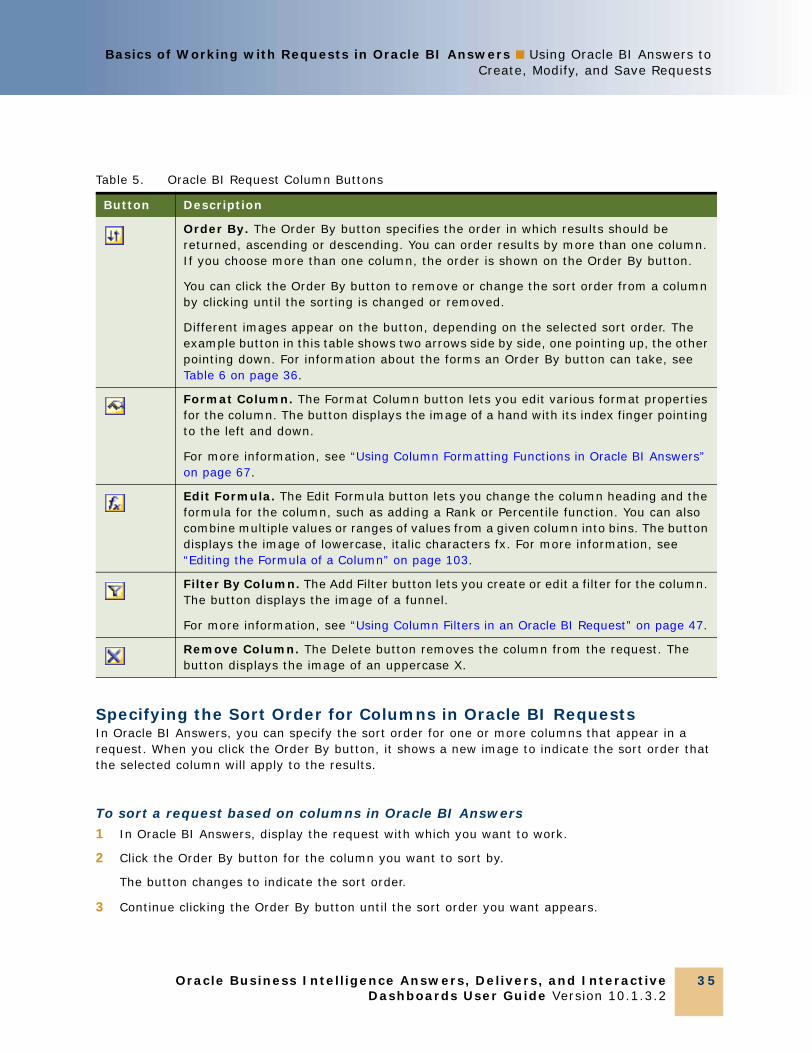
Table 5. Oracle BI Request Column Buttons
Button Description
Order By. The Order By button specifies the order in which results should be returned, ascending or descending. You can order results by more than one column. If you choose more than one column, the order is shown on the Order By button.
You can click the Order By button to remove or change the sort order from a column by clicking until the sorting is changed or removed.
Different images appear on the button, depending on the selected sort order. The example button in this table shows two arrows side by side, one pointing up, the other pointing down. For information about the forms an Order By button can take, see Table 6 on page 36.
Format Column. The Format Column button lets you edit various format properties for the column. The button displays the image of a hand with its index finger pointing to the left and down.
For more information, see “Using Column Formatting Functions in Oracle BI Answers” on page 67.
Edit Formula. The Edit Formula button lets you change the column heading and the formula for the column, such as adding a Rank or Percentile function. You can also combine multiple values or ranges of values from a given column into bins. The button displays the image of lowercase, italic characters fx. For more information, see “Editing the Formula of a Column” on page 103.
Filter By Column. The Add Filter button lets you create or edit a filter for the column. The button displays the image of a funnel.
For more information, see “Using Column Filters in an Oracle BI Request” on page 47.
Remove Column. The Delete button removes the column from the request. The button displays the image of an uppercase X.

Oracle Business Intelligence Answers, Delivers, and Interactive Dashboards User Guide Version 10.1.3.2
Basics of Working with Requests in Oracle BI Answers ■ Using Oracle BI Answers to Create, Modify, and Save Requests
36
Table 6 describes the available sort orders and the images on the Order By button that represent them.
Refreshing Information in the Oracle BI Answers Selection PaneWhen changes have been made to saved content or to the Oracle BI Server metadata, you can refresh the display to see the most current information.
To refresh information in the selection pane for saved requests, filters, briefing books, and dashboard content■ Click the following link at the bottom of the selection pane:
Refresh Display
To refresh information in the selection pane for the view of the Oracle BI Server metadata for subject areas■ Click the following link at the bottom of the selection pane:
Reload Server Metadata
Table 6. Forms of the Oracle BI Answers Order By Button
Form Description
The image of two arrows—one pointing up, the other pointing down—indicates that the selected column will not be used to sort the results.
The image of an up arrow indicates that the results will be sorted in ascending order, using the items in the selected column.
A number that appears on an Order By button indicates that the column is not the primary sort column applied to the results. The number corresponds to when the sort order is applied.
In this example, which shows an up arrow with the number two, the column is used as the second sort order column. The up arrow indicates that the results are sorted in ascending order, using the items in the selected column.
The image of a down arrow indicates that the results will be sorted in descending order, using the items in the selected column.
A number that appears on a Order By button indicates that the column is not the primary sort column applied to the results. The number that appears corresponds to when the sort order is applied.
In this example, which shows a down arrow with the number two, the column is used as the second sort order column. The down arrow indicates that the results are sorted in descending order, using the items in the selected column.

Basics of Working with Requests in Oracle BI Answers ■ Using Oracle BI Answers toCreate, Modify, and Save Requests
Oracle Business Intelligence Answers, Delivers, and InteractiveDashboards User Guide Version 10.1.3.2
37
Viewing and Working with Oracle BI Answers ResultsThe following procedure explains how to view and work with basic Oracle BI Answers results.
To view and work with the results
1 Click the Results tab.
The results appear in the workspace, in a table.
2 (Optional) Perform one or more of the following actions:
■ To page forward and backward through the results, use the paging buttons at the bottom of the page.
NOTE: The paging buttons appear only when two or more pages of results are present.
■ To edit the criteria used in the request, click the Criteria tab or the option to show header toolbars.
■ To add prompts to the request, click the Prompts tab.
■ To edit the XML or logical SQL for a request, click the Advanced tab.
NOTE: The Advanced tab is for advanced users and developers only. Only users with the appropriate responsibilities are given access to the Advanced tab. For more information, see “Examining or Editing the Logical SQL Generated for an Oracle BI Request” on page 42.
■ To add grand totals or column totals to a result, use the table or pivot table view:
❏ To add grand totals, click the Grand Totals button at the top of the workspace.
❏ To add totals for an individual column, click the Total By button for that column.
NOTE: The Total By button is available only for columns that can be totaled.
Saving an Oracle BI Request to a Personal or Shared FolderWhen you save a request in one of your personal folders, only you can access it. When you save it in a shared folder, users with permission to access that folder can access it too.
Your top-level personal folder is called My Folder. Every user with a unique user name has a folder called My Folder. This is designed to hold the requests that you run most often, and other content that you access frequently.
When you click the Refresh Display link at the bottom of the selection pane, the request is listed under the folder in which you saved it.
To save a request to a personal or shared folder
1 Click the Save Request button.
The Choose Folder dialog box appears.
2 Choose a personal or shared folder in which to save the request.
To specify a subfolder, perform one of the following actions:
Oracle Business Intelligence Answers, Delivers, and Interactive Dashboards User Guide Version 10.1.3.2
Basics of Working with Requests in Oracle BI Answers ■ Embedding an Oracle BI Request in an Oracle BI Dashboard
38
■ Navigate to it.
■ Click Create Folder to create a new subfolder.
■ Type the path in the Folder box.
3 Type a descriptive name for the request.
The name will appear when a user pauses the mouse on the request in the selection pane.
4 (Optional) Type a description for the request.
Descriptions are displayed when Oracle BI administrators use the Oracle Business Intelligence Catalog Manager.
5 Click OK.
Saving Oracle BI Reports to a Lotus Notes DatabaseThere are two approaches to adding Oracle BI reports to a Lotus Notes database:
■ Save the report to a Web archive file (file extension .mht), and then upload the file to the Lotus Note database.
■ Schedule the report using Oracle BI Delivers to be emailed automatically to a specific address on a Lotus Notes server. The Lotus Notes server can then process the email and write it to the database.
Related Topics“Overview of Oracle BI Answers” on page 25
“About Oracle BI Views” on page 85
“Performing Common Tasks When Working with Oracle BI Views” on page 91
“Accessing and Working with an Oracle BI Request in Microsoft Excel” on page 39
“Integrating an Oracle BI Request with Microsoft Excel’s Internet Query Feature” on page 40
Embedding an Oracle BI Request in an Oracle BI DashboardEmbedding a request in a dashboard causes it to execute automatically and display the results within the dashboard. This provides access to current results. For example, if you are a sales executive whose company captures sales data on a daily basis, you might want to have the dollar volume of product that was sold today appear on the front page of your dashboard.
Depending on how your organization implements caching, Oracle BI Answers uses the most efficient method to obtain results; either from the cache, or by running the request again and caching the results again.
You can embed saved requests by using the Dashboard Editor. For information about the Dashboard Editor, see “Adding Content to an Oracle BI Interactive Dashboard” on page 196.

Basics of Working with Requests in Oracle BI Answers ■ Accessing and Working withan Oracle BI Request in Microsoft Excel
Oracle Business Intelligence Answers, Delivers, and InteractiveDashboards User Guide Version 10.1.3.2
39
Accessing and Working with an Oracle BI Request in Microsoft ExcelIf your organization uses the Oracle BI Microsoft Excel add-in, you can open saved requests and work with the results from within Microsoft Excel. The add-in adds an Oracle BI toolbar to your Excel application that allows you to navigate to a request saved in the Oracle BI Presentation catalog, open it in Microsoft Excel, and work with, save, and refresh the results.
NOTE: You may not be able to download results into an Excel spreadsheet if your organization is using certain security features. For more information, contact your Oracle BI administrator.
Using the Oracle BI Toolbar in Microsoft ExcelThis section explains how to use the Oracle BI toolbar in Microsoft Excel. Figure 4 shows an example of the Oracle BI toolbar, in US English.
When you first access a saved request in Microsoft Excel, you are prompted for your Oracle BI Presentation Services user ID and password. You can instruct Microsoft Excel to include your Oracle BI user ID and password with your saved Excel workbook so you do not have to supply your login credentials each time you access the workbook. If the workbook is shared by other users, you would not typically instruct Excel to save your login credentials.
When you open a saved request in Microsoft Excel, you can choose from two data formats:
■ Unformatted Data
This format is the data view of the criteria for the request. The data view shows the underlying request data only, exclusive of any report formatting that was applied or any views that were assembled using the compound layout view in Oracle BI Answers. You can use Excel functions to add additional rows and columns, such as dividing one value by another value.
■ Formatted Results
This format shows the Microsoft Excel version of the compound layout view assembled for the request in Oracle BI Answers. This format includes items that are compatible with Microsoft Excel such as column formatting, grand totals, and views included in the compound layout view.
NOTE: Any Oracle BI Chart views for the request cannot be included in the Formatted Results view in Microsoft Excel.
You can save Microsoft Excel workbooks that contain Oracle BI content using Excel’s save functions.
The following procedures provide the steps to perform various functions using the Oracle BI toolbar.
To open a saved request from within Microsoft Excel
1 Click the Select Analysis button on the Oracle BI toolbar.
Figure 4. Example of the Oracle BI Toolbar in Microsoft Excel
Oracle Business Intelligence Answers, Delivers, and Interactive Dashboards User Guide Version 10.1.3.2
Basics of Working with Requests in Oracle BI Answers ■ Integrating an Oracle BI Request with Microsoft Excel’s Internet Query Feature
40
2 Type your user ID and password and click the log in button to submit your login credentials.
A window appears from which you can select a saved request from the Oracle BI Presentation Catalog. The window shows you your personal content and shared content to which you have access.
3 Navigate to the saved request, click it to select it, and click OK.
The additional options dialog box appears.
4 Make your selection for the data format.
5 To allow Microsoft Excel to include your login credentials with the saved Excel workbook, select the option to remember your user ID and password.
6 Click Continue.
The request appears within Microsoft Excel.
To refresh Oracle BI data included in a Microsoft Excel workbook■ Perform one of the following actions:
■ Click the Refresh All button on the Oracle BI toolbar.
■ Right-click in the data area and select the Refresh Data option.
Integrating an Oracle BI Request with Microsoft Excel’s Internet Query FeatureIntegrating an Oracle BI Answers data request with Excel's Internet Query (IQY) feature allows you to run the request from within Excel. This feature can be useful for printing and distributing reports.
When the IQY file is opened in Excel, you are prompted to enter your Oracle BI user ID and password. (You must have a nonblank password.) Then, the results of the saved request are retrieved and placed in an Excel spreadsheet. You can save the Excel spreadsheet so that the data can be refreshed directly from within Excel.
NOTE: You may not be able to download results into an Excel spreadsheet if your organization is using certain security features. For more information, contact your Oracle BI administrator.
By default, Excel prompts you to enter your user ID and password each time the query is refreshed. Alternatively, you can save your user ID and password within the spreadsheet. Consult your Excel documentation for details.
NOTE: You can integrate requests into Excel's IQY feature only with results that appear in one or more table or pivot table views. Other view types are not supported.
To integrate an Oracle BI request with Excel's IQY feature
1 Save a request with one or more table or pivot table views.
Basics of Working with Requests in Oracle BI Answers ■ Combining Oracle BI RequestCriteria Using Set Operations
Oracle Business Intelligence Answers, Delivers, and InteractiveDashboards User Guide Version 10.1.3.2
41
2 At the Advanced tab in Oracle BI Answers, click the link to generate and download a Web Query file.
3 Save the file to the desired location.
After opening the file in Excel, you can modify it, specify additional formatting, enhance it with charts, and so on. For information, see your Excel documentation.
Combining Oracle BI Request Criteria Using Set OperationsAfter you have selected a subject area and added columns to a request, you can combine criteria from one or more subject areas using Set operations. This action combines the results of two or more requests into a single result.
NOTE: The number and data types of the columns selected in each component request must be the same. The column lengths can differ.
The following table lists the Set operators and describes their effects on results.
To combine the results of multiple Oracle BI requests
1 Select a subject area and add columns to the request at the Criteria tab in Oracle BI Answers.
2 At the Criteria tab, click the following button:
Combine with Similar Request
The Subject Area dialog box appears.
3 Select a subject area that contains the data you want to combine with the selections you made in Step 1.
The subject area can be the same as that selected in Step 1, or a different subject area.
The Set Operations page appears.
4 Follow the on-screen instructions to construct the combined request.
5 Click the Union button and select the operation type, and select columns from the selection pane to combine with the first request.
Set Operator Effect on Results
Union Returns nonduplicate rows from all requests.
Union All Returns all rows from all requests, including duplicate rows.
Intersect Returns rows that are common to all requests.
Minus Returns rows from the first request that are not in the other requests.
Oracle Business Intelligence Answers, Delivers, and Interactive Dashboards User Guide Version 10.1.3.2
Basics of Working with Requests in Oracle BI Answers ■ Examining or Editing the Logical SQL Generated for an Oracle BI Request
42
Examining or Editing the Logical SQL Generated for an Oracle BI RequestThis section explains how to examine or edit the SQL or XML generated for a request.
NOTE: This procedure is only for advanced users and developers that have the appropriate responsibilities to access the Advanced tab. It is assumed that you know advanced SQL, have expertise working with the Oracle BI Server metadata, are familiar with the SQL information in Oracle Business Intelligence Server Administration Guide, and understand the content and structure of the underlying data sources.
For example, you can edit the logical SQL for a request when the underlying presentation objects have been changed, instead of re-creating the request.
The Advanced tab also provides access to links that you can use to execute saved requests from an external Web page, portal, or application, or download the results into Microsoft Excel. The section Referencing the Results contains the links and provides instructions to use them.
NOTE: You may not be able to download results if your organization is using certain security features. For more information, contact your Oracle BI administrator.
To examine or edit the XML or SQL generated for a request
1 In Oracle BI Answers, create or modify a request and click the Advanced tab.
The proposed XML and logical SQL appear for the request.
2 Use the Advanced SQL Clauses section following the proposed SQL to change the subject area, add GROUP BY or HAVING clauses, and specify DISTINCT processing.
3 To combine this request with a similar request from the same subject area or another subject area, where you can perform Set operations such as UNION or INTERSECT on the results, click the following button on the Criteria tab:
Combine with Similar Request
If you want to edit the SQL or XML directly, continue with the following steps.
CAUTION: When you click the Set SQL button in the next step, be aware that the Criteria tab for this request may no longer be accessible.
4 If you want to modify the SQL, read the preceding caution statement, make your modifications to the SQL directly in the Edit window, and then click the Set SQL button.
CAUTION: Requests are stored in the Presentation Catalog in XML format. If you change the XML in the following step, you are changing the request in the Presentation Catalog.
5 If you want to modify the XML, read the preceding caution statement, make your modifications to the XML directly in the Edit window, and then click the Set XML button.
Basics of Working with Requests in Oracle BI Answers ■ Executing a Direct DatabaseRequest in Oracle BI Answers
Oracle Business Intelligence Answers, Delivers, and InteractiveDashboards User Guide Version 10.1.3.2
43
Executing a Direct Database Request in Oracle BI AnswersUsers with the appropriate permissions can create and issue a direct database request directly to a physical back-end database. The results of the request can be displayed and manipulated within Oracle BI Answers, and subsequently incorporated into Oracle BI Interactive Dashboards and Oracle BI Delivers.
The following permission settings in Oracle BI Presentation Services administration control whether you can create and issue physical requests:
■ Edit Direct Database Requests
If this permission is set for you, you can create direct database requests. By default, this permission is set only for users defined as Oracle BI Presentation Services administrators.
■ Execute Direct Database Requests
If this permission is set for you, you can issue physical requests. By default, this permission is not enabled for anyone. It can be changed by an Oracle BI Presentation Services administrator.
To execute a direct database request
1 At the Oracle BI Answers start page, click the following link:
Create Direct Request
The Criteria tab opens.
2 Follow the on-screen instructions to specify the name of the connection pool for the database defined in the physical layer of the Oracle Business Intelligence Server Administration Tool.
For information about connection pools, see Oracle Business Intelligence Server Administration Guide.
3 Follow the on-screen instructions to create the physical request.
CAUTION: Oracle BI Server security rules are bypassed and cannot be applied when direct database requests are issued from Oracle BI Answers.
4 To bypass the Oracle BI Presentation Services cache, click the bypass option.
5 To issue the request, click the Results tab.
The results, if any, are displayed in the workspace.
Oracle Business Intelligence Answers, Delivers, and Interactive Dashboards User Guide Version 10.1.3.2
Basics of Working with Requests in Oracle BI Answers ■ Using Variables to Display Values in Request Results, Dashboards and iBots
44
Using Variables to Display Values in Request Results, Dashboards and iBots You can reference a session variable, repository variable (e.g. User.displayName), or a presentation variable, and use its value in request results, dashboards and iBots. For more information about variables, see Oracle Business Intelligence Server Administration Guide. This section contains the following topics:
■ “What are session variables, repository variables, and presentation variables?” on page 44
■ “Where can you reference variables?” on page 44
■ “What is the syntax for referencing session variables?” on page 45
■ “What is the syntax for referencing repository and presentation variables?” on page 45
■ “What pre-defined variables can be referenced in request results, dashboards and iBots?” on page 46
What are session variables, repository variables, and presentation variables?Session and repository variables are pre-defined values held on the server (e.g. NQ_SESSION.System.currentTime). A presentation variable must be declared in a dashboard prompt (using the Set Variable field), and its name and value are determined by the user, either when it is initially declared, or when it is referenced in request results, dashboards and iBots.
For more information about declaring presentation variables in a dashoard prompt, see “Creating a Dashboard Prompt for Filtering Oracle BI Requests” on page 60.
The following examples suggest how you might reference a session variable or a presentation variable:
■ Example 1 - Referencing a session variable
To enable an author to display the current user’s name in a report title view, the author simply adds a reference to the session variable @{NQ_SESSION.User.displayName} to the report title view. This session variable displays the current user name in the title view.
■ Example 2 - Referencing a presentation variable
Where a dashboard report displays a prompt for a single region, the author would like to display the region selected by the user in the title of the dashboard report. To do so, the author simply adds a reference to a presentation variable in the report title for example, @{variables.myFavoriteRegion}. The presentation variable (myFavoriteRegion) needs to have been declared for the dashboard prompt. This presentation variable displays whatever region has been entered by the user in this dashboard prompt.
Where can you reference variables?You can reference variables in the following areas:
■ Title Views
■ Narrative Views
Basics of Working with Requests in Oracle BI Answers ■ Using Variables to DisplayValues in Request Results, Dashboards and iBots
Oracle Business Intelligence Answers, Delivers, and InteractiveDashboards User Guide Version 10.1.3.2
45
■ Column Filters
■ Column Formulas
■ Conditional Formatting conditions (presentation variables only)
■ Direct Database Requests
■ Dashboard prompts
Users will be prompted for a variable value which is then set into a request (session) variable and passed to the Oracle BI server.
■ Chart scale markers.
■ Gauge range settings.
■ Static text.
■ iBot Headlines and text
What is the syntax for referencing session variables?The syntax for referencing session variables is as follows:
@{NQ_SESSION.variableName}
For example, @{NQ_SESSION.dashboard.description}
■ NQ_SESSION - indicates that this item references a session variable.
■ variableName - a reference to an object available in the current session context. For example: dashboard.description.
What is the syntax for referencing repository and presentation variables?The syntax for referencing repository and presentation variables is as follows:
■ @{<variableName>}{<value>}[format] - for repository variables
For example, @{dashboard.path} - inserts the path to the current dashboard.
■ @{variables.<variableName>}{<value>}[format] - for presentation variables
For example, @{variables.myFavoriteRegion}{Central} - inserts the value of the presentation variable myFavoriteRegion.
❏ variables - prefix that is required when you reference a presentation variable in a request.
❏ variableName - a reference to an object available in the current evaluation context. For example: @{variables.myFavoriteRegion}.
❏ value - (optional) - a constant or variable reference indicating a value to be used if the variable referenced by the variableName isn't populated (is undefined).
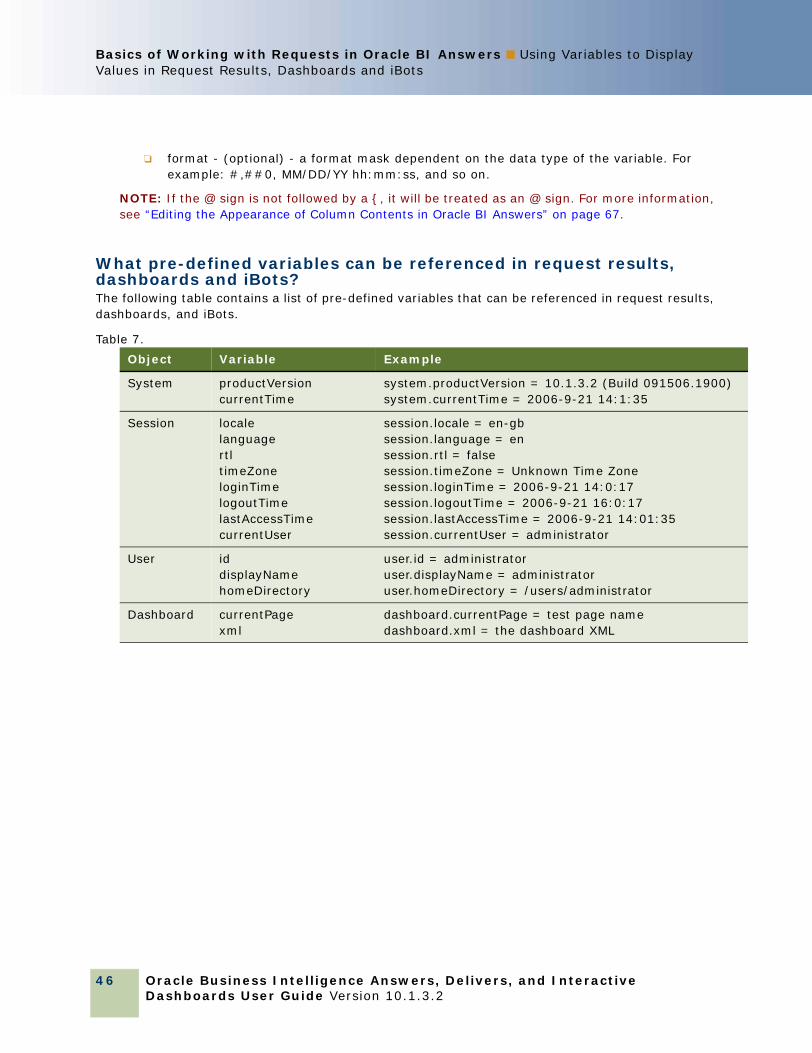
Oracle Business Intelligence Answers, Delivers, and Interactive Dashboards User Guide Version 10.1.3.2
Basics of Working with Requests in Oracle BI Answers ■ Using Variables to Display Values in Request Results, Dashboards and iBots
46
❏ format - (optional) - a format mask dependent on the data type of the variable. For example: #,##0, MM/DD/YY hh:mm:ss, and so on.
NOTE: If the @ sign is not followed by a {, it will be treated as an @ sign. For more information, see “Editing the Appearance of Column Contents in Oracle BI Answers” on page 67.
What pre-defined variables can be referenced in request results, dashboards and iBots?The following table contains a list of pre-defined variables that can be referenced in request results, dashboards, and iBots.
Table 7.
Object Variable Example
System productVersioncurrentTime
system.productVersion = 10.1.3.2 (Build 091506.1900)system.currentTime = 2006-9-21 14:1:35
Session localelanguagertltimeZoneloginTimelogoutTimelastAccessTimecurrentUser
session.locale = en-gbsession.language = ensession.rtl = falsesession.timeZone = Unknown Time Zonesession.loginTime = 2006-9-21 14:0:17session.logoutTime = 2006-9-21 16:0:17session.lastAccessTime = 2006-9-21 14:01:35session.currentUser = administrator
User id displayName homeDirectory
user.id = administratoruser.displayName = administratoruser.homeDirectory = /users/administrator
Dashboard currentPagexml
dashboard.currentPage = test page namedashboard.xml = the dashboard XML

Oracle Business Intelligence Answers, Delivers, and InteractiveDashboards User Guide Version 10.1.3.2
47
4 Filtering Requests in Oracle BI Answers
A filter is used to limit the results that appear when an Oracle BI request is run. Together with the columns selected for a request, a filter determines what your results will contain. Based on the filter criteria, Oracle BI Answers shows only those results that match the filter criteria. Filters are applied on a column-level basis. A filter can also combine other filters to further constrain the results of a request. Another kind of filter, called a dashboard prompt, can apply to all items in a dashboard.
This chapter explains how to construct filters and use them to filter requests in Oracle BI Answers. It contains the following topics:
■ “Using Column Filters in an Oracle BI Request” on page 47
■ “Using Prompts to Simplify Filtering in an Oracle BI Request” on page 56
■ “Creating a Dashboard Prompt for Filtering Oracle BI Requests” on page 60
■ “Using a Saved Oracle BI Request as a Filter” on page 64
■ “Editing the SQL for a Column Filter in an Oracle BI Request” on page 64
Using Column Filters in an Oracle BI RequestA column filter allows you to constrain a request to obtain results that answer a particular question. Together with the columns you select, a column filter determines what the results will contain. For example, depending on the industry you work in, you can use column filters to find out who the top ten performers are, sales for a particular brand, most profitable customers, and so on. You can create column filters for a particular request, and save them to your personal filter folder (My Filters) or to a shared filter folder if you want other users to be able to use them.
A column filter consists of the following elements:
■ A column to filter, such as Order Quantity.
■ A value to use when applying the filter, such as 10.
Advanced users can include SQL expressions, session variables, repository variables (defined in the Oracle BI repository), and presentation variables to define or limit the value.
■ An operator that determines how the value is applied, such as Less Than.
For example, if the column contains the number of units sold, the operator is Less Than, and the value is 10, the results include only order quantities only where less than 10 units were sold.
A column filter can also have the following characteristics:
Oracle Business Intelligence Answers, Delivers, and Interactive Dashboards User Guide Version 10.1.3.2
Filtering Requests in Oracle BI Answers ■ Using Column Filters in an Oracle BI Request
48
■ It can be combined with other column filters from the same subject area to further constrain the results of a request.
Filters can be grouped (a capability called parenthetical filtering) to create complex filters without requiring you to know SQL.
■ Its value can be constrained by the results of a previously-saved request from the same subject area.
You can also prevent the filter from being replaced during navigation and prompting.
The filter is translated into a WHERE clause in the SQL SELECT statement that is issued to the Oracle BI Server. The WHERE clause is used to limit the rows returned to those that fit the specified constraints. Advanced users can type the SQL for a filter directly.
This section provides the procedures for working with column filters in Oracle BI Answers. It contains the following topics:
■ “Creating a Column Filter in Oracle BI Answers” on page 48
■ “Saving a Column Filter in Oracle BI Answers” on page 52
■ “Applying a Saved Column Filter to an Oracle BI Request” on page 53
■ “Editing a Column Filter in Oracle BI Answers” on page 54
■ “Editing the Formula for a Column Filter in Oracle BI Answers” on page 54
■ “Removing a Column Filter in Oracle BI Answers” on page 54
■ “Combining a Column Filter with Other Column Filters in Oracle BI Answers” on page 55
■ “Preventing a Filter from Being Replaced During Navigation and Prompting” on page 55
■ “Removing a Column Filter in Oracle BI Answers” on page 54
Creating a Column Filter in Oracle BI AnswersThe following procedure explains how to create a column filter in Oracle BI Answers.
If you do not want the column to display in results, you can hide it. For more information, see “Editing the Appearance of Column Contents in Oracle BI Answers” on page 67.
CAUTION: If you click your browser's Refresh button before you are done creating a column filter, be aware that the browser will reload all frames and discard your changes.
To create a column filter in Oracle BI Answers
1 In Oracle BI Answers, perform one of the following actions:
■ To create a filter for use with a specific request, display a request to which you want to add a filter, click the Criteria tab, and then click the Filter button for the column that you want to include in the filter.
TIP: To add a filter for a column that is not included in request, press and hold down the CTRL key at the Criteria tab and click the column name in the selection pane.
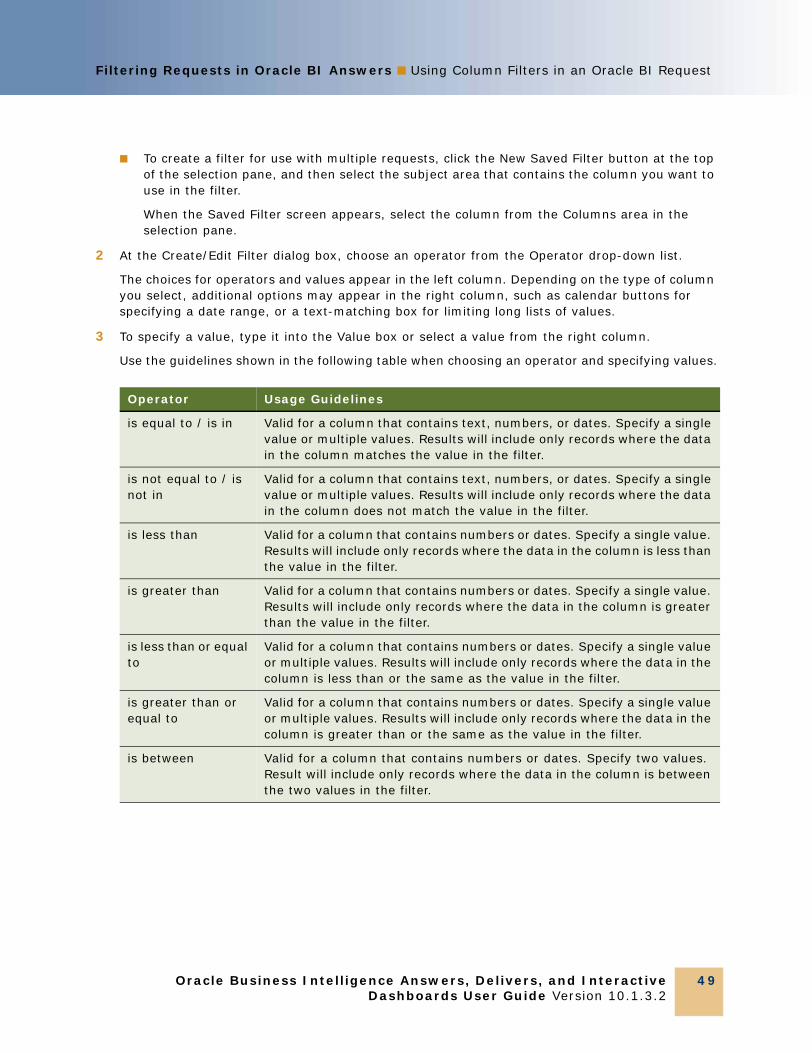
Filtering Requests in Oracle BI Answers ■ Using Column Filters in an Oracle BI Request
Oracle Business Intelligence Answers, Delivers, and InteractiveDashboards User Guide Version 10.1.3.2
49
■ To create a filter for use with multiple requests, click the New Saved Filter button at the top of the selection pane, and then select the subject area that contains the column you want to use in the filter.
When the Saved Filter screen appears, select the column from the Columns area in the selection pane.
2 At the Create/Edit Filter dialog box, choose an operator from the Operator drop-down list.
The choices for operators and values appear in the left column. Depending on the type of column you select, additional options may appear in the right column, such as calendar buttons for specifying a date range, or a text-matching box for limiting long lists of values.
3 To specify a value, type it into the Value box or select a value from the right column.
Use the guidelines shown in the following table when choosing an operator and specifying values.
Operator Usage Guidelines
is equal to / is in Valid for a column that contains text, numbers, or dates. Specify a single value or multiple values. Results will include only records where the data in the column matches the value in the filter.
is not equal to / is not in
Valid for a column that contains text, numbers, or dates. Specify a single value or multiple values. Results will include only records where the data in the column does not match the value in the filter.
is less than Valid for a column that contains numbers or dates. Specify a single value. Results will include only records where the data in the column is less than the value in the filter.
is greater than Valid for a column that contains numbers or dates. Specify a single value. Results will include only records where the data in the column is greater than the value in the filter.
is less than or equal to
Valid for a column that contains numbers or dates. Specify a single value or multiple values. Results will include only records where the data in the column is less than or the same as the value in the filter.
is greater than or equal to
Valid for a column that contains numbers or dates. Specify a single value or multiple values. Results will include only records where the data in the column is greater than or the same as the value in the filter.
is between Valid for a column that contains numbers or dates. Specify two values. Result will include only records where the data in the column is between the two values in the filter.
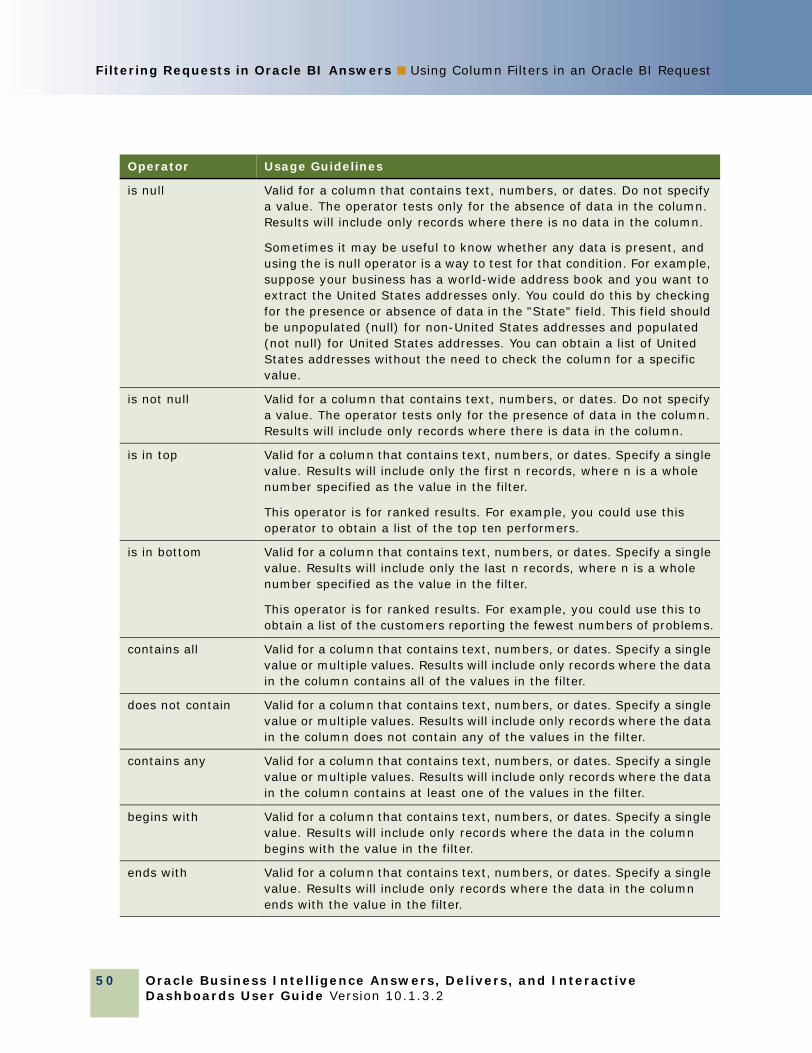
Oracle Business Intelligence Answers, Delivers, and Interactive Dashboards User Guide Version 10.1.3.2
Filtering Requests in Oracle BI Answers ■ Using Column Filters in an Oracle BI Request
50
is null Valid for a column that contains text, numbers, or dates. Do not specify a value. The operator tests only for the absence of data in the column. Results will include only records where there is no data in the column.
Sometimes it may be useful to know whether any data is present, and using the is null operator is a way to test for that condition. For example, suppose your business has a world-wide address book and you want to extract the United States addresses only. You could do this by checking for the presence or absence of data in the "State" field. This field should be unpopulated (null) for non-United States addresses and populated (not null) for United States addresses. You can obtain a list of United States addresses without the need to check the column for a specific value.
is not null Valid for a column that contains text, numbers, or dates. Do not specify a value. The operator tests only for the presence of data in the column. Results will include only records where there is data in the column.
is in top Valid for a column that contains text, numbers, or dates. Specify a single value. Results will include only the first n records, where n is a whole number specified as the value in the filter.
This operator is for ranked results. For example, you could use this operator to obtain a list of the top ten performers.
is in bottom Valid for a column that contains text, numbers, or dates. Specify a single value. Results will include only the last n records, where n is a whole number specified as the value in the filter.
This operator is for ranked results. For example, you could use this to obtain a list of the customers reporting the fewest numbers of problems.
contains all Valid for a column that contains text, numbers, or dates. Specify a single value or multiple values. Results will include only records where the data in the column contains all of the values in the filter.
does not contain Valid for a column that contains text, numbers, or dates. Specify a single value or multiple values. Results will include only records where the data in the column does not contain any of the values in the filter.
contains any Valid for a column that contains text, numbers, or dates. Specify a single value or multiple values. Results will include only records where the data in the column contains at least one of the values in the filter.
begins with Valid for a column that contains text, numbers, or dates. Specify a single value. Results will include only records where the data in the column begins with the value in the filter.
ends with Valid for a column that contains text, numbers, or dates. Specify a single value. Results will include only records where the data in the column ends with the value in the filter.
Operator Usage Guidelines

Filtering Requests in Oracle BI Answers ■ Using Column Filters in an Oracle BI Request
Oracle Business Intelligence Answers, Delivers, and InteractiveDashboards User Guide Version 10.1.3.2
51
4 Use the paging controls to navigate the choices when there are many choices for the column:
■ Click on a specific page number to navigate to that page.
■ Click the double right-arrow paging button ( >> ) to advance to the next page, or the double left-arrow paging button ( << ) to go back to the previous page.
■ Click triple right-arrow paging button ( >>> ) to advance to the last page, or the triple left-arrow paging button ( <<< ) to go back to the first page.
5 Use the calendar buttons to specify the date range for columns that contain dates.
To specify a single date, specify the same date for the beginning and ending date.
6 Use the Match box to limit the list of values to appear in the All Choices or Limited Choices list for columns that contain text or numbers.
For example, suppose you want to see results for the East region. If you type an E into the Match box, the list shows only the values that begin with an E. If you have set other constraints in the filter, the Limited Choices list shows only the choices within those constraints.
7 To add an SQL expression or a system variable (defined in the Oracle BI repository), perform the following actions:
a Click the Add button and choose the appropriate option.
The label on the Value box changes to reflect your selection.
b Type the SQL expression or system variable name into the box.
8 To add a presentation variable, perform the following actions:
is LIKE (pattern match)
Valid for a column that contains text. Specify a single value or multiple values. Requires the use of a percent sign character (%) as a wild card character. You may specify up to two percent sign characters in the value. Results will include only records where the data in the column matches the pattern value in the filter.
is not LIKE (pattern match)
Valid for a column that contains text. Specify a single value or multiple values. Requires the use of a percent sign character (%) as a wild card character. You may specify up to two percent sign characters in the value. Results will include only records where the data in the column does not match the pattern value in the filter.
is prompted Valid for a column that contains text, numbers, or dates. Choosing this operator for a column flags it as ready to be filtered by a dashboard prompt. This means when a dashboard prompt is used, results will include only records where the data in the column that is prompted column matches the user's choices.
NOTE: This operator is required for columns included in dashboard prompts where no prefiltered values are desired.
Operator Usage Guidelines
Oracle Business Intelligence Answers, Delivers, and Interactive Dashboards User Guide Version 10.1.3.2
Filtering Requests in Oracle BI Answers ■ Using Column Filters in an Oracle BI Request
52
a Click the Add button, choose Variable, and then the Presentation option.
A Presentation Variable field and a Default field appears.
b Type the presentation variable, using correct syntax.
For more information about using variables, see the chapter about working with requests in Oracle Business Intelligence Answers, Delivers, and Interactive Dashboards User Guide.
c Type a default value (Optional) to be used if no value is returned by the presentation variable.
9 To remove a value, SQL expression, system variable, or presentation variable, click the Delete button next to it.
To remove all definitions, click the Clear Values button.
10 To have this filter constrained by the value of a column from the same subject area in another request, click the Advanced button and choose the following option:
Filter based on results of another request
The Filter on Saved Request dialog box appears. For more information, see “Using a Saved Oracle BI Request as a Filter” on page 64.
11 To convert the filter to SQL, click the Advanced button and choose the following option:
Convert this filter to SQL
The Advanced SQL Filter dialog box appears. For more information, see “Editing the SQL for a Column Filter in an Oracle BI Request” on page 64.
12 When you are finished, click OK.
The filter appears in the Filters area on the Criteria tab or on the Saved Filters page.
NOTE: If you accessed the Create/Edit Filter dialog from the Edit Column Formula dialog Column Formula tab, the filter will appear in the Insert Filter dialog. For more information, see “Editing the Formula of a Column” on page 103.
NOTE: If you accessed the Create/Edit Filter dialog from the Edit Column Formula dialog Bins tab, the filter will appear in the Bins tab. For more information, see “Editing the Formula of a Column” on page 103.
Saving a Column Filter in Oracle BI AnswersYou can save a filter as part of a request or for reuse in other requests. If a filter is for a specific request, and you save the request, the filter is saved as part of the request and will be applied every time the request runs. You can also save the filter explicitly so it can be used in other requests.
Saved filters and folders containing filters for the subject area appear following the name of the subject area. If there are no saved filters for the subject area, or if your user name does not have the appropriate permissions, this part of the page is blank.
To save a column filter as part of an Oracle BI request
1 At the Criteria tab in Oracle BI Answers, click the Save Request button.

Filtering Requests in Oracle BI Answers ■ Using Column Filters in an Oracle BI Request
Oracle Business Intelligence Answers, Delivers, and InteractiveDashboards User Guide Version 10.1.3.2
53
2 At the Choose Folder dialog box, choose the location in which to save the request.
3 For more information about saving requests, see “Saving an Oracle BI Request to a Personal or Shared Folder” on page 37.
To save a column filter for use in other Oracle BI requests
1 In the Filters area on the Criteria tab, click the Save Filter button for the filter you want to save.
2 At the Choose Folder dialog box, choose a folder in which to save the filter:
■ To save the filter for your personal use, click My Filters.
Filters saved in My Filters are available only to you.
■ To save the filter for use by others, click Shared Filters.
Filters saved in a shared filters folder are available to other users that have permission to access the folder.
3 To specify a subfolder, perform one of the following actions:
■ Navigate to it.
■ Click Create Folder to create a new subfolder.
■ Type the path in the Folder box.
4 Type a name for the filter.
The name will appear in the selection pane.
5 (Optional) Type a description for the filter.
Descriptions are displayed when Oracle BI administrators use the Catalog Manager.
6 Click OK.
When you click the Refresh Display link in the selection pane, the filter is listed under the Filters folder in either My Filters or in a shared filters folder.
To display the properties for a saved filter in Oracle BI Answers■ Locate the filter in the selection pane and click it.
Applying a Saved Column Filter to an Oracle BI RequestYou can apply a saved column filter to a request. You can apply either the contents of the filter or a reference to the filter.
When you apply the contents of a saved column filter, the actual contents of that filter are copied into the Filters area on the Criteria tab. This allows you to manipulate the filter criteria without altering the saved filter. When you apply a reference to a saved filter, the saved filter is referenced only by its name, and you can view but not alter its contents.

Oracle Business Intelligence Answers, Delivers, and Interactive Dashboards User Guide Version 10.1.3.2
Filtering Requests in Oracle BI Answers ■ Using Column Filters in an Oracle BI Request
54
To apply a saved column filter to an Oracle BI request
1 At the Criteria tab in Oracle BI Answers, display a request to which you want to add a saved column filter.
2 In the selection pane, navigate to the appropriate Filters folder and click the saved filter that you want to apply.
The Apply Saved Filter dialog box appears.
3 Specify your choices, if any, in the Filter Options area.
4 Click OK.
The filter appears in the Filters area on the Criteria tab.
Editing a Column Filter in Oracle BI AnswersIf your user ID has the appropriate permissions, you can edit a column filter to change its properties.
To edit a column filter in Oracle BI Answers
1 In the Filters area on the Criteria tab in Oracle BI Answers, click the menu button for the filter you want to edit and choose Edit Filter.
The Create/Edit Filter dialog box appears.
NOTE: The Edit Filter option is available only if you have permission to edit the filter.
2 Make your changes, and then click OK.
Editing the Formula for a Column Filter in Oracle BI AnswersIf your user ID has the appropriate permissions, you can edit the formula for a column filter.
To edit the column formula for a filter in Oracle BI Answers
1 In the Filters area on the Criteria tab in Oracle BI Answers, click the menu button for the filter whose formula you want to edit and choose the following option:
Edit Column Formula
2 At the Column Formula tab, type the formula into the Column Formula area.
For more information, click the help button.
Removing a Column Filter in Oracle BI AnswersYou can remove a single filter or all filters from an Oracle BI request.
NOTE: If the request was saved previously with any filters applied, save the request again to remove the filters.
Filtering Requests in Oracle BI Answers ■ Using Column Filters in an Oracle BI Request
Oracle Business Intelligence Answers, Delivers, and InteractiveDashboards User Guide Version 10.1.3.2
55
To remove a column filter from an Oracle BI request■ In the Filters area on the Criteria tab in Oracle BI Answers, perform one of the following actions:
■ To remove a single filter from a request, click the Delete button for the filter.
■ To remove all filters from a request, click the Remove Filters button.
Combining a Column Filter with Other Column Filters in Oracle BI AnswersCombining column filters, also known as parenthetical filtering, allows you to create complex filters without requiring you to know SQL.
You can combine column filters with AND and OR operators. The AND operator means that the criteria specified in each filter must be met. This is the default method for combining column filters. The OR operator means that the criteria specified in at least one of the column filters must be met.
You can save the multi-column filter. For more information, see “Combining a Column Filter with Other Column Filters in Oracle BI Answers” on page 55.
To combine a column filter with other column filters in Oracle BI Answers
1 At the Criteria tab in Oracle BI Answers, add at least two column filters to a request, or add at least two column filters to a saved filter.
The filters are listed in the Filters area with an AND operator between them.
2 To change an AND operator to an OR operator, click it.
3 As you add column filters, click AND and OR operators to group filters and construct the desired filter combinations.
Combined filters elements are bounded by boxes.
4 To cut, copy, or ungroup bounded elements, click the ellipses button [. . .] and choose the appropriate option.
Preventing a Filter from Being Replaced During Navigation and PromptingYou can protect the contents of a filter in a report from being affected during navigation and prompting. A protected filter is always applied to results.
NOTE: You can protect the contents of a saved filter only by editing the saved filter. However, you cannot protect the Is Prompted operator.
To protect a filter from changing during navigation and prompting■ In the Filters area on the Criteria tab in Oracle BI Answers, click the menu button for the filter
you want to protect and select the option Protect Filter.
A check mark appears next to the option when it is selected.
Oracle Business Intelligence Answers, Delivers, and Interactive Dashboards User Guide Version 10.1.3.2
Filtering Requests in Oracle BI Answers ■ Using Prompts to Simplify Filtering in an Oracle BI Request
56
Related Topic“Using Prompts to Simplify Filtering in an Oracle BI Request” on page 56
Using Prompts to Simplify Filtering in an Oracle BI RequestA filter limits the results that appear when a request is run. Oracle BI Answers shows only those results that match the criteria.
To simplify filtering, Oracle BI Answers provides two types of prompts, dashboard prompts and criteria prompts:
■ A dashboard prompt is a special kind of filter that filters requests embedded in a dashboard. A dashboard prompt filters embedded requests that contain the same columns as the filter. It can filter all embedded requests in a dashboard, or embedded requests on the same dashboard page.
Multiple columns in a dashboard prompt can be used to constrain users' choices for subsequent selections. For example, if one column filters on a region, and the next column filters on districts, the district column can be constrained to show only districts in the region the user selects. A dashboard prompt can also be populated dynamically so that it can be programmatically customized for each user.
■ A criteria prompt guides users in making selections for individual requests. There are two kinds of criteria prompts, column filter prompts and image prompts:
■ A column filter prompt provides general filtering of a column within a request. A column filter prompt can present all choices for a column, or, like a dashboard prompt, it can present constrained choices for a column. For example, if a request contains a Region=East filter, constraining choices for the City column restricts the selections to cities in the East region only. This eliminates the selection of a mutually exclusive filter that could result in no data.
■ An image prompt provides an image that users click to select criteria for a request. For example, in a sales organization, users can click their territories from an image of a map to see sales information, or click a product image to see sales information about that product. Users who know how to use the HTML <map> tag can create an image map definition.
This section explains how to work with prompts. It contains the following topics:
■ “Adding a Column Filter Prompt to an Oracle BI Request” on page 56
■ “Adding an Image Prompt to an Oracle BI Request” on page 58
For information about setting up a dashboard prompt, see “Creating a Dashboard Prompt for Filtering Oracle BI Requests” on page 60.
Adding a Column Filter Prompt to an Oracle BI RequestA column filter prompt allows users to select values to filter a column in a request. You can define the range of possible filter values and how the user selects the filter values for the request.
Filtering Requests in Oracle BI Answers ■ Using Prompts to Simplify Filtering in anOracle BI Request
Oracle Business Intelligence Answers, Delivers, and InteractiveDashboards User Guide Version 10.1.3.2
57
Column filter prompts appear on the Prompts tab. When you have multiple column filter prompts constructed for a request, they are executed in the order they are listed, from top to bottom.
To add or modify a column filter prompt in Oracle BI Answers
1 At the Criteria tab in Oracle BI Answers, modify a request to which you want to add a column filter prompt, and then click the Prompts tab.
2 From the Create Prompt drop-down list, select Column Filter Prompt.
The Column Filter Prompt Properties dialog box appears.
3 Type a caption for the column filter prompt in the Caption box.
The caption will appear to the user. You can include HTML markup tags in the caption, such as <b>, <font>, and <table>.
4 Type a description in the Description box.
Descriptions are displayed when Oracle BI administrators use the Catalog Manager.
5 From the Filter on Column drop-down list, select the column in the request that you want to filter, and then, from the Operator drop-down list, select the operator to use.
If you want the user to select the operator, select the operator *Prompt User.
6 Specify how the user should choose values by clicking the appropriate option.
Users can select values from a drop-down list, or browse through choices and type them into a text box.
7 To allow the user to choose only one value for the column filter prompt, click the check box labeled Single Value Only.
8 Select the values that should be shown to the user by clicking the appropriate option:
■ To show no values, click None.
The user will need to type the value.
■ To show all possible values, click All Values.
■ To show a subset of values, click Limited Values.
Limiting values is useful when prompting for multiple columns, or when the results already contain a filter. It prevents a user from choosing values that would result in no data. For example, suppose a request contains a country column and a city column, and already contains the filter Country=France. By selecting limited values for the city column filter, the choices are constrained to cities in France only, which prevents the possibility of choosing mutually exclusive filters, such as Country=Italy and City=Paris.
■ To limit the values to the results of an SQL statement, click the option SQL Results and type the SQL statement into the text box.
9 Make selections for the options in the Other Options area:
■ To explicitly limit the number of choices a user sees per page, type the number in the Choices per page box.
Oracle Business Intelligence Answers, Delivers, and Interactive Dashboards User Guide Version 10.1.3.2
Filtering Requests in Oracle BI Answers ■ Using Prompts to Simplify Filtering in an Oracle BI Request
58
■ To allow the user to constrain the filter choices, click the check box next to the following option:
Allow user to constrain choices
Constrained choices help the user locate the values to use as a filter. For example, if a filter contains all the cities in France, a user can constrain the filter choices to those cities starting with P.
■ To allow a user to skip this column filter, click the check box next to the following option:
Allow user to skip prompt
This causes a Skip Prompt option to appear. The user can then click this option to bypass making a selection for this filter.
10 When you are finished, click OK.
The column filter prompt is shown on the Prompts tab.
To modify the properties of a column filter prompt in Oracle BI Answers
1 Click the Properties link to open the Column Filter Prompt Properties dialog box.
2 Make your changes, and then click OK.
To move a column filter prompt up or down in the execution order in Oracle BI Answers■ Click the Move Up and Move Down links.
These links appear only when more than one prompt is shown on the Prompts tab.
To delete a column filter prompt in Oracle BI Answers■ Click the Delete link.
Adding an Image Prompt to an Oracle BI RequestAn image prompt provides an image that users click to select their request criteria. For example, from an image that shows products, users can click a product. The selected product is then used to filter the underlying request. To create an image prompt, you need to know how to use the HTML <map> tag to create an image map definition.
Image prompts appear on the Prompts tab in Oracle BI Answers. When you have multiple image prompts constructed for a request, they are executed in the order they are listed, from top to bottom.
To add or modify an image prompt in Oracle BI Answers
1 In Oracle BI Answers, display a request to which you want to add an image prompt, and then click the Prompts tab.

Filtering Requests in Oracle BI Answers ■ Using Prompts to Simplify Filtering in anOracle BI Request
Oracle Business Intelligence Answers, Delivers, and InteractiveDashboards User Guide Version 10.1.3.2
59
2 From the Create Filter drop-down list, select Image Prompt.
The Image Map Prompt Properties dialog box appears.
3 Type a caption for the image prompt in the Caption box.
The caption will appear to the user. You can include HTML markup tags in the caption, such as <b>, <font>, and <table>.
4 Type a description in the Description box.
Descriptions are displayed when Oracle BI administrators use the Catalog Manager.
5 Type the location and name of the image in the Image URL box.
If the image prompt is for your use only, you can specify a location that only you can access, such as c:\mycomputer\temp\map.gif. For an image prompt that will be available to other users, specify the Universal Naming Convention (UNC) name, such as \\ALLUSERS\graphics\map.gif.
6 Type the appropriate HTML <map> tags and data in the HTML box.
7 To extract the image map information from the HTML, click the link Extract Image Map from HTML.
The Image Map Prompt Properties dialog box expands to show the area titles, shapes, and coordinates entered in the HTML box.
■ For each area, in the Column box, type the name of the column to pass when a user clicks it, and the value to use.
NOTE: The column needs to be a fully qualified column name, in the format Table.Column Name.
■ Place double quotes around any column names containing spaces. These are examples:
❏ "Country name"
❏ "Units shipped"
8 When you are finished, click OK.
The image prompt is shown on the Prompts tab.
9 To preview the image prompt, click the preview button (if available).
NOTE: If the preview button is not available, your Oracle BI Presentation Services administrator has suppressed its display.
10 When you click an area of the image, the underlying filter constructed for that area displays. You can click the Refresh link to see the results. You can change the filter criteria and then click the Refresh link again to see the change reflected in the results.
To modify the properties of an image prompt in Oracle BI Answers
1 Click the Properties link to open the Image Map Prompt Properties dialog box.
2 Make your changes, and then click OK.
Oracle Business Intelligence Answers, Delivers, and Interactive Dashboards User Guide Version 10.1.3.2
Filtering Requests in Oracle BI Answers ■ Creating a Dashboard Prompt for Filtering Oracle BI Requests
60
To move an image prompt up or down in the execution order in Oracle BI Answers■ Click the Move Up and Move Down links.
These links appear only when more than one prompt is shown on the Prompts tab.
To delete an image prompt in Oracle BI Answers■ Click the Delete link.
Related Topic“Using Column Filters in an Oracle BI Request” on page 47
Creating a Dashboard Prompt for Filtering Oracle BI RequestsA dashboard prompt filters the results of embedded requests to show only results that match the prompt criteria. A dashboard prompt can filter all requests embedded in a dashboard or requests on certain dashboard pages only.
You select the columns and operators for the dashboard prompt, and specify how the prompt appears on the dashboard and how users select the values. The user's selections determine the content of the reports embedded in the dashboard or dashboard page. Every column contained in the dashboard prompt must be contained, in the projection list or in the filter, in each request that you want the prompt to filter. The columns in the request must have filters set, or the filter condition has to be set to Is Prompted. Columns contained in the prompt that are not included in the request will not filter the request.
If you include multiple columns in a dashboard prompt, you can constrain users' choices for subsequent selections. For example, suppose one column filters on Region, and the next column filters on District. By clicking the Constrain check box for District, you can constrain the District column to show only districts consistent with the user's selection for Region. If the user were to choose the east region from the Region prompt, the District prompt would show districts in the east region only.
NOTE: Constrained columns will be constrained by all other columns in the prompt. For example, if the prompt contains columns Year, Region, and District, and Constrain is checked for District, the values shown in District will be limited by the values entered in Region and Year.
You can also use variables and SQL expressions to populate a dashboard prompt dynamically, allowing programmatic customizing for each user. Variables can be created in the Oracle BI Server Administration Tool and can include session variables as well as dynamic or static repository variables. For more information about variables, see Oracle Business Intelligence Server Administration Guide.
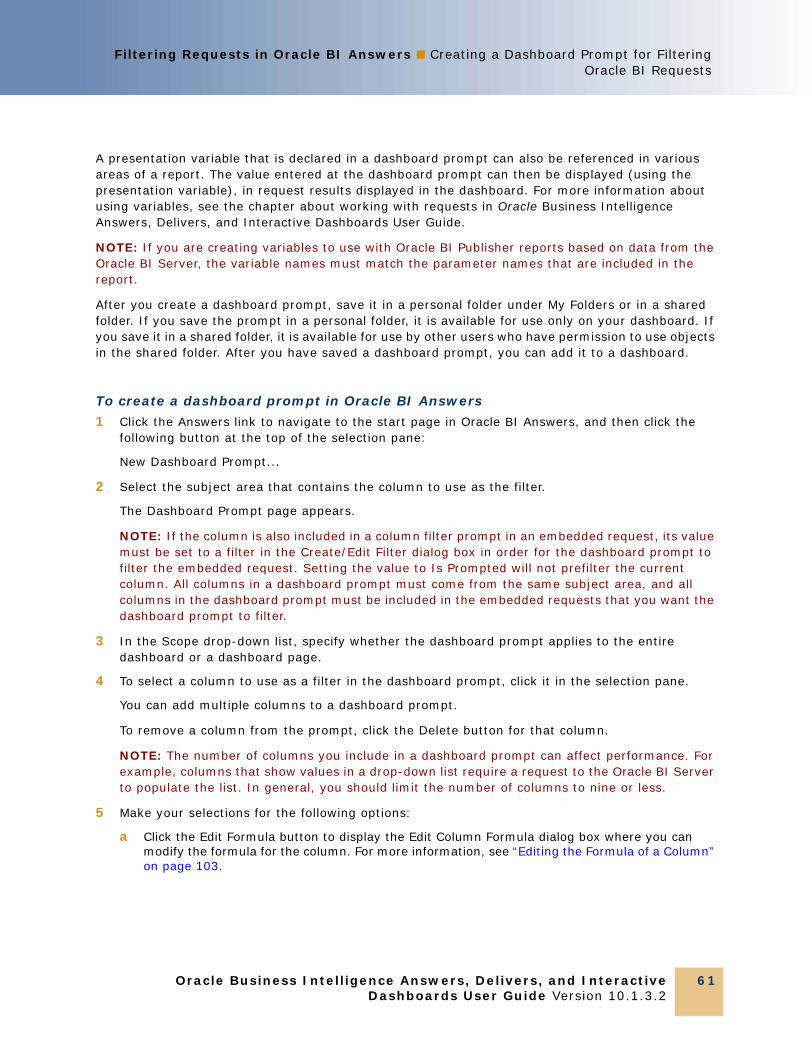
Filtering Requests in Oracle BI Answers ■ Creating a Dashboard Prompt for FilteringOracle BI Requests
Oracle Business Intelligence Answers, Delivers, and InteractiveDashboards User Guide Version 10.1.3.2
61
A presentation variable that is declared in a dashboard prompt can also be referenced in various areas of a report. The value entered at the dashboard prompt can then be displayed (using the presentation variable), in request results displayed in the dashboard. For more information about using variables, see the chapter about working with requests in Oracle Business Intelligence Answers, Delivers, and Interactive Dashboards User Guide.
NOTE: If you are creating variables to use with Oracle BI Publisher reports based on data from the Oracle BI Server, the variable names must match the parameter names that are included in the report.
After you create a dashboard prompt, save it in a personal folder under My Folders or in a shared folder. If you save the prompt in a personal folder, it is available for use only on your dashboard. If you save it in a shared folder, it is available for use by other users who have permission to use objects in the shared folder. After you have saved a dashboard prompt, you can add it to a dashboard.
To create a dashboard prompt in Oracle BI Answers
1 Click the Answers link to navigate to the start page in Oracle BI Answers, and then click the following button at the top of the selection pane:
New Dashboard Prompt...
2 Select the subject area that contains the column to use as the filter.
The Dashboard Prompt page appears.
NOTE: If the column is also included in a column filter prompt in an embedded request, its value must be set to a filter in the Create/Edit Filter dialog box in order for the dashboard prompt to filter the embedded request. Setting the value to Is Prompted will not prefilter the current column. All columns in a dashboard prompt must come from the same subject area, and all columns in the dashboard prompt must be included in the embedded requests that you want the dashboard prompt to filter.
3 In the Scope drop-down list, specify whether the dashboard prompt applies to the entire dashboard or a dashboard page.
4 To select a column to use as a filter in the dashboard prompt, click it in the selection pane.
You can add multiple columns to a dashboard prompt.
To remove a column from the prompt, click the Delete button for that column.
NOTE: The number of columns you include in a dashboard prompt can affect performance. For example, columns that show values in a drop-down list require a request to the Oracle BI Server to populate the list. In general, you should limit the number of columns to nine or less.
5 Make your selections for the following options:
a Click the Edit Formula button to display the Edit Column Formula dialog box where you can modify the formula for the column. For more information, see “Editing the Formula of a Column” on page 103.

Oracle Business Intelligence Answers, Delivers, and Interactive Dashboards User Guide Version 10.1.3.2
Filtering Requests in Oracle BI Answers ■ Creating a Dashboard Prompt for Filtering Oracle BI Requests
62
b Select the operator to use from the Operator drop-down list.
NOTE: If you are creating a dashboard prompt for an Oracle BI Publisher report that receives its data from an Oracle BI Server or SQL Server, the Operator must be set to “is equal to/is in.”
c Select the Control type to indicate how users will select the value for the filter.
The choices are to select it from a calendar, a drop-down list, or a multiple list of values, or type it into an edit box.
d If you choose a drop-down list, then, in the Show list, indicate which values you want to appear in the drop-down list.
You can show all values or develop an SQL statement to limit the drop-down list to certain values.
e To constrain the choices for a column depending on the selection the user makes from the previous column, click the Constrain check box.
f In the Default to list, choose the value that you want users to see initially.
You can show the report defaults, all choices, or a specific value. If you select a specific value, a field appears in which you can type the value.
g In the Set Variable list, you can choose whether or not to populate a variable for the dashboard prompt using a server request variable or a presentation variable.
Leave the field blank not to declare a variable name for this prompt.
If you choose either Server or Presentation to declare a variable for this prompt, an additional field appears where you declare the variable name.
NOTE: If you are creating a dashboard prompt for an Oracle BI Publisher report that receives its data from and Oracle BI Server or SQL Server, the Set Variable must be set to “Presentation.”
If you set a server variable it will override explicitly, the value of this variable set via the initialization block.
For example, if you chose Presentation from the drop-down list, you might type myFavoriteRegion to declare this as a presentation variable. A variable declared here can be referenced in requests and iBots when viewed in a dashboard.
For more information about using variables, see the chapter about working with requests in Oracle Business Intelligence Answers, Delivers, and Interactive Dashboards User Guide.
h In the Label box, type a name to use for the filter label.
If you leave the Label box empty, the column label is used as the filter label.
6 To reorder columns in the prompt, click the Order By buttons.
This controls the order in which the selections appear to users.
7 If you want the selected prompt and all other prompts that follow it to appear on a new line in the filter, click the box in the Group list.

Filtering Requests in Oracle BI Answers ■ Creating a Dashboard Prompt for FilteringOracle BI Requests
Oracle Business Intelligence Answers, Delivers, and InteractiveDashboards User Guide Version 10.1.3.2
63
8 To preview how the prompt will appear on the dashboard, click the preview button (if available).
NOTE: If the preview button is not available, your Oracle BI Presentation Services administrator has suppressed its display.
To save a dashboard prompt
1 When you are finished creating a dashboard prompt, click the Save button.
2 At the Choose Folder dialog box, save the dashboard prompt to a personal or a shared folder, and give the dashboard prompt a descriptive name.
You may also want to indicate in the name whether the dashboard prompt is for an entire dashboard or for a dashboard page. If you are saving a dashboard prompt for use with an Oracle BI Publisher report that receives its data from the Oracle BI Server or SQL Server, the dashboard prompt’s name must match the name of the report’s parameter.
NOTE: Prompts saved in personal folders are available only to you. Prompts saved in shared folders are available to other users that have permission to access the folder.
3 (Optional) Type a description in the Description box.
Descriptions are displayed when Oracle BI administrators use the Catalog Manager.
To edit a dashboard prompt
1 Click the Answers link to go to the start page in Oracle BI Answers.
2 Locate the dashboard prompt:
■ On the Catalog tab in the selection pane, the prompt is visible in the folder in which you saved it.
■ On the Dashboard tab, the prompt is visible on the dashboard or dashboard page to which you added it.
3 Click the dashboard prompt to edit it.
You can also edit the dashboard prompt from the Dashboard Editor.
To add a dashboard prompt to a dashboard or dashboard page
1 In Oracle BI Interactive Dashboards, navigate to the dashboard or the specific dashboard page to which you want to add the dashboard prompt, and then click the Dashboard Editor link.
The Dashboard Editor appears.
2 From the selection pane, in the Saved Content area, navigate to the folder that contains the dashboard prompt you want to add.
Oracle Business Intelligence Answers, Delivers, and Interactive Dashboards User Guide Version 10.1.3.2
Filtering Requests in Oracle BI Answers ■ Using a Saved Oracle BI Request as a Filter
64
3 Drag and drop the dashboard prompt into a section in the dashboard page.
If the dashboard prompt’s scope is set to Dashboard, the dashboard prompt affects every page of the dashboard, but does not appear on every dashboard page. If the dashboard prompt’s scope is set to Page, the dashboard prompt affects only the pages to which you add it. If a dashboard prompt’s scope is set to Dashboard, the value selected for the dashboard level prompt will override values for page level dashboard prompts.
Related Topics“Using Column Filters in an Oracle BI Request” on page 47
“Adding Content to an Oracle BI Interactive Dashboard” on page 196
Using a Saved Oracle BI Request as a FilterFilters can be combined with other filters, as well as be based on the values returned by another request. Any saved request that returns a column of values can be used to filter the selected column in your request.
To create a filter based on the results of another saved request
1 At the Filter on Saved Request dialog box, select the appropriate relationship between the results and the column to be filtered from the Relationship drop-down list.
2 Browse to navigate to the saved request, or type the complete path into the text box.
If the saved request contains a matching column name, it appears in the Use Values in Column drop-down list. If you want to use another column, select it instead.
3 Click OK.
The filter appears in the Filters area on the Criteria tab.
Related Topic“Using Column Filters in an Oracle BI Request” on page 47
Editing the SQL for a Column Filter in an Oracle BI RequestYou can edit the logical SQL WHERE clause to be used as a filter. While generally not necessary, this feature is available for users who need advanced filtering capability. For a comprehensive description of SQL syntax, refer to a third-party reference book on SQL, to a reference manual on SQL from one of the database vendors, or to an online reference site.
Filtering Requests in Oracle BI Answers ■ Editing the SQL for a Column Filter in anOracle BI Request
Oracle Business Intelligence Answers, Delivers, and InteractiveDashboards User Guide Version 10.1.3.2
65
To edit the SQL generated for a column filter
1 While in the column filter dialog, click the Advanced button, and then select the following menu option:
Convert this filter to SQL
2 Type your modifications into the text box, and then click OK.
The filter appears in the Filters area on the Criteria tab.
Example Oracle BI Answers FiltersThis section contains example SQL for example requests against hypothetical data sources. The WHERE clause contains the filters. You can review these examples to see some of the kinds of information you can obtain using filters.
If you want to use an example in an actual request, you will need to modify it to reflect the table and column names used in your organization's data sources.
Example 1: Identifying Customers with the Most Sales VolumeThe following example request reports data on the ten customers with the most sales volume in 2003.
SELECT Customers.Customer, Periods.Year,
SalesFacts.Dollars, RANK(SalesFacts.Dollars),
Sales_YAgo.DollarsPctChgVsYAgo,
RANK(Sales_YAgo.DollarsYAgo)
FROM "SupplierSales"
WHERE Periods.Year = 2003
AND RANK(SalesFacts.Dollars) <= 10 ORDER BY 4
Example 2: Reporting Sales for a Particular BrandThe following example request reports data on the Fizzy Brands company.
SELECT * from "SodaTable"
WHERE Product.Brand = 'Fizzy Brands'
Example 3: Reporting Salaries Above a Certain AmountIn the following example request, the filter in the WHERE clause limits the output to individuals whose yearly salaries are greater than 75000, for example, $75,000 in US dollars.
SELECT "Name.Lastname", "Name.Firstname",
"Salary.YearlySalary" FROM "SalaryTable"

Oracle Business Intelligence Answers, Delivers, and Interactive Dashboards User Guide Version 10.1.3.2
Filtering Requests in Oracle BI Answers ■ Editing the SQL for a Column Filter in an Oracle BI Request
66
WHERE "Salary.YearlySalary" > 75000
ORDER BY 3 DESC
Example 4: Sales Representative's Share of East RegionThe following example request limits data to customers in the East region in the year 2003.
SELECT Periods.Year, Customers.Region,
Customers.SalesRep, SalesFacts.Dollars,
SalesFacts."ShareOfRegion$",
Sales_YAgo."ShareOfRegion$YAgo"
FROM "SupplierSales"
WHERE Periods.Year = 2003
AND Customers.Region = 'East'
Example 5: Reporting Sales Amount by Product CategoryThe following example request reports the sales amount by product category in the local currency for the latest date in the fact table. LatestSalesDate is a Dynamic Repository variable.
SELECT Product."Product Category Name", "Facts -- Non Aggregatable".Currency, "Facts Local Currency".SalesAmount FROM AdventureWorks1 WHERE Time.Date = VALUEOF(LatestSalesDate)
Related Topic“Using Column Filters in an Oracle BI Request” on page 47

Oracle Business Intelligence Answers, Delivers, and InteractiveDashboards User Guide Version 10.1.3.2
67
5 Formatting Results in Oracle BI Answers
This chapter explains how to format results. After you run a request, the results are formatted using default formatting rules. To help focus on blocks of related information and call attention to specific data elements, you can specify additional formatting to apply to results. You can also customize the cosmetic appearance of results and dashboards. This chapter contains the following topics:
■ “Using Column Formatting Functions in Oracle BI Answers” on page 67
■ “Using Custom Date/Time Format Strings in Oracle BI Answers” on page 75
■ “Applying Cosmetic Formatting to Results and Dashboards” on page 81
Using Column Formatting Functions in Oracle BI AnswersWhen you build a request, you can edit properties for a column to control the appearance and layout of a column and its contents. You can also specify formatting to apply only if the contents of the column meet certain conditions. By default, your selections for a column apply only to the current request.
If your user ID has the appropriate permissions, you can save your selections as the system-wide default settings to use every time that data from the column, or columns of this particular data type, appear in results.
This section explains how to use the column formatting functions. It contains the following topics:
■ “Editing the Appearance of Column Contents in Oracle BI Answers” on page 67
■ “Editing the Layout of Column Contents in Oracle BI Answers” on page 69
■ “Formatting Column Content In Oracle BI Answers” on page 71
■ “Applying Conditional Formatting to Column Content in Oracle BI Answers” on page 73
■ “Saving Your Oracle BI Answers Column Property Settings as the System-Wide Defaults” on page 75
Editing the Appearance of Column Contents in Oracle BI AnswersThe default appearance of column contents in results is based on cascading style sheets and XML message files. You can use the Value Format tab of the Column Properties dialog box to override several default settings, such as the font and font size to use, and copy and paste formatting. Your selections apply only to the contents of the column for the request with which you are working.
Oracle Business Intelligence Answers, Delivers, and Interactive Dashboards User Guide Version 10.1.3.2
Formatting Results in Oracle BI Answers ■ Using Column Formatting Functions in Oracle BI Answers
68
To edit the appearance of column contents
1 In Oracle BI Answers, click the Properties button for a column to open the Column Properties dialog box, and then click the Value Format tab.
2 Make your choices for font, cell, border, image, and additional formatting options.
For information, see “Formatting Column Content In Oracle BI Answers” on page 71.
For additional information about the cosmetic formatting available on this tab, see “Applying Cosmetic Formatting to Results and Dashboards” on page 81.
3 On the Data Format tab, you can control the way the data is displayed by clicking the following option:
Override Default Data Format
This option allows you to override the default display characteristics. The selections that you see vary based on the data type. For example, if the column contains numeric data, you can choose how you want the numbers treated, such as percentages, month names, or dates. You can choose the number of decimal places to display, how to display negative numbers, the number of digits to show, and the thousands separator to use. If your column contains text, you can choose how to treat the text, such as plain text, HTML, or a link. Based on your selection, the Custom Text Format text box displays the applicable HTML string used to display the data.
■ To use a custom format for text, choose Custom Text Format from the drop-down list, and then type the custom format. You can type HTML calls that provide special formatting. You can also type any valid HTML string, including JavaScript, VBScript, and so on.
NOTE: The first character must be an at sign character (@). This allows devices that are incapable of displaying the custom format to display the data in the appropriate default format.
For example, the following example HTML sets the column width and height in tables and pivot tables. In the example, the text html enclosed in brackets ([html]) means to use HTML, and the at sign (@)character represents the dynamic contents of the column.
@[html]<span style="width:200px; height:50px">@</span>
If you do not know HTML, JavaScript, VBScript, and so on, consult a third-party reference.
■ To create a custom numeric format, you can use the number sign (#) to include significant digits, and the number zero (0) to include as many digits as specified, even if the number does not contain that detail.
For example, specifying ##.# shows 12.34 as 12.3, and specifying ##.000 shows 12.34 as 12.340.
4 If you are editing a date/time column, the Data Format tab will display the Display Time Zone drop-down list where you can select and apply a specific time zone to the column. Note the following options:
■ If you select the Default time zone option from the list and the administrator has specified a system default time zone, the system default time zone will be used to display the time value in the column.

Formatting Results in Oracle BI Answers ■ Using Column Formatting Functions in OracleBI Answers
Oracle Business Intelligence Answers, Delivers, and InteractiveDashboards User Guide Version 10.1.3.2
69
■ If you select the Default time zone option from the list and the administrator has not specified a system default time zone, the user’s preferred time zone will be used to display the time value in the column.
■ If you select the Data time zone option from the list, the original data retrieved from the database will be displayed.
■ If you select a specific time zone (for example, GMT +05:45 Kathmandu) and the administrator has specified a system default time zone, the system’s default time zone will be converted into the specific time zone that you selected.
5 Click OK when you are done.
Editing the Layout of Column Contents in Oracle BI AnswersUse the Column Format tab of the Column Properties dialog box to perform the following tasks:
■ Specify whether the column should appear in results.
Columns are usually visible in results by default. However, you may want to include a column in your request that you do not want displayed in results, such as a column used in creating a filter.
■ Assign alternate table and column headings and apply custom formatting to them.
■ Include the TimeZone icon. When you included this icon on a date/time column, a clock icon is displayed on a time zone header in a table or pivot view. The user can click this icon to view the name of the display time zone used in the column.
■ Control the display of duplicate data such as repeating column labels.
The data in one column of a table may be repeated in relation to rows of data in other columns in the table. For example, if one column lists customer names and another column lists the regions those customers are in, the region data could be repeated for each customer row. You can choose to display duplicate data only once, or display it for every row. Displaying repeating or duplicated data only once can make a table somewhat easier to read, and can make distinctions in that data more apparent.
■ Specify the interaction that should occur when users work with the results, such as navigation to other requests or dashboards.
Your selections apply only to the contents of the column for the request with which you are working.
To hide a column in results
1 In Oracle BI Answers, click the Properties button for a column to open the Column Properties dialog box, and then click the Column Format tab.
2 Click the Hide Column check box to add a check mark.
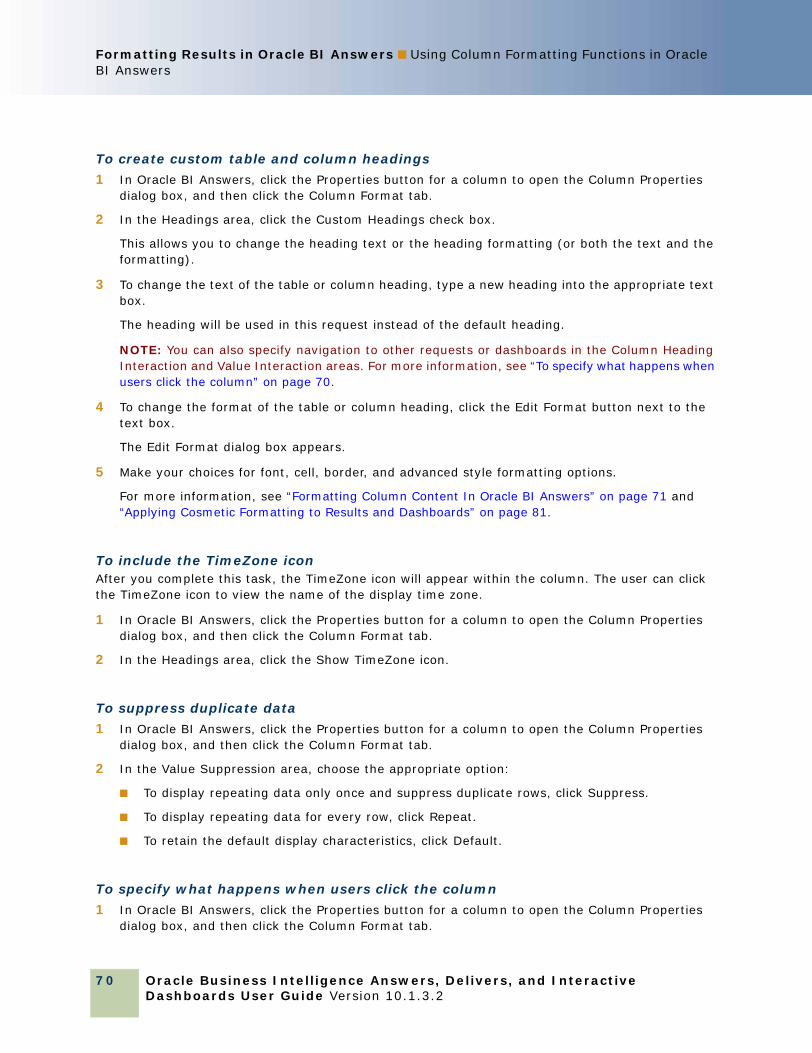
Oracle Business Intelligence Answers, Delivers, and Interactive Dashboards User Guide Version 10.1.3.2
Formatting Results in Oracle BI Answers ■ Using Column Formatting Functions in Oracle BI Answers
70
To create custom table and column headings
1 In Oracle BI Answers, click the Properties button for a column to open the Column Properties dialog box, and then click the Column Format tab.
2 In the Headings area, click the Custom Headings check box.
This allows you to change the heading text or the heading formatting (or both the text and the formatting).
3 To change the text of the table or column heading, type a new heading into the appropriate text box.
The heading will be used in this request instead of the default heading.
NOTE: You can also specify navigation to other requests or dashboards in the Column Heading Interaction and Value Interaction areas. For more information, see “To specify what happens when users click the column” on page 70.
4 To change the format of the table or column heading, click the Edit Format button next to the text box.
The Edit Format dialog box appears.
5 Make your choices for font, cell, border, and advanced style formatting options.
For more information, see “Formatting Column Content In Oracle BI Answers” on page 71 and “Applying Cosmetic Formatting to Results and Dashboards” on page 81.
To include the TimeZone iconAfter you complete this task, the TimeZone icon will appear within the column. The user can click the TimeZone icon to view the name of the display time zone.
1 In Oracle BI Answers, click the Properties button for a column to open the Column Properties dialog box, and then click the Column Format tab.
2 In the Headings area, click the Show TimeZone icon.
To suppress duplicate data
1 In Oracle BI Answers, click the Properties button for a column to open the Column Properties dialog box, and then click the Column Format tab.
2 In the Value Suppression area, choose the appropriate option:
■ To display repeating data only once and suppress duplicate rows, click Suppress.
■ To display repeating data for every row, click Repeat.
■ To retain the default display characteristics, click Default.
To specify what happens when users click the column
1 In Oracle BI Answers, click the Properties button for a column to open the Column Properties dialog box, and then click the Column Format tab.

Formatting Results in Oracle BI Answers ■ Using Column Formatting Functions in OracleBI Answers
Oracle Business Intelligence Answers, Delivers, and InteractiveDashboards User Guide Version 10.1.3.2
71
2 To specify what should happen when users click the column, click the appropriate option:
■ To restore the default interaction, click Default.
■ To allow drilldown functionality, click Drill.
■ To allow navigation to other saved requests or dashboards (when a user clicks on a column heading or a column value):
a Select Navigate from the Type drop-down list (in the Column Heading Interaction area or the Value Interaction area), and click the Add Navigation Target button.
Target and Caption fields are displayed.
b Click the Browse button to open the Choose Request/Dashboard dialog box, navigate to the request or dashboard, and click OK to select the target.
c (Optional) Enter caption text in the Caption field.
Caption text is displayed when the user clicks on the column header or the column value within the report.
When no text is entered in the Caption field, the title of the target report or dashboard is displayed as the caption.
d To allow navigation to multiple saved requests or dashboards, click the Add Navigation Target button, and repeat the previous steps.
e Click OK to save your changes.
When a user views a report and clicks on a column header or a column value, the following rules apply:
❏ If multiple navigation paths exist to other saved requests or dashboards, a pop-up window displays a caption for each request/dashboard. The user should click a caption to navigate to the required request/dashboard.
❏ If only a single navigation path exists, the request/dashboard is displayed.
■ To disable drilling or navigation, click No Interaction.
■ To add the write-back capability, click Write Back.
Formatting Column Content In Oracle BI AnswersUse the Edit Format dialog box (and the options on the Value Format tab of the Column Properties dialog box) to choose font, cell, border, and advanced style formatting options for column data that is shown inside a cell in a tabular format, such as a table or pivot table. You can also choose settings for table and column headings.
NOTE: The advanced style formatting options are for use by users who know how to work with cascading style sheets.
If you are overriding the default formatting properties for a column, your selections are static. If you are specifying conditional formatting properties for a column, your selections apply only if the condition is met.

Oracle Business Intelligence Answers, Delivers, and Interactive Dashboards User Guide Version 10.1.3.2
Formatting Results in Oracle BI Answers ■ Using Column Formatting Functions in Oracle BI Answers
72
The selections for horizontal and vertical alignment are similar to text justification selections in word processors. Vertical alignment does not have any impact unless the column spans multiple rows of other columns.
If you will save the settings as system defaults, the location must be accessible to all users. For more information, see “Saving Your Oracle BI Answers Column Property Settings as the System-Wide Defaults” on page 75.
1 In the Font area, make your selections for font family, size, color, style (such as bold), and any effects to apply (such as underlining).
2 In the Cell area, make your selections for alignment.
■ For horizontal alignment, choose one of the options described in the following table.
■ For vertical alignment, choose one of the options described in the following table.
3 In the Cell area, make your selection for an image to display inside the cell by clicking the Image button.
The Graphics dialog opens.
■ If you do not want to include an image, click the No Image option.
■ To include a custom image, click the Custom Image option and specify the appropriate path in the text box.
The image should be one that is accessible to all users who will view the results. Custom images can be used for both conditional and unconditional results.
Option Usage Notes
Left Left justifies the data. This is the most common justification for text data.
Right Right justifies the data. This is the most common justification for numeric data.
Center Centers the data.
Default Retains the default data alignment associated with this column.
Option Usage Notes
Top Aligns the data to the top of the table cell.
Bottom Aligns the data to the bottom of the table cell.
Center Aligns the data to the middle of the table cell.
Default Retains the default vertical alignment associated with this column.
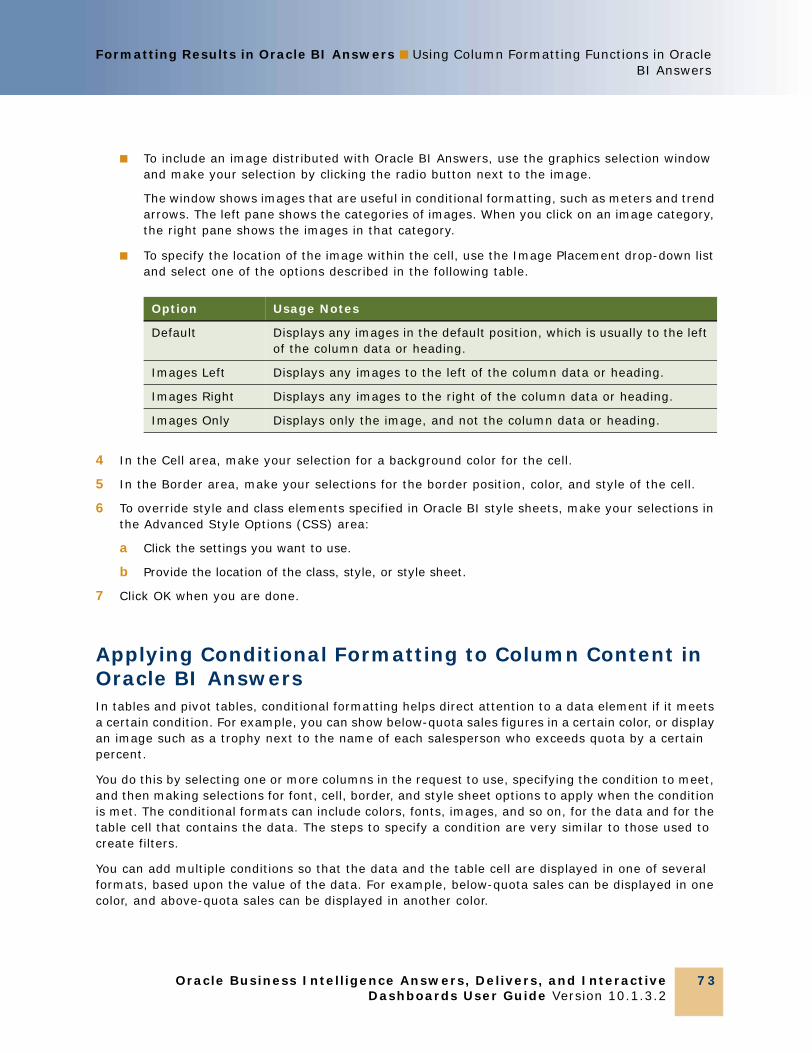
Formatting Results in Oracle BI Answers ■ Using Column Formatting Functions in OracleBI Answers
Oracle Business Intelligence Answers, Delivers, and InteractiveDashboards User Guide Version 10.1.3.2
73
■ To include an image distributed with Oracle BI Answers, use the graphics selection window and make your selection by clicking the radio button next to the image.
The window shows images that are useful in conditional formatting, such as meters and trend arrows. The left pane shows the categories of images. When you click on an image category, the right pane shows the images in that category.
■ To specify the location of the image within the cell, use the Image Placement drop-down list and select one of the options described in the following table.
4 In the Cell area, make your selection for a background color for the cell.
5 In the Border area, make your selections for the border position, color, and style of the cell.
6 To override style and class elements specified in Oracle BI style sheets, make your selections in the Advanced Style Options (CSS) area:
a Click the settings you want to use.
b Provide the location of the class, style, or style sheet.
7 Click OK when you are done.
Applying Conditional Formatting to Column Content in Oracle BI AnswersIn tables and pivot tables, conditional formatting helps direct attention to a data element if it meets a certain condition. For example, you can show below-quota sales figures in a certain color, or display an image such as a trophy next to the name of each salesperson who exceeds quota by a certain percent.
You do this by selecting one or more columns in the request to use, specifying the condition to meet, and then making selections for font, cell, border, and style sheet options to apply when the condition is met. The conditional formats can include colors, fonts, images, and so on, for the data and for the table cell that contains the data. The steps to specify a condition are very similar to those used to create filters.
You can add multiple conditions so that the data and the table cell are displayed in one of several formats, based upon the value of the data. For example, below-quota sales can be displayed in one color, and above-quota sales can be displayed in another color.
Option Usage Notes
Default Displays any images in the default position, which is usually to the left of the column data or heading.
Images Left Displays any images to the left of the column data or heading.
Images Right Displays any images to the right of the column data or heading.
Images Only Displays only the image, and not the column data or heading.
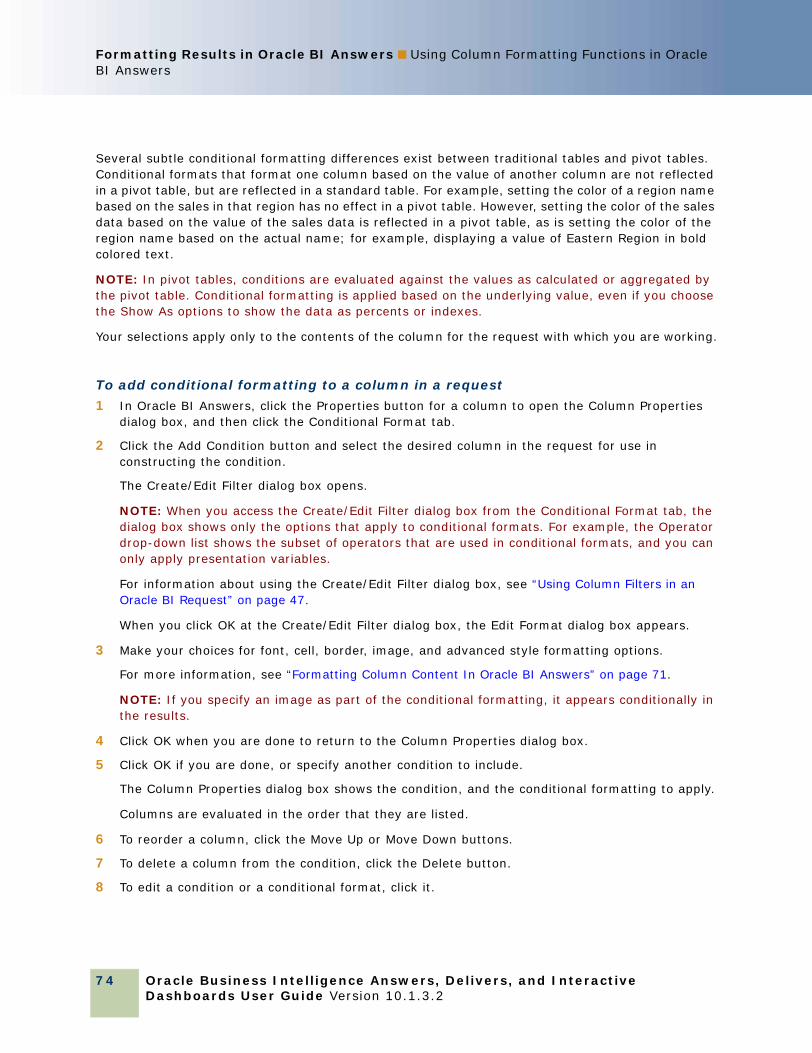
Oracle Business Intelligence Answers, Delivers, and Interactive Dashboards User Guide Version 10.1.3.2
Formatting Results in Oracle BI Answers ■ Using Column Formatting Functions in Oracle BI Answers
74
Several subtle conditional formatting differences exist between traditional tables and pivot tables. Conditional formats that format one column based on the value of another column are not reflected in a pivot table, but are reflected in a standard table. For example, setting the color of a region name based on the sales in that region has no effect in a pivot table. However, setting the color of the sales data based on the value of the sales data is reflected in a pivot table, as is setting the color of the region name based on the actual name; for example, displaying a value of Eastern Region in bold colored text.
NOTE: In pivot tables, conditions are evaluated against the values as calculated or aggregated by the pivot table. Conditional formatting is applied based on the underlying value, even if you choose the Show As options to show the data as percents or indexes.
Your selections apply only to the contents of the column for the request with which you are working.
To add conditional formatting to a column in a request
1 In Oracle BI Answers, click the Properties button for a column to open the Column Properties dialog box, and then click the Conditional Format tab.
2 Click the Add Condition button and select the desired column in the request for use in constructing the condition.
The Create/Edit Filter dialog box opens.
NOTE: When you access the Create/Edit Filter dialog box from the Conditional Format tab, the dialog box shows only the options that apply to conditional formats. For example, the Operator drop-down list shows the subset of operators that are used in conditional formats, and you can only apply presentation variables.
For information about using the Create/Edit Filter dialog box, see “Using Column Filters in an Oracle BI Request” on page 47.
When you click OK at the Create/Edit Filter dialog box, the Edit Format dialog box appears.
3 Make your choices for font, cell, border, image, and advanced style formatting options.
For more information, see “Formatting Column Content In Oracle BI Answers” on page 71.
NOTE: If you specify an image as part of the conditional formatting, it appears conditionally in the results.
4 Click OK when you are done to return to the Column Properties dialog box.
5 Click OK if you are done, or specify another condition to include.
The Column Properties dialog box shows the condition, and the conditional formatting to apply.
Columns are evaluated in the order that they are listed.
6 To reorder a column, click the Move Up or Move Down buttons.
7 To delete a column from the condition, click the Delete button.
8 To edit a condition or a conditional format, click it.

Formatting Results in Oracle BI Answers ■ Using Custom Date/Time Format Strings inOracle BI Answers
Oracle Business Intelligence Answers, Delivers, and InteractiveDashboards User Guide Version 10.1.3.2
75
Example of Applying Conditional Formatting to Oracle BI ResultsThe following example describes how conditional formatting can be applied to results.
Suppose a request includes ten ranking categories, with a value of 1 in the column indicating the worst ranking, and a value of 10 indicating the best ranking. You could apply conditional formatting to show the following:
■ One image to indicate a low rank for columns that contain 1, 2, or 3.
■ Another image to indicate an average rank for columns that contain 4, 5, 6, or 7.
■ A third image to indicate a high rank for columns that contain 8, 9, or 10.
At the Graphics dialog box, selecting the Images Only image placement option would cause the columns to appear with only images, and not the ranking numbers, in the results.
Saving Your Oracle BI Answers Column Property Settings as the System-Wide DefaultsIf your user ID has the appropriate permissions, you can save your settings in the Value Format tab, the Column Format tab, and the Conditional Format tab of the Column Properties dialog box for use as the system-wide defaults for this particular column, or for columns of this particular data type. Anyone who uses this column or columns of this data type in subsequent requests will use the settings in these tabs by default.
To save your settings as the system-wide defaults■ At the Column Properties dialog box in Oracle BI Answers, click the Save button and make your
selection.
NOTE: The Save button is available only to users with the appropriate permissions.
Related Topic“Applying Cosmetic Formatting to Results and Dashboards” on page 81
Using Custom Date/Time Format Strings in Oracle BI AnswersCustom date/time format strings provide additional options for formatting columns that contain timestamps, dates, and times. This section contains the following topics:
■ “Oracle BI Answers General Custom Format Strings” on page 76
■ “Oracle BI Answers ODBC Custom Format Strings” on page 77
■ “Oracle BI Answers Custom Format Strings for Integral Fields” on page 77
■ “Oracle BI Answers Custom Format Strings for Conversion into Hours” on page 78
■ “Oracle BI Answers Custom Format Strings for Conversion into Hours and Minutes” on page 79

Oracle Business Intelligence Answers, Delivers, and Interactive Dashboards User Guide Version 10.1.3.2
Formatting Results in Oracle BI Answers ■ Using Custom Date/Time Format Strings in Oracle BI Answers
76
■ “Oracle BI Answers Custom Format Strings for Conversion into Hours, Minutes, and Seconds” on page 79
To enter a custom date/time format string in Oracle BI Answers
1 From the Criteria tab in Oracle BI Answers, click the Format Column button for a column that contains a timestamp, a date, or a time.
The Column Properties dialog box opens.
2 Select the following option in the Data Format area:
Override Default Data Format
3 In the Date Format field, select Custom from the drop-down list.
4 In the Custom Date Format field, type the custom format string exactly as shown in the following tables, including left and right bracket characters ([ ]).
NOTE: You must type the custom format string into the Custom Date Format field. Custom format strings are not available for selection from the drop-down list.
Oracle BI Answers General Custom Format StringsTable 8 shows the general custom format strings and the results they display. These allow the display of date/time fields in the user’s locale.
Table 8. General Custom Format Strings
General Format String Result
[FMT:dateShort] Formats the date in the locale’s short date format. You can also type [FMT:date].
[FMT:dateLong] Formats the date in the locale’s long date format.
[FMT:dateInput] Formats the date in a format acceptable for input back into the system.
[FMT:time] Formats the time in the locale’s time format.
[FMT:timeHourMin] Formats the time in the locale’s time format but omits the seconds.
[FMT:timeInput] Formats the time in a format acceptable for input back into the system.
[FMT:timeInputHourMin] Formats the time in a format acceptable for input back into the system, but omits the seconds.
[FMT:timeStampShort] Equivalent to typing [FMT:dateShort] [FMT:time]. This formats the date in the locale’s short date format and the time in the locale’s time format. You can also type [FMT:timeStamp].

Formatting Results in Oracle BI Answers ■ Using Custom Date/Time Format Strings inOracle BI Answers
Oracle Business Intelligence Answers, Delivers, and InteractiveDashboards User Guide Version 10.1.3.2
77
Oracle BI Answers ODBC Custom Format StringsTable 9 shows the ODBC standard typed custom format strings and the results they display. These display date/time fields according to the ODBC standard.
Oracle BI Answers Custom Format Strings for Integral FieldsTable 10 shows the custom format strings that are available when working with integral fields. These allow the display of month and day names in the user’s locale.
[FMT:timeStampLong] Equivalent to typing [FMT:dateLong] [FMT:time]. This formats the date in the locale’s long date format and the time in the locale’s time format.
[FMT:timeStampInput] Equivalent to [FMT:dateInput] [FMT:timeInput]. This formats the date and the time in a format acceptable for input back into the system.
[FMT:timeHour] Formats the hour field only in the locale’s format, such as 8 PM.
Table 9. ODBC Custom Format Strings
ODBC Format String Result
[FMT:dateODBC] Formats the date in standard ODBC yyyy-mm-dd format (4-digit year, 2-digit month, 2-digit day).
[FMT:timeODBC] Formats the time in standard ODBC hh:mm:ss format (2-digit hour, 2-digit minute, 2-digit second).
[FMT:timeStampODBC] Equivalent to typing [FMT:dateODBC] [FMT:timeStampODBC]. This formats the date in yyyy-mm-dd format, and the time in hh:mm:ss format.
[FMT:dateTyped] Displays the word date and then shows the date, in standard ODBC yyyy-mm-dd format. The date is shown within single quote characters (‘).
[FMT:timeTyped] Displays the word time and then shows the time, in standard ODBC hh:mm:ss format. The time is shown within single quote characters (‘).
[FMT:timeStampTyped] Displays the word timestamp and then the timestamp, in standard ODBC yyyy-mm-dd hh:mm:ss format. The timestamp is shown within single quote characters (‘).
Table 8. General Custom Format Strings
General Format String Result
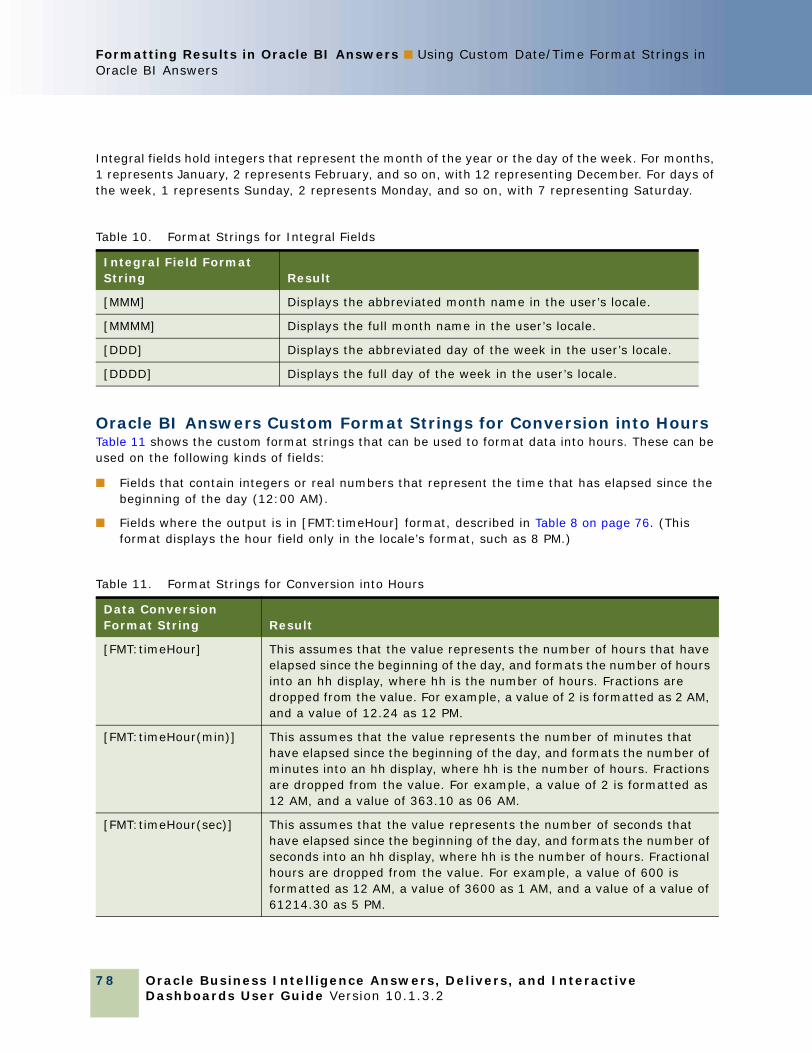
Oracle Business Intelligence Answers, Delivers, and Interactive Dashboards User Guide Version 10.1.3.2
Formatting Results in Oracle BI Answers ■ Using Custom Date/Time Format Strings in Oracle BI Answers
78
Integral fields hold integers that represent the month of the year or the day of the week. For months, 1 represents January, 2 represents February, and so on, with 12 representing December. For days of the week, 1 represents Sunday, 2 represents Monday, and so on, with 7 representing Saturday.
Oracle BI Answers Custom Format Strings for Conversion into HoursTable 11 shows the custom format strings that can be used to format data into hours. These can be used on the following kinds of fields:
■ Fields that contain integers or real numbers that represent the time that has elapsed since the beginning of the day (12:00 AM).
■ Fields where the output is in [FMT:timeHour] format, described in Table 8 on page 76. (This format displays the hour field only in the locale’s format, such as 8 PM.)
Table 10. Format Strings for Integral Fields
Integral Field Format String Result
[MMM] Displays the abbreviated month name in the user’s locale.
[MMMM] Displays the full month name in the user’s locale.
[DDD] Displays the abbreviated day of the week in the user’s locale.
[DDDD] Displays the full day of the week in the user’s locale.
Table 11. Format Strings for Conversion into Hours
Data Conversion Format String Result
[FMT:timeHour] This assumes that the value represents the number of hours that have elapsed since the beginning of the day, and formats the number of hours into an hh display, where hh is the number of hours. Fractions are dropped from the value. For example, a value of 2 is formatted as 2 AM, and a value of 12.24 as 12 PM.
[FMT:timeHour(min)] This assumes that the value represents the number of minutes that have elapsed since the beginning of the day, and formats the number of minutes into an hh display, where hh is the number of hours. Fractions are dropped from the value. For example, a value of 2 is formatted as 12 AM, and a value of 363.10 as 06 AM.
[FMT:timeHour(sec)] This assumes that the value represents the number of seconds that have elapsed since the beginning of the day, and formats the number of seconds into an hh display, where hh is the number of hours. Fractional hours are dropped from the value. For example, a value of 600 is formatted as 12 AM, a value of 3600 as 1 AM, and a value of a value of 61214.30 as 5 PM.
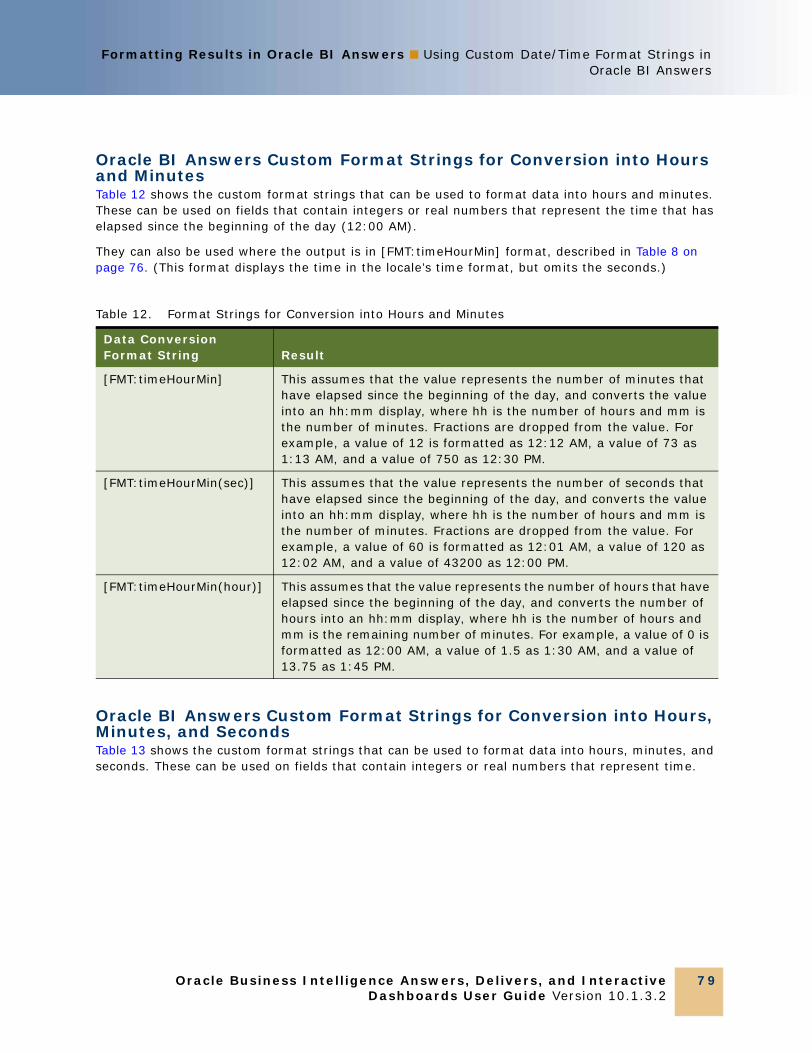
Formatting Results in Oracle BI Answers ■ Using Custom Date/Time Format Strings inOracle BI Answers
Oracle Business Intelligence Answers, Delivers, and InteractiveDashboards User Guide Version 10.1.3.2
79
Oracle BI Answers Custom Format Strings for Conversion into Hours and MinutesTable 12 shows the custom format strings that can be used to format data into hours and minutes. These can be used on fields that contain integers or real numbers that represent the time that has elapsed since the beginning of the day (12:00 AM).
They can also be used where the output is in [FMT:timeHourMin] format, described in Table 8 on page 76. (This format displays the time in the locale’s time format, but omits the seconds.)
Oracle BI Answers Custom Format Strings for Conversion into Hours, Minutes, and SecondsTable 13 shows the custom format strings that can be used to format data into hours, minutes, and seconds. These can be used on fields that contain integers or real numbers that represent time.
Table 12. Format Strings for Conversion into Hours and Minutes
Data Conversion Format String Result
[FMT:timeHourMin] This assumes that the value represents the number of minutes that have elapsed since the beginning of the day, and converts the value into an hh:mm display, where hh is the number of hours and mm is the number of minutes. Fractions are dropped from the value. For example, a value of 12 is formatted as 12:12 AM, a value of 73 as 1:13 AM, and a value of 750 as 12:30 PM.
[FMT:timeHourMin(sec)] This assumes that the value represents the number of seconds that have elapsed since the beginning of the day, and converts the value into an hh:mm display, where hh is the number of hours and mm is the number of minutes. Fractions are dropped from the value. For example, a value of 60 is formatted as 12:01 AM, a value of 120 as 12:02 AM, and a value of 43200 as 12:00 PM.
[FMT:timeHourMin(hour)] This assumes that the value represents the number of hours that have elapsed since the beginning of the day, and converts the number of hours into an hh:mm display, where hh is the number of hours and mm is the remaining number of minutes. For example, a value of 0 is formatted as 12:00 AM, a value of 1.5 as 1:30 AM, and a value of 13.75 as 1:45 PM.
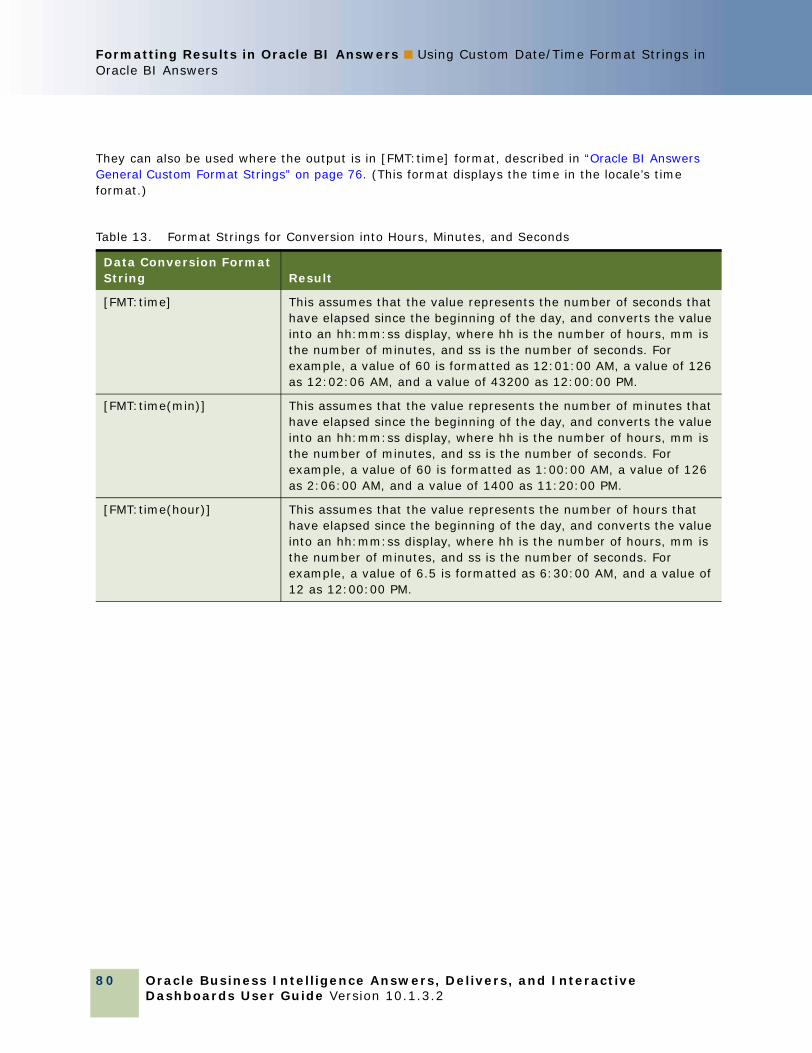
Oracle Business Intelligence Answers, Delivers, and Interactive Dashboards User Guide Version 10.1.3.2
Formatting Results in Oracle BI Answers ■ Using Custom Date/Time Format Strings in Oracle BI Answers
80
They can also be used where the output is in [FMT:time] format, described in “Oracle BI Answers General Custom Format Strings” on page 76. (This format displays the time in the locale’s time format.)
Table 13. Format Strings for Conversion into Hours, Minutes, and Seconds
Data Conversion Format String Result
[FMT:time] This assumes that the value represents the number of seconds that have elapsed since the beginning of the day, and converts the value into an hh:mm:ss display, where hh is the number of hours, mm is the number of minutes, and ss is the number of seconds. For example, a value of 60 is formatted as 12:01:00 AM, a value of 126 as 12:02:06 AM, and a value of 43200 as 12:00:00 PM.
[FMT:time(min)] This assumes that the value represents the number of minutes that have elapsed since the beginning of the day, and converts the value into an hh:mm:ss display, where hh is the number of hours, mm is the number of minutes, and ss is the number of seconds. For example, a value of 60 is formatted as 1:00:00 AM, a value of 126 as 2:06:00 AM, and a value of 1400 as 11:20:00 PM.
[FMT:time(hour)] This assumes that the value represents the number of hours that have elapsed since the beginning of the day, and converts the value into an hh:mm:ss display, where hh is the number of hours, mm is the number of minutes, and ss is the number of seconds. For example, a value of 6.5 is formatted as 6:30:00 AM, and a value of 12 as 12:00:00 PM.
Formatting Results in Oracle BI Answers ■ Applying Cosmetic Formatting to Results andDashboards
Oracle Business Intelligence Answers, Delivers, and InteractiveDashboards User Guide Version 10.1.3.2
81
Applying Cosmetic Formatting to Results and DashboardsCosmetic formatting affects the visual appearance of results and dashboards. You can apply cosmetic formatting, copy and paste cosmetic formatting attributes, and save a formatted request to use as a style template. This section contains the following topics:
■ “Customizing the Cosmetic Appearance of Reports and Dashboards” on page 81
■ “Copying, Pasting, and Clearing Cosmetic Formatting Attributes” on page 82
■ “Using a Saved Request as a Style Template for the Cosmetic Appearance of Other Requests” on page 83
Customizing the Cosmetic Appearance of Reports and DashboardsIn Oracle BI Answers and in the Dashboard Editor, a cosmetic formatting dialog box provides access to and control over cosmetic attributes of reports and dashboards. Depending on the object you are formatting, the dialog box displays different options, such as font, cell, and border controls, background color, additional formatting options such as cell padding, and custom CSS style options for HTML.
In an Oracle BI Interactive Dashboard, cosmetic formatting affects the visual appearance of columns and sections on a dashboard, such as background color and borders. In Oracle BI Answers, cosmetic formatting affects the visual appearance of objects such as columns in tables and the size of titles.
When selections for horizontal and vertical alignment appear, they are similar to text justification selections in word processors. Vertical alignment does not have any impact unless the column spans multiple rows of other columns.
The following procedures explain how to access and use the cosmetic formatting dialog box.
To access the common format dialog box■ Perform one of the following actions:
■ In the Dashboard Editor, click the Properties button for a column or section and choose the Format Column or Format Section option, respectively.
■ In Oracle BI Answers, from a view that supports cosmetic formatting, click the cosmetic formatting button.
NOTE: In the table view, you can also click the format column button and use the Value Format tab. In the pivot table view, you can also click the section properties button and use the Section Properties tab.
The cosmetic format dialog box appears.
To use the cosmetic format dialog box
1 In the Font area, make your selections for font family, size, color, style (such as bold), and any effects to apply (such as underlining).

Oracle Business Intelligence Answers, Delivers, and Interactive Dashboards User Guide Version 10.1.3.2
Formatting Results in Oracle BI Answers ■ Applying Cosmetic Formatting to Results and Dashboards
82
2 In the Cell area, make your selections for alignment.
■ For horizontal alignment, choose one of the options described in the following table.
■ For vertical alignment, choose one of the options described in the following table.
3 In the Cell area, make your selection for a background color.
4 In the Border area, make your selections for the border position, color, and style of the cell.
TIP: You can select or deselect custom borders by clicking the top, bottom, left, and right borders near the Position drop-down list.
5 To override style and class elements specified in Oracle BI style sheets, make your selections in the Advanced Style Options (CSS) area:
a Click the settings you want to use.
b Provide the location of the class, style, or style sheet.
NOTE: The advanced style formatting options are for use by users who know how to work with cascading style sheets.
6 Click OK when you are done.
Copying, Pasting, and Clearing Cosmetic Formatting AttributesIn Oracle BI Answers, you can copy the range of cosmetic formatting attributes that you apply to an object, such as a column in a table, and paste them to an object of the same type, such as another column in the table or a column in a different table. You can also restore the default appearance.
Views that support copying and pasting include the table, pivot table, and chart views.
Option Usage Notes
Left Left justifies the data. This is the most common justification for text data.
Right Right justifies the data. This is the most common justification for numeric data.
Center Centers the data.
Default Retains the default data alignment.
Option Usage Notes
Top Aligns the data to the top.
Bottom Aligns the data to the bottom.
Center Aligns the data to the middle.
Default Retains the default vertical alignment.
Formatting Results in Oracle BI Answers ■ Applying Cosmetic Formatting to Results andDashboards
Oracle Business Intelligence Answers, Delivers, and InteractiveDashboards User Guide Version 10.1.3.2
83
To copy and paste a formatting attribute
1 Select the object whose formatting you want to copy, such as a row, column, or table cell.
2 Access the cosmetic formatting dialog box and click the copy formatting button.
3 Select the object to which you want to paste the formatting, access the cosmetic formatting dialog box, and click the paste formatting button.
To restore the default appearance■ Access the cosmetic formatting dialog box for the object, and then click the clear formatting
button.
Using a Saved Request as a Style Template for the Cosmetic Appearance of Other RequestsIn Oracle BI Answers, after you have customized the cosmetic appearance of a request and saved it, you can use it as a template. This allows you apply the formatting from the saved request to new or existing requests.
Views that support the use of a saved request as a template include the table, pivot table, and chart views.
To use a saved request as a template
1 Click the import view formatting button near the top of the workspace:
2 At the Choose Request dialog box, navigate to saved request and click OK.
3 Click the Saved Results link, or the dashboard preview button to view the results (if available).
NOTE: If the preview button is not available, your Oracle BI Presentation Services administrator has suppressed its display.

Oracle Business Intelligence Answers, Delivers, and Interactive Dashboards User Guide Version 10.1.3.2
Formatting Results in Oracle BI Answers ■ Applying Cosmetic Formatting to Results and Dashboards
84

Oracle Business Intelligence Answers, Delivers, and InteractiveDashboards User Guide Version 10.1.3.2
85
6
6 Working with Oracle BI Views in Oracle BI Answers
This chapter describes how to create and modify Oracle BI views. It contains the following topics:
■ “About Oracle BI Views” on page 85
■ “Performing Common Tasks When Working with Oracle BI Views” on page 91
■ “Assembling Views for Display on a Dashboard Using Oracle BI Compound Layout View” on page 96
■ “Adding Titles to Results Using Oracle BI Title View” on page 98
■ “Adding Tables to Results Using Oracle BI Table View” on page 100
■ “Editing the Formula of a Column” on page 103
■ “Showing Results in Charts Using Oracle BI Chart View” on page 107
■ “Showing Results in Pivot Tables Using Oracle BI Pivot Table View” on page 125
■ “Showing Results as Gauges Using Oracle BI Gauge View” on page 137
■ “Showing Filters Applied to Results Using Oracle BI Filters View” on page 144
■ “Allowing Users to Change Columns in Requests Using Oracle BI Column Selector View” on page 144
■ “Allowing Users to Select a Specific View Using View Selector View” on page 145
■ “Adding a Legend to Results Using Oracle BI Legend View” on page 146
■ “Showing Results in a Funnel Chart Using Oracle BI Funnel Chart View” on page 146
■ “Adding Narrative Text to Results Using Oracle BI Narrative View” on page 148
■ “Showing Results in a Scrolling Ticker Using Oracle BI Ticker View” on page 151
■ “Adding Text to Results Using Oracle BI Static Text View” on page 154
■ “Alerting Users to No Data Using Oracle BI No Results View” on page 157
■ “Showing the Logical SQL for a Request Using Oracle BI Logical SQL View” on page 157
■ “Creating Segments in Oracle’s Siebel Marketing Using Oracle BI Create Segment View” on page 158
■ “Creating Lists of Contacts and Accounts Using Oracle BI Create Target List View” on page 159
About Oracle BI ViewsThis section provides general information about Oracle BI views and working with results. It contains the following topics:
■ “Overview of Oracle BI Views” on page 86
■ “Descriptions of Oracle BI Views” on page 87

Oracle Business Intelligence Answers, Delivers, and Interactive Dashboards User Guide Version 10.1.3.2
Working with Oracle BI Views in Oracle BI Answers ■ About Oracle BI Views
86
■ “Formatting Data Types and Configuring Data-Driven Navigation Using Oracle BI Custom Formatters” on page 90
■ “Drilling Down on Results in Oracle BI” on page 91
Overview of Oracle BI ViewsViews use the presentation capabilities of Oracle BI Presentation Services to help you look at results in meaningful, intuitive ways. You can add a variety of views to results, such as charts and pivot tables that allow drilling down to more detailed information, explanatory text, a list of filters that were used to limit the results, and more.
When you run a new request, Oracle BI displays results in a table, with a title preceding the table, by default. (Your Oracle BI Presentation Services administrator may have configured a different default results view for your organization.) It does this by including a title view, which displays the name of the saved request, and a table view, which displays the results in a basic table. You can customize or delete these existing views for a request, add other views, and combine and position views anywhere in the workspace.
Preparing multiple views of results can help you identify trends and relationships in data. If you are customizing results for display on a dashboard, you can preview how the combination and position of views will look when viewed on a dashboard.
You can then save the request with the collection of views. If the request is embedded in a dashboard, the dashboard page can also include elements such as links to additional requests of interest, related graphics, or news stories.

Working with Oracle BI Views in Oracle BI Answers ■ About Oracle BI Views
Oracle Business Intelligence Answers, Delivers, and InteractiveDashboards User Guide Version 10.1.3.2
87
Descriptions of Oracle BI ViewsViews are available for selection on the Results tab in Oracle BI Answers. The views are described in Table 14. Several frequently accessed views are also available by clicking the appropriate view button on the Criteria tab in Oracle BI Answers.
NOTE: Your permissions control whether you can access all views, or specific views only.
Table 14. Oracle BI View Names and Descriptions
View Name Description
Compound Layout Use the compound layout view to assemble different views for display on a dashboard.
On the Criteria tab, you can click the following button to access the compound layout view.
For more information, see “Assembling Views for Display on a Dashboard Using Oracle BI Compound Layout View” on page 96.
Title Use the title view to add a title, a subtitle, a logo, a link to a custom online help page, and timestamps to the results.
For more information, see “Adding Titles to Results Using Oracle BI Title View” on page 98.
Table Use the table view to show results in a standard table. Users can navigate and drill down in the results. You can add totals, customize headings, and change the formula or aggregation rule for a column. You can also control the appearance of a column and its contents, and specify formatting to apply only if the contents of the column meet certain conditions.
On the Criteria tab, you can click the following button to access the table view.
For more information, see “Adding Tables to Results Using Oracle BI Table View” on page 100.
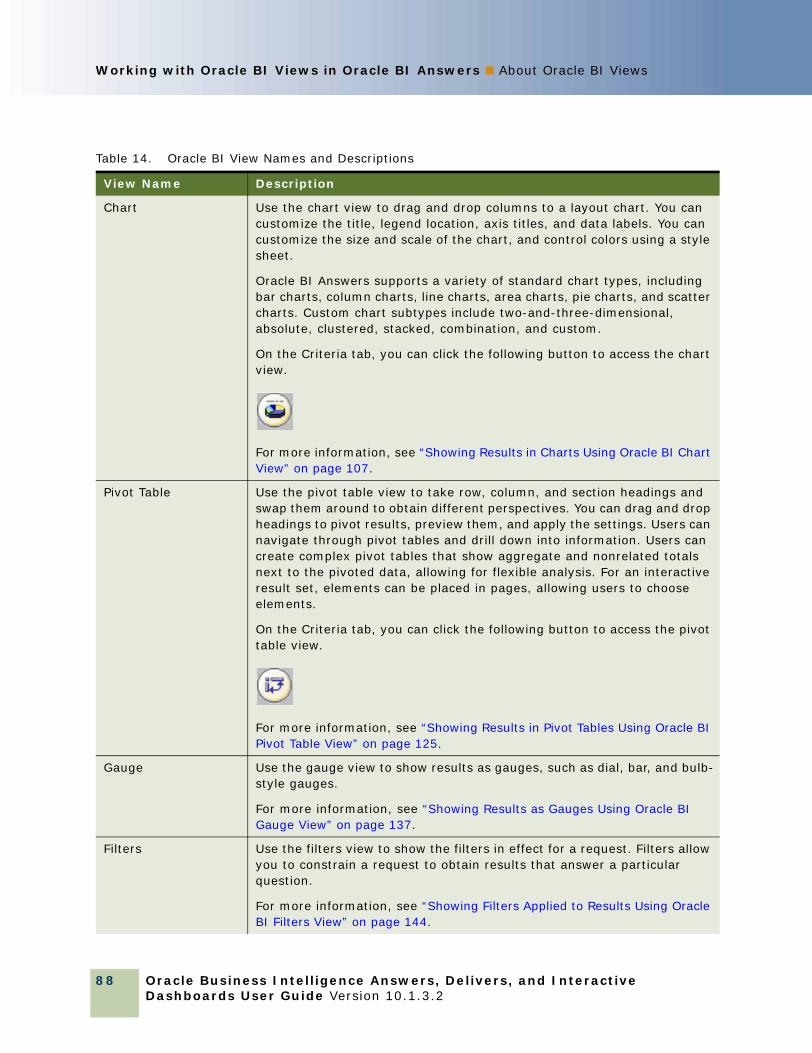
Oracle Business Intelligence Answers, Delivers, and Interactive Dashboards User Guide Version 10.1.3.2
Working with Oracle BI Views in Oracle BI Answers ■ About Oracle BI Views
88
Chart Use the chart view to drag and drop columns to a layout chart. You can customize the title, legend location, axis titles, and data labels. You can customize the size and scale of the chart, and control colors using a style sheet.
Oracle BI Answers supports a variety of standard chart types, including bar charts, column charts, line charts, area charts, pie charts, and scatter charts. Custom chart subtypes include two-and-three-dimensional, absolute, clustered, stacked, combination, and custom.
On the Criteria tab, you can click the following button to access the chart view.
For more information, see “Showing Results in Charts Using Oracle BI Chart View” on page 107.
Pivot Table Use the pivot table view to take row, column, and section headings and swap them around to obtain different perspectives. You can drag and drop headings to pivot results, preview them, and apply the settings. Users can navigate through pivot tables and drill down into information. Users can create complex pivot tables that show aggregate and nonrelated totals next to the pivoted data, allowing for flexible analysis. For an interactive result set, elements can be placed in pages, allowing users to choose elements.
On the Criteria tab, you can click the following button to access the pivot table view.
For more information, see “Showing Results in Pivot Tables Using Oracle BI Pivot Table View” on page 125.
Gauge Use the gauge view to show results as gauges, such as dial, bar, and bulb-style gauges.
For more information, see “Showing Results as Gauges Using Oracle BI Gauge View” on page 137.
Filters Use the filters view to show the filters in effect for a request. Filters allow you to constrain a request to obtain results that answer a particular question.
For more information, see “Showing Filters Applied to Results Using Oracle BI Filters View” on page 144.
Table 14. Oracle BI View Names and Descriptions
View Name Description
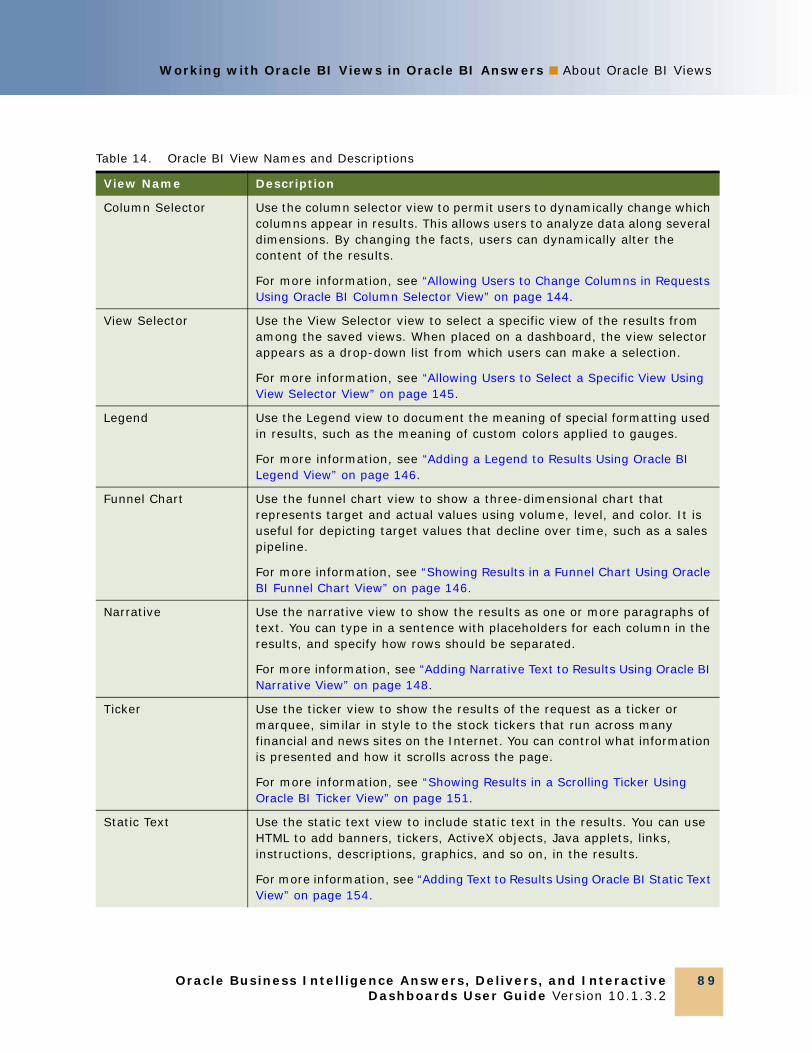
Working with Oracle BI Views in Oracle BI Answers ■ About Oracle BI Views
Oracle Business Intelligence Answers, Delivers, and InteractiveDashboards User Guide Version 10.1.3.2
89
Column Selector Use the column selector view to permit users to dynamically change which columns appear in results. This allows users to analyze data along several dimensions. By changing the facts, users can dynamically alter the content of the results.
For more information, see “Allowing Users to Change Columns in Requests Using Oracle BI Column Selector View” on page 144.
View Selector Use the View Selector view to select a specific view of the results from among the saved views. When placed on a dashboard, the view selector appears as a drop-down list from which users can make a selection.
For more information, see “Allowing Users to Select a Specific View Using View Selector View” on page 145.
Legend Use the Legend view to document the meaning of special formatting used in results, such as the meaning of custom colors applied to gauges.
For more information, see “Adding a Legend to Results Using Oracle BI Legend View” on page 146.
Funnel Chart Use the funnel chart view to show a three-dimensional chart that represents target and actual values using volume, level, and color. It is useful for depicting target values that decline over time, such as a sales pipeline.
For more information, see “Showing Results in a Funnel Chart Using Oracle BI Funnel Chart View” on page 146.
Narrative Use the narrative view to show the results as one or more paragraphs of text. You can type in a sentence with placeholders for each column in the results, and specify how rows should be separated.
For more information, see “Adding Narrative Text to Results Using Oracle BI Narrative View” on page 148.
Ticker Use the ticker view to show the results of the request as a ticker or marquee, similar in style to the stock tickers that run across many financial and news sites on the Internet. You can control what information is presented and how it scrolls across the page.
For more information, see “Showing Results in a Scrolling Ticker Using Oracle BI Ticker View” on page 151.
Static Text Use the static text view to include static text in the results. You can use HTML to add banners, tickers, ActiveX objects, Java applets, links, instructions, descriptions, graphics, and so on, in the results.
For more information, see “Adding Text to Results Using Oracle BI Static Text View” on page 154.
Table 14. Oracle BI View Names and Descriptions
View Name Description

Oracle Business Intelligence Answers, Delivers, and Interactive Dashboards User Guide Version 10.1.3.2
Working with Oracle BI Views in Oracle BI Answers ■ About Oracle BI Views
90
Formatting Data Types and Configuring Data-Driven Navigation Using Oracle BI Custom FormattersOracle BI custom formatters allow you to format data types for display, such as showing dates in the formats mm/yy, or yyyy mm, or yyyy-mm-dd, and so on. When combined with SQL CASE functions, custom formatters allow you to add graphical indicators such as stop lighting, voting bars, scorecards, and more.
Custom formatters also allow data-driven navigation to related requests and content. Data-driven navigation using custom formatters is supported from the table and pivot table views.
For information about custom formatters, see “Using Column Formatting Functions in Oracle BI Answers” on page 67.
No Results The no results view allows you to specify explanatory text to appear if the request does not return any results.
For more information, see “Alerting Users to No Data Using Oracle BI No Results View” on page 157.
Logical SQL Use the logical SQL view to show the SQL generated for the request. This view is useful for trainers and Oracle BI administrators, and is usually not included in results for typical users.
You cannot modify this view, except to delete it.
For information about working with the logical SQL view, see “Showing the Logical SQL for a Request Using Oracle BI Logical SQL View” on page 157.
Create Segment The create segment view is for users of the Oracle’s Siebel Marketing Version 7.7 (or higher) operational application. Use it to display a Create Segment link in the results. Users can click this link to create a segment in their Oracle Siebel Marketing operational application, based on the results data.
For information about working with the create segment view, see “Creating Segments in Oracle’s Siebel Marketing Using Oracle BI Create Segment View” on page 158.
Create Target List The create target list view is for users of Oracle’s Siebel Life Sciences operational application integrated with Oracle’s Siebel Life Sciences Analytics applications. Use it to create a Create Target List link in the results. Users can click this link to create a target list, based on the results data, in their Oracle Siebel operational application.
For information about working with the create target list view, see “Creating Lists of Contacts and Accounts Using Oracle BI Create Target List View” on page 159.
Table 14. Oracle BI View Names and Descriptions
View Name Description

Working with Oracle BI Views in Oracle BI Answers ■ Performing Common Tasks WhenWorking with Oracle BI Views
Oracle Business Intelligence Answers, Delivers, and InteractiveDashboards User Guide Version 10.1.3.2
91
Drilling Down on Results in Oracle BIIf the Oracle BI administrator set up dimensional level hierarchies for the subject area, users can drill down on data in charts, tables and pivot tables. For more information, see Oracle Business Intelligence Server Administration Guide.
Related Topics“Overview of Oracle BI Answers” on page 25
“Performing Common Tasks When Working with Oracle BI Views” on page 91
Performing Common Tasks When Working with Oracle BI ViewsWhen you are working with the various result views in Oracle BI Answers, you can perform some tasks, such as accessing the compound layout view or previewing a view. This section provides the procedures to perform these common tasks. It contains the following topics:
■ “Saving an Oracle BI View” on page 91
■ “Printing an Oracle BI View” on page 92
■ “Making a Copy of or Duplicating an Oracle BI View” on page 93
■ “Previewing How an Oracle BI View Will Appear on an Oracle BI Interactive Dashboard” on page 93
■ “Deleting an Oracle BI View” on page 93
■ “Refreshing the Results in an Oracle BI View” on page 94
■ “Creating a New Request While Working with an Oracle BI View” on page 94
■ “Opening a Saved Request While Working with an Oracle BI View” on page 94
■ “Accessing the Compound Layout View from Another Oracle BI View” on page 95
■ “Customizing an Oracle BI View for Delivery to Oracle BI Delivers Users” on page 95
Saving an Oracle BI ViewIn Oracle BI Answers, you can save the view with which you are working at any time.
To save an Oracle BI view
1 Click the following button near the top of the workspace:
2 At the Choose Folder dialog box, choose a personal or shared folder in which to save the view.
To specify a subfolder, perform one of the following actions:
■ Navigate to it.

Oracle Business Intelligence Answers, Delivers, and Interactive Dashboards User Guide Version 10.1.3.2
Working with Oracle BI Views in Oracle BI Answers ■ Performing Common Tasks When Working with Oracle BI Views
92
■ Click Create Folder to create a new subfolder.
■ Type the path in the Folder box.
3 Type a descriptive name for the view.
The name will appear when a user pauses the mouse on the request in the selection pane.
4 (Optional) Type a description for the view.
Descriptions are displayed when Oracle BI administrators use the Catalog Manager.
5 Click OK.
Printing an Oracle BI ViewIn Oracle BI Interactive Dashboards and Oracle BI Answers, you can specify PDF and print control options, add headers and footers, and print the object with which you are working using HTML or Adobe PDF (Portable Document Format). Adobe Reader 6.0 or greater is required to print using Adobe PDF.
NOTE: The HTML method of printing relies on the print handling capabilities of your browser. If you do not get the results you want, choose PDF to open and then print the dashboard or request.
To specify PDF and print control settings
1 Click the following button near the top of the workspace:
The PDF and Print Control dialog box appears.
For more information, see the section about changing PDF and printing options in “Modifying Oracle BI Interactive Dashboard Properties Using the Dashboard Editor” on page 213.
To print an Oracle BI view
1 Click the following button near the top of the workspace:
2 Choose HTML or PDF.
■ For HTML, a new window shows the selected item.
Choose File > Print on the browser menu.
■ For PDF, an Adobe PDF window shows the selected item.
Use the options available in the Adobe PDF window to save or print the file.

Working with Oracle BI Views in Oracle BI Answers ■ Performing Common Tasks WhenWorking with Oracle BI Views
Oracle Business Intelligence Answers, Delivers, and InteractiveDashboards User Guide Version 10.1.3.2
93
Making a Copy of or Duplicating an Oracle BI ViewIn Oracle BI Answers, you can duplicate a view to create a copy of it. Duplicating a view is useful when you want to make changes to it while preserving the original view, or when you want create a new view based on an existing view.
The duplicated view name has the numeral 2 appended to it. You can change the name when you save the view.
To duplicate an Oracle BI view
1 From any view in Oracle BI Answers, click the following button near the top of the workspace:
2 Choose Duplicate View from the list.
The duplicated view appears in the workspace.
Previewing How an Oracle BI View Will Appear on an Oracle BI Interactive DashboardIn Oracle BI Answers, you can preview an Oracle BI view to see how it will appear on a dashboard. When you preview the compound layout view, you can see how the collection of views will appear.
When you are working with views in Oracle BI Answers that show results data, such as the table and pivot table views, you can also see the results as you work with the view.
To preview an Oracle BI view as it will appear on a dashboard■ Click the preview button to near the top of the workspace:
NOTE: If the preview button is not available, your Oracle BI Presentation Services administrator has suppressed its display.
The dashboard preview appears in a new window.
To see the results as you work with the view
1 Select the option Display Results.
2 Click the Display Results link to view the results.
Deleting an Oracle BI ViewIn Oracle BI Answers, you can delete the view with which you are working at any time.

Oracle Business Intelligence Answers, Delivers, and Interactive Dashboards User Guide Version 10.1.3.2
Working with Oracle BI Views in Oracle BI Answers ■ Performing Common Tasks When Working with Oracle BI Views
94
To delete an Oracle BI view
1 Click the following button near the top of the workspace:
2 Choose Delete View from the list.
The workspace displays either the compound layout view or another view.
Refreshing the Results in an Oracle BI ViewWhen you are working with views in Oracle BI Answers that show results data, such as the table and pivot table views, you can refresh the results of the current request. Refreshing results is useful if you make a change such as adding a filter that limits results and you want to see the effects of your change.
To refresh the results of the current request in an Oracle BI view
1 Click the following button near the top of the workspace:
For information about how the refresh feature works, see “Refreshing an Oracle BI Interactive Dashboard or Oracle BI Request” on page 18.
Creating a New Request While Working with an Oracle BI ViewIn Oracle BI Answers, you can create a new request while you are working with a view for the current request.
To create a new Oracle BI request
1 Save the view with which you are working.
If you do not save the current view, any changes you made to it are discarded.
2 Click the following button near the top of the workspace:
3 Click a subject area in the list to select it.
4 The workspace displays the Criteria tab, where you can create the new request.
Opening a Saved Request While Working with an Oracle BI ViewIn Oracle BI Answers, you can work with a previously saved request while you are working with a view for the current request.
Working with Oracle BI Views in Oracle BI Answers ■ Performing Common Tasks WhenWorking with Oracle BI Views
Oracle Business Intelligence Answers, Delivers, and InteractiveDashboards User Guide Version 10.1.3.2
95
To open a saved Oracle BI request
1 Save the view with which you are working.
If you do not save the current view, any changes you made to it are discarded.
2 Click the following button near the top of the workspace:
3 In the Open dialog box, navigate to the request and click OK.
The workspace displays the Criteria tab, where you can modify the new request.
Accessing the Compound Layout View from Another Oracle BI ViewWhen you are working with a view in Oracle BI Answers, you can access or return to the compound layout view at any time.
To access or return to the Oracle BI compound layout view
1 Click the following button near the top of the workspace:
The compound layout view appears in the workspace. The view that you were working with appears in the workspace at the compound layout view, together with any other views.
Customizing an Oracle BI View for Delivery to Oracle BI Delivers UsersOracle BI automatically formats delivery content based on the destinations specified at the Destinations tab in Oracle BI Delivers. If you want to have manual control of a view’s format for a particular destination, you can use the Specialize View feature in Oracle BI Answers to override the Oracle BI format. You can specialize an entire compound layout view or only certain views. The override remains in force until the specialized view is removed.
To specialize an Oracle BI view for delivery
1 Click the following button near the top of the workspace:
2 Choose Specialize View, and then make a selection from the list.
■ HTML
HTML is typically used for dashboards. A specialized HTML view has (HTML) appended to its name.

Oracle Business Intelligence Answers, Delivers, and Interactive Dashboards User Guide Version 10.1.3.2
Working with Oracle BI Views in Oracle BI Answers ■ Assembling Views for Display on a Dashboard Using Oracle BI Compound Layout View
96
■ Delivery
Delivery is typically used for iBot content delivered to users’ delivery devices. A specialized Delivery view has (Delivery) appended to its name.
■ Text (Mobile devices)
Text is typically used for devices such as text-capable cellular phones. A specialized Text view has (Text) appended to its name.
The view changes to the specialized view.
3 Save the view.
Related Topic“Applying Cosmetic Formatting to Results and Dashboards” on page 81
Assembling Views for Display on a Dashboard Using Oracle BI Compound Layout ViewThis section provides the procedure to access the compound layout view and use it to assemble different views for display on a dashboard. It contains the following topics:
■ “Adding, Deleting, and Rearranging Oracle BI Result Views in Oracle BI Answers” on page 96
■ “Editing the Properties of an Oracle BI View in Oracle BI Answers” on page 98
To access the Oracle BI compound layout view
1 In Oracle BI Answers, create or modify the request with which you want to work.
2 At the Criteria tab or the Results tab, click the following button:
You can also click the Results tab and choose Compound Layout from the views drop-down list.
The compound layout view appears in the workspace.
Adding, Deleting, and Rearranging Oracle BI Result Views in Oracle BI AnswersThis section provides the procedures to add, delete, and reposition views using the compound layout view in Oracle BI Answers.

Working with Oracle BI Views in Oracle BI Answers ■ Assembling Views for Display ona Dashboard Using Oracle BI Compound Layout View
Oracle Business Intelligence Answers, Delivers, and InteractiveDashboards User Guide Version 10.1.3.2
97
To add a new Oracle BI view
1 Click the following button in the Add View area near the top of the workspace:
2 Select a view from the list.
The new view is positioned at the end of the workspace.
NOTE: To add a new table, chart, pivot table, or filters view, you can also click the appropriate button in the Add View area near the top of the workspace.
To delete an Oracle BI view
1 Click the following button on the view:
The view is removed from the workspace.
To rearrange an Oracle BI viewYou can use your mouse to rearrange a view (e.g. title, legend, table, chart).
1 Place the cursor just inside the top edge of the view to be rearranged.
2 Click and hold the left mouse button (if configured) on the view.
The view is displayed as a transparent moveable object.
3 Use the mouse to drag the view to the required position.
A view can be rearranged as follows:
■ At the boundary of a view.
Each view has four boundaries (upper, lower, left or right), and can be arranged alongside the boundaries of other views in a report. You can drag and drop a view to display it next to the boundary of another view.
■ At the outer boundary of the report.
Each report contains one or more views arranged in either a square or a rectangle. The report has four boundaries (upper, lower, left and right). You can drag and drop a view to the outer boundary of a report. This action will display the view across the entire length or breadth of the report.
4 Release the mouse button.
The view is rearranged in the workspace in the position indicated by the yellow bar.
5 Repeat the previous steps to rearrange further views.
Oracle Business Intelligence Answers, Delivers, and Interactive Dashboards User Guide Version 10.1.3.2
Working with Oracle BI Views in Oracle BI Answers ■ Adding Titles to Results Using Oracle BI Title View
98
Editing the Properties of an Oracle BI View in Oracle BI AnswersFrom the compound layout view, you can go directly to the appropriate screen for any view workspace.
To edit the properties of an Oracle BI view■ Click the following button on the view:
The workspace changes to show the options and settings for the view.
Related Topics“Overview of Oracle BI Answers” on page 25
“Performing Common Tasks When Working with Oracle BI Views” on page 91
Adding Titles to Results Using Oracle BI Title ViewUse the title view to add a title, a subtitle, a logo, a link to a custom online help page, and timestamps to the results. Titles and subtitles are formatted using the style sheet in use at your organization.
A title view is always added to the results, as the first view.
To work with an Oracle BI title view
1 In Oracle BI Answers, create or modify the request with which you want to work, and then perform one of the following actions:
■ To add a new title view, click the Results tab and choose Title from the views drop-down list.
■ To edit an existing title view, click the Results tab, choose Compound Layout from the views drop-down list, and then click the Edit View button for the title view.
The workspace shows the options and settings for the view.
2 In the Title text box, type the text to display as the title.
NOTE: The Title text box supports text, server variables (e.g. @{user.id}, @{system.CurrentTime}), and presentation variables (e.g. @{myFavoriteRegion}). Do not include HTML markup.
For more information about presentation variables, see “Using a Saved Oracle BI Request as a Filter” on page 64.
If you do not specify a title, the name of the saved request is used as the title. For unsaved requests, the Title text box is blank.

Working with Oracle BI Views in Oracle BI Answers ■ Adding Titles to Results UsingOracle BI Title View
Oracle Business Intelligence Answers, Delivers, and InteractiveDashboards User Guide Version 10.1.3.2
99
3 If you do not want the saved name of the request to appear, clear the following check box:
Display Saved Name
4 (Optional) In the Subtitle text box, type the text to display as a subtitle.
The subtitle text will follow the actual title, on a new line.
5 If you want to add additional formatting to the title or subtitle, perform the following actions:
a Click the edit buttons to the right of the Title and Subtitle dialog boxes.
b Make your choices for font, cell, and border options, and then click OK.
NOTE: If you type a new caption, it replaces the original title or subtitle.
6 If you want to provide a link to customized help or other information related to the request, type the appropriate URL in the Help URL text box.
The URL should be one that is accessible to all users who will view this request.
7 If you want to display a logo image or other graphic, specify the appropriate path in the Logo text box.
The image or graphic should be one that is accessible to all users who will view this request.
You can use a function called fmap to reference images located in the current Analytics style directory. This packages custom graphics with the style and makes them portable.
The fmap syntax is as follows:
fmap:location/image_name
where:
The following is an example of a complete fmap command:
fmap:Images/newlogo.gif
You can also reference images stored in a folder within the current skins directory.
8 If you want to display the date or time when the request started to execute, select one of the timestamp options from the Started Time drop-down list.
9 When you are done, you can save the request with the title view.
fmap: Begins the fmap function.
location The path to the folder in the current style directory (s_stylename), such as Images. For example:
s_oracle/Images
NOTE: Logo images and graphics located in the current style directory should all be stored in the same folder.
/ Required separator.
image_name The name of the graphic, for example:
newlogo.gif
Oracle Business Intelligence Answers, Delivers, and Interactive Dashboards User Guide Version 10.1.3.2
Working with Oracle BI Views in Oracle BI Answers ■ Adding Tables to Results Using Oracle BI Table View
100
Related Topics“Overview of Oracle BI Answers” on page 25
“Performing Common Tasks When Working with Oracle BI Views” on page 91
Adding Tables to Results Using Oracle BI Table ViewUse the table view to show results in a standard table. Users can navigate and drill down in the results. You can add report totals and column totals, specify custom table and column headings, and change the formula or aggregation rule for a column. You can also edit properties for a column to control the appearance and layout of a column and its contents, and specify formatting to apply only if the contents of the column meet certain conditions.
You can also specify paging controls and the number of rows per page, display column and table headings, apply green bar styling, and enable column sorting in dashboards. In a dashboard, the column headers of tables that can be sorted have a slightly raised visual appearance.
If your user name has the appropriate permissions, you can also add the write-back capability to the table view that allows a user to update or write to the back-end database. For example, a user can enter sales targets for the current quarter in a Sales dashboard. The Oracle BI Presentation Services administrator needs to set up and configure the write-back capability before you can add this capability to a table view. For more information about the write-back capability, see Oracle Business Intelligence Presentation Services Administration Guide.
A table view is added to the results as the second view by default. (Your Oracle BI Presentation Services administrator may have configured a different default results view for your organization.)
To work with an Oracle BI table view
1 In Oracle BI Answers, create or modify the request with which you want to work, and then perform one of the following actions:
■ To add a new table view, click the Results tab and choose Table from the views drop-down list.
You can also add a table view by clicking the Table button at the compound layout view or at the Criteria tab.
■ To edit an existing table view, click the Results tab, choose Compound Layout from the views drop-down list, and then click the Edit View button for the table view.
The workspace shows the options and settings for the view.
2 To view the buttons for working with each column individually, select the option to show header toolbars.
3 To specify the sort order for one or more columns that appear in a request, click the Order By button for a column.
You can order results by more than one column. If you choose more than one column, the order is shown on the Order By button. For more information about sorting, see “Specifying the Sort Order for Columns in Oracle BI Requests” on page 35.

Working with Oracle BI Views in Oracle BI Answers ■ Adding Tables to Results UsingOracle BI Table View
Oracle Business Intelligence Answers, Delivers, and InteractiveDashboards User Guide Version 10.1.3.2
101
4 To specify report totals, perform the following actions:
■ To add a grand total for the report, click the Grand Totals button at the top of the workspace and make sure the option Report-Based Total is selected.
■ To add totals for an individual column, click the Total By button for that column and make sure the option Report-Based Total is selected.
The Total By button is available only for columns that can be totaled.
NOTE: If the option Report-Based Total is not selected, the Oracle BI Server will calculate the total based on the entire result set, before applying any filters to the measures.
■ To insert custom text into a total heading, click the Total By button and select the Format Labels option to display the Edit Format dialog box. Enter the custom text into the Caption field as follows:
❏ @ - displays the value of the dataFor example, if a total is specified for the Region column, and you enter the following text into the Caption field for the total heading:- All values in the @
the total heading would display the following text for the Western Region:- All values in the Western Region
❏ "@" - displays the @ symbol
❏ "\"" - displays the double quote
❏ "\\" - displays the \ symbol
❏ \ - displays the \ symbol
The double quote syntax is not limited to a single character. In general you can use a backslash escaped string inside double quotes. For example:
❏ "1234567890\\abc\\d\"x\"yz!@#$%^&*()-+=_{}[];:'|?/><,.` ~"
is displayed as:
❏ 1234567890\abc\d"x"yz!@#$%^&*()-+=_{}[];:'|?/><,.` ~
5 To add custom headings or edit the formula for a column, click the Edit Formula button.
The Edit Column Formula dialog box appears.
At the Column Formula tab, you can perform the following actions:
■ To specify custom headings, select the option Custom Headings and type new heading text into the appropriate location.
■ To edit the formula for the column, type it into the Column Formula area, or use the button bar to add operators, functions, filters, columns, and variables where required. For more information, see “Editing the Formula of a Column” on page 103.
For more information about using SQL functions, click the help button.
■ To change the aggregation rule for the column, make a selection from the drop-down list.
At the Bins tab, you can combine multiple values or ranges of values from a given column into bins.

Oracle Business Intelligence Answers, Delivers, and Interactive Dashboards User Guide Version 10.1.3.2
Working with Oracle BI Views in Oracle BI Answers ■ Adding Tables to Results Using Oracle BI Table View
102
■ Add and name the bins.
All instances of the different values that make up the bin in the result set will be replaced by the bin name. Aggregations are performed accordingly as well.
6 To edit the properties for a column, or to specify formatting to apply if the contents of the column meet certain conditions, click the Format Column button.
The Edit Column Format dialog box appears, where you can make your selections:
■ For information about formatting columns and adding navigation as part of the column format, see “Using Column Formatting Functions in Oracle BI Answers” on page 67.
■ For information about adding conditional formatting, see “Applying Conditional Formatting to Column Content in Oracle BI Answers” on page 73.
7 When you are done, you can save the request with the table view.
To add the write-back capability to the table view
1 At the table view, click the following Write Back Properties button:
The Write Back dialog box appears.
2 Select the Enable Write Back check box.
3 In the Template Name box, type the template name.
Check with your Oracle BI Presentation Services administrator for the appropriate template name.
4 In the Button Text box, type a button name.
5 In the Button Position list, select where the button appears.
6 Click OK.
7 Click the Properties button for the write-back column to open the Column Properties dialog box, and then click the Column Format tab.
8 Under Value Interaction, in the Type list, click Write Back, and click OK.
9 When you are done, you can save the request with the table view.
To specify paging controls and the number of rows per page, display column and table headings, apply green bar styling, and enable column sorting in dashboards
1 At the table view, click the Table View Properties button near the top of the workspace.
2 Make your selections for the various options.
NOTE: The presence of the option to enable column sorting in dashboards is configurable by your Oracle BI Presentation Services administrator. If the option is not available, your Oracle BI Presentation Services administrator has suppressed its display.

Working with Oracle BI Views in Oracle BI Answers ■ Editing the Formula of a Column
Oracle Business Intelligence Answers, Delivers, and InteractiveDashboards User Guide Version 10.1.3.2
103
Related Topics“Overview of Oracle BI Answers” on page 25
“Performing Common Tasks When Working with Oracle BI Views” on page 91
Editing the Formula of a ColumnThis section describes how to edit the formula of a column, and contains the following topics:
■ “To manually edit the formula of a column” on page 103
■ “To add operators and characters to the Column Formula area using the button bar:” on page 103
■ “To add functions to the Column Formula area using the button bar:” on page 104
■ “To add column expressions to the Column Formula area using the button bar:” on page 104
■ “To add variables to the Column Formula area using the button bar:” on page 104
■ “To add filters to the Column Formula area using the button bar:” on page 105
■ “To add case statements to the column formula area using the Bins tab” on page 106
To manually edit the formula of a column
1 In the Table View (or in the Columns area on the Criteria tab), click the Edit Formula button for the column whose formula you want to edit.
2 In the Edit Formula dialog box, display the Column Formula tab.
3 Type the formula into the Column Formula area.
4 Click OK when you are done.
To add operators and characters to the Column Formula area using the button bar:
1 In the Table View (or in the Columns area on the Criteria tab), click the Edit Formula button for the column whose formula you want to edit.
2 In the Edit Formula dialog box, display the Column Formula tab.
3 Click the first eight buttons in the button bar to insert the following operators/characters into the text area:
■ Plus - (the ‘+’ button inserts the ‘+’ character)
■ Minus - (the ‘-’ button inserts the ‘-’ character)
■ Multiply - (the ‘x’ button inserts the ‘*’ character)
■ Divide - (the ‘/’ button inserts the ‘/’ character)
■ Percentage - (the ‘%’ button inserts the ‘/100’ characters)
■ Open parenthesis - (the ‘(‘ button inserts the ‘(’ character)
■ Close parenthesis - (the ‘)’ button inserts the ‘)’ character)

Oracle Business Intelligence Answers, Delivers, and Interactive Dashboards User Guide Version 10.1.3.2
Working with Oracle BI Views in Oracle BI Answers ■ Editing the Formula of a Column
104
■ Concatenate - (the ‘||’ button inserts the ‘||’ character))
To add functions to the Column Formula area using the button bar:
1 In the Table View (or in the Columns area on the Criteria tab), click the Edit Formula button for the column whose formula you want to edit.
2 In the Edit Formula dialog box, display the Column Formula tab.
3 Click the Function button to display the Insert Function dialog box, where you can select functions from a tree of function groups.
4 Expand a function group to show a list of functions within that group.
5 Click on a function name to show the syntax of the selected function and its description in the lower part of the dialog.
6 Click the OK button, to dismiss the secondary dialog and insert the selected function’s expression into the Column Formula area.
If some text is selected in the Column Formula area when you click the Function button, the selected text is incorporated into the inserted function formula.
If no text is selected in the column formula when you click the Function button, the function’s expression is inserted and the first argument (denoted by tokens expr or expr1) is automatically selected.
To add column expressions to the Column Formula area using the button bar:
1 In the Table View (or in the Columns area on the Criteria tab), click the Edit Formula button for the column whose formula you want to edit.
2 In the Edit Formula dialog box, display the Column Formula tab.
3 Click the Column button to select a column name from a menu of the available column names that are already selected into the criteria of the current report.
When you select a column name from the menu, the column’s expression is inserted into the Column Formula area.
To add variables to the Column Formula area using the button bar:
1 In the Table View (or in the Columns area on the Criteria tab), click the Edit Formula button for the column whose formula you want to edit.
2 In the Edit Formula dialog box, display the Column Formula tab.
3 Click the Variable button to display a menu that enables you to select a Session, Repository or Presentation variable.
When you select a variable from the menu, the Insert Variable dialog box is displayed.
4 Type the name of the variable (and optional default value if applicable).

Working with Oracle BI Views in Oracle BI Answers ■ Editing the Formula of a Column
Oracle Business Intelligence Answers, Delivers, and InteractiveDashboards User Guide Version 10.1.3.2
105
5 Click OK to dismiss the dialog.
The appropriate formula expression for the variable is created and inserted into the Column Formula area. The example below shows the formula for a Session variable named blah.
“Sales Measures”.Dollars + VALUEOF(NQ_SESSION.blah)
NOTE: Repository and session variables must be included as arguments of the VALUEOF function.
■ Static repository variables must be referred to by name.
For example, to use the value of static repository variables named "prime_begin" and "prime_end", the following example shows the correct syntax:
CASE WHEN "Hour" >= VALUEOF("prime_begin") AND "Hour" < VALUEOF("prime_end") THEN 'Prime Time' WHEN ... ELSE...END
■ Dynamic repository variables must be referred to by their fully qualified name.
If you are using a dynamic repository variable, the names of the initialization block and the repository variable must be enclosed in double quotes ( " ), separated by a period, and contained within parentheses. For example, to use the value of a dynamic repository variable named REGION contained in a initialization block named Region Security, the following example shows the correct syntax:
SalesSubjectArea.Customer.Region = VALUEOF("Region Security"."REGION")
■ Session variables must be preceded by NQ_SESSION and separated by a period, and both the NQ_SESSION portion and the session variable name must be contained within parentheses.
If the variable name contains a space, the name must be enclosed in double quotes ( " ). For example, to use the value of a session variable named REGION, the following example shows the correct syntax:
"SalesSubjectArea"."Customer"."Region" = VALUEOF(NQ_SESSION.REGION)
■ Presentation variables are referred to using their name, and optionally by a default value.
The appropriate formula expression for the variable is created and inserted into the Column Formula area. The example below shows the formula for a Presentation variable named blah with a default value of 10.
“Sales Measures”.Dollars + @{blah}{10}
For more information about using variables, see the chapter about working with requests in Oracle Business Intelligence Answers, Delivers, and Interactive Dashboards User Guide.
To add filters to the Column Formula area using the button bar:
1 In the Table View (or in the Columns area on the Criteria tab), click the Edit Formula button for the column whose formula you want to edit.
2 In the Edit Formula dialog box, display the Column Formula tab.

Oracle Business Intelligence Answers, Delivers, and Interactive Dashboards User Guide Version 10.1.3.2
Working with Oracle BI Views in Oracle BI Answers ■ Editing the Formula of a Column
106
3 Click the Filter button to display the Insert Filter dialog containing a complex filter editor.
The filter is initially blank, but you populate the filter by clicking a column in the selection pane to add a column filter and create a filter expression.
4 Click a column name in the selection pane to display the Create/Edit Filter dialog.
For more information about using this dialog, see “Using Column Filters in an Oracle BI Request” on page 47.
5 Click OK to dismiss the Create/Edit Filter dialog when you finish creating the filter expression.
The resulting filter expression is added to the complex filter definition in the Insert Filter dialog.
The filter expression will be in the form:
FILTER(<expression> USING <filter_expression>)
Where:
❏ <expression> is an expression that contains at least one measure. For example, the expression "sales + 1" is allowed if "sales" is a measure. The expression "productid" is not allowed if "productid" is a scalar attribute.
❏ <filter_expression> is a boolean expression (evaluates to TRUE or FALSE) and does not contain any measures. Also, this expression may not contain any nested queries.
NOTE: If you selected some text in the Column Formula area before clicking the Filter button, it is incorporated in the inserted filter expression, replacing the expression token. For example, if you had selected “Sales Measures”.Dollars before clicking the Filter button. A complex filter expression might replace the filter_expressions token as follows:FILTER(“Sales Measures”.Dollars USING ((Periods.”Year” = ‘1999’) AND ((Markets.District = ‘CINCINNATI DISTRICT”) OR (Markets.District = ‘DENVER DISTRICT’)))).
6 Click on other column names in the selection pane to define more expressions to build up a complex filter statement involving multiple expressions.
Use the AND/OR link to specify the relationship between multiple expressions.
7 Click OK to dismiss the Insert Filter dialog
This creates an appropriate filter expression and inserts it into the Column Formula area of the Edit Column Formula dialog.
8 Click OK to dismiss the Edit Column Formula dialog.
Filter expressions are displayed in the column name in the Criteria tab.
To add case statements to the column formula area using the Bins tab
1 In the Table View (or in the Columns area on the Criteria tab), click the Edit Formula button for the column whose formula you want to edit.
Working with Oracle BI Views in Oracle BI Answers ■ Showing Results in Charts UsingOracle BI Chart View
Oracle Business Intelligence Answers, Delivers, and InteractiveDashboards User Guide Version 10.1.3.2
107
2 In the Edit Formula dialog box, display the Bins tab.
Use the Bins tab to easily build up a formula in the Column Formula area using CASE statements.
NOTE: The Bins tab is not affected by the button bar. However, if you create a CASE statement using the Bins tab, the button bar will be hidden when you click the Column Formula tab. The button bar is only displayed if you clear all bins.
3 Click the Add Bin button to display the Create/Edit Filter dialog.
Use the Create/Edit Filter dialog to create a filter expression to display as a CASE statement in the Column Formula area of the Edit Column Formula dialog.
For more information about using this dialog, see “Using Column Filters in an Oracle BI Request” on page 47.
4 Click OK to dismiss the Create/Edit Filter dialog and display new or updated filter expressions in the Bins tab.
5 Click the Column Formula tab to view filter expressions as CASE statements.
6 Click OK when you are done.
Related Topics“Overview of Oracle BI Answers” on page 25
“Performing Common Tasks When Working with Oracle BI Views” on page 91
Showing Results in Charts Using Oracle BI Chart ViewUse the chart view to position columns on a chart, and to customize the title, legend location, axis titles, data labels, size, and scale. You can select the chart graph, such as a line chart or a bar chart; the chart subtype, such as two-dimensional; and the style for columns, such as the shape and fill pattern. You can also set borders and colors, and control other chart characteristics. Results are drillable in the Chart view.
Chart graph choices include area charts, bar charts, bubble charts, line charts, and other types. Chart subtypes include 2D, 3D, absolute, clustered, stacked, combination, and custom.
This section explains how to work with charts. It contains the following topics:
■ “Description of Oracle BI Chart Graphs” on page 108
■ “Description of Oracle BI Chart View Buttons” on page 111
■ “General Steps to Add or Modify an Oracle BI Chart View” on page 112
■ “Specifying General Chart Properties in Oracle BI Chart View” on page 113
■ “Controlling the Display of Grid Lines in Oracle BI Chart View” on page 114
■ “Specifying the Location of the Legend in Oracle BI Chart View” on page 115
■ “Setting Colors for Background, Text, and Borders in Oracle BI Chart View” on page 115

Oracle Business Intelligence Answers, Delivers, and Interactive Dashboards User Guide Version 10.1.3.2
Working with Oracle BI Views in Oracle BI Answers ■ Showing Results in Charts Using Oracle BI Chart View
108
■ “Selecting the Columns to Display as Axes in Oracle BI Chart View” on page 116
■ “Setting Axis Scaling Options in Oracle BI Chart View” on page 116
■ “Editing Scale Markers in Oracle BI Chart View” on page 117
■ “Specifying Axis Titles and Labels in Oracle BI Chart View” on page 119
■ “Specifying What Happens When a User Clicks a Chart in Oracle BI” on page 120
■ “Formatting the Visual Appearance of Charts” on page 121
■ “Making Selections for Data Labels in Pie Charts” on page 124
NOTE: Oracle BI uses a third-party charting engine. The type of the chart, its size, and the number of elements charted can affect whether axes or legends appear. This is constrained by the amount of available space on the Web browser page. Sometimes, by adjusting the width and height controls, it is possible to get undisplayed axes and legend values to appear.
Description of Oracle BI Chart GraphsTable 15 shows the chart graphs available from the Graph drop-down list and describes their uses. Not all chart graphs are appropriate for all types of data. The default chart graph is a vertical bar chart.
Table 15. Oracle BI Chart Graph Selections
Chart Graph Type Description
Area An area graph is similar to a line graph, but with the areas under the lines filled in. Area graphs show the percentage of the whole that each variable comprises.
Area graphs are useful for observing changes in cumulative value or percentage over time; for example, by comparing groups on certain measurements such as outcome, and displaying group trends.
Horizontal Bar A horizontal bar graph can be used to compare facts by showing bars in a horizontal direction.
Horizontal bar graphs are useful for comparing differences among like items; for example, competing product sales, same product sales over different time periods, or same product sales over different markets.

Working with Oracle BI Views in Oracle BI Answers ■ Showing Results in Charts UsingOracle BI Chart View
Oracle Business Intelligence Answers, Delivers, and InteractiveDashboards User Guide Version 10.1.3.2
109
Bubble A bubble graph is a variation of a scatter graph that displays data elements as circles (bubbles). It shows three variables in two dimensions. One value is represented by the location of the circle on the x-axis. Another value is represented by the location of the circle on the y-axis. The third value is represented by the relative size of its circle.
Bubble graphs are useful for plotting data with three variables, and for displaying financial data over a period of time.
TIP: To create a bubble graph, plot one variable on the x-axis, another variable on the y-axis, and a third variable on the bubble radius axis. You need to have at least one dimension column on the Level axis.
Vertical Bar A vertical bar graph compares facts using vertical columns.
Vertical bar graphs are useful for comparing differences among like items.
Line A line graph can be used to plot multiple facts.
Line graphs are useful for showing patterns and trends in data.
Line Bar Combo A line bar combination graph plots two sets of data with different ranges, one set as bars, and one set as lines overlaid on the bars.
Line bar combination charts are useful for showing trend relationships between data sets.
TIP: You can specify any mix of bars and columns, but there must be one of each. Specifying all columns as lines works, but if you want only bars, use a bar chart. (When only bars are selected for this chart type, some column selections may be drawn as lines.)
Pareto A pareto graph is a form of bar chart and line chart that displays criteria in descending order. In this graph type, the line shows a cumulative total of the percentages.
Pareto graphs are useful for identifying significant elements, such as best and worst or most and least.
Pie A pie graph shows data sets as percentages of a whole.
Pie graphs are useful for comparing parts of a whole, such as sales by region or by district.
Radar A radar graph plots the same information as a bar graph, but instead displays data radiating from the center of the graph. Each data element has its own value axis.
Radar graphs are useful for examining overlap and distribution.
Table 15. Oracle BI Chart Graph Selections
Chart Graph Type Description

Oracle Business Intelligence Answers, Delivers, and Interactive Dashboards User Guide Version 10.1.3.2
Working with Oracle BI Views in Oracle BI Answers ■ Showing Results in Charts Using Oracle BI Chart View
110
Your selection for the chart graph determines the chart subtypes that are available from the Type drop-down list. Not all chart types have subtypes; for example, bubble and radar graphs have no subtypes. Charts subtypes default to the 3D option, if available. Depending on the chart type selection, subtype options may include the following:
■ Area charts: 3D and 2D
■ Bar charts: 3D, 2D, 3D Stacked, and 2D Stacked
■ Line charts: 3D and 2D
■ Pareto charts: 3D and 2D
■ Pie charts: 3D and 2D
■ Scatter charts: Scatter, and Scatter with Lines
Your selection for the chart type also determines the styles that are available from the Style drop-down list. Not all chart types have styles. The style defaults to solid fill, if available. Depending on the chart type selection, styles for charts may include the following:
■ Area charts: Solid Fill and Pattern Fill
■ Bar charts: Rectangle, Cylinder, Gradient, Triangle, Diamond, Pattern Fill
■ Line charts: Rectangle, Cylinder, Gradient, Triangle, Diamond, Pattern Fill
■ Pareto charts: Rectangle, Cylinder, Gradient, Triangle, Diamond, Pattern Fill
■ Pie charts: Solid Fill and Pattern Fill
Scatter A scatter graph displays x-y values as discrete points, scattered within an x-y grid. It plots data points based on two independent variables. This allows you to plot large numbers of data points and observe the clustering of data points.
Scatter graphs are useful for observing relationships and trends in large data sets.
TIP: To create a scatter graph, plot one fact on the x-axis and plot another fact on the y-axis. These facts are plotted for selections on the Level axis.
Step A step graph is used to plot and compare facts.
Step charts are useful for illustrating trends in data where values change discontinuously.
Table 15. Oracle BI Chart Graph Selections
Chart Graph Type Description
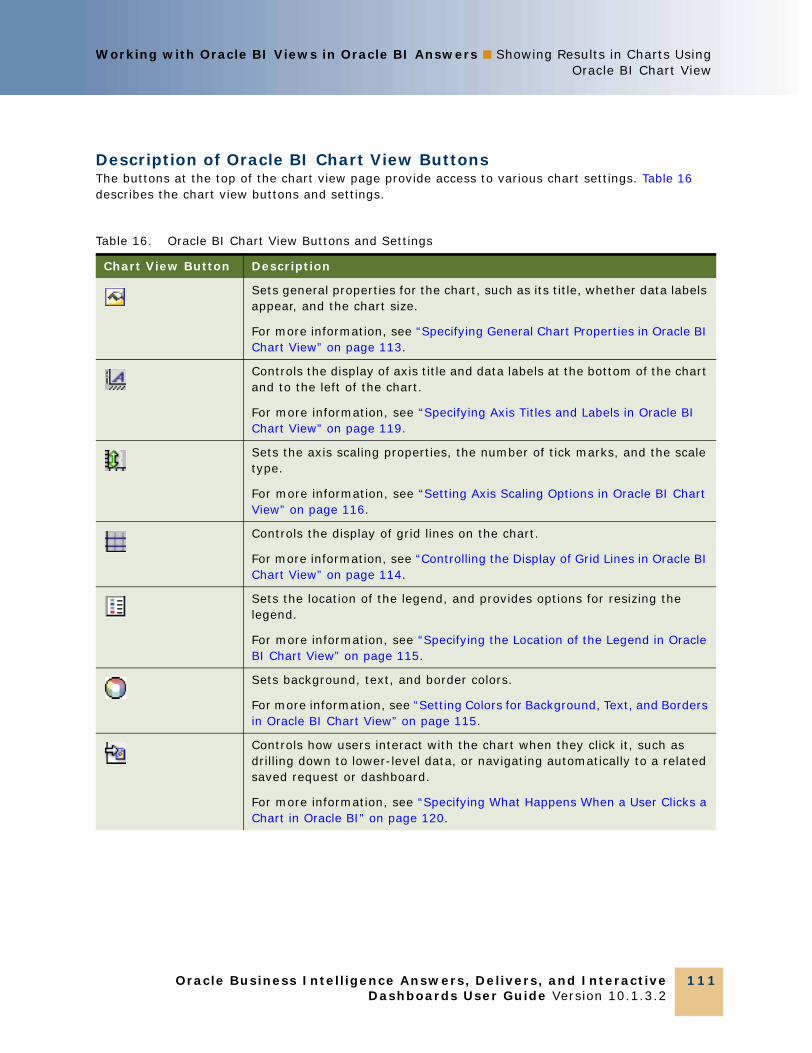
Working with Oracle BI Views in Oracle BI Answers ■ Showing Results in Charts UsingOracle BI Chart View
Oracle Business Intelligence Answers, Delivers, and InteractiveDashboards User Guide Version 10.1.3.2
111
Description of Oracle BI Chart View ButtonsThe buttons at the top of the chart view page provide access to various chart settings. Table 16 describes the chart view buttons and settings.
Table 16. Oracle BI Chart View Buttons and Settings
Chart View Button Description
Sets general properties for the chart, such as its title, whether data labels appear, and the chart size.
For more information, see “Specifying General Chart Properties in Oracle BI Chart View” on page 113.
Controls the display of axis title and data labels at the bottom of the chart and to the left of the chart.
For more information, see “Specifying Axis Titles and Labels in Oracle BI Chart View” on page 119.
Sets the axis scaling properties, the number of tick marks, and the scale type.
For more information, see “Setting Axis Scaling Options in Oracle BI Chart View” on page 116.
Controls the display of grid lines on the chart.
For more information, see “Controlling the Display of Grid Lines in Oracle BI Chart View” on page 114.
Sets the location of the legend, and provides options for resizing the legend.
For more information, see “Specifying the Location of the Legend in Oracle BI Chart View” on page 115.
Sets background, text, and border colors.
For more information, see “Setting Colors for Background, Text, and Borders in Oracle BI Chart View” on page 115.
Controls how users interact with the chart when they click it, such as drilling down to lower-level data, or navigating automatically to a related saved request or dashboard.
For more information, see “Specifying What Happens When a User Clicks a Chart in Oracle BI” on page 120.
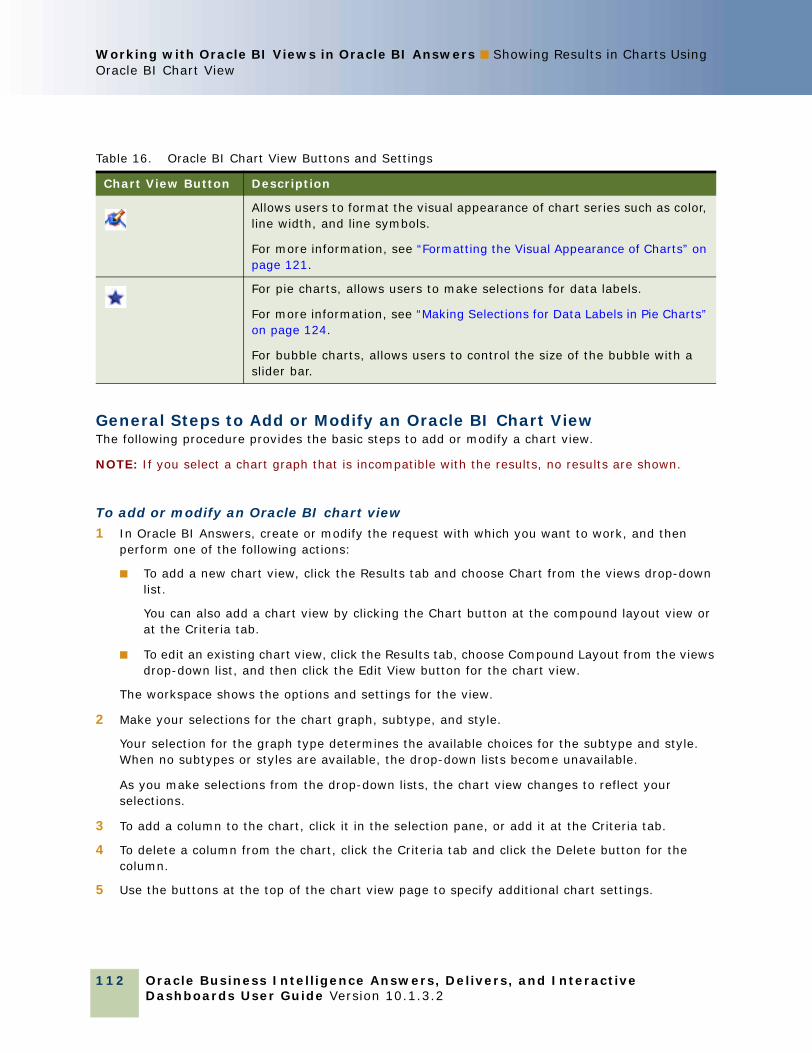
Oracle Business Intelligence Answers, Delivers, and Interactive Dashboards User Guide Version 10.1.3.2
Working with Oracle BI Views in Oracle BI Answers ■ Showing Results in Charts Using Oracle BI Chart View
112
General Steps to Add or Modify an Oracle BI Chart ViewThe following procedure provides the basic steps to add or modify a chart view.
NOTE: If you select a chart graph that is incompatible with the results, no results are shown.
To add or modify an Oracle BI chart view
1 In Oracle BI Answers, create or modify the request with which you want to work, and then perform one of the following actions:
■ To add a new chart view, click the Results tab and choose Chart from the views drop-down list.
You can also add a chart view by clicking the Chart button at the compound layout view or at the Criteria tab.
■ To edit an existing chart view, click the Results tab, choose Compound Layout from the views drop-down list, and then click the Edit View button for the chart view.
The workspace shows the options and settings for the view.
2 Make your selections for the chart graph, subtype, and style.
Your selection for the graph type determines the available choices for the subtype and style. When no subtypes or styles are available, the drop-down lists become unavailable.
As you make selections from the drop-down lists, the chart view changes to reflect your selections.
3 To add a column to the chart, click it in the selection pane, or add it at the Criteria tab.
4 To delete a column from the chart, click the Criteria tab and click the Delete button for the column.
5 Use the buttons at the top of the chart view page to specify additional chart settings.
Allows users to format the visual appearance of chart series such as color, line width, and line symbols.
For more information, see “Formatting the Visual Appearance of Charts” on page 121.
For pie charts, allows users to make selections for data labels.
For more information, see “Making Selections for Data Labels in Pie Charts” on page 124.
For bubble charts, allows users to control the size of the bubble with a slider bar.
Table 16. Oracle BI Chart View Buttons and Settings
Chart View Button Description
Working with Oracle BI Views in Oracle BI Answers ■ Showing Results in Charts UsingOracle BI Chart View
Oracle Business Intelligence Answers, Delivers, and InteractiveDashboards User Guide Version 10.1.3.2
113
6 To see the effects of your changes, click the Redraw button.
You can click the Redraw button at any time to refresh the chart view.
7 To remove changes and start from the original chart, click the Clear button.
8 To resize the chart, use the vertical and horizontal slide bars.
9 When you are done, you can save the request with the chart view.
Specifying General Chart Properties in Oracle BI Chart ViewYou can set general properties for the chart, such as a title, and whether data labels appear. You can also set the chart width and height.
Data labels are enabled by default for selected 2D chart types. Data labels have no effect on charts like 3D bar and column.
The default for chart size is to scale all elements of the existing chart, including height and width, to fit the available space. The chart’s height and width remain proportional to each other when the size of the chart changes. The chart automatically resizes chart elements based on the space available within the chart.
NOTE: The chart can expand significantly if the number of items being charted grows substantially.
For example, suppose you create a request to display the sales of three products, create a chart of the results with the product sales shown as three columns, and size the chart to occupy about 25 percent of the page. If the report is run later and six products are returned, the chart is expanded to twice its original width, or about 50 percent of the page, so that the widths of the individual columns in the chart remain constant.
The chart elements are resized as needed to fit into the chart. Using the preceding example, the chart continues to occupy about 25 percent of the page, and the columns are resized to fit in the available space.
To set general properties for an Oracle BI chart view
1 Click the following button at the top of the chart view page:
The General dialog box appears.
2 To enter a custom title for the chart, click the Custom Title check box and enter the title text for the chart.
3 To format the chart title text, click the formatting button (next to the title field)
The Text Format dialog box appears, make your changes as follows, and click OK.
■ Family - Select a font family from the drop-down list.
■ Size - Enter a point size to use when displaying the text.
Oracle Business Intelligence Answers, Delivers, and Interactive Dashboards User Guide Version 10.1.3.2
Working with Oracle BI Views in Oracle BI Answers ■ Showing Results in Charts Using Oracle BI Chart View
114
■ Color - Click to display the Color Selector dialog box, and select a color or enter the hexadecimal code for the required color.
■ Style - Select a style from the drop-down list.
Font styles are only available if the fonts are installed (such as Arial Bold, Arial Italic).
■ Truncate - Enter a number to specify how many characters of the text to display.
4 To specify how to show data labels, select an option from the Show data labels drop-down list as follows:
■ Always - Always display data labels.
■ Never - Never display data labels.
■ On rollover - Display data labels on mouse rollover.
■ Default (On rollover) - Display data labels using default behavior, in this example the default behavior is shown in brackets (On rollover).
5 To format the chart label text, click the formatting button to display the Text Format dialog box, make your changes and click OK (see previous step for details).
6 Click the Override Default Data Format check box, to override the default numeric format in which data labels are currently displayed, and make your selections using the following options:
■ Treat Numbers As - displays data labels as numbers, percentages or currency.
■ Negative Format - displays negative data labels using either the minus sign, or a parenthesis.
■ Decimal Places - displays numbers using the specified number of decimal places (to a maximum of 6 decimal places).
■ Use 1000’s Separator - displays a comma character to separate each magnitude of a thousand (for example, 1,000,000,000.00).
NOTE: The numeric format is inherited from the representative column in the criteria tab. If two or more columns are selected for the same axis, numeric formatting is not inherited.
7 To specify the size of the chart, enter numbers into the Width and the Height fields.
■ Specifies the width and height of the chart, in pixels.
8 Click OK.
The chart view refreshes. The chart may resize to accommodate your selections.
Controlling the Display of Grid Lines in Oracle BI Chart ViewYou can control whether grid lines display on the chart, and specify grid line colors.

Working with Oracle BI Views in Oracle BI Answers ■ Showing Results in Charts UsingOracle BI Chart View
Oracle Business Intelligence Answers, Delivers, and InteractiveDashboards User Guide Version 10.1.3.2
115
To control the display of grid lines on an Oracle BI chart view
1 Click the following button at the top of the chart view page:
The Additional Charting Options dialog box appears.
2 Click the Grid Lines tab.
3 Make your selections and click OK.
The chart view refreshes.
Specifying the Location of the Legend in Oracle BI Chart ViewYou can specify the location of the legend, and set options for resizing the legend.
To specify the location of the legend on an Oracle BI chart view
1 Click the following button at the top of the chart view page:
The Additional Charting Options dialog box appears.
2 Click the Legend tab.
3 Make your selections and click OK.
The chart view refreshes. The chart may resize to accommodate your selections.
Setting Colors for Background, Text, and Borders in Oracle BI Chart ViewYou can specify the color for the chart background, text, and borders.
To specify background, text, and border colors on an Oracle BI chart view
1 Click the following button at the top of the chart view page:
The Additional Charting Options dialog box appears.
2 Click the Borders & Colors tab.
3 Make your selections and click OK.
The chart view refreshes.

Oracle Business Intelligence Answers, Delivers, and Interactive Dashboards User Guide Version 10.1.3.2
Working with Oracle BI Views in Oracle BI Answers ■ Showing Results in Charts Using Oracle BI Chart View
116
Selecting the Columns to Display as Axes in Oracle BI Chart ViewThe column area on the left side of the chart view shows the columns that are included in the request. You can select the columns to display as the different axes in the chart. You can also indicate whether measure labels appear for factual data plotted on an axis.
The available axes can change depending on the type of chart selected from the Graph drop-down list. The chart axis buttons used in chart view are described in Table 17.
To select the columns to display as the axes on an Oracle BI chart view
1 In the columns area to the left of the chart, click the appropriate check box for one of the axis buttons to display that column as the corresponding axis in the chart.
The axis buttons change depending on the type of graph selected from the Graph drop-down list.
2 To add a column to the chart, click it in the selection pane, and then set it as an axis.
This is equivalent to adding the column to the request at the Criteria tab.
3 To display the unit of measure on an axis, click the appropriate check box.
4 Click Redraw to refresh the chart view.
Setting Axis Scaling Options in Oracle BI Chart ViewYou can control axis limits, tick marks and scale type, and the properties of scale markers.
Table 17. Chart Axis Buttons Used in Oracle BI Chart View
Chart Axis Button Axis
Level axis (for scatter and bubble graphs)
Horizontal axis
Vertical axis (for a radar graph, this is the fact axis)
Legend axis
Overlay axis
Radius axis
Pie Values axis (for a radar graph, this is the radar axis)

Working with Oracle BI Views in Oracle BI Answers ■ Showing Results in Charts UsingOracle BI Chart View
Oracle Business Intelligence Answers, Delivers, and InteractiveDashboards User Guide Version 10.1.3.2
117
To specify axis scaling options for an Oracle BI chart view
1 Click the following button at the top of the chart view page:
The Axis Scaling dialog box appears.
2 Make your selections and click OK.
For charts with numeric axes, the settings of the axis scaling options determine how the scale is selected:
■ When you select Default, the system chooses the scale and sets the axis to zero (0) for positive numbers.
■ When you select Zoom to Data Range, the system chooses the scale. It evaluates the range of values on the axis, and chooses appropriate minimum and maximum values for the scale. This is useful when charting a set of large values that are all within a small percentage of each other. The chart zooms in on the values so differences are more easily distinguished.
■ You can also manually set the axis scaling values to specific numbers.
The chart view refreshes. The chart may resize to accommodate your selections.
Editing Scale Markers in Oracle BI Chart ViewScale markers are accenting lines or shaded background ranges that mark key points, thresholds, ranges, and so on. The lines or ranges are can be applied on one or more axes depending upon the type of chart.
NOTE: Some chart types do not use scale markers, such as pie charts.
The following procedure provides the general steps to edit a scale marker.
To edit scale markers for an Oracle BI chart view
1 Click the following button at the top of the chart view page:
The Axis Scaling dialog box appears.
2 Click the following button:
Edit Scale Markers
The Scale Markers Table Editor dialog box appears.

Oracle Business Intelligence Answers, Delivers, and Interactive Dashboards User Guide Version 10.1.3.2
Working with Oracle BI Views in Oracle BI Answers ■ Showing Results in Charts Using Oracle BI Chart View
118
3 Click the Add button to add the first scale marker and make your selections for the marker.
Advanced options include setting the scale to a static value, a variable, a particular column name, or as the result of an SQL query. For more information about the types of scale markers and using the advanced options, see the procedures that follow this one.
4 Click OK successively to close the dialog boxes.
The chart view refreshes. The chart may resize to accommodate your selections.
To create a line scale marker
1 Select Line from the Type drop-down list.
2 Enter a line width in the third column.
3 Enter the position for the line in the fourth column.
4 Enter the color for the line.
5 Enter a caption for the line.
To create a range scale marker
1 Select Range from the Type drop-down list.
2 Enter the low end of the range in the third column.
3 Enter the high value of the range in the fourth column.
4 Enter the color for the range.
5 Enter a caption for the range.
Using Advanced Settings for Range and Line ValuesOptions for these values include a static value, a variable, a value sourced from a column included in the request, or one derived from a SQL query. Advanced options enables you to dynamically set values based on results of a column, query, or presentation variable which is evaluated while rendering the chart as follows:
■ Static value - A hard coded value.
■ Presentation Variable - Value of the presentation variable.
■ Column Name - Based only on a measure column value, which could yield numerous values, and only the first value is applied.
■ SQL Query - Based on the results of a SQL query. The results could be a table but only the first row, and first column cell value is applied.
NOTE: If any of the above do not have a valid value, the scale marker is ignored.
To specify an advanced setting
1 Next to the field, click the Properties button.

Working with Oracle BI Views in Oracle BI Answers ■ Showing Results in Charts UsingOracle BI Chart View
Oracle Business Intelligence Answers, Delivers, and InteractiveDashboards User Guide Version 10.1.3.2
119
2 Select one of the options and enter appropriate values.
3 Click OK when you are done.
Specifying Axis Titles and Labels in Oracle BI Chart ViewYou can control whether axis titles and data labels display at the bottom of the chart and to the left of the chart.
NOTE: Adjusting the size of a chart can affect how the axis labels appear.
To specify an axis title on an Oracle BI chart view
1 Click the following button at the top of the chart view page:
The Axis Titles and Labels dialog box appears.
2 To update axis titles and labels, select either the Left or the Bottom tab.
3 To enter a custom axis title for the chart, click the Custom Title check box and enter the title text for the chart.
4 To format the axis title text, click the formatting button (next to the title field).
The Text Format dialog box appears, make your changes as follows, and click OK.
■ Family - Select a font family from the drop-down list.
■ Size - Enter a point size to use when displaying the text.
■ Color - Click to display the Color Selector dialog box, and select a color or enter the hexadecimal code for the required color.
■ Style - Select a style from the drop-down list.
■ Truncate - Enter a number to specify how many characters of the text to display.
5 Specify how to show axis scale labels as follows:
■ Display scale labels - Select to display scale labels in the chart.
■ Rotate labels - Click the check box and select a value from the drop-down list to specify the degree of rotation to display the axis scale labels (values available through 180 degrees).
■ Abbreviate - click the check box and select a value from the drop-down list to display an abbreviation following each axis label.
6 To format the scale label text, click the formatting button to display the Text Format dialog box, make your changes and click OK (see earlier step for details).
7 (Only applies to Left tab) Click the Override Default Data Format check box, to override the default numeric format in which axis scale labels are currently displayed, and make your selections using the following options:
■ Treat Numbers As - displays labels as numbers, percentages or currency.
Oracle Business Intelligence Answers, Delivers, and Interactive Dashboards User Guide Version 10.1.3.2
Working with Oracle BI Views in Oracle BI Answers ■ Showing Results in Charts Using Oracle BI Chart View
120
■ Negative Format - displays negative labels using either the minus sign, or a parenthesis.
■ Digits - displays numbers using the specified number of decimal places.
■ Use 1000’s Separator - displays a comma character to separate each magnitude of a thousand (for example, 1,000,000,000.00).
8 (Only applies to Bottom tab) Click the Stagger labels check box to display labels so that they do not overlap.
9 (Only applies to Bottom tab) Click the Skip labels check box to display an alternate set of labels.
10 Click OK.
The chart view refreshes.
Specifying What Happens When a User Clicks a Chart in Oracle BIWhen a user views the chart, you can specify the type of interaction to occur if the user clicks the chart. The following are the types of interactions for a chart:
■ Drill. Allows the user to drill down to more detailed information. This is the default interaction.
■ Navigate. Allows the user to navigate to one or more saved requests or dashboards.
■ None. Disables drilldown or navigation from the chart.
To specify the user interaction with an Oracle BI chart view
1 Click the following button at the top of the chart view page:
The Additional Charting Options dialog box appears.
2 Click the Interaction tab.
To allow navigation to other saved requests or dashboards (when a user clicks the chart):
a Select the Navigate radio button, and click the Add Navigation Target button.
Target and Caption fields are displayed.
b If you want users to navigate to other saved requests or dashboards, click the Browse button to open the Choose Request/Dashboard dialog box, navigate to the target request or dashboard, and click OK to select the target.
c (Optional) Enter caption text in the Caption field.
Caption text is displayed when the user clicks on the chart.
When no text is entered in the Caption field, the title of the target report or dashboard is displayed as the caption.
d To allow navigation to multiple saved requests or dashboards, click the Add Navigation Target button, and repeat the previous steps.

Working with Oracle BI Views in Oracle BI Answers ■ Showing Results in Charts UsingOracle BI Chart View
Oracle Business Intelligence Answers, Delivers, and InteractiveDashboards User Guide Version 10.1.3.2
121
e Click OK to save your changes.
When a user clicks on the chart, the following rules apply:
❏ If multiple navigation paths exist to other saved requests or dashboards, a pop-up window displays a caption for each request/dashboard. The user should click a specific caption to navigate to the required request/dashboard.
❏ If only a single navigation path exists, the request/dashboard is displayed.
To disable drilling or navigation, click the None radio button.
3 Click OK.
Formatting the Visual Appearance of ChartsYou can format the visual appearance of charts based on two settings, the position of the chart series, and on conditions applied to column values as follows:
■ “Chart Formatting Based on Position” on page 121
■ “Chart Formatting Based on Column Values” on page 121
Chart Formatting Based on PositionPositional formatting enables you to customize the appearance of a chart series based on the values position in the chart legend. You can format the visual appearance of a chart series in terms of its color, line width, and line symbols.
For example:
■ Changing bar color, line width, and line symbol.
A user has created a line bar combination chart with two data series. Assuming that the bar is position 1 and the line is position 2, you can change the color of the bar, the width of the line, and the symbol representing the data points.
Chart Formatting Based on Column ValuesConditional formatting enables you to customize the appearance of a chart based on column values. You can specify a color in which to display chart data based upon a specific column value, or range of column values.
For example:
■ Conditionally changing the color of a chart based on specific column values.
A user wants to create a bar chart to compare sales between two beverages, Lemonade and Cola. When creating a bar chart the user specifies two conditions, one where the bar representing Lemonade sales is yellow, and another where the bar representing Cola sales is blue.
Oracle Business Intelligence Answers, Delivers, and Interactive Dashboards User Guide Version 10.1.3.2
Working with Oracle BI Views in Oracle BI Answers ■ Showing Results in Charts Using Oracle BI Chart View
122
■ Conditionally changing the color of a chart based on a range of column values.
A sales manager wants to create a bar chart to compare sales for all reps across two sales bands.When creating a bar chart the sales manager specifies two conditions, one where the bar is red for all sales reps with sales less than $250,000, and another where the bar is green for all sales reps with sales greater than $250,000.
To format the appearance of a chart
1 Click the following button at the top of the chart view page:
The Format Chart Data dialog box appears.
2 Click the Positional tab to format the appearance of a chart series based on its position.
The available choices depend upon the chart type. For example:
■ To customize a chart series, deselect the Use Default check box.
■ To restore a chart series to its default settings, reselect the Use Default check box.
■ To add a new format series control, click the Add button. Even if the current chart does not use this series, it will be used if it is needed (such as for drilling).
■ To return all chart series to their default values, click the Clear All button.
This also removes all added format series positions.
■ To change colors, click the color box to access the Color Selector dialog box.
■ To change other chart series attributes, click the desired tab and select bar or line attributes from the options presented.
3 Click the Conditional tab to format the appearance of a chart based on a condition applied to a column value or a range of column values.
To apply a condition to a column value or a range of column values for a chart:
a Click the Add Condition button and select the column to which you want to apply a condition.
The Create/Edit Filter dialog box is displayed.
b Select the operator and enter a column value, or a range of column values for this condition.
c Click OK when you are done.
The new condition is displayed in the Format Chart Data dialog box.
d To select a color in which to display a chart series when the condition is met, click the Color button to access the Color Selector dialog box.
e To update the condition, click the Filter button to display the Create/Edit Filter dialog box.

Working with Oracle BI Views in Oracle BI Answers ■ Showing Results in Charts UsingOracle BI Chart View
Oracle Business Intelligence Answers, Delivers, and InteractiveDashboards User Guide Version 10.1.3.2
123
f To rearrange the order in which conditions are applied, click the up or down arrows next to each condition.
To display existing conditions for the chart:
■ Click a link in the left hand column.
4 Click OK when you are done.
Rules for Applying Conditional Formats in ChartsThe following rules apply for building and using conditions in charts:
■ Conditions can only be created from columns that are being used by the chart.
■ When format conditions conflict with each other, conflicting conditions are prioritized in the following order:
1. Measure - Typically the Y axis that is used to show the value of an intersection point.
2. Legend - A way to group a series of data points that can be plotted on a graph.
3. Category - Typically the X-axis that is used to separate the values being measured.
4. Position - The numerical sequence in which a chart series is displayed.
In the hierarchy above, Category overrides Position, Legend overrides Category, and Measure overrides Legend.
■ When a user drills on a chart that has conditional formatting applied, the following rules apply:
■ a conditional format based on measures is not carried to the next chart
■ a conditional format based on dimensional attributes is carried to the next chart if it has not been drilled on
For example, if you had the conditional format “Lemonade = Blue" and only drill on years, then “Lemonade = Blue” will stay in place.
Chart Exceptions for Conditional Formatting on Column ValuesThe following table lists the chart exceptions that apply to conditional formatting on column values.
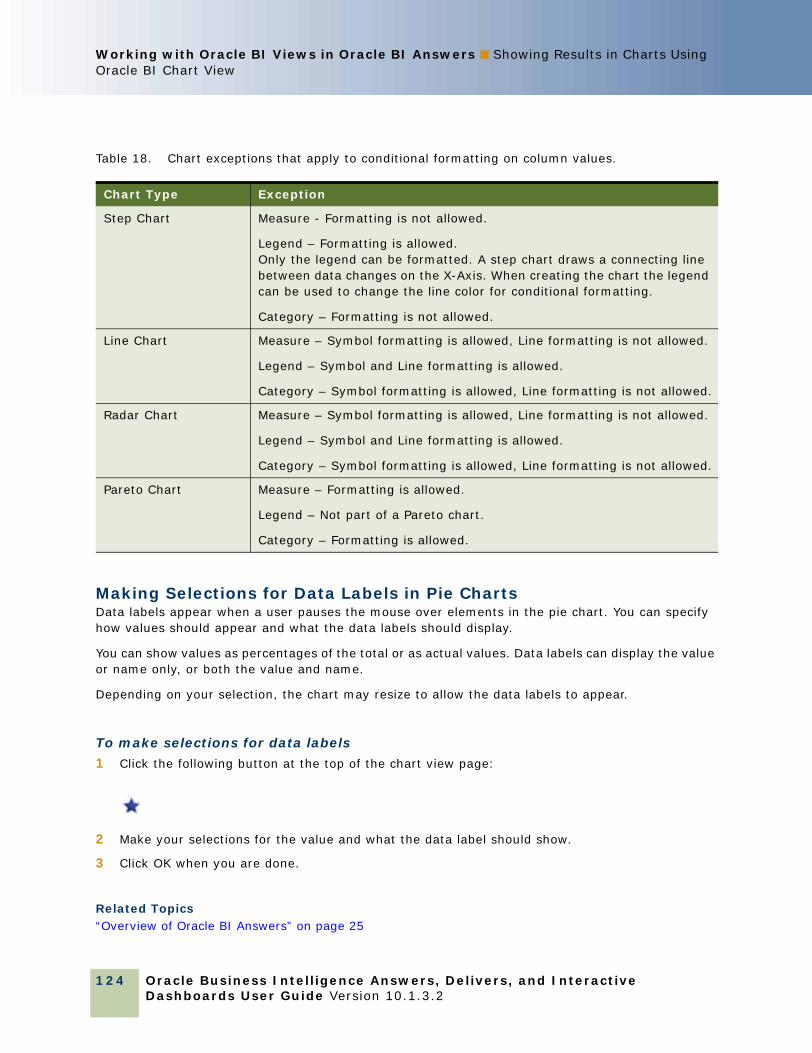
Oracle Business Intelligence Answers, Delivers, and Interactive Dashboards User Guide Version 10.1.3.2
Working with Oracle BI Views in Oracle BI Answers ■ Showing Results in Charts Using Oracle BI Chart View
124
Table 18. Chart exceptions that apply to conditional formatting on column values.
Making Selections for Data Labels in Pie ChartsData labels appear when a user pauses the mouse over elements in the pie chart. You can specify how values should appear and what the data labels should display.
You can show values as percentages of the total or as actual values. Data labels can display the value or name only, or both the value and name.
Depending on your selection, the chart may resize to allow the data labels to appear.
To make selections for data labels
1 Click the following button at the top of the chart view page:
2 Make your selections for the value and what the data label should show.
3 Click OK when you are done.
Related Topics“Overview of Oracle BI Answers” on page 25
Chart Type Exception
Step Chart Measure - Formatting is not allowed.
Legend – Formatting is allowed.Only the legend can be formatted. A step chart draws a connecting line between data changes on the X-Axis. When creating the chart the legend can be used to change the line color for conditional formatting.
Category – Formatting is not allowed.
Line Chart Measure – Symbol formatting is allowed, Line formatting is not allowed.
Legend – Symbol and Line formatting is allowed.
Category – Symbol formatting is allowed, Line formatting is not allowed.
Radar Chart Measure – Symbol formatting is allowed, Line formatting is not allowed.
Legend – Symbol and Line formatting is allowed.
Category – Symbol formatting is allowed, Line formatting is not allowed.
Pareto Chart Measure – Formatting is allowed.
Legend – Not part of a Pareto chart.
Category – Formatting is allowed.
Working with Oracle BI Views in Oracle BI Answers ■ Showing Results in Pivot TablesUsing Oracle BI Pivot Table View
Oracle Business Intelligence Answers, Delivers, and InteractiveDashboards User Guide Version 10.1.3.2
125
“Performing Common Tasks When Working with Oracle BI Views” on page 91
Showing Results in Pivot Tables Using Oracle BI Pivot Table ViewThe pivot table view is an interactive view that allows you to rotate the rows, columns, and section headings to obtain different perspectives of the data. Pivot tables are navigable and drillable, and are especially useful for trend reports.
This section provides the general steps to create a pivot table and describes additional pivot table formatting options. It contains the following topics:
■ “General Steps for Adding or Modifying an Oracle BI Pivot Table View” on page 125
■ “Using Multiple Page Drop-Down Lists in Oracle BI Pivot Tables” on page 128
■ “Overriding Default Aggregation Rules in Oracle BI Pivot Tables” on page 128
■ “Applying Formatting in Oracle BI Pivot Tables” on page 129
■ “Showing an Item’s Relative Value in Oracle BI Pivot Tables” on page 132
■ “Displaying Running Sums in Oracle BI Pivot Tables” on page 132
■ “Using Calculations in Oracle BI Pivot Tables” on page 133
General Steps for Adding or Modifying an Oracle BI Pivot Table ViewWhen you add or modify a pivot table, the columns included in the request appear as elements in the pivot table template. See Table 19 on page 127 for a description of pivot table positions.
To add or modify an Oracle BI pivot table view
1 In Oracle BI Answers, create or modify the request with which you want to work, and then perform one of the following actions:
■ To add a new pivot table view, click the Results tab and choose Pivot Table from the views drop-down list.
You can also add a pivot table view by clicking the Pivot Table button at the compound layout view or at the Criteria tab.
■ To edit an existing pivot table view, click the Results tab, choose Compound Layout from the views drop-down list, and then click the Edit View button for the pivot table view.
The workspace shows the options and settings for the view.
2 To view the pivot table template and buttons for working with each column individually, select the option to show header toolbars.
The workspace shows the pivot table template.
3 To add a column to a pivot table view, click the column in the selection pane.

Oracle Business Intelligence Answers, Delivers, and Interactive Dashboards User Guide Version 10.1.3.2
Working with Oracle BI Views in Oracle BI Answers ■ Showing Results in Pivot Tables Using Oracle BI Pivot Table View
126
4 Drag and drop the request columns, which appear as elements in the pivot table, to the desired positions in the pivot table template.
5 To see a preview, select the option Display Preview.
You can click the Display Preview link to refresh the results.
6 To add a chart view next to the pivot table, select the option Chart Pivoted Results.
For information about the chart view, see “Showing Results in Charts Using Oracle BI Chart View” on page 107.
7 To sort the results, click the Order By button.
The button changes to indicate the sort order:
■ An up arrow indicates ascending sequence.
■ A down arrow indicates descending sequence.
For more information about sorting, see “Specifying the Sort Order for Columns in Oracle BI Requests” on page 35.
8 To add totals, perform the following actions:
a For totals in the Pages, Section, Row, and Column areas, click the totals button and make a selection:
❏ For no totals, choose None.
❏ To show the total before or after the data items, choose Before or After. For example, if you add a total on a row containing regions and specify the Before option, the total is shown before individual districts in the region are listed.
b To insert custom text into a total heading, click the totals button and select the Format Labels option to display the Edit Format dialog box. Enter the custom text into the Caption field as follows:
❏ @ - displays the value of the dataFor example, if a total is specified for the Region column, and you enter the following text into the Caption field for the total heading:- All values in the @
the total heading would display the following text for the Western Region:- All values in the Western Region
❏ "@" - displays the @ symbol
❏ "\"" - displays the double quote
❏ "\\" - displays the \ symbol
❏ \ - displays the \ symbol
The double quote syntax is not limited to a single character. In general you can use a backslash escaped string inside double quotes. For example:
❏ "1234567890\\abc\\d\"x\"yz!@#$%^&*()-+=_{}[];:'|?/><,.` ~"
is displayed as:
❏ 1234567890\abc\d"x"yz!@#$%^&*()-+=_{}[];:'|?/><,.` ~

Working with Oracle BI Views in Oracle BI Answers ■ Showing Results in Pivot TablesUsing Oracle BI Pivot Table View
Oracle Business Intelligence Answers, Delivers, and InteractiveDashboards User Guide Version 10.1.3.2
127
c For totals in the Measures area, click the More Options button for the row or column to be totaled, choose Aggregation Rule, select a value, and make sure the option Report-Based Total is selected.
NOTE: If the option Report-Based Total is not selected, the Oracle BI Server will calculate the total based on the entire result set, before applying any filters to the measures.
Depending on the position of this element, the totals for the summary data represented by the Measures elements display as a column or row. Column and row totals include labels.
When the Totals button is dimmed, no totals will appear.
9 To work with additional options for a column, measure, or row, click the More Options or Formatting button and make a selection from the drop-down list.
For more information about the cosmetic formatting you can apply to headings, see “Applying Cosmetic Formatting to Results and Dashboards” on page 81.
10 To format labels or values for a column, click the Totals button or the More Options button, and then select the appropriate format option.
For information about formatting columns, see “Applying Formatting in Oracle BI Pivot Tables” on page 129.
11 When you are done, you can save the request with the pivot table view.
Table 19. Oracle BI Pivot Table Positions
Position Description
Pages Provides an interactive result set that allows users to select the data they want to view. The values from the columns that appear in the Pages position are used as the initial filter criteria. The values appear in a drop-down list for selection. Based on that selection, a pivot table (composed of the Sections, Columns, Rows, and Measures defined in the pivot table) appears. For more information, see “Using Multiple Page Drop-Down Lists in Oracle BI Pivot Tables” on page 128.
Sections Provides initial filter criteria. For each value in the Section column, a unique pivot table appears, composed of the Columns, Rows, and Measures defined in the pivot table.
Columns Shows an element in a column orientation. Pivot tables can contain multiple columns.
Rows Shows an element in a row orientation. Like columns, pivot tables can contain multiple rows.
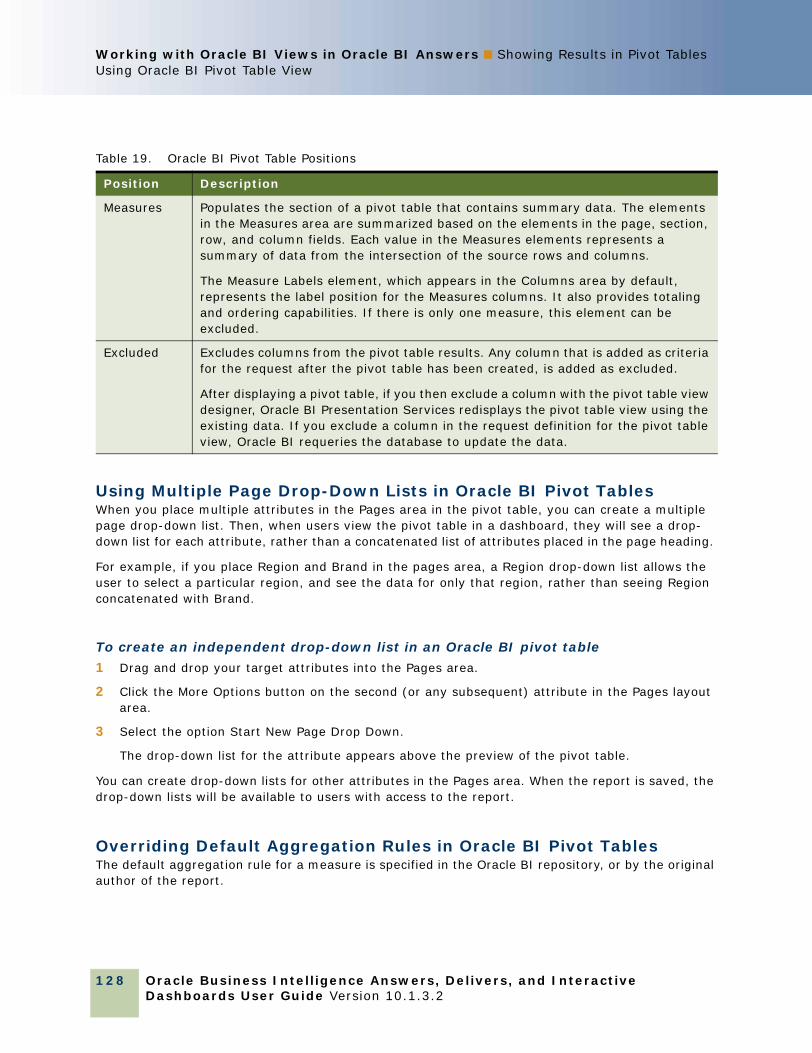
Oracle Business Intelligence Answers, Delivers, and Interactive Dashboards User Guide Version 10.1.3.2
Working with Oracle BI Views in Oracle BI Answers ■ Showing Results in Pivot Tables Using Oracle BI Pivot Table View
128
Using Multiple Page Drop-Down Lists in Oracle BI Pivot TablesWhen you place multiple attributes in the Pages area in the pivot table, you can create a multiple page drop-down list. Then, when users view the pivot table in a dashboard, they will see a drop-down list for each attribute, rather than a concatenated list of attributes placed in the page heading.
For example, if you place Region and Brand in the pages area, a Region drop-down list allows the user to select a particular region, and see the data for only that region, rather than seeing Region concatenated with Brand.
To create an independent drop-down list in an Oracle BI pivot table
1 Drag and drop your target attributes into the Pages area.
2 Click the More Options button on the second (or any subsequent) attribute in the Pages layout area.
3 Select the option Start New Page Drop Down.
The drop-down list for the attribute appears above the preview of the pivot table.
You can create drop-down lists for other attributes in the Pages area. When the report is saved, the drop-down lists will be available to users with access to the report.
Overriding Default Aggregation Rules in Oracle BI Pivot TablesThe default aggregation rule for a measure is specified in the Oracle BI repository, or by the original author of the report.
Measures Populates the section of a pivot table that contains summary data. The elements in the Measures area are summarized based on the elements in the page, section, row, and column fields. Each value in the Measures elements represents a summary of data from the intersection of the source rows and columns.
The Measure Labels element, which appears in the Columns area by default, represents the label position for the Measures columns. It also provides totaling and ordering capabilities. If there is only one measure, this element can be excluded.
Excluded Excludes columns from the pivot table results. Any column that is added as criteria for the request after the pivot table has been created, is added as excluded.
After displaying a pivot table, if you then exclude a column with the pivot table view designer, Oracle BI Presentation Services redisplays the pivot table view using the existing data. If you exclude a column in the request definition for the pivot table view, Oracle BI requeries the database to update the data.
Table 19. Oracle BI Pivot Table Positions
Position Description
Working with Oracle BI Views in Oracle BI Answers ■ Showing Results in Pivot TablesUsing Oracle BI Pivot Table View
Oracle Business Intelligence Answers, Delivers, and InteractiveDashboards User Guide Version 10.1.3.2
129
To override the default aggregation rule for a measure in an Oracle BI pivot table
1 Click the More Options button for the measure whose default aggregation rule you want to override.
2 Select the option Aggregation Rule, and then select the aggregation rule to apply.
The chosen aggregation rule for the measure is indicated by a check mark.
Applying Formatting in Oracle BI Pivot TablesYou can apply green bar styling and cosmetic formatting to a pivot table. You can also customize the appearance of sections, rows, columns, measures, and the content that they contain. For example, you can specify font, cell, border, and style sheet options for sections, values, and measure labels. For sections, you can include and customize the position of column headings together with the values in that section. You can also insert page breaks for a specified column, so that every time a value changes in the section column, the new section for that column appears on a new page. You can also hide blank rows and hide repeated section column values.
For information about formatting columns and adding navigation as part of the column format, see “Using Column Formatting Functions in Oracle BI Answers” on page 67.
You can also add conditional formatting, which helps direct attention to a data element if it meets a certain threshold. To add conditional formatting to a column in a pivot table, see “Applying Conditional Formatting to Column Content in Oracle BI Answers” on page 73.
Adding Green Bar Styling and Cosmetic Formatting to a Pivot TableGreen bar styling shows alternating rows or columns in a light green color. Cosmetic formatting affects the overall appearance of the pivot table and also allows you to change the default green bar color.
To add green bar styling and cosmetic formatting to a pivot table
1 At the pivot table view, click the Table View Properties button near the top of the workspace.
2 To add green bar styling, click the green bar styling check box.
To change the way the styling is applied, make a selection from the drop-down list.
3 To add cosmetic formatting, click the alternate formatting button.
The cosmetic formatting dialog box appears.
4 To change the default green bar color, choose a new background color for the cell format.
For more information about cosmetic formatting, see “Applying Cosmetic Formatting to Results and Dashboards” on page 81.
Modifying Section Properties in a Pivot TableSection property options allow you to do the following:
■ Include and customize the position of column headings together with the values in that section.

Oracle Business Intelligence Answers, Delivers, and Interactive Dashboards User Guide Version 10.1.3.2
Working with Oracle BI Views in Oracle BI Answers ■ Showing Results in Pivot Tables Using Oracle BI Pivot Table View
130
■ Insert page break options. Specify a column against which to insert page breaks. Every time a value changes in the column, the new column will appear on a new page. This is useful for data-driven detail reports.
■ Show or hide blank rows.
■ Apply cell and border property settings
■ Apply additional formatting to a section. For example, to specify the width and height of the section.
To modify section properties in a pivot table
1 At the pivot table view, click the Section Properties button.
The Section Properties dialog box appears.
2 To specify the appearance of the section, make selections from the Section Properties dialog box as follows:
a Click an option to specify the column heading display properties.
b Select an Insert Page Break Option from the drop-down list to specify which column to use for page breaks as follows:
❏ No Page Break - does not insert a page break (default value)
❏ Innermost Column - inserts a page break between every sectionWhen the value of an outer column changes, the value of the inner column is also considered changed. Therefore, setting page breaks at the innermost column inserts manual page breaks between every section.
❏ Outermost Column - inserts a page break when the section label in this column changes
❏ <Table.Column Name> (for example, Markets.Region, or Products.Brand) - inserts a page break when the section label in this column changes
c Use the Show Blank Rows check box as follows:
❏ Click the check box to display all rows, even if a row is an empty text string and contains no value.
❏ Clear the check box to hide rows when there are no results to display (default value).This option might be useful for example, if you want to hide empty address lines.
3 To format additional properties of the section, make selections from the Additional Formatting Options sections.
Modifying Section and Row Formatting in a Pivot TableSection and row content formatting options allow you to do the following:
■ Apply cosmetic formatting to section or row headings and values.
■ Use a section value or a row value in pivot table calculations but suppress its display in results.
■ Specify that a section value is placed in a new row.

Working with Oracle BI Views in Oracle BI Answers ■ Showing Results in Pivot TablesUsing Oracle BI Pivot Table View
Oracle Business Intelligence Answers, Delivers, and InteractiveDashboards User Guide Version 10.1.3.2
131
■ Specify that repeated section values are not displayed.
■ Define a new calculated item for use in a pivot table.
■ Duplicate the section or row in the pivot table.
■ Remove a column from the pivot table view.
To modify section and row formatting in a pivot table■ At the pivot table view, click the More Options button for the section or row and make a selection
from the drop-down list.
■ To apply cosmetic formatting to section and row headings or values, select the appropriate option (Format Headings... or Format Values...).
For information about applying cosmetic formatting, see “Applying Cosmetic Formatting to Results and Dashboards” on page 81.
■ To hide a section or a row from the output, choose Hidden.
■ To specify that a section value is placed in a new row, choose Place Value in New Row. For more information, see “Using the Place Value in New Row Setting” on page 131.
■ To display a section value once and hide repeated section values, choose Hide Repeated Values. For more information, see “Using the Hide Repeated Values Setting” on page 131.
■ To define a new calculated item, see “Building Calculations in Oracle BI Pivot Tables” on page 134.
■ To duplicate the section or row in the pivot table, choose Duplicate Layer.
■ To remove a duplicated section or row in the pivot table, choose Remove Duplicate (only visible after you have used the Duplicate Layer option).
■ To remove the column from the request, choose Remove Column.
The column is removed from the pivot table and all other result views for the request.
Using the Hide Repeated Values SettingThe Hide Repeated Values setting enables column values for a section to display once, suppressing repeated values until the value changes. When the section column value changes, it is displayed indented to the right to show the hierarchy. For more information about using this setting, see “To modify section and row formatting in a pivot table” on page 131.
Using the Place Value in New Row SettingThe Place Value in New Row setting enables you to display section values on different rows. Where section values are displayed together in a row, you can specify that a section value is displayed on a new row.

Oracle Business Intelligence Answers, Delivers, and Interactive Dashboards User Guide Version 10.1.3.2
Working with Oracle BI Views in Oracle BI Answers ■ Showing Results in Pivot Tables Using Oracle BI Pivot Table View
132
Displaying Running Sums in Oracle BI Pivot TablesNumeric measures in a pivot table can be displayed as running sums, where each consecutive cell for the measure displays the total of all previous cells for that measure. This option is a display feature only that has no effect on actual pivot table results.
Typically, running sums would be displayed for duplicated columns or for measures for which the option to show data as a percentage of the column has been selected, with the last value being 100 percent. Running sums apply to all totals. The running sum for each level of detail is computed separately.
Column headings are not affected when the running sum option is selected. You can format the column heading if you want it to indicate that the running sum option is in effect.
The following usage rules are in effect for running sums:
■ A running sum is incompatible with the SQL RSUM function (the effect would be a running sum of the running sum).
■ All running sums are reset with each new section. A running sum does not reset at a break within a section or continued across sections.
■ If a measure does not display in a single column or in a single row, the measure is summed left to right and then top to bottom. (The lower right cell will contain the grand total.) A running sum does not reset with each row or column.
■ Rolling minimums, maximums, and averages are not supported.
To display a measure as a running sum■ In the Measures area, click the More Options button for the row or column to be summed and
choose the following option:
Display as running sum
Showing an Item’s Relative Value in Oracle BI Pivot TablesYou can dynamically convert a stored or calculated measure on a pivot table into a percent or an index. This shows the relative value of the item, compared to the total, without the need to explicitly create a calculation for it.
For example, if you are using a pivot table to examine sales by region, you can duplicate the sales measure and view it as a percentage of the total. This allows you to see the actual sales, and the percentage of sales, that each region accounts for.
You can view the measure as a percentage between 0.00 and 100.00, or as an index between 0 and 1. Deciding which method to use is at your discretion.

Working with Oracle BI Views in Oracle BI Answers ■ Showing Results in Pivot TablesUsing Oracle BI Pivot Table View
Oracle Business Intelligence Answers, Delivers, and InteractiveDashboards User Guide Version 10.1.3.2
133
To show an item as a relative value in an Oracle BI pivot table
1 At the pivot table view, click the More Options button for the item you want to show as a relative value.
NOTE: The following step is optional. When you duplicate the measure in the pivot table, you can see both the total for the measure and its relative value. This eliminates the need to add the column twice on the Criteria tab to see the total and its relative value in the pivot table.
2 To duplicate the measure, select the option Duplicate Layer.
The measure appears a second time in the pivot table, with the same name. If you want to rename the measure, click More Options and select Rename.
3 Select the option Show Data As and choose Percent of or Index of, and then choose the appropriate submenu option.
NOTE: The option Show Data As is available only for items that are stored or calculated measures.
The options for Percent of and Index of are shown in the following table. For Percent of choices, the number of decimal places is dependent upon the type of measure.
Using Calculations in Oracle BI Pivot TablesYou can use calculations in a pivot table to obtain different views of the data. The calculations allow you to override the default aggregation rule specified in the Oracle BI repository, and for an existing report, the aggregation rule chosen by the author.
Percent of or Index of Result
Column Shows the percentage of the column, or index value, that this value constitutes.
Row Shows the percentage of the row, or index value, that this value constitutes.
Section Shows the percentage of the section, or index value, that this value constitutes.
Page Shows the percentage of the page, or index value, that this value constitutes.
Column Parent Shows the percentage of the column parent, or index value, that this value constitutes.

Oracle Business Intelligence Answers, Delivers, and Interactive Dashboards User Guide Version 10.1.3.2
Working with Oracle BI Views in Oracle BI Answers ■ Showing Results in Pivot Tables Using Oracle BI Pivot Table View
134
Table 20 describes the calculations that you can use in pivot tables.
Internally, Oracle BI Presentation Services processes pivot table calculations as SQL SELECT statements, and performs the indicated functions on the result set. For more information about SQL functions, see Oracle Business Intelligence Server Administration Guide.
Building Calculations in Oracle BI Pivot TablesYou can build calculations for items in the Pages, Sections, Rows, and Columns areas.
To build a calculation for an item in an Oracle BI pivot table
1 In the Pages, Sections, Rows, or Columns area, click the More Options button for the measure on which you want a calculation performed.
Table 20. Oracle BI Pivot Table Calculations
Calculation Description
Default Applies the default aggregation rule as in the Oracle BI repository or by the original author of the report.
Sum Calculates the sum obtained by adding up all values in the result set. Use this on items that have numeric values.
Min Calculates the minimum value (lowest numeric value) of the rows in the result set. Use this on items that have numeric values.
Max Calculates the maximum value (highest numeric value) of the rows in the result set. Use this on items that have numeric values.
Average Calculates the average (mean) value of an item in the result set. Use this on items that have numeric values. Averages on pivot tables are rounded to nearest whole number.
First In the result set, selects the first occurrence of the item.
Last In the result set, selects the last occurrence of the item.
Count Calculates the number of rows in the result set that have a nonnull value for the item. The item is typically a column name, in which case the number of rows with nonnull values for that column are returned.
Count Distinct Adds distinct processing to the Count function. This means that each distinct occurrence of the item is counted only once.
Formula Opens a toolbar that lets you select mathematical operators to include in the calculation.
None No calculation is applied.
Server Complex Aggregate
The aggregation rule is determined and calculated by the server instead of the pivot table.
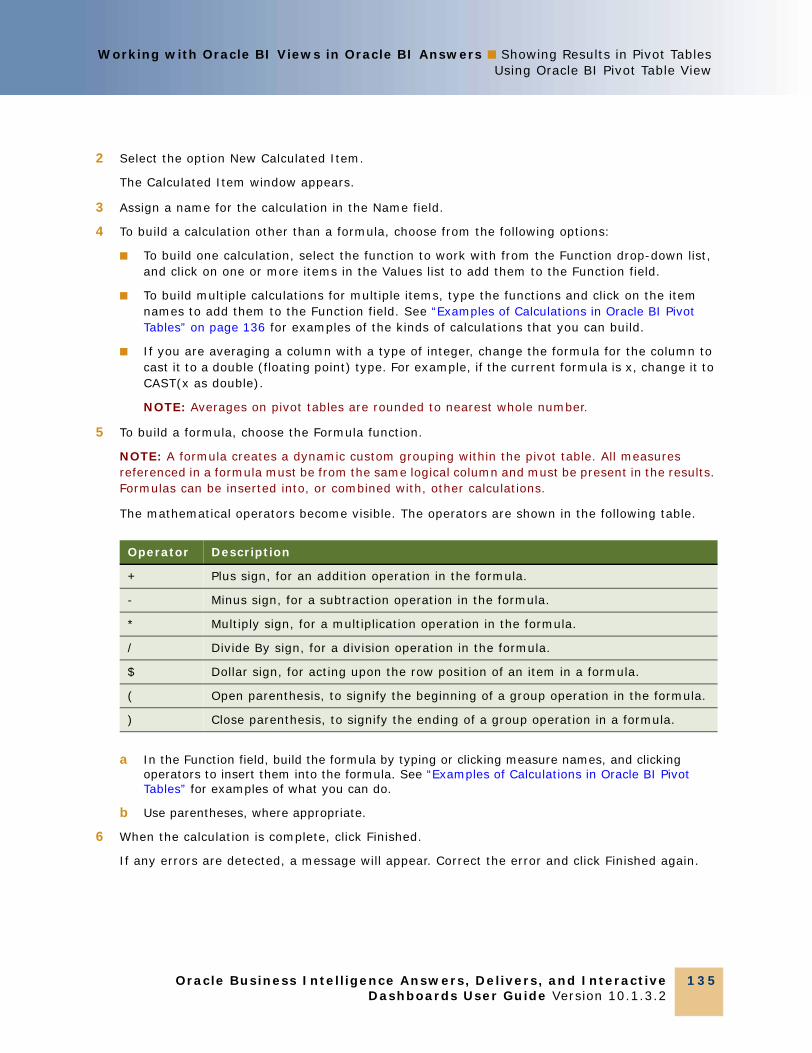
Working with Oracle BI Views in Oracle BI Answers ■ Showing Results in Pivot TablesUsing Oracle BI Pivot Table View
Oracle Business Intelligence Answers, Delivers, and InteractiveDashboards User Guide Version 10.1.3.2
135
2 Select the option New Calculated Item.
The Calculated Item window appears.
3 Assign a name for the calculation in the Name field.
4 To build a calculation other than a formula, choose from the following options:
■ To build one calculation, select the function to work with from the Function drop-down list, and click on one or more items in the Values list to add them to the Function field.
■ To build multiple calculations for multiple items, type the functions and click on the item names to add them to the Function field. See “Examples of Calculations in Oracle BI Pivot Tables” on page 136 for examples of the kinds of calculations that you can build.
■ If you are averaging a column with a type of integer, change the formula for the column to cast it to a double (floating point) type. For example, if the current formula is x, change it to CAST(x as double).
NOTE: Averages on pivot tables are rounded to nearest whole number.
5 To build a formula, choose the Formula function.
NOTE: A formula creates a dynamic custom grouping within the pivot table. All measures referenced in a formula must be from the same logical column and must be present in the results. Formulas can be inserted into, or combined with, other calculations.
The mathematical operators become visible. The operators are shown in the following table.
a In the Function field, build the formula by typing or clicking measure names, and clicking operators to insert them into the formula. See “Examples of Calculations in Oracle BI Pivot Tables” for examples of what you can do.
b Use parentheses, where appropriate.
6 When the calculation is complete, click Finished.
If any errors are detected, a message will appear. Correct the error and click Finished again.
Operator Description
+ Plus sign, for an addition operation in the formula.
- Minus sign, for a subtraction operation in the formula.
* Multiply sign, for a multiplication operation in the formula.
/ Divide By sign, for a division operation in the formula.
$ Dollar sign, for acting upon the row position of an item in a formula.
( Open parenthesis, to signify the beginning of a group operation in the formula.
) Close parenthesis, to signify the ending of a group operation in a formula.
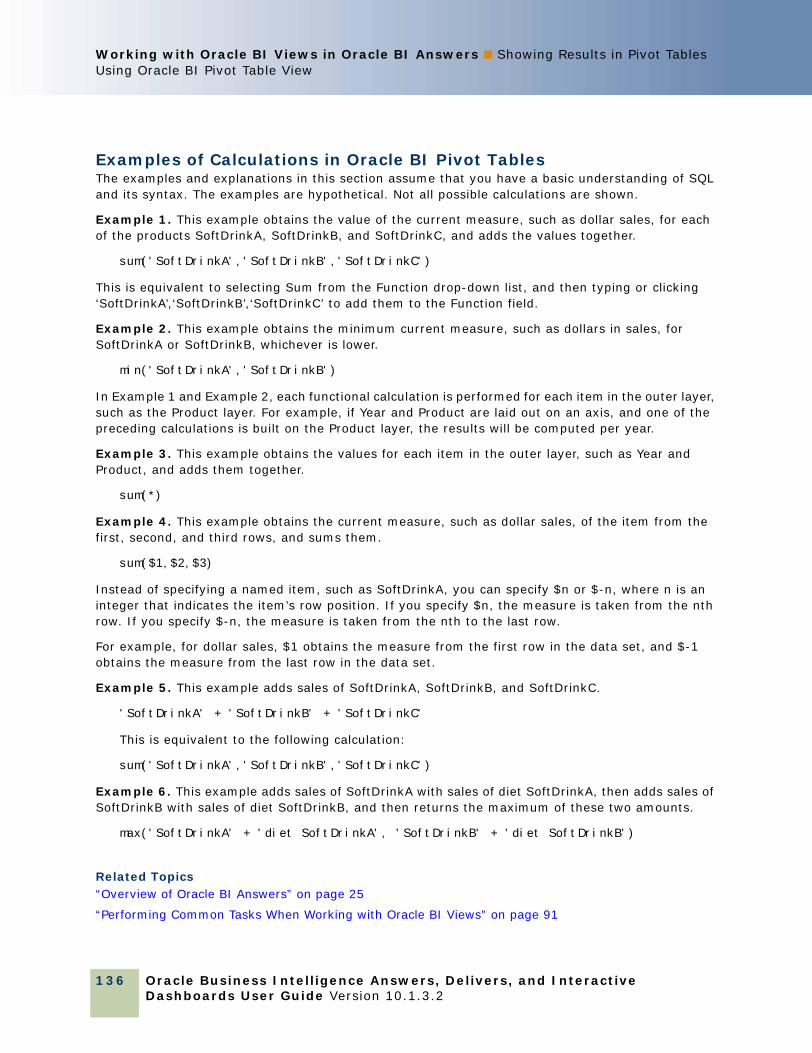
Oracle Business Intelligence Answers, Delivers, and Interactive Dashboards User Guide Version 10.1.3.2
Working with Oracle BI Views in Oracle BI Answers ■ Showing Results in Pivot Tables Using Oracle BI Pivot Table View
136
Examples of Calculations in Oracle BI Pivot TablesThe examples and explanations in this section assume that you have a basic understanding of SQL and its syntax. The examples are hypothetical. Not all possible calculations are shown.
Example 1. This example obtains the value of the current measure, such as dollar sales, for each of the products SoftDrinkA, SoftDrinkB, and SoftDrinkC, and adds the values together.
sum('SoftDrinkA','SoftDrinkB','SoftDrinkC')
This is equivalent to selecting Sum from the Function drop-down list, and then typing or clicking ‘SoftDrinkA’,‘SoftDrinkB’,‘SoftDrinkC’ to add them to the Function field.
Example 2. This example obtains the minimum current measure, such as dollars in sales, for SoftDrinkA or SoftDrinkB, whichever is lower.
min('SoftDrinkA','SoftDrinkB')
In Example 1 and Example 2, each functional calculation is performed for each item in the outer layer, such as the Product layer. For example, if Year and Product are laid out on an axis, and one of the preceding calculations is built on the Product layer, the results will be computed per year.
Example 3. This example obtains the values for each item in the outer layer, such as Year and Product, and adds them together.
sum(*)
Example 4. This example obtains the current measure, such as dollar sales, of the item from the first, second, and third rows, and sums them.
sum($1,$2,$3)
Instead of specifying a named item, such as SoftDrinkA, you can specify $n or $-n, where n is an integer that indicates the item’s row position. If you specify $n, the measure is taken from the nth row. If you specify $-n, the measure is taken from the nth to the last row.
For example, for dollar sales, $1 obtains the measure from the first row in the data set, and $-1 obtains the measure from the last row in the data set.
Example 5. This example adds sales of SoftDrinkA, SoftDrinkB, and SoftDrinkC.
'SoftDrinkA' + 'SoftDrinkB' + 'SoftDrinkC'
This is equivalent to the following calculation:
sum('SoftDrinkA','SoftDrinkB','SoftDrinkC')
Example 6. This example adds sales of SoftDrinkA with sales of diet SoftDrinkA, then adds sales of SoftDrinkB with sales of diet SoftDrinkB, and then returns the maximum of these two amounts.
max('SoftDrinkA' + 'diet SoftDrinkA', 'SoftDrinkB' + 'diet SoftDrinkB')
Related Topics“Overview of Oracle BI Answers” on page 25
“Performing Common Tasks When Working with Oracle BI Views” on page 91

Working with Oracle BI Views in Oracle BI Answers ■ Showing Results as Gauges UsingOracle BI Gauge View
Oracle Business Intelligence Answers, Delivers, and InteractiveDashboards User Guide Version 10.1.3.2
137
Showing Results as Gauges Using Oracle BI Gauge ViewUse the gauge view to show results in gauges. Gauges are useful for showing performance against goals. Supported gauge types include dial, bar, and bulb-style gauges.
You can select the type of gauge and customize its appearance, including the title, the ranges to show, how many gauges to display in a row, and other characteristics such as gauge width and dial and indicator needle size. You can also set thresholds, borders and colors, and control other gauge characteristics.
Gauges are navigable. When a user clicks it, you can direct the user to another saved request, or dashboard.
This section explains how to work with gauges. It contains the following topics:
■ “Description of Oracle BI Gauges” on page 137
■ “Description of Oracle BI Gauge View Buttons” on page 138
■ “General Steps to Add or Modify an Oracle BI Gauge View” on page 139
■ “Specifying General Gauge Background Properties in Oracle BI Gauge View” on page 140
■ “Adding Titles and Footers in Oracle BI Gauge View” on page 140
■ “Adding Gauge Ranges in Oracle BI Gauge View” on page 141
■ “Specifying Additional Properties for a Gauge in Oracle BI Gauge View” on page 141
■ “Setting Advanced Properties for the Dial in a Dial Gauge” on page 143
Description of Oracle BI Gauges This section describes gauge types, subtypes, and sizes.
Gauge TypesTable 21 shows the gauges available from the Gauge drop-down list and describes their uses. The default gauge is a dial gauge.
Table 21. Oracle BI Gauge Selections
Gauge Type Description
Dial A dial gauge shows data using a dial with one or more indicator needles that change position to indicate where the data falls within predefined limits.

Oracle Business Intelligence Answers, Delivers, and Interactive Dashboards User Guide Version 10.1.3.2
Working with Oracle BI Views in Oracle BI Answers ■ Showing Results as Gauges Using Oracle BI Gauge View
138
Gauge SubtypesYour selection for the gauge type determines the gauge subtypes that are available from the Type drop-down list. The dial gauge has no subtype. Gauge subtypes include the following:
■ Bar gauges: Filled and LED-style. The default subtype is filled.
■ Bulb gauges: 3-dimensional (3D) and 2-dimensional (2D). The default subtype is 3D.
Gauge SizesGauge sizes include small, medium, large, and custom. The default size is medium.
Description of Oracle BI Gauge View ButtonsThe buttons at the top of the gauge view page provide access to various gauge settings. Table 22 describes the gauge view buttons and settings.
Bar A bar gauge shows data using a single bar that changes color to indicate whether the data is within predefined limits.
Bulb A bulb gauge shows data using a circle that changes color to indicate whether the data is within predefined limits. An array of bulb gauges is particularly useful for scorecard-type output.
Table 22. Oracle BI Gauge View Buttons and Settings
Gauge View Button Description
Allows you to set general properties for the background on which the gauge appears.
For more information, see “Specifying General Gauge Background Properties in Oracle BI Gauge View” on page 140.
Allows you to specify a title, a subtitle, a footer, and a secondary footer for the gauge.
For more information, see “Adding Titles and Footers in Oracle BI Gauge View” on page 140.
Allows you to specify the ranges to represent in the gauge.
For more information, see “Adding Gauge Ranges in Oracle BI Gauge View” on page 141.
Table 21. Oracle BI Gauge Selections
Gauge Type Description

Working with Oracle BI Views in Oracle BI Answers ■ Showing Results as Gauges UsingOracle BI Gauge View
Oracle Business Intelligence Answers, Delivers, and InteractiveDashboards User Guide Version 10.1.3.2
139
General Steps to Add or Modify an Oracle BI Gauge ViewThe following procedure provides the basic steps to add or modify a gauge view.
NOTE: If you select a gauge type that is incompatible with the results, no results are shown.
To add or modify an Oracle BI gauge view
1 In Oracle BI Answers, create or modify the request with which you want to work, and then perform one of the following actions:
■ To add a new gauge view, click the Results tab and choose Gauge from the views drop-down list.
■ To edit an existing gauge view, click the Results tab, choose Compound Layout from the views drop-down list, and then click the Edit View button for the gauge view.
The workspace shows the options and settings for the view.
2 Make your selections for the gauge, type, and size from the drop-down lists.
3 For all gauge types, use the Measures drop-down list to select the measure to gauge.
4 For dial gauges, use the Marker Type drop-down list select the indicator needle to use, such as a compass, arrow, or line.
a To select a color for the indicator needle, click the Color button and make a selection.
b To add another indicator needle, click the Add Marker button.
5 Use the buttons at the top of the gauge view page to specify additional gauge settings.
6 To remove changes and start from the default gauge view, click the Clear button.
7 When you are done, you can save the request with the gauge view.
Allows you to specify additional gauge properties, including control over the appearance of elements within the gauge, setting properties for gauge limits and tick marks, and specifying the interaction to occur when a user clicks the gauge.
For more information, see “Specifying Additional Properties for a Gauge in Oracle BI Gauge View” on page 141.
Allows you to set advanced properties for the dial in a dial gauge, including how scale labels are displayed, and the arc length and thickness of the dial.
For more information, see “Setting Advanced Properties for the Dial in a Dial Gauge” on page 143.
Table 22. Oracle BI Gauge View Buttons and Settings
Gauge View Button Description

Oracle Business Intelligence Answers, Delivers, and Interactive Dashboards User Guide Version 10.1.3.2
Working with Oracle BI Views in Oracle BI Answers ■ Showing Results as Gauges Using Oracle BI Gauge View
140
Specifying General Gauge Background Properties in Oracle BI Gauge ViewYou can set general properties for the background on which the gauge appears, such as whether to display a title and whether a legend appears with each gauge. You can also specify a background color, a color for the title, whether to show a border around the background, the number of gauges to show per row, and the space between them.
To set general background properties for an Oracle BI gauge view
1 Click the gauge canvas properties button at the top of the gauge view page.
The Gauge Canvas Properties dialog box appears.
2 Make your selection for a title:
■ To edit the name of the measure, click the formatting button (next to the title field), to display the Edit text format dialog box, and make your selections.
■ To show a different title, click Override default and type the title text.
3 For the legend, make a selection from the drop-down list.
The default location for the legend is below the title.
■ To suppress the display of the legend, choose None.
4 To set a background color for the area on which the gauge appears, click the background color button and make a selection.
5 To show the title in a color, click the text color button and make a selection.
6 To show a border along the edges of the background, click the border color button and make a selection.
7 Specify the number of gauges to appear per row, and the space between them.
The space between gauges is measured in pixels.
8 Click OK.
The gauge view refreshes. The view may resize to accommodate your selections.
Adding Titles and Footers in Oracle BI Gauge ViewYou can specify a title, a subtitle, a footer, and a secondary footer for the gauge. If the background holds multiple gauges, titles and footers appear for each gauge. Titles and footers are optional.
To add titles and footers in an Oracle BI gauge view
1 Click the gauge titles button at the top of the gauge view page.
The Gauge Titles dialog box appears.

Working with Oracle BI Views in Oracle BI Answers ■ Showing Results as Gauges UsingOracle BI Gauge View
Oracle Business Intelligence Answers, Delivers, and InteractiveDashboards User Guide Version 10.1.3.2
141
2 Type the text to use and click OK.
NOTE: As with the Narrative view, you can use @n to include the results from the designated column in the gauge titles. For example, @1 inserts the results from the first column, and @3 inserts the results from the third column. For more information, see “Adding Narrative Text to Results Using Oracle BI Narrative View” on page 148.
The gauge view refreshes.
Adding Gauge Ranges in Oracle BI Gauge ViewGauge ranges identify the minimum and maximum values for each range and include a color in which the range will appear in the gauge, such as green for acceptable, yellow for warning, and red for critical.
You can set gauge ranges to a static value, a variable, the column name of the measure, or as the result of an SQL query.
To set gauge ranges in an Oracle BI gauge view
1 Click the gauge ranges button at the top of the gauge view page.
The Gauge Ranges dialog box appears.
2 To add the first range, click the Add button.
a Type a caption for the range.
b To set the minimum and maximum gauge ranges, click the properties button and make a selection from the Advanced Options dialog box.
The Advanced Options dialog box enables you to specify either a static value, a variable, a column name, or a SQL statement.
c To specify the color for the range, click the color button and make a selection.
3 When you are done adding ranges, click OK.
The gauge view refreshes.
Specifying Additional Properties for a Gauge in Oracle BI Gauge ViewAdditional gauge properties include control over the appearance of elements within the gauge, setting properties for scale items such as gauge limits and tick marks, and specifying the interaction to occur when a user clicks the gauge. These properties are set in the Additional Gauge Properties dialog box.
Choices for the appearance of a gauge appear on the Appearance tab and include the following items:
■ Whether data labels appear.
Data labels can always appear, appear only when a user pauses the mouse over elements in the gauge, or never appear.

Oracle Business Intelligence Answers, Delivers, and Interactive Dashboards User Guide Version 10.1.3.2
Working with Oracle BI Views in Oracle BI Answers ■ Showing Results as Gauges Using Oracle BI Gauge View
142
■ Selections for a background color for the gauge, the color of text within the gauge, and a border around the gauge.
■ The height and width of the gauge, in pixels.
Choices for scale properties appear on the Scale tab and include the following items:
■ Default or custom gauge limits.
■ The number of major and minor tick marks.
Choices for the user interaction with the gauge appear on the Interaction tab and include the following actions:
■ Navigate. Allows the user to navigate to another saved request or dashboard. For more information, see “To specify the user interaction with an Oracle BI gauge view” on page 142.
■ None. Disables or navigation from the gauge.
To specify the user interaction with an Oracle BI gauge view
1 Click the following button at the top of the gauge view page:
The Additional Gauge Properties dialog box appears.
2 Click the Interaction tab.
To allow navigation to other saved requests or dashboards (when a user clicks the gauge):
a Select the Navigate radio button, and click the Add Navigation Target button.
Target and Caption fields are displayed.
b If you want users to navigate to other saved requests or dashboards, click the Browse button to open the Choose Request/Dashboard dialog box, navigate to the target request or dashboard, and click OK to select the target.
c (Optional) Enter caption text in the Caption field.
Caption text is displayed when the user clicks on the gauge.
When no text is entered in the Caption field, the title of the target report or dashboard is displayed as the caption.
d To allow navigation to multiple saved requests, dashboards or Web sites, click the Add Navigation Target button, and repeat the previous steps.
e Click OK to save your changes.
When a user clicks on the gauge, the following rules apply:
❏ If multiple navigation paths exist to other saved requests or dashboards, a pop-up window displays a caption for each request/dashboard. Click a specific caption to navigate to the required request/dashboard.
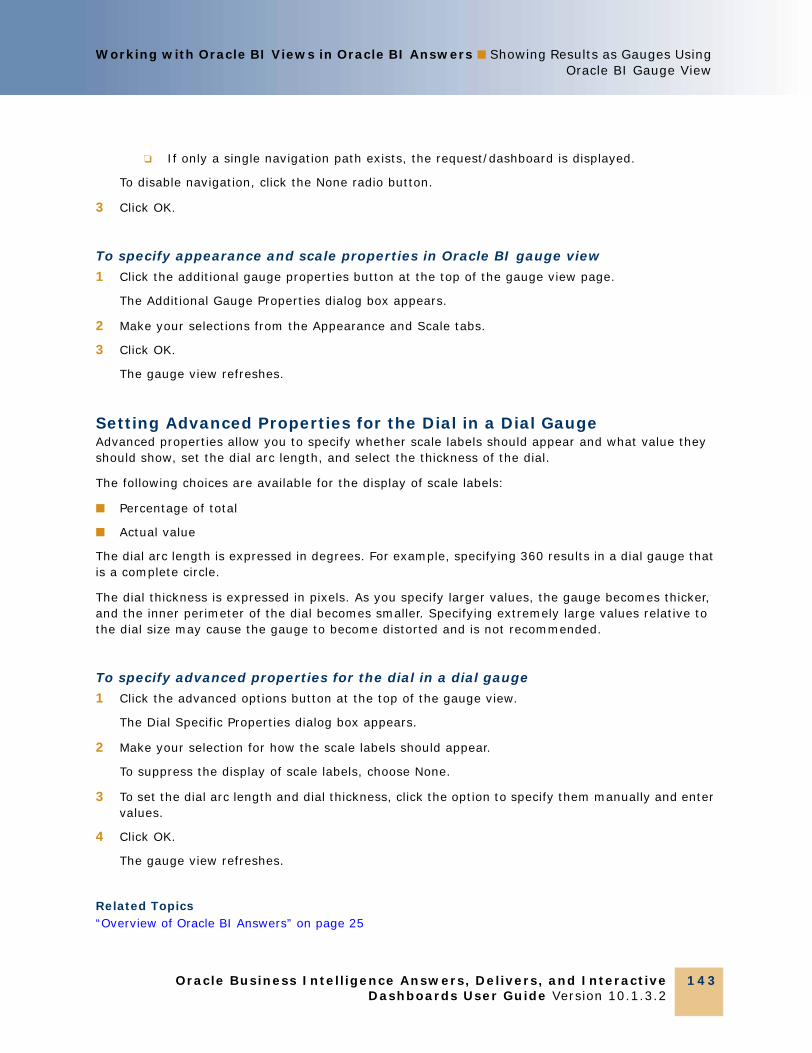
Working with Oracle BI Views in Oracle BI Answers ■ Showing Results as Gauges UsingOracle BI Gauge View
Oracle Business Intelligence Answers, Delivers, and InteractiveDashboards User Guide Version 10.1.3.2
143
❏ If only a single navigation path exists, the request/dashboard is displayed.
To disable navigation, click the None radio button.
3 Click OK.
To specify appearance and scale properties in Oracle BI gauge view
1 Click the additional gauge properties button at the top of the gauge view page.
The Additional Gauge Properties dialog box appears.
2 Make your selections from the Appearance and Scale tabs.
3 Click OK.
The gauge view refreshes.
Setting Advanced Properties for the Dial in a Dial GaugeAdvanced properties allow you to specify whether scale labels should appear and what value they should show, set the dial arc length, and select the thickness of the dial.
The following choices are available for the display of scale labels:
■ Percentage of total
■ Actual value
The dial arc length is expressed in degrees. For example, specifying 360 results in a dial gauge that is a complete circle.
The dial thickness is expressed in pixels. As you specify larger values, the gauge becomes thicker, and the inner perimeter of the dial becomes smaller. Specifying extremely large values relative to the dial size may cause the gauge to become distorted and is not recommended.
To specify advanced properties for the dial in a dial gauge
1 Click the advanced options button at the top of the gauge view.
The Dial Specific Properties dialog box appears.
2 Make your selection for how the scale labels should appear.
To suppress the display of scale labels, choose None.
3 To set the dial arc length and dial thickness, click the option to specify them manually and enter values.
4 Click OK.
The gauge view refreshes.
Related Topics“Overview of Oracle BI Answers” on page 25
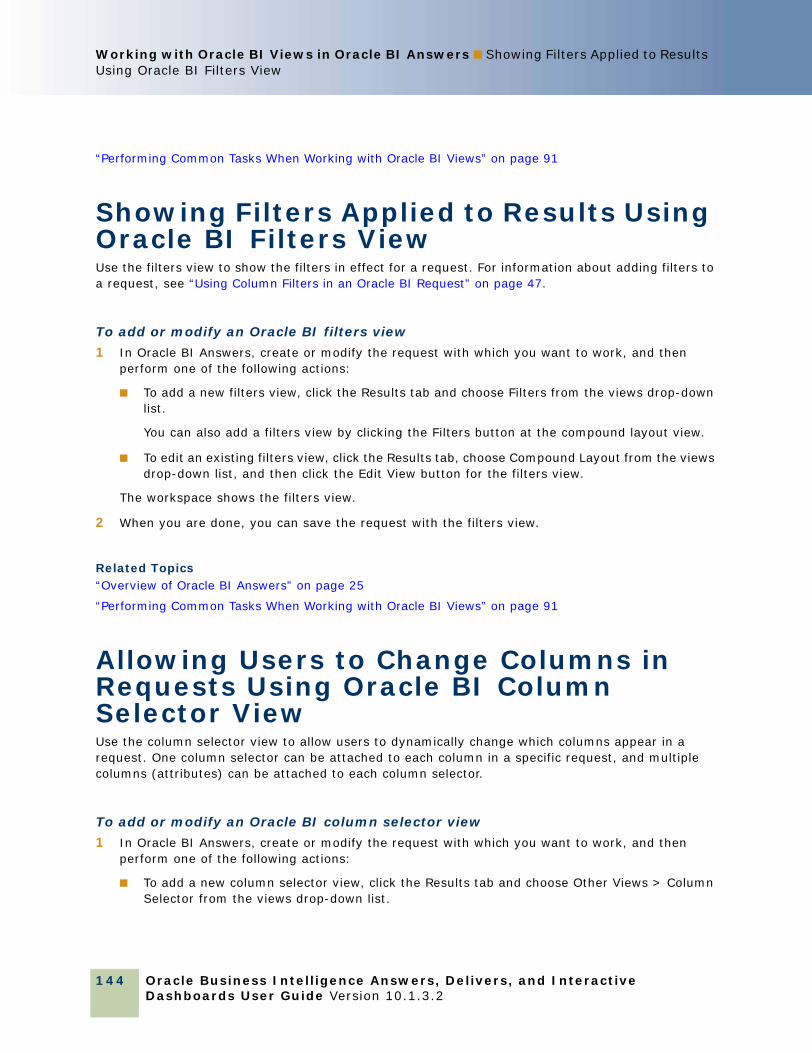
Oracle Business Intelligence Answers, Delivers, and Interactive Dashboards User Guide Version 10.1.3.2
Working with Oracle BI Views in Oracle BI Answers ■ Showing Filters Applied to Results Using Oracle BI Filters View
144
“Performing Common Tasks When Working with Oracle BI Views” on page 91
Showing Filters Applied to Results Using Oracle BI Filters ViewUse the filters view to show the filters in effect for a request. For information about adding filters to a request, see “Using Column Filters in an Oracle BI Request” on page 47.
To add or modify an Oracle BI filters view
1 In Oracle BI Answers, create or modify the request with which you want to work, and then perform one of the following actions:
■ To add a new filters view, click the Results tab and choose Filters from the views drop-down list.
You can also add a filters view by clicking the Filters button at the compound layout view.
■ To edit an existing filters view, click the Results tab, choose Compound Layout from the views drop-down list, and then click the Edit View button for the filters view.
The workspace shows the filters view.
2 When you are done, you can save the request with the filters view.
Related Topics“Overview of Oracle BI Answers” on page 25
“Performing Common Tasks When Working with Oracle BI Views” on page 91
Allowing Users to Change Columns in Requests Using Oracle BI Column Selector ViewUse the column selector view to allow users to dynamically change which columns appear in a request. One column selector can be attached to each column in a specific request, and multiple columns (attributes) can be attached to each column selector.
To add or modify an Oracle BI column selector view
1 In Oracle BI Answers, create or modify the request with which you want to work, and then perform one of the following actions:
■ To add a new column selector view, click the Results tab and choose Other Views > Column Selector from the views drop-down list.

Working with Oracle BI Views in Oracle BI Answers ■ Allowing Users to Select aSpecific View Using View Selector View
Oracle Business Intelligence Answers, Delivers, and InteractiveDashboards User Guide Version 10.1.3.2
145
■ To edit an existing Column Selector view, click the Results tab, choose Compound Layout from the views drop-down list, and then click the Edit View button for the column selector view.
The workspace shows the options and settings for the view.
2 Select the Include Selector option for each column that you want a column selector to appear.
3 Type a label for each selector and select a position for the label.
NOTE: If you do not type a label, users viewing the results will not see a label on the selector.
4 From the subject area in the selection pane, select the columns you want in the selector.
5 If you want to remove a specific choice from a column selector, click the Delete button.
To remove all choices, click the Clear Choices link.
6 When you are done, you can save the request with the column selector view.
Related Topics“Overview of Oracle BI Answers” on page 25
“Performing Common Tasks When Working with Oracle BI Views” on page 91
Allowing Users to Select a Specific View Using View Selector ViewUse the View Selector view to select a specific view of the results from among the saved views. When placed on a dashboard, the view selector appears as a drop-down list from which users can choose the specific result view they want to see.
In general, views included in the view sector view would not also be displayed as views in the compound layout view.
To add or modify an Oracle BI View Selector view
1 In Oracle BI Answers, create or modify the request with which you want to work, and then perform one of the following actions:
■ To add a new view selector view, click the Results tab and choose Other Views > View Selector from the views drop-down list.
■ To edit an existing view selector view, click the Results tab, choose Compound Layout from the views drop-down list, and then click the Edit View button for the view selector view.
The workspace shows the view selectors view.
2 (Optional) Type a caption for the view selector and indicate where the caption should appear relative to the view selector.
3 Make your selections for view choices to include in the view selector.
NOTE: The None view shows the selector only.

Oracle Business Intelligence Answers, Delivers, and Interactive Dashboards User Guide Version 10.1.3.2
Working with Oracle BI Views in Oracle BI Answers ■ Adding a Legend to Results Using Oracle BI Legend View
146
4 When you are done, you can save the request with the view selector view.
Adding a Legend to Results Using Oracle BI Legend ViewUse the Legend view to document the meaning of special formatting used in a request, such as the meaning of custom colors applied to gauges. Legends appear in HTML and PDF output, and can be localized.
For example, suppose you use conditional formatting in a request to show critical items in the color red and items that need attention in the color yellow. You can add a legend with text that documents the meaning of the colors and captions that summarize the appropriate action. You can use cosmetic formatting to make the background colors of the text match the colors in the conditional request.
To add or modify an Oracle BI legend view
1 In Oracle BI Answers, create or modify the request with which you want to work, and then perform one of the following actions:
■ To add a new legend view, click the Results tab and choose Other Views > Legend from the views drop-down list.
■ To edit an existing legend view, click the Results tab, choose Compound Layout from the views drop-down list, and then click the Edit View button for the legend view.
The workspace shows the legend view.
2 Make your selections for where to show captions and how many legend items you want per row.
3 (Optional) Type a title for the legend, such as Legend.
4 In the first Sample Text text box, type the first condition you want to document, such as Critical.
You can use the common formatting dialog box to set the background color, such as red.
5 In the first Caption text box, type the meaning of the condition, such as Requires Immediate Attention.
6 Continue adding Sample Text and Caption pairs as needed.
7 When you are done, you can save the request with the legend view.
Showing Results in a Funnel Chart Using Oracle BI Funnel Chart ViewUse the funnel chart view to show results as a three-dimensional chart that represents target and actual values and levels by color. Typically, funnel charts are used to graphically represent data that changes over different periods or stages. For example, funnel charts are often used to represent the volume of sales over a quarter.

Working with Oracle BI Views in Oracle BI Answers ■ Showing Results in a Funnel ChartUsing Oracle BI Funnel Chart View
Oracle Business Intelligence Answers, Delivers, and InteractiveDashboards User Guide Version 10.1.3.2
147
Funnel charts are well suited for showing actual compared to targets for data where the target is known to decrease (or increase) significantly per stage, such as a sales pipeline. You can click on one of the colored areas to drill down to more detailed information.
In funnel charts, the thresholds indicate a percentage of the target value, and colors provide visual information for each stage:
■ All stages for which the actual value falls below the minimum threshold are colored in red.
■ All stages for which the actual value falls below the maximum threshold are colored in yellow.
■ All stages for which the actual value is greater than the maximum threshold are colored in green.
To add or modify an Oracle BI funnel chart view
1 In Oracle BI Answers, create or modify the request with which you want to work, and then perform one of the following actions:
■ To add a new funnel chart view, click the Results tab and choose Other Views > Funnel Chart from the views drop-down list.
■ To edit an existing funnel chart view, click the Results tab, choose Compound Layout from the views drop-down list, and then click the Edit View button for the funnel chart view.
The workspace shows the options and settings for the view.
2 Make your selections for the fields in the workspace.
The following table describes the fields.
Funnel Chart View Workspace Field Description
Chart Title Specifies the title to display when the chart appears.
Stage Identifies the stage to represent, from the drop-down list.
Actual Value Specifies the actual value for the stage, from the drop-down list.
Target Value Specifies the target value for the stage, from the drop-down list.
Target value for final stage only
Indicates whether the target value should appear for each stage or for the final stage only.
Factor required to meet target
Identifies the factors required to meet targets.
Minimum Threshold Specifies the minimum threshold.
Maximum Threshold Specifies the maximum threshold.
Size Specifies the size.

Oracle Business Intelligence Answers, Delivers, and Interactive Dashboards User Guide Version 10.1.3.2
Working with Oracle BI Views in Oracle BI Answers ■ Adding Narrative Text to Results Using Oracle BI Narrative View
148
3 When you are done, you can save the request with the funnel chart view.
Related Topics“Overview of Oracle BI Answers” on page 25
“Performing Common Tasks When Working with Oracle BI Views” on page 91
Adding Narrative Text to Results Using Oracle BI Narrative ViewUse the narrative view to add one or more paragraphs of text to appear with the results. Narrative text is useful for providing information such as context, explanatory text, or extended descriptions. You can perform the following actions in the narrative view:
■ Type a sentence with placeholders for each column in the results.
■ Specify how rows should be separated.
■ Use HTML formatting buttons to make text bold, italic, or underlined, and insert line breaks.
■ Apply cosmetic formatting to the fonts used in the narrative view, or import the font formatting from a previously saved view.
■ Add references to variables
Example Usage Scenario for the Narrative Text ViewA user creates a request that returns the region name in the second column as part of the result set. The user wants the narrative view to appear as shown in the following example, with introductory text and each region listed on a new line:
This report shows your sales by region. The regions are:
East RegionWest Region
Force standard shape and equal stage widths
Indicates whether Oracle BI will automatically force the display.
Interaction Indicates the level of interaction allowed in the chart. Choices include None, Drill, and Navigate.
NOTE: When you select Navigate from the Interaction drop down list, the navigation targets defined for the column on which the funnel chart is based on, are applied.
Funnel Chart View Workspace Field Description
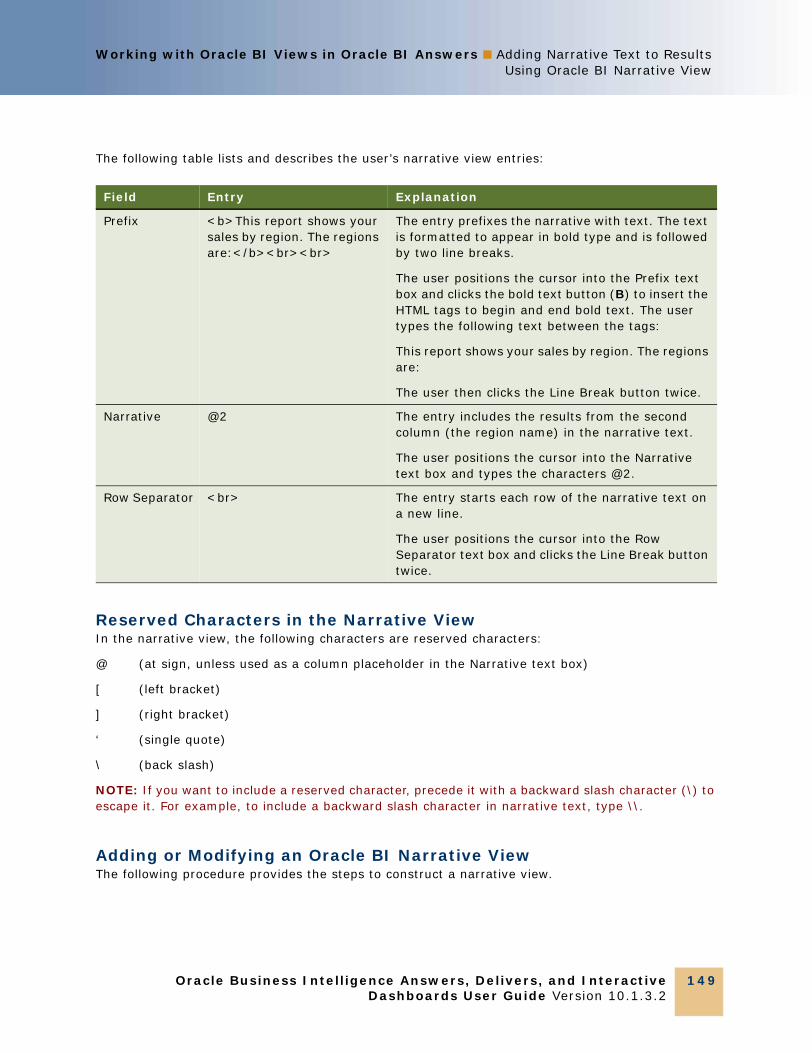
Working with Oracle BI Views in Oracle BI Answers ■ Adding Narrative Text to ResultsUsing Oracle BI Narrative View
Oracle Business Intelligence Answers, Delivers, and InteractiveDashboards User Guide Version 10.1.3.2
149
The following table lists and describes the user’s narrative view entries:
Reserved Characters in the Narrative ViewIn the narrative view, the following characters are reserved characters:
@ (at sign, unless used as a column placeholder in the Narrative text box)
[ (left bracket)
] (right bracket)
‘ (single quote)
\ (back slash)
NOTE: If you want to include a reserved character, precede it with a backward slash character (\) to escape it. For example, to include a backward slash character in narrative text, type \\.
Adding or Modifying an Oracle BI Narrative ViewThe following procedure provides the steps to construct a narrative view.
Field Entry Explanation
Prefix <b>This report shows your sales by region. The regions are:</b><br><br>
The entry prefixes the narrative with text. The text is formatted to appear in bold type and is followed by two line breaks.
The user positions the cursor into the Prefix text box and clicks the bold text button (B) to insert the HTML tags to begin and end bold text. The user types the following text between the tags:
This report shows your sales by region. The regions are:
The user then clicks the Line Break button twice.
Narrative @2 The entry includes the results from the second column (the region name) in the narrative text.
The user positions the cursor into the Narrative text box and types the characters @2.
Row Separator <br> The entry starts each row of the narrative text on a new line.
The user positions the cursor into the Row Separator text box and clicks the Line Break button twice.

Oracle Business Intelligence Answers, Delivers, and Interactive Dashboards User Guide Version 10.1.3.2
Working with Oracle BI Views in Oracle BI Answers ■ Adding Narrative Text to Results Using Oracle BI Narrative View
150
In the Prefix, Narrative, and PostFix text boxes, you can use the HTML formatting buttons to make text appear in bold, italic or underlined type.
NOTE: To include a line break, use the Line Break button. Pressing Enter does not result in multiple lines of text.
To add or modify an Oracle BI narrative view
1 In Oracle BI Answers, create or modify the request with which you want to work, and then perform one of the following actions:
■ To add a new narrative view, click the Results tab and choose Other Views > Narrative from the views drop-down list.
■ To edit a narrative view, click the Results tab, choose Compound Layout from the views drop-down list, and then click the Edit View button for the narrative view.
The workspace shows the options and settings for the view.
2 Enter your selections for the fields in the workspace.
The following table describes the fields.
Narrative View Workspace Field Comments
Prefix Specifies the header for the narrative. This text appears at the beginning of the narrative.
You can use the @{variableName}{<value>}[format] syntax to include a variable. For example:Prefix - Region:@{myFavoriteRegion} - Year:@{myFavoriteYear}.
Narrative Indicates the narrative text that will appear for each row in the results. Use @n to include the results from the designated column in the narrative. For example, @1 inserts the results from the first column in the narrative, and @3 inserts the results of the third column.
You can use the @{variableName}{<value>}[format] syntax to include a variable. For example:Narrative - Region@{myFavoriteRegion} - Year:@{myFavoriteYear}.
Row Separator Specifies a row separator tag. Then, you can enter the desired row separator in the Row Separator text box.
Postfix Specifies the footer text that appear at the bottom of the narrative.
You can use the @{variableName}{<value>}[format] syntax to include a variable. For example:PostFix - Region@{myFavoriteRegion} - Year:@{myFavoriteYear}.
NOTE: To display the footer information on a separate line from the actual narrative text, include markup tags in the postfix text box. Make sure that the narrative ends in a row separator, or that the footer begins with a row separator.

Working with Oracle BI Views in Oracle BI Answers ■ Showing Results in a ScrollingTicker Using Oracle BI Ticker View
Oracle Business Intelligence Answers, Delivers, and InteractiveDashboards User Guide Version 10.1.3.2
151
3 To apply cosmetic formatting to the font used in the narrative view, click the format view button.
For information about applying cosmetic formatting, see “Applying Cosmetic Formatting to Results and Dashboards” on page 81.
4 To import the font formatting from a previously saved view, click the import formatting button and navigate to the saved view.
5 When you are done, you can save the request with the narrative view.
Related Topics“Overview of Oracle BI Answers” on page 25
“Performing Common Tasks When Working with Oracle BI Views” on page 91
Showing Results in a Scrolling Ticker Using Oracle BI Ticker ViewA ticker displays the results of a request as a marquee (moving results that scroll across the page). You can customize the size of the scroll area, the speed and direction in which the results scroll, and other display settings.
NOTE: If your Web browser does not support moving text, the results will appear, but they will not scroll across the page.
To add or modify an Oracle BI ticker view
1 In Oracle BI Answers, create or modify the request with which you want to work, and then perform one of the following actions:
■ To add a new ticker view, click the Results tab and choose Other Views > Ticker from the views drop-down list.
■ To edit an existing ticker view, click the Results tab, choose Compound Layout from the views drop-down list, and then click the Edit View button for the ticker view.
The workspace shows the options and settings for the view.
2 To generate default settings for the most commonly used fields, click the Set Defaults button.
CAUTION: If you click the Set Defaults button after entering values in other fields, your entered values are cleared.
3 To clear all fields, click the Clear Fields button.
NOTE: After you clear all fields, you can click the Set Default button to restore default settings for the most commonly used fields.
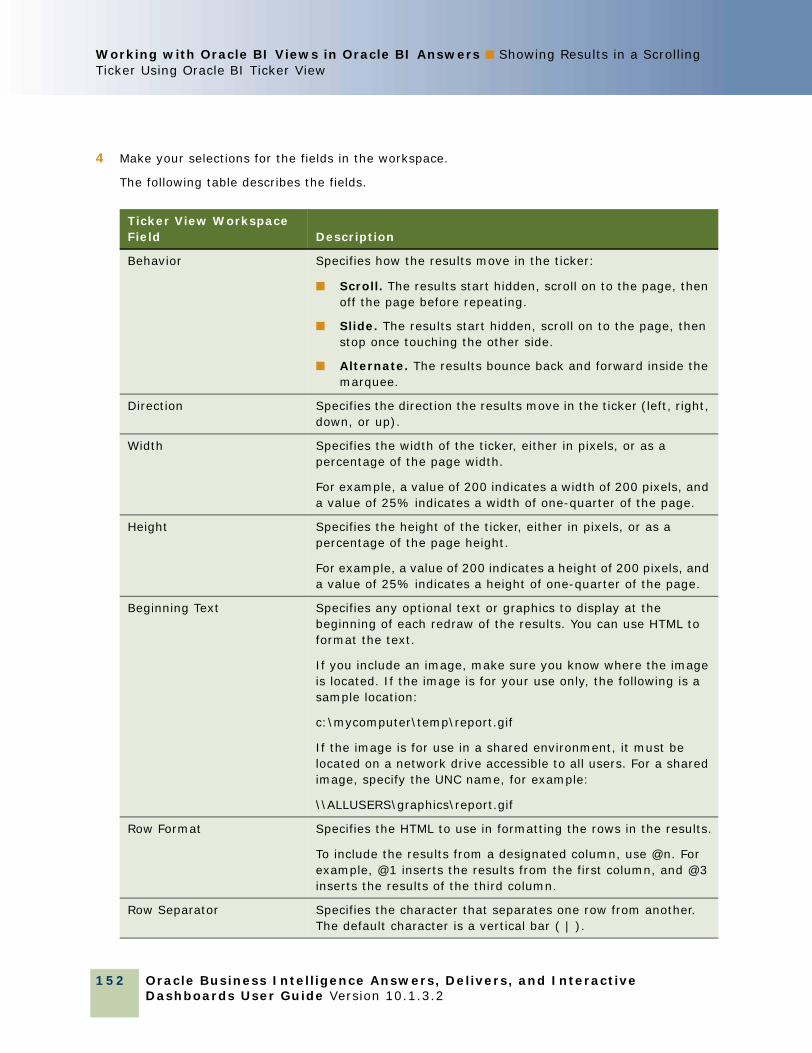
Oracle Business Intelligence Answers, Delivers, and Interactive Dashboards User Guide Version 10.1.3.2
Working with Oracle BI Views in Oracle BI Answers ■ Showing Results in a Scrolling Ticker Using Oracle BI Ticker View
152
4 Make your selections for the fields in the workspace.
The following table describes the fields.
Ticker View Workspace Field Description
Behavior Specifies how the results move in the ticker:
■ Scroll. The results start hidden, scroll on to the page, then off the page before repeating.
■ Slide. The results start hidden, scroll on to the page, then stop once touching the other side.
■ Alternate. The results bounce back and forward inside the marquee.
Direction Specifies the direction the results move in the ticker (left, right, down, or up).
Width Specifies the width of the ticker, either in pixels, or as a percentage of the page width.
For example, a value of 200 indicates a width of 200 pixels, and a value of 25% indicates a width of one-quarter of the page.
Height Specifies the height of the ticker, either in pixels, or as a percentage of the page height.
For example, a value of 200 indicates a height of 200 pixels, and a value of 25% indicates a height of one-quarter of the page.
Beginning Text Specifies any optional text or graphics to display at the beginning of each redraw of the results. You can use HTML to format the text.
If you include an image, make sure you know where the image is located. If the image is for your use only, the following is a sample location:
c:\mycomputer\temp\report.gif
If the image is for use in a shared environment, it must be located on a network drive accessible to all users. For a shared image, specify the UNC name, for example:
\\ALLUSERS\graphics\report.gif
Row Format Specifies the HTML to use in formatting the rows in the results.
To include the results from a designated column, use @n. For example, @1 inserts the results from the first column, and @3 inserts the results of the third column.
Row Separator Specifies the character that separates one row from another. The default character is a vertical bar ( | ).
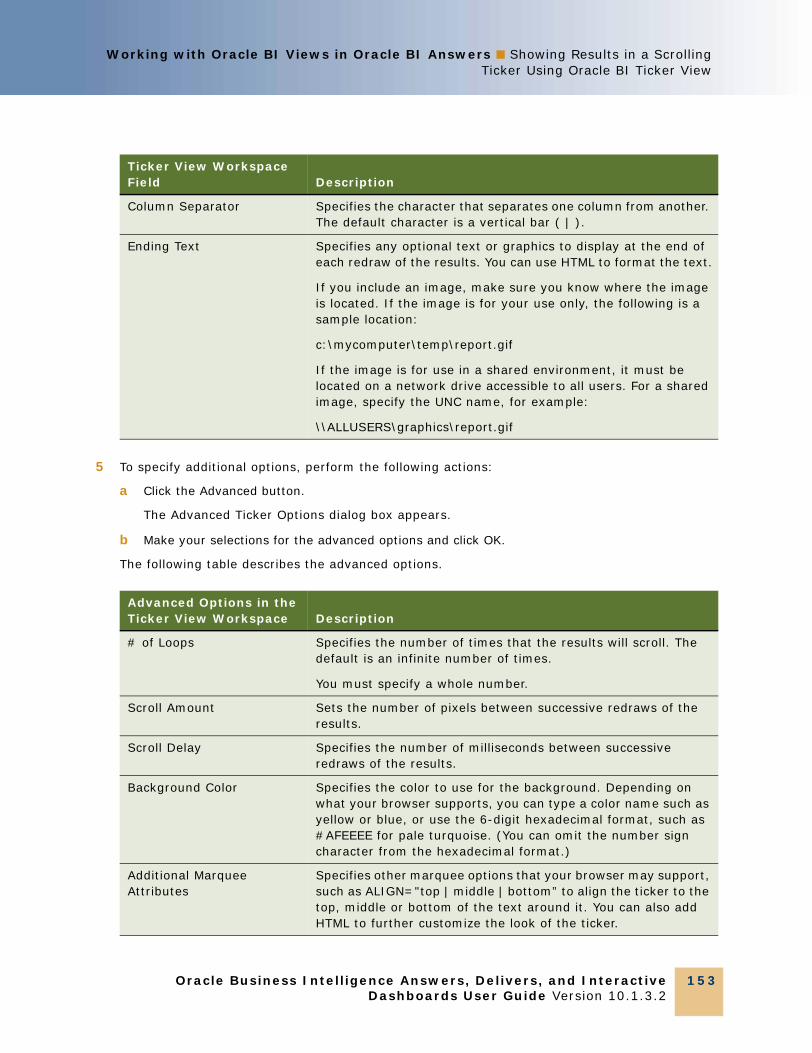
Working with Oracle BI Views in Oracle BI Answers ■ Showing Results in a ScrollingTicker Using Oracle BI Ticker View
Oracle Business Intelligence Answers, Delivers, and InteractiveDashboards User Guide Version 10.1.3.2
153
5 To specify additional options, perform the following actions:
a Click the Advanced button.
The Advanced Ticker Options dialog box appears.
b Make your selections for the advanced options and click OK.
The following table describes the advanced options.
Column Separator Specifies the character that separates one column from another. The default character is a vertical bar ( | ).
Ending Text Specifies any optional text or graphics to display at the end of each redraw of the results. You can use HTML to format the text.
If you include an image, make sure you know where the image is located. If the image is for your use only, the following is a sample location:
c:\mycomputer\temp\report.gif
If the image is for use in a shared environment, it must be located on a network drive accessible to all users. For a shared image, specify the UNC name, for example:
\\ALLUSERS\graphics\report.gif
Advanced Options in the Ticker View Workspace Description
# of Loops Specifies the number of times that the results will scroll. The default is an infinite number of times.
You must specify a whole number.
Scroll Amount Sets the number of pixels between successive redraws of the results.
Scroll Delay Specifies the number of milliseconds between successive redraws of the results.
Background Color Specifies the color to use for the background. Depending on what your browser supports, you can type a color name such as yellow or blue, or use the 6-digit hexadecimal format, such as #AFEEEE for pale turquoise. (You can omit the number sign character from the hexadecimal format.)
Additional Marquee Attributes
Specifies other marquee options that your browser may support, such as ALIGN="top | middle | bottom” to align the ticker to the top, middle or bottom of the text around it. You can also add HTML to further customize the look of the ticker.
Ticker View Workspace Field Description
Oracle Business Intelligence Answers, Delivers, and Interactive Dashboards User Guide Version 10.1.3.2
Working with Oracle BI Views in Oracle BI Answers ■ Adding Text to Results Using Oracle BI Static Text View
154
6 When you are done, you can save the request with the ticker view.
Related Topics“Overview of Oracle BI Answers” on page 25
“Performing Common Tasks When Working with Oracle BI Views” on page 91
Adding Text to Results Using Oracle BI Static Text ViewUse the static text view to add or edit text to appear with the results. You can add markup that contains formatted text, and depending on the security settings of the Analytics servers, ActiveX controls, JavaScripts, sound bites, animation, specialized logos, variables and so on.
The markup may contain anything that is supported by your browser, but only formatting defined using the buttons at the top of the workspace will be displayed in PDF output.
To add or modify an Oracle BI static text view
1 In Oracle BI Answers, create or modify the request with which you want to work, and then perform one of the following actions:
■ To add a new static text view, click the Results tab and choose Other Views > Static Text from the views drop-down list.
■ To edit an existing static text view, click the Results tab, choose Compound Layout from the views drop-down list, and then click the Edit View button for the static text view.
The workspace shows the static text view.
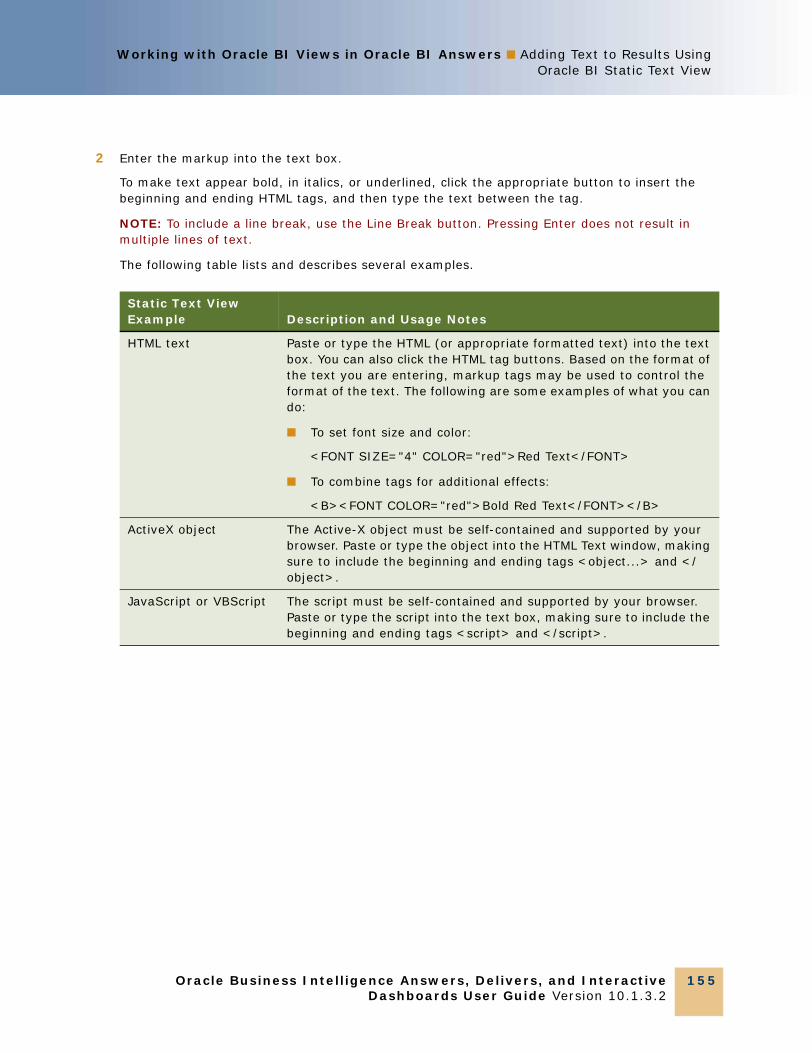
Working with Oracle BI Views in Oracle BI Answers ■ Adding Text to Results UsingOracle BI Static Text View
Oracle Business Intelligence Answers, Delivers, and InteractiveDashboards User Guide Version 10.1.3.2
155
2 Enter the markup into the text box.
To make text appear bold, in italics, or underlined, click the appropriate button to insert the beginning and ending HTML tags, and then type the text between the tag.
NOTE: To include a line break, use the Line Break button. Pressing Enter does not result in multiple lines of text.
The following table lists and describes several examples.
Static Text View Example Description and Usage Notes
HTML text Paste or type the HTML (or appropriate formatted text) into the text box. You can also click the HTML tag buttons. Based on the format of the text you are entering, markup tags may be used to control the format of the text. The following are some examples of what you can do:
■ To set font size and color:
<FONT SIZE="4" COLOR="red">Red Text</FONT>
■ To combine tags for additional effects:
<B><FONT COLOR="red">Bold Red Text</FONT></B>
ActiveX object The Active-X object must be self-contained and supported by your browser. Paste or type the object into the HTML Text window, making sure to include the beginning and ending tags <object...> and </object>.
JavaScript or VBScript The script must be self-contained and supported by your browser. Paste or type the script into the text box, making sure to include the beginning and ending tags <script> and </script>.
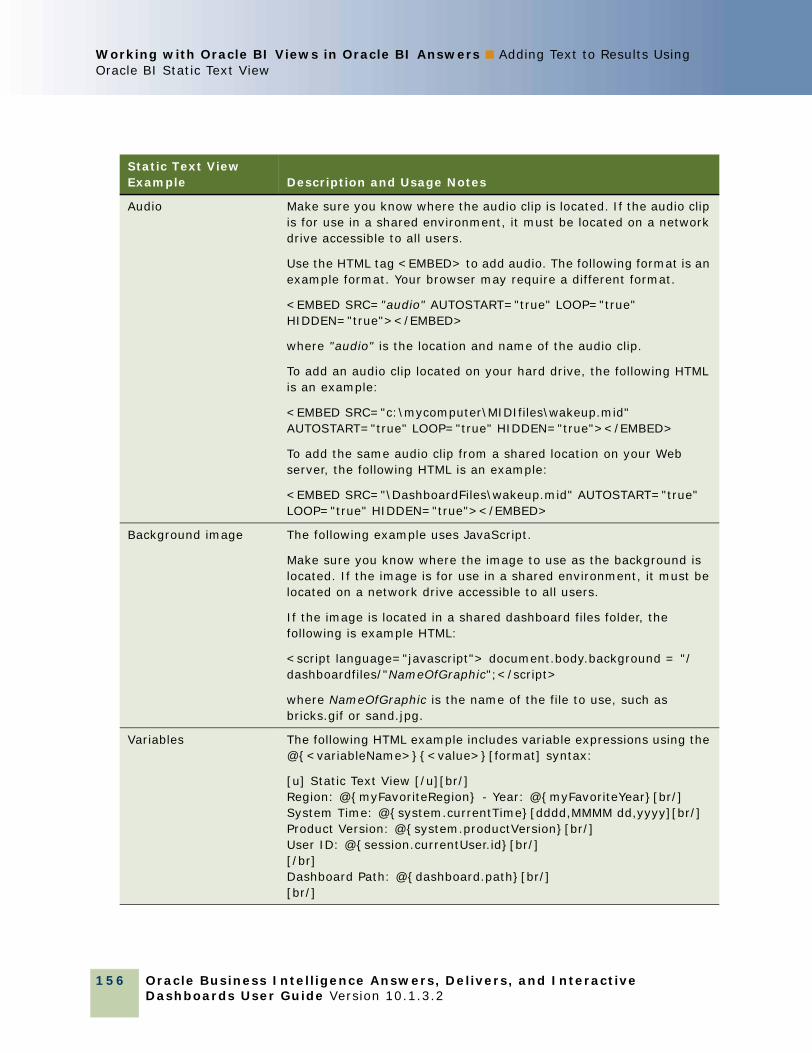
Oracle Business Intelligence Answers, Delivers, and Interactive Dashboards User Guide Version 10.1.3.2
Working with Oracle BI Views in Oracle BI Answers ■ Adding Text to Results Using Oracle BI Static Text View
156
Audio Make sure you know where the audio clip is located. If the audio clip is for use in a shared environment, it must be located on a network drive accessible to all users.
Use the HTML tag <EMBED> to add audio. The following format is an example format. Your browser may require a different format.
<EMBED SRC="audio" AUTOSTART="true" LOOP="true" HIDDEN="true"></EMBED>
where "audio" is the location and name of the audio clip.
To add an audio clip located on your hard drive, the following HTML is an example:
<EMBED SRC="c:\mycomputer\MIDIfiles\wakeup.mid" AUTOSTART="true" LOOP="true" HIDDEN="true"></EMBED>
To add the same audio clip from a shared location on your Web server, the following HTML is an example:
<EMBED SRC="\DashboardFiles\wakeup.mid" AUTOSTART="true" LOOP="true" HIDDEN="true"></EMBED>
Background image The following example uses JavaScript.
Make sure you know where the image to use as the background is located. If the image is for use in a shared environment, it must be located on a network drive accessible to all users.
If the image is located in a shared dashboard files folder, the following is example HTML:
<script language="javascript"> document.body.background = "/dashboardfiles/"NameOfGraphic";</script>
where NameOfGraphic is the name of the file to use, such as bricks.gif or sand.jpg.
Variables The following HTML example includes variable expressions using the @{<variableName>}{<value>}[format] syntax:
[u] Static Text View [/u][br/]Region: @{myFavoriteRegion} - Year: @{myFavoriteYear}[br/]System Time: @{system.currentTime}[dddd,MMMM dd,yyyy][br/]Product Version: @{system.productVersion}[br/]User ID: @{session.currentUser.id}[br/][/br]Dashboard Path: @{dashboard.path}[br/][br/]
Static Text View Example Description and Usage Notes
Working with Oracle BI Views in Oracle BI Answers ■ Alerting Users to No Data UsingOracle BI No Results View
Oracle Business Intelligence Answers, Delivers, and InteractiveDashboards User Guide Version 10.1.3.2
157
3 To apply cosmetic formatting to the font used in the static text view, click the format view button.
For information about applying cosmetic formatting, see “Applying Cosmetic Formatting to Results and Dashboards” on page 81.
4 To import the font formatting from a previously saved view, click the import formatting button and navigate to the saved view.
5 When you are done, you can save the request with the static text view.
Related Topics“Overview of Oracle BI Answers” on page 25
“Performing Common Tasks When Working with Oracle BI Views” on page 91
Alerting Users to No Data Using Oracle BI No Results ViewUse the no results view to specify explanatory text to appear if the request does not return any results. The text can help users understand that there was no data.
To add or modify an Oracle BI no results view
1 In Oracle BI Answers, create or modify the request with which you want to work, and then perform one of the following actions:
■ To add a new no results view, click the Results tab and choose Other Views > No Results from the views drop-down list.
■ To edit an existing no results view, click the Results tab, choose Compound Layout from the views drop-down list, and then click the Edit View button for the no results view.
The workspace shows the no results view.
2 Type explanatory text into the Headline and Text boxes.
3 When you are done, you can save the request with the no results view.
Related Topics“Overview of Oracle BI Answers” on page 25
“Performing Common Tasks When Working with Oracle BI Views” on page 91
Showing the Logical SQL for a Request Using Oracle BI Logical SQL ViewUse the logical SQL view to show the SQL generated for the request. This view is useful for trainers and administrators, and is usually not included in results for typical users.

Oracle Business Intelligence Answers, Delivers, and Interactive Dashboards User Guide Version 10.1.3.2
Working with Oracle BI Views in Oracle BI Answers ■ Creating Segments in Oracle’s Siebel Marketing Using Oracle BI Create Segment View
158
To add or modify an Oracle BI logical SQL view
1 In Oracle BI Answers, create or modify the request with which you want to work, and then perform one of the following actions:
■ To add a new logical SQL view, click the Results tab and choose Other Views > Logical SQL from the views drop-down list.
■ To edit an existing logical SQL view, click the Results tab, choose Compound Layout from the views drop-down list, and then click the Edit View button for the logical SQL view.
The workspace shows the logical SQL view.
2 To issue SQL directly to the Oracle BI Server, click the Issue SQL button.
The Issue SQL Directly dialog box appears, with instructions to help you issue SQL.
3 When you are done, you can save the request with the logical SQL view.
Related Topics“Overview of Oracle BI Answers” on page 25
“Performing Common Tasks When Working with Oracle BI Views” on page 91
Creating Segments in Oracle’s Siebel Marketing Using Oracle BI Create Segment ViewThe create segment view is for users of the Oracle Siebel Marketing operational application, Version 7.7 (or higher), integrated with Oracle BI.
Use the create segment view to display a Create Segment link in the results. Users can click this link to create a segment in their Oracle Siebel Marketing operational application, based on the results data.
For more information, see the online help for the Marketing Segmentation interface.
To add or modify an Oracle BI create segment view
1 In Oracle BI Answers, create or modify the request with which you want to work, and then perform one of the following actions:
■ To add a new create segment view, click the Results tab and choose Other Views > Create Segment from the views drop-down list.
■ To edit an existing create segment view, click the Results tab, choose Compound Layout from the views drop-down list, and then click the Edit View button for the create segment view.
2 When you are done, you can save the request with the create segment view.

Working with Oracle BI Views in Oracle BI Answers ■ Creating Lists of Contacts andAccounts Using Oracle BI Create Target List View
Oracle Business Intelligence Answers, Delivers, and InteractiveDashboards User Guide Version 10.1.3.2
159
Related Topics“Overview of Oracle BI Answers” on page 25
“Performing Common Tasks When Working with Oracle BI Views” on page 91
Creating Lists of Contacts and Accounts Using Oracle BI Create Target List ViewThe create target list view is for users of Oracle’s Siebel Life Sciences application integrated with Oracle’s Siebel Life Sciences Analytics applications. It allows automatic integration of lists of contacts and accounts based on the results of an Oracle BI request. For example, you can create a target list in Oracle’s Siebel Pharma Sales application and use it in Oracle’s Siebel Pharma Mobile Analytics application.
When you add a create target list view, a link named Create Target List appears in an Oracle BI report on a user’s interactive dashboard. The user can click this link to populate or refresh a list of contacts or accounts in the Life Sciences application.
NOTE: For information about populating and using this view, refer to the documentation for the Siebel Life Sciences application.
Related Topics“Overview of Oracle BI Answers” on page 25
“Performing Common Tasks When Working with Oracle BI Views” on page 91
“About Guided Navigation in Oracle BI” on page 228

Oracle Business Intelligence Answers, Delivers, and Interactive Dashboards User Guide Version 10.1.3.2
Working with Oracle BI Views in Oracle BI Answers ■ Creating Lists of Contacts and Accounts Using Oracle BI Create Target List View
160

Oracle Business Intelligence Answers, Delivers, and InteractiveDashboards User Guide Version 10.1.3.2
161
7 Using Oracle BI Delivers
This chapter provides information about using Oracle BI Delivers. It contains the following topics:
■ “Overview of Oracle BI Delivers” on page 161
■ “Accessing Oracle BI Delivers” on page 164
■ “Creating and Managing iBots Using the Oracle BI Delivers Start Page” on page 164
■ “Reviewing Oracle BI Delivers iBot Settings” on page 166
■ “Specifying Oracle BI Delivers iBot Priority, Data Visibility, and Impersonation” on page 166
■ “Selecting a Request to Trigger an Oracle BI Delivers iBot” on page 167
■ “Scheduling an Oracle BI Delivers iBot” on page 168
■ “Selecting Users to Receive an Oracle BI Delivers iBot” on page 170
■ “Specifying the Delivery Content for an iBot” on page 173
■ “Selecting Destinations for an Oracle BI Delivers iBot” on page 177
■ “Specifying Actions to Execute on Completion of an Oracle BI Delivers iBot” on page 179
■ “Viewing, Modifying, Subscribing to and Customizing Oracle BI Delivers iBots” on page 184
■ “Configuring Your Oracle BI Delivers Devices, and Delivery Profiles” on page 186
■ “Using Oracle BI Delivers Delivery Profiles” on page 188
■ “Accessing Oracle BI Alerts” on page 189
Overview of Oracle BI DeliversOracle BI Delivers is the interface used to create alerts based on analytics results. If your organization licensed this interface, you can use Oracle BI Delivers to detect specific results and immediately notify the appropriate person or group through Web, wireless, and mobile communications channels.
This section describes Oracle BI Delivers, provides information about how it works, and explains how to control access to Oracle BI Delivers. It contains the following topics:
■ “About Oracle BI Delivers” on page 162
■ “How Oracle BI Delivers Works” on page 162
■ “Controlling Access to Oracle BI Delivers” on page 163
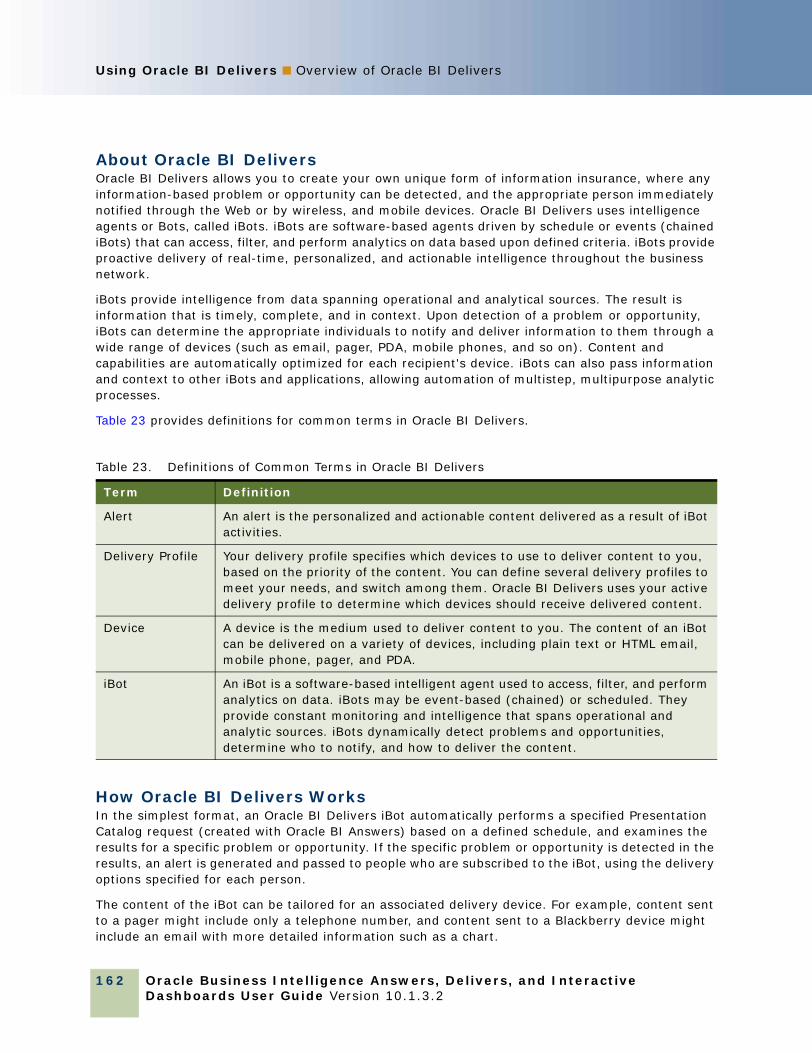
Oracle Business Intelligence Answers, Delivers, and Interactive Dashboards User Guide Version 10.1.3.2
Using Oracle BI Delivers ■ Overview of Oracle BI Delivers
162
About Oracle BI DeliversOracle BI Delivers allows you to create your own unique form of information insurance, where any information-based problem or opportunity can be detected, and the appropriate person immediately notified through the Web or by wireless, and mobile devices. Oracle BI Delivers uses intelligence agents or Bots, called iBots. iBots are software-based agents driven by schedule or events (chained iBots) that can access, filter, and perform analytics on data based upon defined criteria. iBots provide proactive delivery of real-time, personalized, and actionable intelligence throughout the business network.
iBots provide intelligence from data spanning operational and analytical sources. The result is information that is timely, complete, and in context. Upon detection of a problem or opportunity, iBots can determine the appropriate individuals to notify and deliver information to them through a wide range of devices (such as email, pager, PDA, mobile phones, and so on). Content and capabilities are automatically optimized for each recipient's device. iBots can also pass information and context to other iBots and applications, allowing automation of multistep, multipurpose analytic processes.
Table 23 provides definitions for common terms in Oracle BI Delivers.
How Oracle BI Delivers WorksIn the simplest format, an Oracle BI Delivers iBot automatically performs a specified Presentation Catalog request (created with Oracle BI Answers) based on a defined schedule, and examines the results for a specific problem or opportunity. If the specific problem or opportunity is detected in the results, an alert is generated and passed to people who are subscribed to the iBot, using the delivery options specified for each person.
The content of the iBot can be tailored for an associated delivery device. For example, content sent to a pager might include only a telephone number, and content sent to a Blackberry device might include an email with more detailed information such as a chart.
Table 23. Definitions of Common Terms in Oracle BI Delivers
Term Definition
Alert An alert is the personalized and actionable content delivered as a result of iBot activities.
Delivery Profile Your delivery profile specifies which devices to use to deliver content to you, based on the priority of the content. You can define several delivery profiles to meet your needs, and switch among them. Oracle BI Delivers uses your active delivery profile to determine which devices should receive delivered content.
Device A device is the medium used to deliver content to you. The content of an iBot can be delivered on a variety of devices, including plain text or HTML email, mobile phone, pager, and PDA.
iBot An iBot is a software-based intelligent agent used to access, filter, and perform analytics on data. iBots may be event-based (chained) or scheduled. They provide constant monitoring and intelligence that spans operational and analytic sources. iBots dynamically detect problems and opportunities, determine who to notify, and how to deliver the content.

Using Oracle BI Delivers ■ Overview of Oracle BI Delivers
Oracle Business Intelligence Answers, Delivers, and InteractiveDashboards User Guide Version 10.1.3.2
163
You may be automatically subscribed to some iBots, and iBots created by others may be available for you to subscribe to. You can also create your own iBots if you have the appropriate permissions and responsibilities. Depending on the level of authority you have, you can selectively share iBots with others or make iBots available for all users.
You can specify your account information and preferences using the My Account link (available from Oracle BI Answers, from Oracle BI Delivers, and from Oracle BI Interactive Dashboards). The Delivery Options section shows the devices and delivery profiles configured for use by Oracle BI Delivers. Oracle BI Delivers uses your active delivery profile to determine which devices should receive delivered content. You might have an In the Office delivery profile that delivers content to a Web browser and office email, and an On the Road profile that delivers content to your pager or PDA, depending on the priority of the information. You can access the My Account link to switch between available profiles as needed.
To handle more complex requirements, iBots can trigger other iBots, scripts, Java programs, or applications. Results can be passed between iBots, and to other applications or services through XML, HTML, or plain text. For example, an iBot may run a request to identify all current product orders over a specified dollar amount that cannot be filled from a regional warehouse. The results can be passed to another iBot that runs a request to locate alternative sources for these products. A final iBot may be triggered to feed information into a corporate CRM system, and notify the appropriate account representatives of the alternative sourcing.
When Oracle BI Delivers is enabled, an Alerts section is automatically added to the first page of My Dashboard if one is not manually placed there. If you want to add an Alerts section to an additional dashboard page, for more information, see the Oracle BI Interactive Dashboard Help system, or the Using Oracle BI Interactive Dashboards chapter in the Oracle Business Intelligence Answers, Delivers, and Interactive Dashboards User Guide.
For information about accessing active alerts, see “Accessing Oracle BI Alerts” on page 189.
Controlling Access to Oracle BI DeliversAccess to Oracle BI Delivers is available to all Oracle BI users (the Everyone group in Oracle BI Administration) by default. Granting access to specific Oracle BI Delivers functions is performed from the Privilege Administration page in Oracle BI Administration. If you have the appropriate authority, you can grant or deny explicit access to a variety of Oracle BI Delivers privileges, including the ability to perform the following actions:
■ Retrieve delivery destinations for iBots
■ Create iBots
■ Publish iBots for subscription
■ Deliver iBots to specified or dynamically determined users
■ Chain iBots
■ Chain iBots to custom scripts
■ See iBot instance errors
For more information about the Privilege Administration page, see Oracle Business Intelligence Presentation Services Administration Guide.
Oracle Business Intelligence Answers, Delivers, and Interactive Dashboards User Guide Version 10.1.3.2
Using Oracle BI Delivers ■ Accessing Oracle BI Delivers
164
Accessing Oracle BI DeliversThe following procedures explain how to access Oracle BI Delivers.
For an overview of Oracle BI Delivers, see “Overview of Oracle BI Delivers” on page 161.
To access Oracle BI Delivers■ Navigate to Oracle BI and click the More Products link near the top of the screen, then click
Delivers.
NOTE: If you are already in Delivers, you can display the Start page at any time by clicking the Delivers logo near the top left of the screen.
To access Oracle BI Delivers from a saved request in Oracle BI Answers■ When viewing saved requests in Oracle BI Answers, click the Create iBot link.
The Oracle BI Delivers Schedule tab appears.
■ When saving a request in Oracle BI Answers, click the Save and Schedule button.
The Oracle BI Delivers Schedule tab appears.
For more information, see “Basics of Working with Requests in Oracle BI Answers” on page 25.
Creating and Managing iBots Using the Oracle BI Delivers Start PageThe Oracle BI Delivers start page provides access to your personal and shared iBots, enables you to search for, view or modify iBots, and contains links that allow you to perform the following actions:
■ Create a new iBot.
■ Edit your delivery profile.
■ Review iBots that you own, or are the recipient of.
NOTE: What you see in Oracle BI Delivers depends on the permissions granted to your user ID, so you may not see all of the preceding links on your Oracle BI Delivers start page.
The start page has two main areas:
■ Selection pane. The selection pane is located on the left side of the page. It shows Delivers content saved in the Presentation Catalog, such as personal and shared iBots.
■ Workspace. The workspace is located to the right of the selection pane. It initially shows the iBot links that you can work with to create and manage your iBots.
When you make a selection from the selection pane, such as clicking a saved iBot, your selection appears in the workspace so you can work with it. When you click an iBot link in the workspace, the workspace displays tabs for working with iBots. The tabs will not appear for iBots selected from the Shared iBots folder, unless you are the Web Administrator, or have been granted permissions to modify the iBot.
Using Oracle BI Delivers ■ Creating and Managing iBots Using the Oracle BI Delivers StartPage
Oracle Business Intelligence Answers, Delivers, and InteractiveDashboards User Guide Version 10.1.3.2
165
For an overview of Oracle BI Delivers, see “Overview of Oracle BI Delivers” on page 161.
To search for iBots
1 Enter your search details into the Search field.
You can enter complete or partial iBot name details into the Search field, for example:
■ enter * to display all iBots
■ enter AB to display iBots with names that include the letters AB, aB, Ab, and ab
2 Click the Search button.
A list of the iBots acting on your behalf (that match the search criteria), is displayed.
3 To see the properties of an iBot, or to open it, click its link.
4 Use the following options:
■ Click View to view the properties of an iBot.
■ Click Modify to modify the properties of an iBot.
NOTE: If you navigate to a folder in the selection pane before using the Search field, your search is restricted to the iBots in that folder and sub-folders. However, if you are displaying the Delivers Start page, the search spans all iBots acting on your behalf.
NOTE: Searches are case insensitive.
NOTE: If you use a backslash character (\) in an iBot name (for example Na\me), the search string used to find it must contain an additional backslash (called an escape character). For example, an iBot called Na\me would require the search string Na\\me, to retrieve details for that iBot. Without the additional backslash an error message is displayed.
To work with Delivers content saved in the Presentation Catalog
1 Locate the item in the selection pane and click it.
If you select an iBot, it opens in the workspace, if you select a request Delivers creates a new iBot based on the request.
2 To change a property, click its link.
To create a new iBot
1 Click the link Create New iBot.
The Overview tab appears, with default properties for the iBot.
2 To change a property, click its link.
Oracle Business Intelligence Answers, Delivers, and Interactive Dashboards User Guide Version 10.1.3.2
Using Oracle BI Delivers ■ Reviewing Oracle BI Delivers iBot Settings
166
To edit your delivery profile■ Click the link Edit My Account.
For complete information, see “Configuring Your Oracle BI Delivers Devices, and Delivery Profiles” on page 186.
To review iBots that you own, or are the recipient of
1 Click the link Show iBots Acting on My Behalf.
A list of iBots that you own, or are the recipient of, appears.
2 To open the iBot, click this link.
NOTE: You can also click the folders My iBots or Shared iBots to view the iBots acting on your behalf.
To return to the Oracle BI Delivers start page from anywhere within Oracle BI■ Click the More Products link, then click Delivers.
Reviewing Oracle BI Delivers iBot SettingsUse the Overview tab to view a summary of the current settings for the selected iBot.
For an overview of Oracle BI Delivers, see “Overview of Oracle BI Delivers” on page 161.
To see detailed information about a current iBot setting■ Click the setting for which you want to view more detailed information.
The display changes to show you the appropriate information.
Specifying Oracle BI Delivers iBot Priority, Data Visibility, and ImpersonationUse the General tab to specify the priority of the iBot and how to send the delivery content.
You can set the priority to low, normal, or high. The priority works with the delivery profile for a user to determine the destination for alerts of different priorities.
The following data visibility options affect the personalization of the delivery content:

Using Oracle BI Delivers ■ Selecting a Request to Trigger an Oracle BI Delivers iBot
Oracle Business Intelligence Answers, Delivers, and InteractiveDashboards User Guide Version 10.1.3.2
167
■ Personalized (individual data visibility)
This option uses the data visibility of each recipient to customize iBot delivery content for each recipient. This setting does not use the Run As field.
NOTE: For requests, to have entries in the Oracle BI Server cache created for each user, choose this option. For more information, see “About System Services for the Oracle BI Delivers iBot” on page 178.
■ Not personalized (use the Run As user's data visibility)
This option sends the iBot's delivery content to the specified recipients. All users receive the same content as if they were the user specified in the Run As field.
This option is available only to users defined as Oracle BI Web administrators with at least one of the following privileges set in Oracle BI Web Administration:
■ Publish iBots for subscription
■ Deliver iBots to specific or dynamically determined users
■ Not personalized (use iBot owner’s data visibility)
This option sends the iBot’s delivery content to the specified recipients using the data visibility of the user who created the iBot. All users receive the same content as if they were the iBot owner.
This option is available to users that have at least one of the privileges listed previously, but does not require you to be defined as an Oracle BI Web administrator.
For an overview of Oracle BI Delivers, see “Overview of Oracle BI Delivers” on page 161.
To specify the priority of the iBot and how to send the delivery content
1 Select the priority from the Priority drop-down list.
2 Select the data visibility from the Data Visibility drop-down list.
If you select the Not personalized option, specify the user ID to act as the Run As user.
Selecting a Request to Trigger an Oracle BI Delivers iBotUse the Conditional Request tab to select a request to trigger the iBot. You can further refine the request by re-opening it in Oracle BI Answers and using subqueries.
The results of the request determine whether the iBot sends its delivery content and initiates any subsequent actions:
■ If the request does not return any rows, the iBot is not triggered.
■ If the request returns at least one row, the iBot sends its delivery content and initiates any subsequent actions.

Oracle Business Intelligence Answers, Delivers, and Interactive Dashboards User Guide Version 10.1.3.2
Using Oracle BI Delivers ■ Scheduling an Oracle BI Delivers iBot
168
You can chain requests together to create complex conditional logic. For example, you might have a request that determines what the ten best-selling products were last year, and a second request that determines, for these products, the change in sales this year in each region, and then reports any products with a negative change.
For an overview of Oracle BI Delivers, see “Overview of Oracle BI Delivers” on page 161.
To select the request■ Click the Select Condition... button to select the request, and then complete the dialog box that
appears.
Scheduling an Oracle BI Delivers iBotUse the Schedule tab to determine when the iBot runs, how often it runs, and when to discontinue running it.
iBots can execute based on a specified schedule. You can define a starting date and time for the iBot, a recurrence schedule, and an ending date.
You can also create a nonscheduled iBot. This is useful when you want to create an iBot that runs only as part of an iBot chain, or an iBot that is initiated by an external process.
For an overview of Oracle BI Delivers, see “Overview of Oracle BI Delivers” on page 161.
To create an iBot with no schedule■ Click the Set schedule option to remove the check mark.
To start the iBot now
1 Click the Set schedule option to show the check mark.
2 Click the Start Immediately radio button.
3 Click the Save this iBot button.
To start the iBot at a specified date and time
1 Enter the date in the Start Date box (or click the calendar icon to select a date).
Acceptable date format options are:
■ For any locale:
❏ yyyy-mm-dd
■ For a specific locale:
❏ mm-dd-yy or mm/dd/yy (e.g. when the locale is set to US)
❏ dd-mm-yy and dd/mm/yy (e.g. when the locale is set to UK)

Using Oracle BI Delivers ■ Scheduling an Oracle BI Delivers iBot
Oracle Business Intelligence Answers, Delivers, and InteractiveDashboards User Guide Version 10.1.3.2
169
2 (Optional) Enter a starting time.
3 (Optional) Select the time zone to determine when the iBot starts.
NOTE: The dates and times you specify are determined by the time zone you select in the Set Time Zone field. The location (time zone) of the machine where the Oracle Business Intelligence Scheduler is located is not relevant.
To execute the iBot multiple times within a day
1 Click the Repeat every check box.
2 Enter the interval between executions (in minutes), and the time to stop the repetition.
3 In the Recurrence section, click the Daily radio button, and specify Every 1 day(s).
To execute the iBot one time only■ Click the Once option Run once (or on one day if repeating).
This is the default option.
If the iBot has already run, this option enables you to specify that the iBot will only run once more on the specified time or day.
To execute the iBot on a daily schedule■ Click the Daily option and specify the daily interval, such as every 3 days.
To execute the iBot on a weekly schedule
1 Click the Weekly option and specify the weekly interval, such as every 1 week.
2 Select the days of the week when the iBot should run, such as Monday through Friday.
To execute the iBot on a monthly schedule
1 Click the Monthly option and specify either the day of the month or the day occurrence, such as the first Tuesday.
2 Select the desired months.
To select an ending date■ Click the End by option and enter a date, or select a date from the calendar.
By default, no ending date is specified.
Oracle Business Intelligence Answers, Delivers, and Interactive Dashboards User Guide Version 10.1.3.2
Using Oracle BI Delivers ■ Selecting Users to Receive an Oracle BI Delivers iBot
170
Selecting Users to Receive an Oracle BI Delivers iBotUse the Recipients tab to select the users and groups to receive the delivery content of the iBot.
NOTE: If you select the option to allow the recipients to be determined from the results of a conditional request and choose to show only relevant rows to each user, Oracle BI Delivers assumes that you want the results of the conditional request set as the delivery content in the Delivery Content tab. If the content has been set to something else in the Delivery Content tab (through clicking the Clear or Select Content buttons), a message appears. The message asks if you want to update the delivery content to be the results of the conditional request. Click Yes to proceed and update the delivery content, or No to retain the current delivery content. If you click No, the recipients will still be determined from the conditional request, but users will receive all content, and not just the content that pertains to them.
For an overview of Oracle BI Delivers, see “Overview of Oracle BI Delivers” on page 161.
For details about how to organize your iBots by saving them in an existing folder, or in a new folder that you create, see “Using the Save iBot Dialog Box to organize your iBots” on page 172.
To send the delivery content to the creator of the iBot■ Click the Me option.
To send the delivery content to multiple users
1 Click the A specific list of recipients option.
2 Click the Choose recipients button to open the Select Recipients dialog box and specify the eligible users and groups.
For more information, see “Using the Select Recipients Dialog Box” on page 172.
To allow users to subscribe to the iBot
1 Click the following option:
Publish for subscription.
2 Click the Select button to open the Select Subscribers dialog box and specify the eligible users and groups.
For more information, see “Using the Select Recipients Dialog Box” on page 172.
NOTE: When you select the Publish for subscription option, the Allow subscribers to customize iBot option is enabled.
NOTE: You can only publish iBots that have content that can be shared.

Using Oracle BI Delivers ■ Selecting Users to Receive an Oracle BI Delivers iBot
Oracle Business Intelligence Answers, Delivers, and InteractiveDashboards User Guide Version 10.1.3.2
171
To allow the recipients to be determined dynamically from the results of a conditional request
1 Click the following option:
Determine recipients from conditional request
2 To identify the column that contains the desired recipients, make a selection from the Column Containing Recipients drop-down list.
You can also specify a second column from the request.
3 To send a subset of the data in the delivery content, click the following option:
Show relevant rows only
For example, if a request runs, and only a subset of rows in the result pertains to a single user, only those rows are delivered.
NOTE: This option is only enabled if the iBot contains a conditional request.
To allow subscribers to customize the iBot
1 Click the following option:
Publish for subscription.
2 Click the Select button to open the Select Recipients dialog box and specify the eligible users and groups.
For more information, see “Using the Select Recipients Dialog Box” on page 172.
NOTE: When you select the Publish for subscription option, the Allow subscribers to customize iBot option is enabled.
3 Click the following option:
Allow subscribers to customize iBot.
This option enables subscribers to supply filter values for prompted filters for columns in an iBot. For more information, see “Customizing Your Oracle BI Delivers iBot Subscriptions” on page 185.
This option is only available when you click the Publish for subscription option.
NOTE: In order for a request to be customizable, it needs to be configured to have a prompt. For more information, see the Oracle BI Answers help system.
To disallow users from subscribing to the iBot■ Click the following option to remove the check mark:
Publish for subscription.
NOTE: When you clear the Publish for subscription option, any selected subscribers are disabled, and the Allow subscribers to customize iBot option is cleared and disabled.
Oracle Business Intelligence Answers, Delivers, and Interactive Dashboards User Guide Version 10.1.3.2
Using Oracle BI Delivers ■ Selecting Users to Receive an Oracle BI Delivers iBot
172
To unsubscribe users to the iBot
1 Click the Modify button in the Current Subscribers area.
NOTE: The Modify button is available only to Web Administrators and users with the privilege Modify current subscriptions for iBots.
The Modify Subscribers dialog box appears.
2 Select the users to unsubscribe, click the delete button, and then click OK.
TIP: You can select multiple users by holding down the SHIFT or CTRL keys and selecting adjacent or nonadjacent users.
Using the Select Recipients Dialog BoxThe Select Recipients dialog box shows any currently selected recipients and available recipients.
NOTE: This dialog box is also displayed as the Select Subscribers dialog box when it is used to select subscribers.
NOTE: When a user subscribes to and customizes an iBot, if you then select the same user as a recipient, the user’s customizations will be lost when the iBot is next run.
To use the Select Recipients dialog box
1 To view recipients by groups, or by users and groups, make a selection from the drop-down list.
2 Click a user or group to select it, and then click the Select Recipients arrow button to move it into the list of recipients.
You can select multiple recipients by holding down the SHIFT or CTRL keys and selecting adjacent or nonadjacent recipients.
3 To remove a recipient, click a user or group to select it, and then click the Remove Recipients button.
You can use the SHIFT and CTRL keys to select multiple groups or users.
4 Click OK.
Using the Save iBot Dialog Box to organize your iBotsThe Save iBot dialog box enables you to organize your iBots by saving them in an existing folder, or in new folders that you create. You can use the Save iBot dialog box to create a folder hierarchy in which to save your iBots.
To save an iBot in an existing folder
1 Click one of the following options to display the Save iBot dialog box:
■ For a new iBot, click the Save this iBot button.
■ For an existing iBot, click the Save this iBot as button.
Using Oracle BI Delivers ■ Specifying the Delivery Content for an iBot
Oracle Business Intelligence Answers, Delivers, and InteractiveDashboards User Guide Version 10.1.3.2
173
2 Navigate to a folder in which to save (or copy) the iBot.
3 Enter a name and description for the iBot.
4 Click OK to save the iBot (or copy the iBot) in the selected folder.
To save an iBot in a new folder that you create
1 Click one of the following options to display the Save iBot dialog box:
■ For a new iBot, click the Save this iBot button.
■ For an existing iBot, click the Save this iBot as button.
2 Navigate to a folder in which to create a new folder.
The new folder will be created under the /Shared iBots or the /My iBots root folder, depending on whether the iBot is available for subscription, as follows:
■ If an iBot is available for subscription, the new folder can only be created under /Shared iBots.
For example, if a user adds a new folder called Sales, the iBot is stored in the new folder /Shared iBots/Sales
■ If an iBot is not available for subscription, the new folder can only be created under /My iBots.
For example, if a user adds a new folder called Sales, the iBot is stored in the new folder /My iBots/Sales
For more information about subscribing to iBots, see “Viewing, Modifying, Subscribing to and Customizing Oracle BI Delivers iBots” on page 184.
3 Enter a name and description for the iBot.
4 Click the Create Folder button to create a new folder under the current folder.
5 Enter a name for the new folder and click OK.
6 Click OK to save the iBot (or copy the iBot) in the new folder.
NOTE: When you click the Save this iBot button (for an existing iBot), the iBot is saved but the Save iBot dialog box is not displayed. However, the Save iBot dialog box is displayed if the subscription status is changed, and the iBot has not been saved. For more information, see “Viewing, Modifying, Subscribing to and Customizing Oracle BI Delivers iBots” on page 184.
Specifying the Delivery Content for an iBotUse the Delivery Content tab to specify the type of content to deliver with the iBot, such as a dashboard page or a saved request. You can also specify the delivery format for the content, such as HTML, PDF, XLS, CSV, or text.

Oracle Business Intelligence Answers, Delivers, and Interactive Dashboards User Guide Version 10.1.3.2
Using Oracle BI Delivers ■ Specifying the Delivery Content for an iBot
174
You can include a short, descriptive headline to include with the content. The headline appears as the subject when the iBot is delivered. You can add a text message to provide context for an iBot attachment. You can also personalize a headline or text message by using a repository variable, a session variable, or a presentation variable.
If the delivery content is blank (no records are returned), you can add an explanation for this condition (only applies for conditional requests).
This section contains the following topics:
■ “Delivery Content Choices for an iBot” on page 174
■ “Delivery Format Options for iBot Delivery Content” on page 174
■ “Procedures for Working with the Delivery Content Tab” on page 175
For an overview of Oracle BI Delivers, see “Overview of Oracle BI Delivers” on page 161.
Delivery Content Choices for an iBotYou can specify the following delivery content choices for an iBot:
■ The results of the conditional request.
NOTE: If you attempt to clear the content or select different delivery content, and you have selected the option to show only relevant rows to each user on the Recipients tab, a message appears. The message alerts you that the option to show relevant rows will be reset if you proceed with clearing the content or selecting different delivery content. Click Yes to proceed, or No to retain the current delivery content selection. If you click Yes, the recipients will still be determined from the conditional request, but users will receive all content, and not just the content that pertains to them.
■ A narrative text description of the conditional request (only displays when a conditional request exists).
■ Dashboard pages from My Dashboard.
■ Dashboard pages from public (shared) dashboards.
■ Briefing Books.
■ Saved requests (shared and private).
■ Disconnected Applications Dataset.
Delivery Format Options for iBot Delivery ContentThe format options for included content depend upon the type on delivery content you select. The format options are listed in the Send Content As drop-down list. Not every type of content has all format options.
■ Device default
Oracle BI Delivers will use the device default to determine the content format.
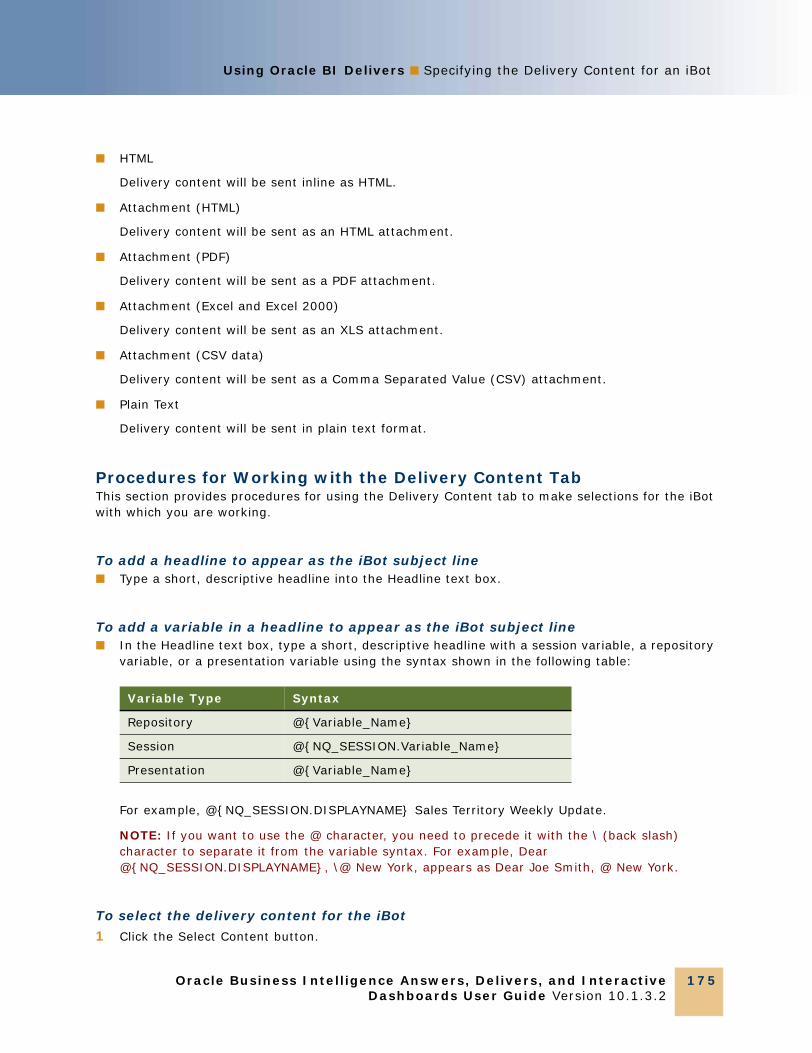
Using Oracle BI Delivers ■ Specifying the Delivery Content for an iBot
Oracle Business Intelligence Answers, Delivers, and InteractiveDashboards User Guide Version 10.1.3.2
175
■ HTML
Delivery content will be sent inline as HTML.
■ Attachment (HTML)
Delivery content will be sent as an HTML attachment.
■ Attachment (PDF)
Delivery content will be sent as a PDF attachment.
■ Attachment (Excel and Excel 2000)
Delivery content will be sent as an XLS attachment.
■ Attachment (CSV data)
Delivery content will be sent as a Comma Separated Value (CSV) attachment.
■ Plain Text
Delivery content will be sent in plain text format.
Procedures for Working with the Delivery Content TabThis section provides procedures for using the Delivery Content tab to make selections for the iBot with which you are working.
To add a headline to appear as the iBot subject line■ Type a short, descriptive headline into the Headline text box.
To add a variable in a headline to appear as the iBot subject line■ In the Headline text box, type a short, descriptive headline with a session variable, a repository
variable, or a presentation variable using the syntax shown in the following table:
For example, @{NQ_SESSION.DISPLAYNAME} Sales Territory Weekly Update.
NOTE: If you want to use the @ character, you need to precede it with the \ (back slash) character to separate it from the variable syntax. For example, Dear @{NQ_SESSION.DISPLAYNAME}, \@ New York, appears as Dear Joe Smith, @ New York.
To select the delivery content for the iBot
1 Click the Select Content button.
Variable Type Syntax
Repository @{Variable_Name}
Session @{NQ_SESSION.Variable_Name}
Presentation @{Variable_Name}

Oracle Business Intelligence Answers, Delivers, and Interactive Dashboards User Guide Version 10.1.3.2
Using Oracle BI Delivers ■ Specifying the Delivery Content for an iBot
176
2 At the Choose Delivery Content dialog box, select the delivery content and click OK.
For more information, see “Delivery Content Choices for an iBot” on page 174.
3 Choose a format for the delivery content from the Send content as drop-down list.
For more information, see “Delivery Format Options for iBot Delivery Content” on page 174.
To remove the delivery content for the iBot■ Click the Clear Content button.
To add a text message to provide context for the iBot attachment
1 Click the following option:
If sent as attachment, include this text
2 Type the text into the text box.
To add a variable in a text message to provide context for the iBot attachment
1 Click the following option:
If sent as attachment, include this text
2 Type the text into the text box with a session variable, a repository variable, or a presentation variable using the syntax shown in the following table:
For example, Dear, @{NQ_SESSION.Variable_Name}, here is your personalized Weekly Sales Territory Update.
NOTE: If you want to use the @ character, you need to precede it with the \ (back slash) character to separate it from the variable syntax. For example, Dear @{NQ_SESSION.DISPLAYNAME}, \@ New York, appears as Dear Joe Smith, @ New York.
To specify a text message to deliver to recipients when there is no iBot content to deliver to them
1 Click the following option:
Deliver this message when no records are returned by the conditional request.
Variable Type Syntax
Repository @{Variable_Name}
Session @{NQ_SESSION.Variable_Name}
Presentation @{Variable_Name}

Using Oracle BI Delivers ■ Selecting Destinations for an Oracle BI Delivers iBot
Oracle Business Intelligence Answers, Delivers, and InteractiveDashboards User Guide Version 10.1.3.2
177
2 Type the text into the text box.
NOTE: You should enter text to be delivered to recipients when there is no iBot content to deliver to them. This might be all recipients, if the iBot is configured to run all requests as a specific user in the General tab. This can help these recipients understand that there was no data for them and that the iBot did not fail. For example, if an alert informed recipients about all sales over $1million, recipients might also want to know if there were no sales over $1million for a particular month.
To add a variable in a text message for no iBot content
1 Click the following option:
Deliver this message when no records are returned
2 Type the text into the text box with a session variable, a repository variable, or a presentation variable using the syntax shown in the following table:
For example, Dear, @{NQ_SESSION.Variable_Name}, your Weekly Sales Territory Update contains no data this week.
NOTE: If you want to use the @ character, you need to precede it with the \ (back slash) character to separate it from the variable syntax. For example, Dear @{NQ_SESSION.DISPLAYNAME}, \@ New York, appears as Dear Joe Smith, @ New York.
Selecting Destinations for an Oracle BI Delivers iBotUse the Destinations tab to specify a range of desired devices and destinations for iBots. This section contains the following topics:
■ “About User Destinations for the Oracle BI Delivers iBot” on page 178
■ “About Specific Devices for the Oracle BI Delivers iBot” on page 178
■ “About System Services for the Oracle BI Delivers iBot” on page 178
For an overview of Oracle BI Delivers, see “Overview of Oracle BI Delivers” on page 161.
To specify devices and destinations for the iBot■ Click on a check box next to a device or destination to select it for the iBot.
Variable Type Syntax
Repository @{Variable_Name}
Session @{NQ_SESSION.Variable_Name}
Presentation @{Variable_Name}
Oracle Business Intelligence Answers, Delivers, and Interactive Dashboards User Guide Version 10.1.3.2
Using Oracle BI Delivers ■ Selecting Destinations for an Oracle BI Delivers iBot
178
About User Destinations for the Oracle BI Delivers iBotThis section describes the user destinations available for the iBot on the Destinations page.
■ Interactive Dashboard
Active iBots will appear in a Dashboard Alerts section as well as on the Alerts! page. A link to this summary appears together with the application navigation links when new iBots are delivered. After these are cleared on the Alerts page, the alert link is removed.
■ Active Delivery Profile
iBots will be sent to specified devices in the active delivery profile. The active delivery profile is configured through the My Account page. For more information, see “Configuring Your Oracle BI Delivers Devices, and Delivery Profiles” on page 186.
About Specific Devices for the Oracle BI Delivers iBotIf you select a specific device on the Destinations page, the default device selected on the My Account page will override the devices set in the active delivery profile for a user. Devices specified on the Destinations page act as additions to the active delivery profile. An iBot, for example, need not be dependent upon a user’s configuration. The iBot could just be configured to use device information from default devices in the Devices area in the My Account page.
For more information about active delivery profiles and Devices, see “Configuring Your Oracle BI Delivers Devices, and Delivery Profiles” on page 186.
These are the available devices:
■ Pager
■ Digital Phone
■ Handheld Device
■ Other Device
About System Services for the Oracle BI Delivers iBotThis section describes the system services available for administrators on the Destinations page.

Using Oracle BI Delivers ■ Specifying Actions to Execute on Completion of an Oracle BIDelivers iBot
Oracle Business Intelligence Answers, Delivers, and InteractiveDashboards User Guide Version 10.1.3.2
179
■ Oracle BI Server Cache
This is used for seeding cache.
Oracle BI administrators can create Server cache for individual users. The cache seeding operation allows administrators to run requests on dashboard pages or requests stored in the Presentation Catalog, and create a Server cache. This speeds up response time for users when they actually run the requests on the dashboards. If data already exists in the cache for a given request, the data is deleted and refreshed when the iBot runs.
The cache for the request or the dashboard page is created at the appropriate schedule for the indicated set of users.
NOTE: To have the cache created for each user, choose the Personalized option for data visibility at the General tab.
You would typically not select any other destination for this kind of request.
■ Disconnected Application Cache
This setting is for organizations that have licensed Disconnected Analytics or a disconnected application such as Oracle’s Siebel Pharma Mobile Analytics. It is related to the preprocessed synchronization mode in Disconnected Analytics applications.
You can create server datasets for users of disconnected applications, so that when they synchronize their applications, the data downloads are faster.
The preprocessed synchronization mode is the recommended data download mode for users. It avoids the potential overhead that can occur from running data creation requests in online mode during normal business hours and reduces wait time for the download. Preprocessed data is stored under each user's directory on the machine running Oracle BI Web. If you decide to use this mode to schedule data cache creation, make sure that adequate disk space is available. For more information about Oracle Disconnected Analytics, see Oracle Business Intelligence Server Administration Guide.
NOTE: To have the disconnected application cache created for each user, choose the Personalized (individual data visibility) option for Data Visibility at the General tab. (Nonpersonalized data is not used for Disconnected Analytics users.)
You would typically not select any other destination for this kind of request.
Specifying Actions to Execute on Completion of an Oracle BI Delivers iBotUse the Advanced tab to specify one or more actions to execute when the iBot completes. Actions will be executed on behalf of each user who is a recipient of the iBot. You can change the default behavior for each iBot action. Actions include the execution of other iBots, custom scripts, custom Java programs or Workflows defined using the Oracle’s Siebel Workflow Version 7.7 (or higher) application. You can also specify actions to execute either when iBot conditions are satisfied, or when no records are returned.
NOTE: By default only Oracle BI administrators have the necessary privileges to specify all of these actions. Users that are not administrators can only specify the execution of other iBots action.
Oracle Business Intelligence Answers, Delivers, and Interactive Dashboards User Guide Version 10.1.3.2
Using Oracle BI Delivers ■ Specifying Actions to Execute on Completion of an Oracle BI Delivers iBot
180
Added actions are shown with a Properties button that you can click to view or modify properties, and a Delete button that you can click to delete actions.
This section contains the following topics:
■ “About iBot Action Properties” on page 180
■ “About Custom Script Action Properties” on page 181
■ “About Workflow Action Properties” on page 181
■ “About Custom Java Program Action Properties” on page 181
■ “Procedures for Specifying Actions to Execute on Completion of an Oracle BI Delivers iBot” on page 182
For an overview of Oracle BI Delivers, see “Overview of Oracle BI Delivers” on page 161.
About iBot Action PropertiesYou can specify the next iBot to run when the current iBot completes.
To enter details into the Path field, you use the Browse button to display the Select iBot dialog box, and you select the iBot that you want to run.
The following options are the choices for the scope of recipients from the Execute for Recipients drop-down list.
■ Of specified iBot
Select this option to use the iBot referenced in this dialog.
■ Of current iBot
Select this option to use the current iBot containing subsequent actions.
■ Of both specified and current iBot
Select this option to use the union of both iBots.
■ Common to specified and current iBot
Select this option to use the intersection of both iBots.
■ Of specific iBot, but not current iBot
Select this option to use the referenced iBot and exclude recipients from the current iBot.
If you have filters from originating iBots applied to subsequent iBots, filter values are generated by the conditional request specified at the Conditional Request tab. The iBot specified at the Advanced tab will execute once for each row in the conditional report, with filters generated by the values in that row.
Using Oracle BI Delivers ■ Specifying Actions to Execute on Completion of an Oracle BIDelivers iBot
Oracle Business Intelligence Answers, Delivers, and InteractiveDashboards User Guide Version 10.1.3.2
181
About Custom Script Action PropertiesYou can specify the filename of a custom script to execute (on Microsoft Windows) when the current iBot completes. The custom script file must reside on the same server as the Oracle BI Delivers server (the Scheduler). The custom script type can be either Javascript or VBScript. By default, only Oracle BI administrators have the necessary privileges to configure Custom scripts. For information about the procedures to configure this capability, see Oracle Business Intelligence Scheduler Guide.
You can select options for whether results are passed to the script, as well as desired formats. You can also manually add additional parameters.
Depending upon the type of content to be passed (from either the conditional request or the delivery content), results may be passed in some of the following formats:
■ MHTML (MIME HTML used in email)
■ XML (extensible markup language)
■ Plain Text
■ CSV (comma separated values)
■ PDF (portable document format)
About Workflow Action PropertiesYou can configure iBots to trigger workflows in Oracle’s Siebel Workflow Version 7.7 (or higher) application. By default, only Oracle BI administrators have the necessary privileges to configure iBots to trigger workflows. For information about the procedures to configure this capability, see Oracle Business Intelligence Scheduler Guide.
Dynamic properties are generated by the conditional request specified at the Conditional Request tab. The Workflow will be initiated once for each row in the conditional request, with dynamic properties generated from the values in that row. You can also choose a column from a conditional request.
About Custom Java Program Action PropertiesYou can specify a custom Java program to execute (on Windows and UNIX) when the current iBot completes. By default, only Oracle BI administrators have the necessary privileges to configure Custom Java programs. For information about the procedures to configure this capability, see Oracle Business Intelligence Scheduler Guide.
You can select options for whether results are passed to the Java program, as well as desired formats. You can also manually add additional parameters.
Depending upon the type of content to be passed (from either the conditional request or the delivery content), results may be passed in some of the following formats:
■ MHTML (MIME HTML used in email)
■ XML (extensible markup language)
■ Plain Text
■ CSV (comma separated values)
Oracle Business Intelligence Answers, Delivers, and Interactive Dashboards User Guide Version 10.1.3.2
Using Oracle BI Delivers ■ Specifying Actions to Execute on Completion of an Oracle BI Delivers iBot
182
■ PDF (portable document format)
Procedures for Specifying Actions to Execute on Completion of an Oracle BI Delivers iBotThis section provides procedures for specifying the action to execute when an iBot completes.
To select the next iBot to run when the current iBot completes
1 Click the Add Action button and choose iBot.
2 Click the Browse button to select the next iBot to run.
3 Choose the scope of recipients from the Execute for Recipients drop-down list.
For more information, see “About iBot Action Properties” on page 180.
4 To specify that filters in the current iBot be applied to the next iBot, click the following option:
Propagate filters from parent
NOTE: This step applies only if the content you select contains filters.
5 To add additional filters, click the Add button.
To remove all additional filters, click the Clear button.
To specify a custom script to execute when the current iBot completes
1 Click the Add Action button and choose Custom Script.
The Custom Script Properties dialog box opens.
2 Type the path to the script in the Filename text box.
NOTE: The script must reside on the same server as the Oracle BI Delivers server (the Scheduler).
3 Choose the script type from the Type drop-down list.
4 In the Results area, make your selections for whether results are passed to the script, and if applicable, the format in which to pass results.
5 To add additional parameters manually, click the Add button.
6 To remove all entered parameters, click the Clear button.
7 Click OK.
To specify a Workflow to execute
1 Click the Add Action button and choose Workflow.
The Workflow Properties dialog box appears.

Using Oracle BI Delivers ■ Specifying Actions to Execute on Completion of an Oracle BIDelivers iBot
Oracle Business Intelligence Answers, Delivers, and InteractiveDashboards User Guide Version 10.1.3.2
183
2 Type the name of the Workflow in the Workflow Name field.
NOTE: Specify a Workflow defined using Oracle’s Siebel Workflow Version 7.7 (or higher) application.
3 To pass Name and Value pairs to the Workflow, enter them in the Static Properties section.
4 Click the Add button to add additional static properties.
To remove all added static properties, click the Clear button.
5 Enter the appropriate dynamic values in the Dynamic Properties section.
6 To add multiple dynamic properties, click the Add button.
7 To remove all added dynamic properties, click the Clear button.
8 To choose a column from a conditional request, select it from the Value Column drop-down list.
9 Click OK.
To specify a custom Java program to execute when the current iBot completes
1 Click the Add Action button and choose Custom Java Program.
The Custom Java Program Properties dialog box appears.
2 Type the fully qualified implementation class for the Java program action into the Class Name field.
For example:
■ MyCompany.Application.Class1
3 Type the name of the jar file containing the Java program in the Class Path field.
NOTE: The path is restricted to the name of the jar file. You cannot specify a relative or absolute path.
NOTE: The Jar file must be in the default user Jar file path, as specified for the Oracle BI JavaHost. For more information, see the Oracle Business Intelligence Scheduler Guide.
4 Type the names of other jar files (containing utility classes and libraries that the Java program requires to run) in the Additional Class Path(s) field.
NOTE: Additional paths are restricted to the names of the jar files. You cannot specify relative or absolute paths.
NOTE: If more than one additional Jar file is specified, separate each using a semi colon character (;).
5 In the Results area, make your selections for whether results are passed to the Java program, and if applicable, the format in which to pass results.
6 To add additional parameter values manually, enter the details and click the Add button.
7 To remove all entered parameters, click the Clear button.
8 Click OK to add the custom Java program to the iBot.
Oracle Business Intelligence Answers, Delivers, and Interactive Dashboards User Guide Version 10.1.3.2
Using Oracle BI Delivers ■ Viewing, Modifying, Subscribing to and Customizing Oracle BI Delivers iBots
184
Viewing, Modifying, Subscribing to and Customizing Oracle BI Delivers iBotsThis section contains the following topics:
■ “Viewing and modifying the Oracle BI Delivers iBots Acting on Your Behalf” on page 184
■ “Subscribing to Oracle BI Delivers iBots” on page 185
■ “Customizing Your Oracle BI Delivers iBot Subscriptions” on page 185
For an overview of Oracle BI Delivers, see “Overview of Oracle BI Delivers” on page 161.
Viewing and modifying the Oracle BI Delivers iBots Acting on Your BehalfYou can view the iBots that you own or are a recipient of by clicking the Show iBots Acting on My Behalf link on the Delivers Start page, or by navigating folders in the selection pane. You can also view more information about an iBot and modify its properties.
NOTE: You can also search for iBots by entering a search string in the Search field and clicking the Search button. Delivers displays the search results in the workspace where you can subsequently view or modify iBot properties. For more information, see “To search for iBots” on page 165.
To view the iBots acting on your behalf■ Navigate to Oracle BI Delivers and click the Show iBots Acting on My Behalf link.
A summary list appears in the workspace, displaying details of the iBots you own or are a recipient of. For more information, see “Creating and Managing iBots Using the Oracle BI Delivers Start Page” on page 164.
■ Navigate to Oracle BI Delivers and click a folder under My iBots or Shared iBots in the selection pane at the Oracle BI Delivers start page.
A list of iBots appears in the workspace, showing your iBot subscription list for the selected folder. You can subscribe or unsubscribe to shared iBots using the links displayed in the list for the Shared iBots folder (for more information, see “Subscribing to Oracle BI Delivers iBots” on page 185).
To view more information about an iBot from a list of iBots
1 Click the name of the iBot.
Information about the iBot appears in a new window. The Overview tab shows summary information for the iBot.
2 To see more detailed information about the iBot, click the appropriate link in the Overview tab, or click any other tab.

Using Oracle BI Delivers ■ Viewing, Modifying, Subscribing to and Customizing Oracle BIDelivers iBots
Oracle Business Intelligence Answers, Delivers, and InteractiveDashboards User Guide Version 10.1.3.2
185
Subscribing to Oracle BI Delivers iBotsYou can subscribe to or unsubscribe to iBots that are available for subscription. Each iBot that is available for you to subscribe to (but is currently unsubscribed), displays a Subscribe link, and each iBot that you are subscribed to displays a Remove Subscription link.
To change your current iBot subscriptions
1 To subscribe to an iBot, click the link Subscribe.
A Remove Subscription link appears below the iBot and the icon changes (it displays a tick symbol), indicating that you are subscribed to it.
2 To remove a subscription from an iBot, click the link Remove Subscription.
The Subscribe link appears below the iBot and the icon changes (the tick symbol disappears), indicating that you are no longer subscribed to the iBot.
Customizing Your Oracle BI Delivers iBot SubscriptionsYou can customize prompted filter values for columns, for a specific iBot subscription.
NOTE: This option is only available if the Allow subscribers to customize iBots option is selected in the Recipients tab. For more information, see “To allow subscribers to customize the iBot” on page 171.
To customize an iBot subscription
1 Click the link Customize Subscription.
The Customize iBot page appears, where you can modify the filter values for columns that can be customized for this iBot subscription.
2 Click Customize to select the column that you want to modify.
3 Click the Modify button to display the Create/Edit Filter value dialog.
This dialog enables you to modify values for a column filter as follows:
a Select an operator from the Operator drop-down list.
b Click the Add button and select (from the drop-down list) an option to compare with the column as follows:
Value - Enables you to enter a value.
SQL Expression - Enables you to enter a SQL expression.
Variable (Session, Repository, or Presentation) - Enables you to enter a variable.
c Click the Clear Values button to remove any existing values.
d Select a value from the Match drop-down list, and enter an appropriate value in the adjacent field.

Oracle Business Intelligence Answers, Delivers, and Interactive Dashboards User Guide Version 10.1.3.2
Using Oracle BI Delivers ■ Configuring Your Oracle BI Delivers Devices, and Delivery Profiles
186
e Click All Choices link to display links for each available column value.
For example, if the column is Region and you click the All Choices link, links for every region are displayed. You could then select an alternative region.
f Click OK.
The Customize iBot page appears, where you can continue to modify filter values for a column, for the iBot subscription.
4 Click Save to apply your changes.
NOTE: The customized filter values that you set in the previous steps are not automatically displayed in iBot results. For more information, see “To display customized filter values in iBot results” on page 186.
To display customized filter values in iBot resultsTo display customized filter values in iBot results, you must do the following:
1 Start Oracle BI Answers and locate the report that is being customized.
2 Display the Results tab in Oracle BI Answers.
3 Click the Add View button.
4 Select the Filters option from the drop-down list.
5 Save the report.
The report will now display the customized filter values in iBot results. For more information, see the Oracle BI Answers Help system
Configuring Your Oracle BI Delivers Devices, and Delivery ProfilesOracle BI users can configure delivery devices and delivery profiles through the My Account link. These links are available on the main page in Oracle BI Answers, Oracle BI Delivers, and Oracle BI Interactive Dashboards.
Devices and delivery profiles control how Oracle BI Delivers will reach you when an alert is triggered by an iBot. After you add one or more devices, you can create delivery profiles, and specify which delivery profile should be your active profile for receiving alerts.
CAUTION: If your Delivery Options area already contains devices and profiles, do not make any changes to the Delivery Options area without first consulting your Oracle BI administrator (any changes you make will override the delivery device and profile information that was configured for you).
Users can add devices, specify alternative default devices, and configure their delivery profiles. For more information, see “To configure a delivery option for Oracle BI Delivers” on page 187.

Using Oracle BI Delivers ■ Configuring Your Oracle BI Delivers Devices, and DeliveryProfiles
Oracle Business Intelligence Answers, Delivers, and InteractiveDashboards User Guide Version 10.1.3.2
187
To configure a delivery option for Oracle BI Delivers
1 Login to Oracle BI.
2 Click Settings (if available), and the My Account link.
The My Account page appears.
3 To add a device, perform the following steps:
a Click a link for the device you want to add.
For example, click the Email link.
b Click the Add Device link (e.g. the Add Email Device link).
The Device page appears with the Device Name field populated, and options are available in the Device / Provider list.
c Select the appropriate option for the device category from the Device / Provider drop-down list.
d Enter the address for the device in the Address field.
For example, this would be an email address for email, or a telephone number for a digital phone.
NOTE: When typing a phone number for a device, do not use punctuation such as spaces, dashes, or parentheses.
e Click Finished to return to the My Account page.
The device appears in the Devices area for the appropriate category (e.g. Email devices).
f To change information for the device, click the Edit link to go back to the Device page.
g If you decide you do not want the device, click the Delete link.
This removes the device from the Devices area.
h To add another device, repeat the preceding steps.
4 To specify an alternative default device, perform the following steps:
a Click the tab for the device category in which you want to set a default device (e.g. Email, Phone).
All devices for the selected device category are displayed.
b Click the Radio button next to the device that you want to select as the default.
If you select a default device here (e.g. Email1), and select the Email check box in the iBot Destinations page, the default device will override other Email devices in your active delivery profile. For more information, see “Selecting Destinations for an Oracle BI Delivers iBot” on page 177.
5 To add a delivery profile, perform the following steps:
a Click the Add Delivery Profile link.
The Delivery Profile page appears.

Oracle Business Intelligence Answers, Delivers, and Interactive Dashboards User Guide Version 10.1.3.2
Using Oracle BI Delivers ■ Using Oracle BI Delivers Delivery Profiles
188
b Enter a delivery profile name in the Name field.
For more information about your choices at the Delivery Profile page and how delivery profiles work, see “Using Oracle BI Delivers Delivery Profiles” on page 188.
c Click Finished to return to the Delivery Profile page.
The profile appears in the Delivery Profiles list.
d To change information for the delivery profile, click the Edit link to go back to the Delivery Profile page.
e If you decide you do not want the delivery profile, click the Delete link.
This removes the delivery profile from the Delivery Profiles area.
f To add another delivery profile, repeat the preceding steps.
6 To make a delivery profile the active profile, click the radio button next to the profile.
The radio button next to the profile is filled in to indicate that it is the active delivery profile.
Using Oracle BI Delivers Delivery ProfilesOracle BI Delivers uses your active delivery profile to determine how to reach you when an alert is triggered by an iBot, and which devices should receive delivered content. You configure your delivery profile from the My Account page. For information about accessing the My Account page to configure your delivery profile, see “Configuring Your Oracle BI Delivers Devices, and Delivery Profiles” on page 186.
iBot contents can be delivered to a range of devices, including Web, wireless, and mobile devices. By default, iBot contents are available for delivery to the dashboard and the appropriate devices defined in your active delivery profile (based on the priority of the iBot contents). Content may be specifically directed to a device, and if so, you will receive content on that device if it is defined, even if it is not in your active delivery profile.
Content is delivered to the intersection of devices as determined by the active delivery profile and the specific devices defined for the target content. Content is delivered only once to a device, even if that device is in your active delivery profile and specifically selected as a delivery device for the iBot content. If a specifically requested device or active delivery profile cannot be found, iBot content is automatically pushed to the dashboard.
iBot content is assigned a specific priority. The default priority is normal. When you select devices for your active profile, you can indicate what priority content should be sent to that device. For example, if you have added a pager to your delivery profile, you might associate it with high priority content only. When you know that you will be away from your office frequently, and out of email range, you may select to receive only low priority content through your office email.
You can create any number of delivery profiles. However, only one profile can be active at any given time.
Using Oracle BI Delivers ■ Accessing Oracle BI Alerts
Oracle Business Intelligence Answers, Delivers, and InteractiveDashboards User Guide Version 10.1.3.2
189
To add or edit an Oracle BI Delivers delivery profile
1 At the Delivery Profile page, enter the name of the profile in the Name field.
2 For each device you want to use in the profile, select the priority of the content to be delivered.
NOTE: Do not set the priority for devices that you do not want to use. Devices that do not have a priority selected are not used by the profile.
You can select any or all priorities by clicking the appropriate check boxes.
3 Click Finished to save this profile and return to the My Accounts page.
The delivery profile appears in the Delivery Profiles list.
Accessing Oracle BI AlertsThe Oracle BI Alerts page shows your currently active alerts and information about when the content was delivered. Depending on the settings for the alert, links appear that allow you to view active alert content, clear all occurrences of the active alert, open the iBot that generated the alert, or check current conditions by reexecuting the iBot that generated the alert.
When Oracle BI Delivers is enabled, you can add an Alerts section to any dashboard page. When alerts are present, the Alerts! link appears at the top of each Oracle BI Answers, Oracle BI Delivers, and Oracle BI Interactive Dashboard page.
NOTE: An Alerts section is automatically added to the first page of your My Dashboard if one is not manually placed there.
The RSS feed option allows you to receive your alerts via an RSS 2.0 compatible reader that supports HTTP basic authentication. However, if the Oracle BI Presentation Server uses the HTTPS protocol, the RSS reader that you use must also support the HTTPS protocol.
The XML button appears on the Alert’s page. This button is used to find the Alerts page’s URL. Users must have the proper privilege before the XML button appears on their Alerts page. The RSS Feeds privilege is granted by the Oracle BI Presentation Services Server administrator.
For more information about RSS requirements, see the Oracle BI Interactive Dashboard Help system, or the chapter about Using Oracle BI Interactive Dashboards in the Oracle Business Intelligence Answers, Delivers, and Interactive Dashboards User Guide.
To access alerts from Answers, Delivers, or interactive dashboards
1 Click the Alerts! link from Oracle BI Answers, Oracle BI Delivers, or Oracle BI Interactive Dashboards.
The Oracle BI Alerts page opens, in a new window, showing the headline, delivery date and time, and number of occurrences for each active alert.
2 To work with an alert, click the appropriate link.
Oracle Business Intelligence Answers, Delivers, and Interactive Dashboards User Guide Version 10.1.3.2
Using Oracle BI Delivers ■ Accessing Oracle BI Alerts
190
To add an RSS feed for alerts
1 Click the Alerts! link from Oracle BI Answers, Oracle BI Delivers, or Oracle BI Interactive Dashboards.
The Oracle BI Alerts page opens, in a new window, showing the headline, delivery date and time, and number of occurrences for each active alert. The RSS button appears at the bottom of the page.
2 Right-mouse click the XML button and copy the link information.
3 Open an RSS reader and manually add the RSS URL to your alerts page. For more information about creating the RSS source for your alerts, see the RSS reader product documentation.
Oracle Business Intelligence Answers, Delivers, and InteractiveDashboards User Guide Version 10.1.3.2
191
8 Using Oracle BI Interactive Dashboards
An Oracle BI Interactive Dashboard is a page in an Analytics application that is used to display the results of Oracle BI requests and other kinds of content. Based on your permissions, you can view preconfigured dashboards, and create or modify dashboards.
This chapter describes the procedures for creating and managing the content on dashboards. It contains the following topics:
■ “Overview of Oracle BI Interactive Dashboards” on page 191
■ “Navigating in Oracle BI Interactive Dashboards” on page 194
■ “Creating a New Oracle BI Interactive Dashboard” on page 195
■ “Adding a New Page to an Oracle BI Interactive Dashboard” on page 196
■ “Adding Content to an Oracle BI Interactive Dashboard” on page 196
■ “Changing the Properties of an Oracle BI Interactive Dashboard” on page 214
■ “Creating and Assigning Personal and Shared Saved Selections for an Oracle BI Interactive Dashboard Page” on page 217
■ “Accessing Another Oracle BI User’s Account” on page 220
■ “Working with Oracle BI Publisher Reports” on page 220
■ “Working with Oracle BI Briefing Books” on page 224
■ “About Guided Navigation in Oracle BI” on page 228
Overview of Oracle BI Interactive DashboardsOracle BI Interactive Dashboards provide personalized views of corporate and external information. A dashboard consists of one or more pages, which appear as tabs across the top of the dashboard. Pages can display anything that you can access or open with your Web browser, such as saved Oracle BI requests, alerts from Oracle BI Delivers, images, charts, tables, text, and links to Web sites and documents.
The kinds of content that a dashboard can contain are dashboard objects, content that is saved in the Oracle BI Presentation Catalog, and views of folders in the Presentation Catalog. Users with appropriate permissions can use the Dashboard Editor to add content to a dashboard by dragging and dropping it from a selection pane onto the dashboard layout page, which consists of columns to align content, and sections inside of columns to hold content. The look of a dashboard, such as background colors and the size of text, is controlled by styles and skins, and can also be changed through the use of a cosmetic formatting dialog box.

Oracle Business Intelligence Answers, Delivers, and Interactive Dashboards User Guide Version 10.1.3.2
Using Oracle BI Interactive Dashboards ■ Overview of Oracle BI Interactive Dashboards
192
Many of the features in Oracle BI Interactive Dashboards are self-explanatory, and definitions and how-to information appear on each page. When more information is available than will fit on the page, a Help button appears near the upper right corner. Click the button to see more detailed information.
Dashboard creation is reserved for users with administrative responsibilities. Permission to modify dashboards (personal and shared) is granted to a broader range of users, as determined by an Oracle BI administrator. Users with the appropriate permissions and responsibilities can modify a dashboard.
Table 24 provides definitions for common terms in Oracle BI Interactive Dashboards.
Table 24. Definitions for Common Terms in Oracle BI Interactive Dashboards
Term Definition
Columns Columns are used to align content on a dashboard. (Sections within columns hold the actual content.) You can create as many columns on a dashboard page as you need. Every new dashboard page automatically contains one empty column with one empty section in it. The columns used in Oracle BI Interactive Dashboards are not related to the columns used in Oracle BI Answers.
Dashboard Objects
Dashboard objects are items that are used only in a dashboard. Examples of dashboard objects are sections to hold content, navigation links, and embedded content appearing within a frame in a dashboard.
Folders Folders are organizational constructs that hold content saved in the Presentation Catalog, such as requests created with Oracle BI Answers. A folder is similar to a UNIX directory, or a Microsoft Windows folder.
Pages Pages contain the columns and sections that hold the content of a dashboard. Every dashboard has at least one page. In Oracle BI Interactive Dashboards, pages are identified by tabs across the top of the dashboard. Multiple pages are used to organize content. For example, you might have one page to store results from Oracle BI Answers that you refer to every day, another that contains links to the Web sites of your suppliers, and one that links to your corporate intranet.
Results Results, also called reports, are the output returned from the Oracle BI Server that matches the request criteria specified using Oracle BI Answers. The default format for viewing results in a dashboard is to show them in a table. (Your Oracle BI Presentation Services administrator may have configured a different default results view for your organization.) Results can also be shown in other formats, such as charts. You can examine and analyze results, save or print them, or download them to a spreadsheet.
Sections Sections appear in columns in the dashboard layout. They hold the content dragged and dropped from the selection pane, and are used to organize content within a column.
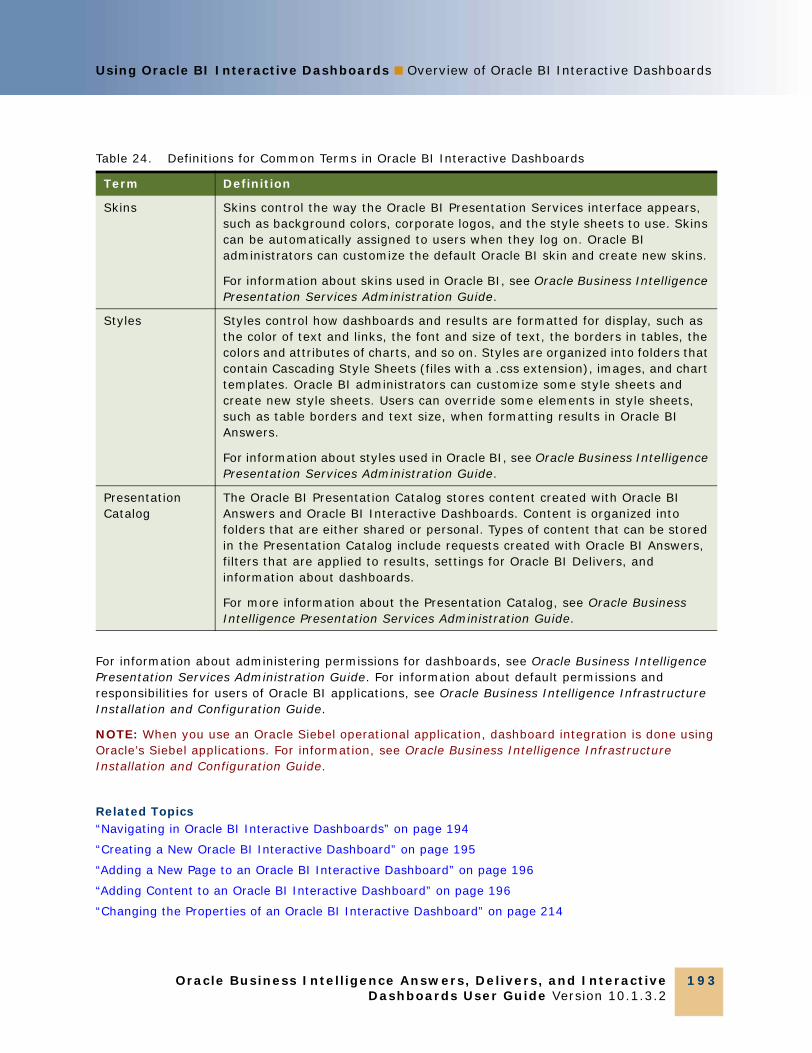
Using Oracle BI Interactive Dashboards ■ Overview of Oracle BI Interactive Dashboards
Oracle Business Intelligence Answers, Delivers, and InteractiveDashboards User Guide Version 10.1.3.2
193
For information about administering permissions for dashboards, see Oracle Business Intelligence Presentation Services Administration Guide. For information about default permissions and responsibilities for users of Oracle BI applications, see Oracle Business Intelligence Infrastructure Installation and Configuration Guide.
NOTE: When you use an Oracle Siebel operational application, dashboard integration is done using Oracle’s Siebel applications. For information, see Oracle Business Intelligence Infrastructure Installation and Configuration Guide.
Related Topics“Navigating in Oracle BI Interactive Dashboards” on page 194
“Creating a New Oracle BI Interactive Dashboard” on page 195
“Adding a New Page to an Oracle BI Interactive Dashboard” on page 196
“Adding Content to an Oracle BI Interactive Dashboard” on page 196
“Changing the Properties of an Oracle BI Interactive Dashboard” on page 214
Skins Skins control the way the Oracle BI Presentation Services interface appears, such as background colors, corporate logos, and the style sheets to use. Skins can be automatically assigned to users when they log on. Oracle BI administrators can customize the default Oracle BI skin and create new skins.
For information about skins used in Oracle BI, see Oracle Business Intelligence Presentation Services Administration Guide.
Styles Styles control how dashboards and results are formatted for display, such as the color of text and links, the font and size of text, the borders in tables, the colors and attributes of charts, and so on. Styles are organized into folders that contain Cascading Style Sheets (files with a .css extension), images, and chart templates. Oracle BI administrators can customize some style sheets and create new style sheets. Users can override some elements in style sheets, such as table borders and text size, when formatting results in Oracle BI Answers.
For information about styles used in Oracle BI, see Oracle Business Intelligence Presentation Services Administration Guide.
Presentation Catalog
The Oracle BI Presentation Catalog stores content created with Oracle BI Answers and Oracle BI Interactive Dashboards. Content is organized into folders that are either shared or personal. Types of content that can be stored in the Presentation Catalog include requests created with Oracle BI Answers, filters that are applied to results, settings for Oracle BI Delivers, and information about dashboards.
For more information about the Presentation Catalog, see Oracle Business Intelligence Presentation Services Administration Guide.
Table 24. Definitions for Common Terms in Oracle BI Interactive Dashboards
Term Definition
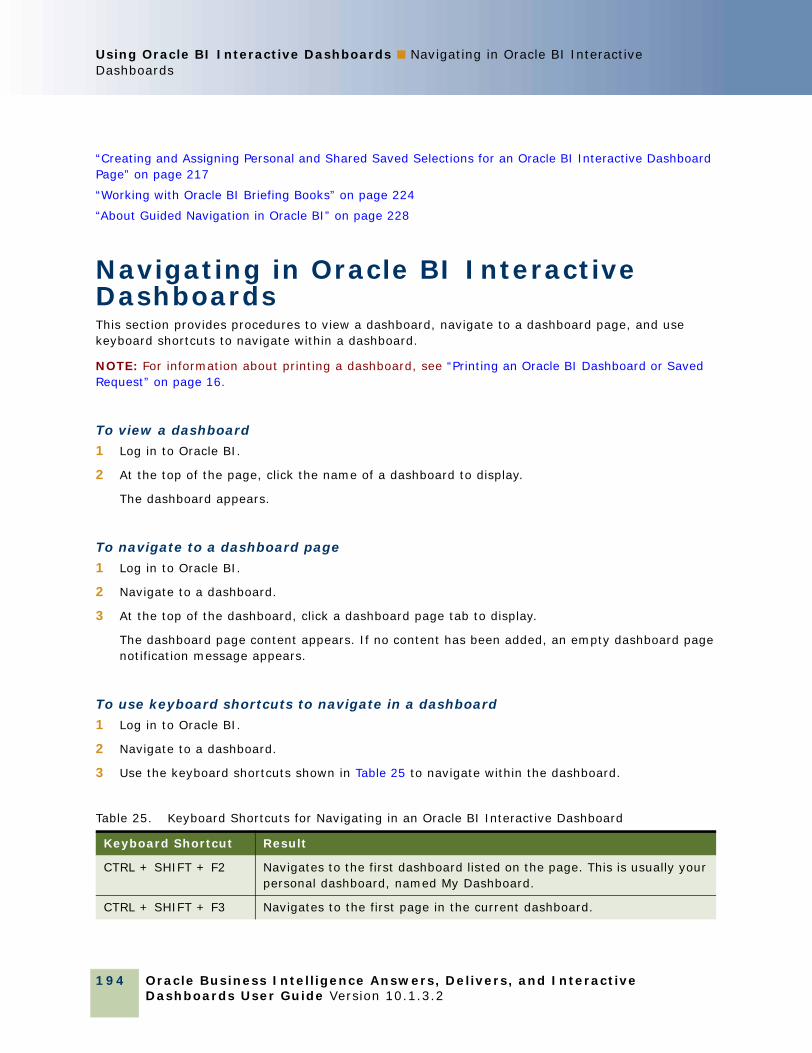
Oracle Business Intelligence Answers, Delivers, and Interactive Dashboards User Guide Version 10.1.3.2
Using Oracle BI Interactive Dashboards ■ Navigating in Oracle BI Interactive Dashboards
194
“Creating and Assigning Personal and Shared Saved Selections for an Oracle BI Interactive Dashboard Page” on page 217
“Working with Oracle BI Briefing Books” on page 224
“About Guided Navigation in Oracle BI” on page 228
Navigating in Oracle BI Interactive DashboardsThis section provides procedures to view a dashboard, navigate to a dashboard page, and use keyboard shortcuts to navigate within a dashboard.
NOTE: For information about printing a dashboard, see “Printing an Oracle BI Dashboard or Saved Request” on page 16.
To view a dashboard
1 Log in to Oracle BI.
2 At the top of the page, click the name of a dashboard to display.
The dashboard appears.
To navigate to a dashboard page
1 Log in to Oracle BI.
2 Navigate to a dashboard.
3 At the top of the dashboard, click a dashboard page tab to display.
The dashboard page content appears. If no content has been added, an empty dashboard page notification message appears.
To use keyboard shortcuts to navigate in a dashboard
1 Log in to Oracle BI.
2 Navigate to a dashboard.
3 Use the keyboard shortcuts shown in Table 25 to navigate within the dashboard.
Table 25. Keyboard Shortcuts for Navigating in an Oracle BI Interactive Dashboard
Keyboard Shortcut Result
CTRL + SHIFT + F2 Navigates to the first dashboard listed on the page. This is usually your personal dashboard, named My Dashboard.
CTRL + SHIFT + F3 Navigates to the first page in the current dashboard.

Using Oracle BI Interactive Dashboards ■ Creating a New Oracle BI InteractiveDashboard
Oracle Business Intelligence Answers, Delivers, and InteractiveDashboards User Guide Version 10.1.3.2
195
Creating a New Oracle BI Interactive DashboardThe following procedure provides the steps to create a new, empty Oracle BI Interactive Dashboard. Dashboard creation is reserved for users with the appropriate permissions and responsibilities.
To create a new, empty dashboard
1 Log in to Oracle BI and click Settings, and the Administration link.
The Oracle BI Presentation Services Administration page appears.
2 In the Activities section, click the following link:
Manage Interactive Dashboards
The Manage Dashboards page appears.
3 Click the following link at the bottom of the page:
Create a new Interactive Dashboard
4 At the Create Dashboard page, enter a location and name for the dashboard, and the name of the user or group that can modify the dashboard.
5 Exit Oracle BI Administration and return to Oracle BI Interactive Dashboards.
The name of the new dashboard appears at the top of the screen.
NOTE: Newly-created dashboards contain one blank page. Dashboards that contain only one page do not display the page name as a tab at the top of the dashboard. Dashboard page names appear at the top of a dashboard only when the dashboard contains multiple pages.
6 Click the name of the new dashboard.
An empty dashboard page appears.
7 To add content to the dashboard, click either of the following links:
■ Click here to add content
CTRL + SHIFT + I Navigates to the next section of content in the current dashboard. This shortcut navigates first from left to right, and then down.
CTRL + SHIFT + U Navigates to the previous section of content in the current dashboard. This shortcut navigates first from right to left, and then up.
CTRL + SHIFT + F8 Navigates to the next item within a section of content. If the section is aligned horizontally, this shortcut navigates from left to right.
CTRL + SHIFT + F7 Navigates to the previous item within a section of content. If the section is aligned horizontally, this shortcut navigates from right to left.
Table 25. Keyboard Shortcuts for Navigating in an Oracle BI Interactive Dashboard
Keyboard Shortcut Result

Oracle Business Intelligence Answers, Delivers, and Interactive Dashboards User Guide Version 10.1.3.2
Using Oracle BI Interactive Dashboards ■ Adding a New Page to an Oracle BI Interactive Dashboard
196
■ Edit Dashboard
The Dashboard Editor appears.
Adding a New Page to an Oracle BI Interactive DashboardThe following procedure provides the steps to add a new page to an Oracle BI Interactive Dashboard.
NOTE: Dashboard modification is reserved for users with the appropriate permissions and responsibilities.
To add a new page to a dashboard
1 Log in to Oracle BI and navigate to Oracle BI Interactive Dashboards.
2 At the top of the page, click the name of a dashboard to which you want to add a new page.
The dashboard appears.
3 Click the Edit Dashboard link.
The Dashboard Editor appears.
4 Click the Add Dashboard Page button near the top of the Dashboard Editor:
The Add Dashboard Page screen appears.
5 Type a name and a description for the dashboard page.
6 Click the Finished button.
The new page appears on the dashboard.
NOTE: If there is only one page in the dashboard, the page name will not appear on a tab. Tabs appear only when there is more than one page, so you can click the tabs to move between the pages.
Adding Content to an Oracle BI Interactive DashboardUse the Dashboard Editor to lay out and add content to an Oracle BI Interactive Dashboard. This section provides the procedure to access the Dashboard Editor and explains how to work with the Dashboard Editor. It contains the following topics:
■ “Working with Oracle BI Interactive Dashboard Pages and Layout Using the Dashboard Editor” on page 197

Using Oracle BI Interactive Dashboards ■ Adding Content to an Oracle BI InteractiveDashboard
Oracle Business Intelligence Answers, Delivers, and InteractiveDashboards User Guide Version 10.1.3.2
197
■ “Adding and Displaying Content in an Oracle BI Interactive Dashboard Page Using the Dashboard Editor” on page 200
■ “Renaming and Deleting Objects on an Oracle BI Interactive Dashboard Page Using the Dashboard Editor” on page 212
■ “Modifying Oracle BI Interactive Dashboard Properties Using the Dashboard Editor” on page 213
To access the Oracle BI Interactive Dashboard Editor
1 Log in to Oracle BI and navigate to Oracle BI Interactive Dashboards.
2 At the top of the page, click the name of a dashboard you want to edit.
The dashboard appears.
3 Click the Edit Dashboard link.
The Dashboard Editor appears.
Related Topics“Creating a New Oracle BI Interactive Dashboard” on page 195
“Adding a New Page to an Oracle BI Interactive Dashboard” on page 196
“Navigating in Oracle BI Interactive Dashboards” on page 194
“Creating and Assigning Personal and Shared Saved Selections for an Oracle BI Interactive Dashboard Page” on page 217
Working with Oracle BI Interactive Dashboard Pages and Layout Using the Dashboard EditorThis section explains how to control the appearance of dashboard pages. It contains the following topics:
■ “Selecting an Oracle BI Interactive Dashboard Page to Edit” on page 197
■ “Working with Columns in an Oracle BI Interactive Dashboard Page” on page 198
■ “Adding a Section to an Oracle BI Interactive Dashboard Page” on page 199
■ “Adding an Alerts Section to an Oracle BI Interactive Dashboard Page” on page 199
■ “Making a Section Appear Horizontally in an Oracle BI Interactive Dashboard Page” on page 199
■ “Saving Changes to an Oracle BI Interactive Dashboard Page” on page 200
NOTE: If iBots are enabled within Oracle BI Delivers, an Alerts section will be added to the first page of My Dashboard if one is not manually placed there.
Selecting an Oracle BI Interactive Dashboard Page to EditThe following procedure explains how to select the page with which you want to work.

Oracle Business Intelligence Answers, Delivers, and Interactive Dashboards User Guide Version 10.1.3.2
Using Oracle BI Interactive Dashboards ■ Adding Content to an Oracle BI Interactive Dashboard
198
To select the dashboard page ■ From the Page drop-down list next to the name of the dashboard, select the page you want to
edit.
NOTE: This action saves any changes you made to the page you were working with.
Working with Columns in an Oracle BI Interactive Dashboard PageColumns are used to align content on a dashboard. (Sections within columns hold the actual content.) You can add or remove columns, set the width in pixels or as a percentage of the dashboard page, and break columns.
When you have more than one column on a dashboard page, you can break columns to arrange them on the page. (Drag and drop does not reposition columns.) For example, if you have two columns side by side, breaking the rightmost column causes it to move beneath the first column, and both columns will span the width originally occupied when they were side by side. If you have three columns side by side, breaking the middle column causes the two outer columns to move beneath the first column, and the first column spans the width originally occupied by the first two columns.
To add a new column■ Click the Add Column button near the top of the Dashboard Editor:
The column is added to the dashboard page.
To set the width of a column
1 Click the Properties button and choose Set Width.
The Column Properties dialog box appears.
2 Specify the column width:
■ To specify the width in pixels, type the number of pixels, for example, 200.
■ To specify the width as a percentage of the dashboard page, use the percent (%) sign, for example, 20%.
3 Click OK.
To break a column■ Click the Properties button and choose Insert Column Break.
If you break the column again, the column layout reverts to what it was previously.

Using Oracle BI Interactive Dashboards ■ Adding Content to an Oracle BI InteractiveDashboard
Oracle Business Intelligence Answers, Delivers, and InteractiveDashboards User Guide Version 10.1.3.2
199
Adding a Section to an Oracle BI Interactive Dashboard PageSections are used within columns to hold the content of a dashboard. Sections are aligned vertically by default. You can drag as many sections as you need into a column.
If you drag and drop content into a column without first adding a section to hold the content, a section is created automatically.
If you drag a section from one column into another column, any content in that section is also included.
NOTE: If Oracle BI Delivers is enabled, a section for Alerts is added automatically to the first page of users' personal dashboards (My Dashboard) if a section is not placed there manually.
To add a section to a column■ From the selection pane, drag and drop a Section object from the Dashboard Objects area into
the column.
The column is highlighted when you are at an appropriate location in the column to drop the section.
Adding an Alerts Section to an Oracle BI Interactive Dashboard PageIf iBots are enabled within Oracle BI Delivers, an Alerts section is added to the first page of users’ My Dashboard. If the section is not placed there manually, the system adds it automatically. You cannot disable the appearance of an Alerts section on the first page of user My Dashboard.
You can add the Alerts section to an additional dashboard page by performing the steps in the following procedure. The Alerts section will then appear on both dashboard pages.
To add an Alerts section to a dashboard page
1 From the selection pane, drag and drop a Section object from the Dashboard Objects area into a column.
The column is highlighted when you are at an appropriate location in the column to drop the section.
A default name appears for the section.
2 Rename the section to _Delivers and click the Save button.
The Alerts section is added to the page.
Making a Section Appear Horizontally in an Oracle BI Interactive Dashboard PageThe default alignment for sections is to align them vertically.
To make a section appear horizontally■ Click the Properties button for the section and choose Horizontal Alignment.
Oracle Business Intelligence Answers, Delivers, and Interactive Dashboards User Guide Version 10.1.3.2
Using Oracle BI Interactive Dashboards ■ Adding Content to an Oracle BI Interactive Dashboard
200
Saving Changes to an Oracle BI Interactive Dashboard PageYou can save your changes at any time.
To save changes to a dashboard page■ Perform one of the following actions:
■ Click the Save button.
■ Leave the page you are working on in the Dashboard Editor.
For example, your changes are saved if you add or edit another page, change dashboard properties, or modify a prompt, filter, or request.
Adding and Displaying Content in an Oracle BI Interactive Dashboard Page Using the Dashboard EditorThis section explains how to add and display content on dashboard pages, such as using guided navigation to make content appear conditionally. It contains the following topics:
■ “Making Content Appear Conditionally in an Oracle BI Interactive Dashboard Page” on page 200
■ “Adding a Guided Navigation Link to an Oracle BI Interactive Dashboard Page” on page 201
■ “Adding a Briefing Book Navigation Link to an Oracle BI Interactive Dashboard Page” on page 201
■ “Adding a Text Link or an Image Link to an Oracle BI Interactive Dashboard Page” on page 202
■ “Adding Embedded Content to an Oracle BI Interactive Dashboard Page” on page 205
■ “Adding HTML to an Oracle BI Interactive Dashboard Page” on page 206
■ “Adding a View of a Presentation Catalog Folder to an Oracle BI Interactive Dashboard Page” on page 208
■ “Adding an RSS Feed Option to a Dashboard Page’s Catalog Folder” on page 209
■ “Adding Content Saved in the Presentation Catalog to an Oracle BI Interactive Dashboard Page” on page 209
■ “Adding an Oracle BI Publisher Report to an Oracle BI Interactive Dashboard Page” on page 210
■ “Controlling How Results Display When a User Drills on an Oracle BI Interactive Dashboard” on page 211
■ “Editing the Properties of Oracle BI Interactive Dashboard Prompts and Reports” on page 211
Making Content Appear Conditionally in an Oracle BI Interactive Dashboard PageYou can make an entire section of a dashboard and its content appear conditionally based upon the results returned by Oracle BI Answers for a particular request.
For more information, see “About Guided Navigation in Oracle BI” on page 228.

Using Oracle BI Interactive Dashboards ■ Adding Content to an Oracle BI InteractiveDashboard
Oracle Business Intelligence Answers, Delivers, and InteractiveDashboards User Guide Version 10.1.3.2
201
To make content appear conditionally
1 Click the Properties button for the section that contains the content and choose Guided Navigation.
The Guided Navigation Properties dialog box appears.
2 Specify your choices, browse to select the request from the Presentation Catalog, and click OK.
Adding a Guided Navigation Link to an Oracle BI Interactive Dashboard PageGuided navigation links can be static or conditional. Static links always appear. Conditional links appear only if results meet certain criteria.
For more information, see “About Guided Navigation in Oracle BI” on page 228.
To add a guided navigation link
1 From the selection pane, drag and drop a Guided Navigation Link object into a section in the dashboard page.
2 Click the Properties button for the link.
The Guided Navigation Link Properties dialog box appears.
3 Choose the type of link to add:
■ To make the link conditional, specify your choices in the Conditional Link Properties area.
■ To make the link static, specify your choices in the Guided Navigation Properties area.
NOTE: For URLs, provide the full path.
4 Click OK.
Adding a Briefing Book Navigation Link to an Oracle BI Interactive Dashboard PageBriefing Book navigation links are for use with briefing books in Disconnected Analytics. For dashboard pages that will be saved in briefing books, use this to include navigation links to other requests or dashboard content for use in offline analysis. Briefing Book navigation links also function on non-Briefing Book dashboards.
For more information about briefing books, see “Working with Oracle BI Briefing Books” on page 224.
To add a Briefing Book navigation link
1 From the selection pane, drag and drop a Briefing Book Navigation Link object into a section in the dashboard page.
2 Click the Properties button for the link.
The Briefing Book Link Properties dialog box appears.

Oracle Business Intelligence Answers, Delivers, and Interactive Dashboards User Guide Version 10.1.3.2
Using Oracle BI Interactive Dashboards ■ Adding Content to an Oracle BI Interactive Dashboard
202
3 Specify your choices and click OK.
Adding a Text Link or an Image Link to an Oracle BI Interactive Dashboard PageYou can add text links and image links to a dashboard, and specify what should happen when a user clicks them. For example, you can direct users to another Web site or dashboard, open documents, launch applications, or perform any other action that your browser supports. You can also add an image or text only, without any links.
To add a text link or image
1 From the selection pane, drag and drop a Link or Image object onto a section in the dashboard page.
2 Click the Properties button for the object.
The Link or Image Properties dialog box appears.
3 Specify your choices:
■ For a text link, type the text into the Caption field.
■ For an image link, type the location and name of the image into the Image field.
Specify the location as a URL. These are examples:
http://imageserver/MyImage.gif
/DashboardFiles/image.gif
If the image is not on the local server, the URL must include http://. If the image is for use in a shared environment, it must be located on a network drive accessible to all users.
If you want a caption for the image, type a caption for the image in the Caption field, and use the Layout drop-down list to choose where the caption should appear relative to the image.
4 Specify what should happen when the user clicks the text or image:
■ To specify that a request or dashboard should appear when the user clicks the link or image, specify the destination as Request or Dashboard, and click the Browse button to select the request or dashboard.
■ To specify that another action should occur, such as opening a Web site, document, or program, specify the destination as a URL and type the full path into the field that follows the Destination options.
A link is defined as any URL (Uniform Resource Locator) that your browser can interpret. URLs can point to Web sites, documents, images, FTP sites, newsgroups, and so on. Depending on your browser, the following are examples of valid URLs:
http://home.netscape.com/index.html
ftp://ftp.microsoft.com

Using Oracle BI Interactive Dashboards ■ Adding Content to an Oracle BI InteractiveDashboard
Oracle Business Intelligence Answers, Delivers, and InteractiveDashboards User Guide Version 10.1.3.2
203
news:news.announce.newusers
See Table 26 on page 204 for more information about the kinds of internal or external content to which you can link.
NOTE: Oracle BI administrators should create a virtual directory on the Presentation server for shared documents called \DashboardFiles that maps to a shared network directory of the same name. This allows users with the appropriate permissions to publish files to this folder, and reference these files by their relative URL names rather than by their fully qualified network share names, for example, \DashboardFiles\AnnualReport.doc instead of \\SharedServer\CommonShare\DashboardFiles\AnnualReport.doc.
■ In the Target area, choose whether the destination should appear in the user's existing browser window or in a new window.
TIP: For every action except sending mail and executing a program, you can control how the link should appear. Choose the current window when you want the action to occur in the display pane of the dashboard. This leaves the dashboard active but in the background. Choose a new window when you want the action to take place in a new browser window. This opens another instance of your browser.
NOTE: To add text or an image only, without any links, leave the field that follows the Destination options blank.
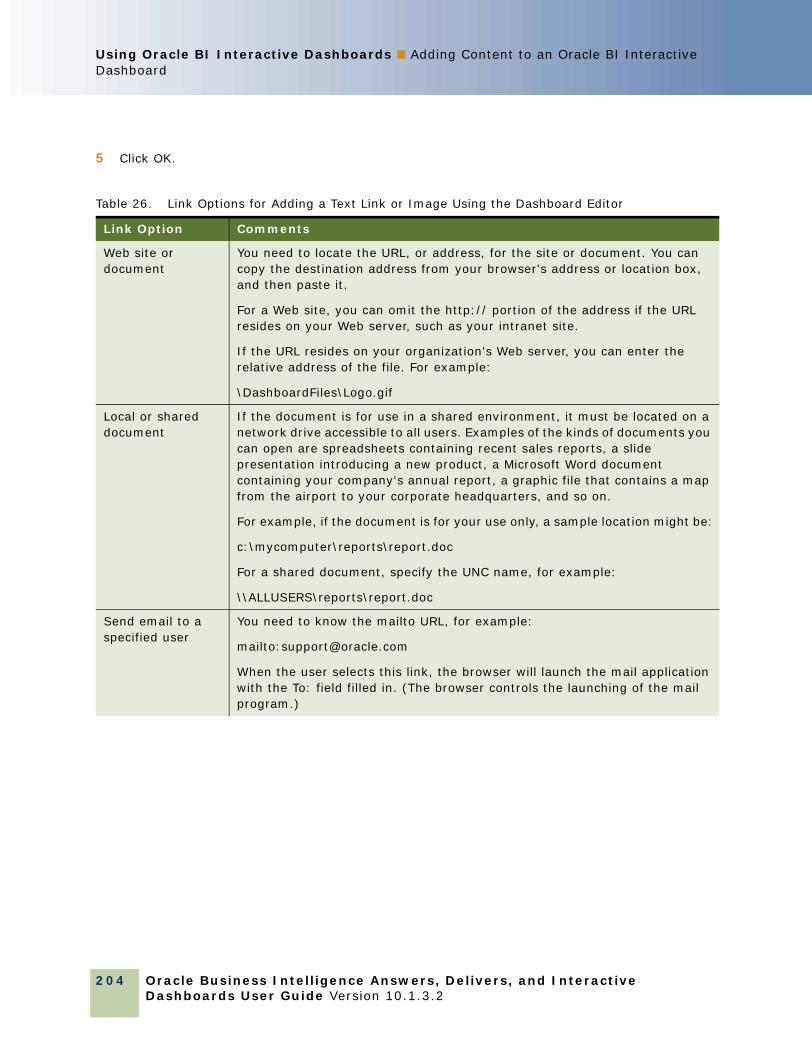
Oracle Business Intelligence Answers, Delivers, and Interactive Dashboards User Guide Version 10.1.3.2
Using Oracle BI Interactive Dashboards ■ Adding Content to an Oracle BI Interactive Dashboard
204
5 Click OK.
Table 26. Link Options for Adding a Text Link or Image Using the Dashboard Editor
Link Option Comments
Web site or document
You need to locate the URL, or address, for the site or document. You can copy the destination address from your browser's address or location box, and then paste it.
For a Web site, you can omit the http:// portion of the address if the URL resides on your Web server, such as your intranet site.
If the URL resides on your organization's Web server, you can enter the relative address of the file. For example:
\DashboardFiles\Logo.gif
Local or shared document
If the document is for use in a shared environment, it must be located on a network drive accessible to all users. Examples of the kinds of documents you can open are spreadsheets containing recent sales reports, a slide presentation introducing a new product, a Microsoft Word document containing your company's annual report, a graphic file that contains a map from the airport to your corporate headquarters, and so on.
For example, if the document is for your use only, a sample location might be:
c:\mycomputer\reports\report.doc
For a shared document, specify the UNC name, for example:
\\ALLUSERS\reports\report.doc
Send email to a specified user
You need to know the mailto URL, for example:
mailto:[email protected]
When the user selects this link, the browser will launch the mail application with the To: field filled in. (The browser controls the launching of the mail program.)
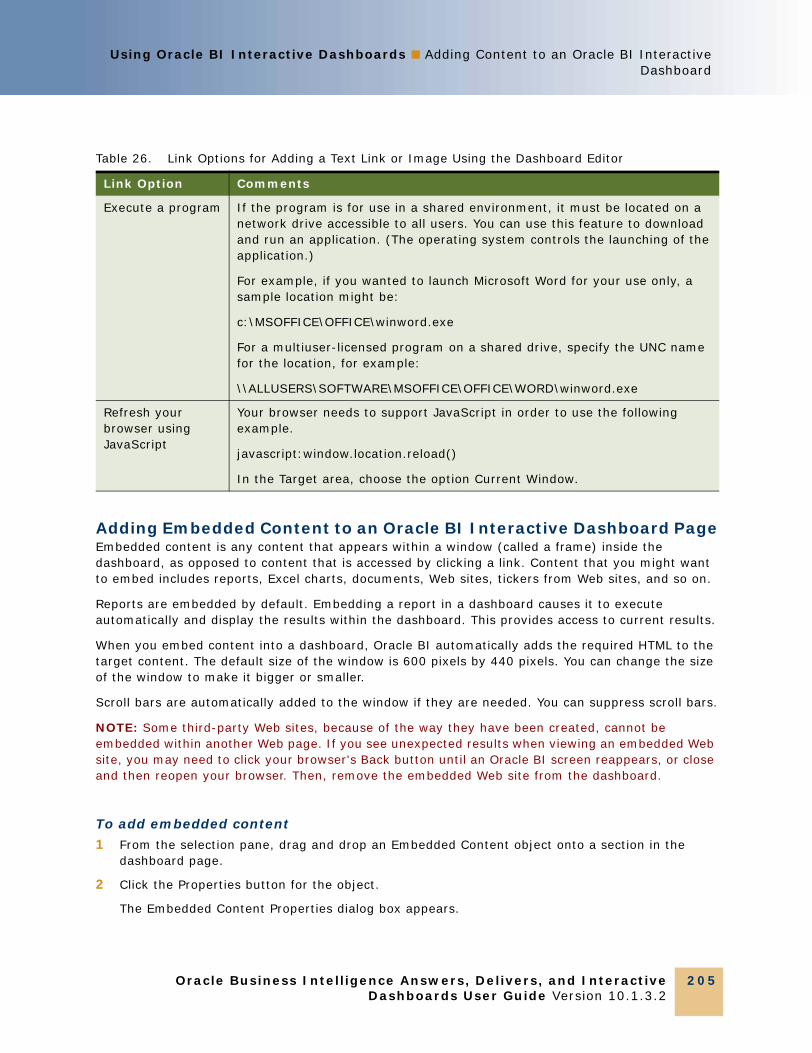
Using Oracle BI Interactive Dashboards ■ Adding Content to an Oracle BI InteractiveDashboard
Oracle Business Intelligence Answers, Delivers, and InteractiveDashboards User Guide Version 10.1.3.2
205
Adding Embedded Content to an Oracle BI Interactive Dashboard PageEmbedded content is any content that appears within a window (called a frame) inside the dashboard, as opposed to content that is accessed by clicking a link. Content that you might want to embed includes reports, Excel charts, documents, Web sites, tickers from Web sites, and so on.
Reports are embedded by default. Embedding a report in a dashboard causes it to execute automatically and display the results within the dashboard. This provides access to current results.
When you embed content into a dashboard, Oracle BI automatically adds the required HTML to the target content. The default size of the window is 600 pixels by 440 pixels. You can change the size of the window to make it bigger or smaller.
Scroll bars are automatically added to the window if they are needed. You can suppress scroll bars.
NOTE: Some third-party Web sites, because of the way they have been created, cannot be embedded within another Web page. If you see unexpected results when viewing an embedded Web site, you may need to click your browser's Back button until an Oracle BI screen reappears, or close and then reopen your browser. Then, remove the embedded Web site from the dashboard.
To add embedded content
1 From the selection pane, drag and drop an Embedded Content object onto a section in the dashboard page.
2 Click the Properties button for the object.
The Embedded Content Properties dialog box appears.
Execute a program If the program is for use in a shared environment, it must be located on a network drive accessible to all users. You can use this feature to download and run an application. (The operating system controls the launching of the application.)
For example, if you wanted to launch Microsoft Word for your use only, a sample location might be:
c:\MSOFFICE\OFFICE\winword.exe
For a multiuser-licensed program on a shared drive, specify the UNC name for the location, for example:
\\ALLUSERS\SOFTWARE\MSOFFICE\OFFICE\WORD\winword.exe
Refresh your browser using JavaScript
Your browser needs to support JavaScript in order to use the following example.
javascript:window.location.reload()
In the Target area, choose the option Current Window.
Table 26. Link Options for Adding a Text Link or Image Using the Dashboard Editor
Link Option Comments
Oracle Business Intelligence Answers, Delivers, and Interactive Dashboards User Guide Version 10.1.3.2
Using Oracle BI Interactive Dashboards ■ Adding Content to an Oracle BI Interactive Dashboard
206
3 In the URL box, type the location and name of the content to embed.
These are examples:
http://www.oracle.com
/dashboardfiles/piechart.xls
NOTE: The URL that you specify should begin with http:// unless you plan to use an item that is saved on your Web server. If you use a network path to indicate the location of the item, make sure you use the exact path. Items that are embedded on a shared dashboard must be located on a network drive accessible to all users.
4 If you want to change the default size of the window, type new values into the Width and Height boxes. When entering values, note the following:
■ The default size of the embedded content area on the dashboard is 600 by 440 pixels and the default display area within the embedded content area is 300 by 150 pixels. The dimensions that you specify for the content area will apply even if the content does not fill the area. For example, if you embed an image and indicate a width of 100 and a height of 100, but the image only has a width of 50 and a height of 50, the dashboard designates an area with the dimensions you specified (100 by 100). Items that you place in the content area are not stretched or reduced to fit the area.
■ If you do not specify a value, the system uses the default settings (300 by 150 pixels). If you have only specified one value, the system will use the default value for the non-specified value.
■ You can specify the value in either pixels (px) or percent (%). Since browsers cannot fully interpret percent values, only the width percentage is rendered. If you specify the height in percentage, the system will substitute 150 pixels for the height value.
■ If you do not specify either pixels or percent, the system interprets the value in pixels.
■ You can enter spaces within the value. For example, you can type either 130px or 130 px.
5 If you do not want the window to have scroll bars, click the following option:
Hide Scroll Bars
6 Click OK.
Adding HTML to an Oracle BI Interactive Dashboard PageYou can add HTML that contains formatted text, Active-X controls or Java scripts, sound bites, animation, a background image, and so on. The name you assign in the Dashboard Editor is the name that will be used for the HTML object in the Presentation Catalog. The HTML may contain anything that is supported by your browser.
Table 27 on page 207 contains usage notes and examples for several HTML elements. If you find an example in the table that is similar to what you want to do, you can copy and paste the example, and then tailor it to your needs.

Using Oracle BI Interactive Dashboards ■ Adding Content to an Oracle BI InteractiveDashboard
Oracle Business Intelligence Answers, Delivers, and InteractiveDashboards User Guide Version 10.1.3.2
207
If you want to add embedded content, which is content that appears in a window within the browser, choose the Embedded Content object in the Dashboard Editor instead. Then, using the Embedded Content feature, specify the name and location of the target, and Oracle BI Presentation Services will wrap the required HTML around the target for you.
To add HTML to a dashboard page
1 From the selection pane, drag and drop an HTML object onto a section in the dashboard page.
2 Click the Properties button for the object.
The HTML Properties dialog box appears.
3 Enter the HTML.
4 To preview the results, click Preview.
If you make any changes, you can click Preview again to see the results.
5 Click OK.
Table 27. Usage Notes and Examples for HTML Elements in an Oracle BI Interactive Dashboard
HTML Element Usage Notes and Examples
Text Any HTML tags may be used to control the format of the text. The following HTML tags are examples of some of the formatting you can apply.
■ To center the text in the section:
<CENTER>Centered Text</CENTER>
■ To make the text bold:
<B>Bold Text</B>
■ To set font size and color:
<FONT SIZE="4" COLOR="red">Red Text</FONT>
■ You can also combine tags for additional effects:
<CENTER><B><FONT COLOR="red">Bold Centered Red Text</FONT></B></CENTER>
Active-X object The Active-X object must be self contained and supported by your browser. Paste or type the object into the HTML text window, making sure to include the beginning and ending tags <object...> and </object>.

Oracle Business Intelligence Answers, Delivers, and Interactive Dashboards User Guide Version 10.1.3.2
Using Oracle BI Interactive Dashboards ■ Adding Content to an Oracle BI Interactive Dashboard
208
Adding a View of a Presentation Catalog Folder to an Oracle BI Interactive Dashboard PageYou can add a view of a Presentation Catalog folder and its contents, such as saved requests, to a dashboard. For example, if you have a collection of saved requests that you run frequently, you can open the folder in the dashboard, navigate to a saved request, and click it to run it.
To add a view of a folder
1 From the selection pane, drag and drop a Folder object onto a section in the dashboard page.
2 Click the Properties button for the folder.
The Folder Properties dialog box appears.
3 Browse to select the folder and click OK.
4 Click OK to save the properties.
JavaScript and VBScript
The script must be self contained and supported by your browser. Paste or type the script into the HTML text window, making sure to include the beginning and ending tags <script> and </script>.
Specify the script language in the opening <SCRIPT> tag, either <SCRIPT LANGUAGE="javascript"> or <SCRIPT LANGUAGE="vbscript">.
Audio Make sure you know where the audio clip is located. If the audio clip is for use in a shared environment, it must be located on a network drive accessible to all users. Use the HTML tag <EMBED> to add audio in your dashboard. The following HTML is an example:
<EMBED SRC="audio" AUTOSTART="true" LOOP="true" HIDDEN="true"></EMBED>
where "audio" is the location and name of the audio clip.
NOTE: You may need to adjust the HTML for your browser.
The following HTML tags are examples of the <EMBED> tag.
■ To add an audio clip located on your hard drive, you could specify the following HTML:
<EMBED SRC="c:\mycomputer\MIDIfiles\wakeup.mid" AUTOSTART="true" LOOP="true" HIDDEN="true"></EMBED>
■ To add the same audio clip from a shared location on your Web server, you could specify the following HTML:
<EMBED SRC="/DashboardFiles/wakeup.mid" AUTOSTART="true" LOOP="true" HIDDEN="true"></EMBED>
Table 27. Usage Notes and Examples for HTML Elements in an Oracle BI Interactive Dashboard
HTML Element Usage Notes and Examples
Using Oracle BI Interactive Dashboards ■ Adding Content to an Oracle BI InteractiveDashboard
Oracle Business Intelligence Answers, Delivers, and InteractiveDashboards User Guide Version 10.1.3.2
209
Adding an RSS Feed Option to a Dashboard Page’s Catalog FolderYou can include an RSS feed option to a catalog folder that appears on an Oracle BI interactive dashboard page. Users must have the proper privilege to add the RSS feed option to a dashboard page’s catalog. The RSS Feeds privilege is granted by the Oracle BI Presentation Services Server administrator.
Oracle BI’s RSS feed option allows a user to access the dashboard’s catalog folder from an RSS 2.0 compatible reader that supports HTTP basic authentication. If the Oracle BI Presentation Server uses HTTPS protocol, the RSS Reader that you use must also support the HTTPS protocol. An RSS reader is a third-party program that allows the user to aggregate information from different web-based locations into one browser window (for example, news feeds or events listing).
When the RSS link is added to the dashboard’s catalog folder, an XML icon that provides the catalog’s URL appears for that folder. When a user accesses a catalog folder from an RSS reader, the reader prompts the user to log into the Oracle BI server.
For more information about adding a catalog folders to a dashboard page, see “Adding a View of a Presentation Catalog Folder to an Oracle BI Interactive Dashboard Page” on page 208.
To add an RSS feed option to a catalog folder
1 In the Dashboard Editor, click the Properties button for the folder to which you want to add an RSS feed option.
The Folder Properties page appears.
2 Select the Show RSS Link check box and click OK.
Adding Content Saved in the Presentation Catalog to an Oracle BI Interactive Dashboard PageYou can add content that you or someone else has already saved in a shared folder or dashboard, such as dashboard prompts and reports. To locate the content, you can browse by either the Presentation Catalog folder it is stored in, or by the dashboard it appears on.
To add saved content
1 From the selection pane, in the Saved Content area, navigate to the folder or dashboard that contains the content you want to add to the dashboard.
2 Locate the content that you want to add, and drag and drop it into a section in the dashboard page.
This adds a shortcut to the content as saved in the Presentation Catalog. If the content changes, the change will be reflected on the dashboard page.
For information about editing the properties of dashboard and reports, see “Editing the Properties of Oracle BI Interactive Dashboard Prompts and Reports” on page 211.
Oracle Business Intelligence Answers, Delivers, and Interactive Dashboards User Guide Version 10.1.3.2
Using Oracle BI Interactive Dashboards ■ Adding Content to an Oracle BI Interactive Dashboard
210
Adding an Oracle BI Publisher Report to an Oracle BI Interactive Dashboard PageThis section explains how to add and display an Oracle BI Publisher report on a dashboard using the Dashboard Editor. Dashboard pages can contain only one Oracle BI Publisher report.
NOTE: Dashboard modification is reserved for users with the appropriate permissions and responsibilities.
For more information about Oracle BI Publisher reports, see “Working with Oracle BI Publisher Reports” on page 220.
To add an Oracle BI Publisher Report to a dashboard page
1 In the dashboard page, click the Page Options button, and click Edit Dashboard...
The Dashboard Editor screen appears.
2 From the selection pane, drag and drop the BI Publisher Report object from the Dashboard Objects area into a section on the dashboard page.
3 Click the newly placed BI Publisher report object’s Properties button.
The BI Publisher Report Properties dialog box appears.
4 Click the Browse button and browse for and select the Oracle BI Publisher report. If a report has been run, the Pick BI Publisher Report dialog box will display the report as well as the report’s saved history. You can choose any historical instance of the Oracle BI Publisher report. Click OK.
NOTE: You can also add an Oracle BI Publisher report from a dashboard page. From the selection pane, drag and drop the BI Publisher Report object from the Dashboards folder in the Saved Content area.
5 Click one of the following options:
■ Embedded Content
This option displays the Oracle BI Publisher report directly in the dashboard. This option is selected by default for reports.
For more information about embedded content, see “Adding Embedded Content to an Oracle BI Interactive Dashboard Page” on page 205.
■ Link
The Oracle BI Publisher report is displayed as a link in the dashboard. When you click on the link, the report is displayed in a new browser window.
6 If you selected Embedded Content, you can specify the width and height dimensions for the content. The default height is 550px; however, you should adjust the height setting for the best display results. Note the following considerations:
■ If you do not specify a value, the system uses the default settings. If you have only specified one value, the system will use the default value for the non-specified value.
■ You can specify the value in either pixels (px) or percent (%). Since browsers cannot fully interpret percent values, only the width percentage is rendered. If you specify the height in percentage, the system will substitute 550 pixels for the height value.

Using Oracle BI Interactive Dashboards ■ Adding Content to an Oracle BI InteractiveDashboard
Oracle Business Intelligence Answers, Delivers, and InteractiveDashboards User Guide Version 10.1.3.2
211
■ If you do not specify either pixels or percent, the system interprets the value in pixels.
■ You can enter spaces within the value. For example, you can type either 500px or 500 px.
7 Select the View Latest Version if the report you have chosen is scheduled and you want the most recently generated version of the report to appear in the dashboard.
8 Click OK.
9 Click the Save button.
Controlling How Results Display When a User Drills on an Oracle BI Interactive DashboardWhen a user drills on a report, you can show the new results in one of the following ways:
■ Show the new results directly in the dashboard, replacing the original report. This is the default behavior. The area occupied by the original report resizes automatically to hold the new results.
■ Replace the entire dashboard with the new results.
This is controlled by the Drill in Place option. This option is set at the section level, which means that it applies to all drillable reports within the section. The user can click the browser's Back button to return to the original report or the dashboard.
To control how results display when a user drills■ Click the Properties button for the section and make your selection for the Drill in Place option:
■ To show the new results directly in the dashboard, click Drill in Place to select it. A check mark appears next to this option when it is selected. This is the default behavior.
■ To replace the dashboard with the new results, click Drill in Place to remove the check mark.
Editing the Properties of Oracle BI Interactive Dashboard Prompts and ReportsYou can edit the properties of dashboard prompts and reports added to a dashboard from the Presentation Catalog. This action saves any changes you made to the page you were working with.
To edit the properties of a dashboard prompt
1 Click the Properties button for the dashboard prompt and click Modify.
The Dashboard Prompt page appears.
2 Make your changes to the dashboard prompt.
For more information, click the Help button on the Dashboard Prompt page.
3 Click Save to save the dashboard prompt.

Oracle Business Intelligence Answers, Delivers, and Interactive Dashboards User Guide Version 10.1.3.2
Using Oracle BI Interactive Dashboards ■ Adding Content to an Oracle BI Interactive Dashboard
212
To edit the properties of a report
1 Click the Properties button for the report.
2 Select one of the following options:
■ Embed in section
This option executes the request automatically and displays the results directly in the dashboard, rather than displaying a link that users must click to execute the request and see the results. This option is selected by default for reports.
For more information about embedded content, see “Adding Embedded Content to an Oracle BI Interactive Dashboard Page” on page 205.
■ Show View
This option shows the available views of the report constructed in Oracle BI Answers. You can select the view you want to see.
■ Links
This option opens the Report Links dialog box, where you can select the links that you want to appear with the report on the dashboard page.
■ Modify
This option displays the Criteria tab in Oracle BI Answers, where you can modify the request that generates the report.
Renaming and Deleting Objects on an Oracle BI Interactive Dashboard Page Using the Dashboard EditorThis section explains how to rename and delete objects in an Oracle BI Interactive Dashboard. It contains the following topics:
■ “Renaming Objects on an Oracle BI Interactive Dashboard Page” on page 212
■ “Deleting Objects on an Oracle BI Interactive Dashboard Page” on page 213
Renaming Objects on an Oracle BI Interactive Dashboard PageObjects on a dashboard that do not already have a name are assigned a default name, such as Section 1, Link 1, and so on. You can rename objects to assign meaningful, descriptive names.
To rename an object
1 In the Dashboard Editor, click the Rename button for the object.
The Rename dialog box appears.
2 Type a new name for the object and click OK.
Using Oracle BI Interactive Dashboards ■ Adding Content to an Oracle BI InteractiveDashboard
Oracle Business Intelligence Answers, Delivers, and InteractiveDashboards User Guide Version 10.1.3.2
213
Deleting Objects on an Oracle BI Interactive Dashboard PageIf you add an object that you decide you do not want, you can delete it.
For objects saved in the Presentation Catalog, the object is deleted from the dashboard page only. It is not deleted from the Oracle BI Presentation Catalog. (Users with the appropriate permissions can edit the contents of the Presentation Catalog by clicking the Manage button on the Catalog tab in the selection pane in Oracle BI Answers.)
To delete an object on a dashboard page■ In the Dashboard Editor, click the Delete button for the object.
NOTE: When you delete a column, other columns on the page may resize automatically to maintain column alignment.
Modifying Oracle BI Interactive Dashboard Properties Using the Dashboard EditorThis section explains how to change the properties and printing options of the Oracle BI Interactive Dashboard. It contains the following topics:
■ “Changing Oracle BI Interactive Dashboard Properties” on page 213
■ “Changing PDF and Printing Options” on page 214
NOTE: PDF and printing options can also be set for views in Oracle BI Answers.
Changing Oracle BI Interactive Dashboard PropertiesYou can set properties for the entire dashboard, such as the style to use, and delete, reorder, and hide pages. Changing dashboard properties automatically saves any changes you made to the page you were working with.
To change dashboard properties
1 Click the Dashboard Properties button near the top of the Dashboard Editor:
The Dashboard Properties page appears.
Specify your choices. For information, click the Help button, or see “Changing the Properties of an Oracle BI Interactive Dashboard” on page 214.
2 When you are done, click the Finished button to return to the Dashboard Editor.
Oracle Business Intelligence Answers, Delivers, and Interactive Dashboards User Guide Version 10.1.3.2
Using Oracle BI Interactive Dashboards ■ Changing the Properties of an Oracle BI Interactive Dashboard
214
Changing PDF and Printing Options When printing a dashboard in Oracle BI Interactive Dashboards or a view in Oracle BI Answers, you can specify page settings and header and footer content for the PDF output. Dashboards and views are printed in Adobe Acrobat PDF format. Adobe Reader 6.0 or greater is required to print using Adobe PDF.
Header and footer formatting will appear in HTML and PDF output.
NOTE: The print selections you specify apply to PDF output only. If you then print the PDF on a local or network printer, the print selections specified in your browser are in effect, such as the selection for paper size.
To change PDF and print options
1 Click the PDF and Print Control Properties button near the top of the workspace:
The PDF and Print Control dialog box appears.
2 Make your selections for page settings.
3 To add a header or footer, select the appropriate option and click the Edit button.
4 Use the options in the dialog box to construct the header or footer.
Headers and footers may each contain up to three lines.
5 To apply cosmetic formatting to a header or footer element, click the cosmetic formatting button.
The common formatting dialog box appears. For more information, see “Applying Cosmetic Formatting to Results and Dashboards” on page 81.
6 Click OK when you are done.
Changing the Properties of an Oracle BI Interactive DashboardThis section explains how to use the Dashboard Properties page to display or modify the properties for a dashboard. It contains the following topics:
■ “Accessing the Dashboard Properties Page for an Oracle BI Interactive Dashboard” on page 215
■ “Selecting a Style for an Oracle BI Interactive Dashboard” on page 215
■ “Adding a Description for an Oracle BI Interactive Dashboard” on page 215
■ “Renaming, Deleting, Reordering, and Hiding an Oracle BI Interactive Dashboard Page” on page 215
NOTE: Dashboard modification is reserved for users with the appropriate permissions and responsibilities.
Using Oracle BI Interactive Dashboards ■ Changing the Properties of an Oracle BIInteractive Dashboard
Oracle Business Intelligence Answers, Delivers, and InteractiveDashboards User Guide Version 10.1.3.2
215
Accessing the Dashboard Properties Page for an Oracle BI Interactive DashboardThis section explains how to navigate to the Dashboard Properties page.
To access the Dashboard Properties page for a dashboard
1 Log in to Oracle BI and navigate to Oracle BI Interactive Dashboards.
2 At the top of the page, click the name of a dashboard whose properties you want to change.
The dashboard appears.
3 Click the Edit Dashboard link.
The Dashboard Editor appears.
4 Click the Dashboard Properties button near the top of the Dashboard Editor:
The Dashboard Properties page appears.
Selecting a Style for an Oracle BI Interactive DashboardStyles control how dashboards and results are formatted for display. Your Oracle BI administrator may have created styles that you can choose from. If not, results are formatted using a default style.
For more information about styles, see Oracle Business Intelligence Presentation Services Administration Guide.
To select a style for a dashboard■ In the General Properties area at the Dashboard Properties page, select the style to use from the
Style drop-down list.
Adding a Description for an Oracle BI Interactive DashboardDescriptions are displayed when Oracle BI administrators use the Catalog Manager. The description will not appear on the dashboard.
To add a description for a dashboard■ Type a description for the dashboard into the Description box at the Dashboard Properties page.
Renaming, Deleting, Reordering, and Hiding an Oracle BI Interactive Dashboard PageThis section provides procedures to rename, delete, reorder, and hide dashboard pages. The Dashboard Pages area of the Dashboard Properties page shows you the pages for the dashboard. The pages are listed in the same order as their tabs.
Oracle Business Intelligence Answers, Delivers, and Interactive Dashboards User Guide Version 10.1.3.2
Using Oracle BI Interactive Dashboards ■ Changing the Properties of an Oracle BI Interactive Dashboard
216
When you rename a dashboard, you can preserve users’ references to the dashboard that use the previous name. This creates a shortcut with the old name that points to the renamed dashboard in the Presentation Catalog.
If you are working with a dashboard page, you can hide it from users until your changes are complete.
CAUTION: The actions described in the following procedures will not be undone by clicking Cancel.
To rename a dashboard page■ Click the Rename button at the Dashboard Properties page to open the Rename Item page, and
follow the instructions given there.
To delete a dashboard page■ Click the Delete button at the Dashboard Properties page, and confirm the delete when
prompted.
To change permissions for the contents of a dashboard page■ Click the Security button at the Dashboard Properties page to open the Change Item Permissions
page, and follow the instructions given there.
NOTE: The Security button appears for shared dashboards only, and only if your user ID is authorized to access the security features.
To reorder a dashboard page■ To move a dashboard page up in the list, click the Move Up button at the Dashboard Properties
page.
On the dashboard, this moves the tab for the page to the left.
■ To move a page down in the list, click the Move Down button at the Dashboard Properties page.
On the dashboard page, this moves the tab for the page to the right.
To hide a dashboard page■ Click the Hidden option for the page at the Dashboard Properties page.
The page remains visible to any users currently viewing it.
Related Topic“Applying Cosmetic Formatting to Results and Dashboards” on page 81
Using Oracle BI Interactive Dashboards ■ Creating and Assigning Personal and SharedSaved Selections for an Oracle BI Interactive Dashboard Page
Oracle Business Intelligence Answers, Delivers, and InteractiveDashboards User Guide Version 10.1.3.2
217
Creating and Assigning Personal and Shared Saved Selections for an Oracle BI Interactive Dashboard PageSaved Selections allow users to view dashboard pages with their most frequently used or favorite choices for filters and prompts preselected, without the need to make choices manually for prompts and filters that appear on the dashboard. Users can save multiple view selections with different combinations of prompt and filter choices, and switch between them.
Multiple customized versions of a reusable dashboard can also be created using Saved Selections, and assigned to appropriate user groups. Users with the appropriate permissions can perform the following tasks to create, save, and assign view selections:
■ Save various combinations of choices for filters and prompts as view selections, for their personal use or use by others.
■ Specify which saved selection is the default view, for their personal use or use by others.
Example Scenarios for Creating and Using Saved SelectionsThis section describes two example scenarios that describe the creation and use of saved selections.
Scenario 1–Saved Selections Created by a Group for Use by OthersAn IT group in a consumer goods organization builds a master dashboard that contains the content that various product groups need to view. The dashboard contains filters and prompts from which members of the product groups would ordinarily make selections to view relevant results.
The master dashboard contains two reports, one that shows sales for the east, west, north, and south regions, and another that shows all products shipped in those regions. The report for sales by region contains a prompt that allows users to select their particular region. The report for all products shipped contains a filter that allows users to select their products.
An IT consultant customizes the view for the Fizzy Brands product group for each region. The consultant first selects the east region and the Fizzy Brand products from the filters and prompts on the dashboard, and then saves these choices as a selection that can be shared by other users. The consultant then assigns this selection as the default view selection to members of the east region group that sells Fizzy Brand products. The consultant repeats this process for the west, north, and south regions.
When a Fizzy Brands sales representative for the western region logs in to Oracle BI and views the dashboard, the representative initially views sales and shipment information based on the region and product choices assigned as the default view selection for that group. All sales representatives in that group who would typically make identical choices for region and product no longer have to do so.

Oracle Business Intelligence Answers, Delivers, and Interactive Dashboards User Guide Version 10.1.3.2
Using Oracle BI Interactive Dashboards ■ Creating and Assigning Personal and Shared Saved Selections for an Oracle BI Interactive Dashboard Page
218
Scenario 2–Saved Selections Created for Use by an Individual UserA business user’s dashboard contains two reports, one that shows sales for all regions, and another that shows all products shipped. Each report contains a prompt, allowing the user to select a particular region and product. The user selects the eastern region and the Fizzy Brands product. The dashboard refreshes to show the user this view of the data. The user saves this view as a selection, indicates that the selection is for personal use, and that it is the default selection the user wants to see when viewing the dashboard. Then, this user creates additional combinations of the product and region sets in which the user is most interested, and saves them for later retrieval.
The user can also access selections that were saved by the IT group as shared selections. To view sales in the western region for Fizzy Brands, the user clicks the Page Options button, clicks Saved Selections, and selects the view named Dollar Sales, Western Region, Fizzy Brands. The dashboard refreshes with the new view of the data.
Accessing the Saved Selection OptionsFor users with the appropriate permissions, a Page Options button appears on the dashboard that replaces the Dashboard Editor link. (Access to the Dashboard Editor is one of the selections available from the Page Options menu.)
To access the saved selections menu■ Click the Page Options button.
NOTE: The choices available to you depend on your permission settings in Oracle BI Presentation Services administration.
To access the Dashboard Editor■ Click the Page Options button on the dashboard page and choose Edit Dashboard.
The Dashboard Editor appears. For more information, see “Adding Content to an Oracle BI Interactive Dashboard” on page 196.
To save a selection for your personal use or for use by others
1 Make your choices for prompts and filters in the dashboard.
2 Click the Page Options button on the dashboard page and perform one of the following actions:
■ To save the selection for your personal use, choose Save Current Selections > For Me.
■ To save the selection for use by others, choose Save Current Selections > For Others.
3 Type a descriptive name for the selection or use the default name.
4 (Optional) To assign this selection as your default selection, select the default option.
5 (Optional) If you have the requisite permissions to a shared Saved Selection, you can also specify access now by clicking the Set Permissions button.

Using Oracle BI Interactive Dashboards ■ Creating and Assigning Personal and SharedSaved Selections for an Oracle BI Interactive Dashboard Page
Oracle Business Intelligence Answers, Delivers, and InteractiveDashboards User Guide Version 10.1.3.2
219
To apply Saved Selections
1 Click the Page Options button on the dashboard page and choose Apply Saved Selections.
Your personal Saved Selections, if any, are shown at the beginning of the list. Shared Saved Selections are listed next. Your current default selection is shown in bold type.
2 Click a Saved Selection in the list to apply it to the underlying dashboard.
To create or change a personal Saved Selection default view
1 Click the Page Options button on the dashboard page and choose Save Current Selections > Edit Saved Selections and Defaults.
2 Click the radio button next to any Saved Selection to assign it as your default selection.
The default selection is shown in bold type.
3 Click OK when you are done.
To restore the basic dashboard as your default view
1 Click the Page Options button on the dashboard page and choose Save Current Selections > Edit Saved Selections and Defaults.
2 Click the option at the top of the list to use the unmodified dashboard.
3 Click OK when you are done.
To rename or delete a Saved Selection
1 Click the Page Options button on the dashboard page and choose Save Current Selections > Edit Saved Selections and Defaults.
2 Locate the selection you want to rename or delete and click the appropriate button.
3 Click OK when you are done.
To share a Saved Selection or assign it as the default selection for others
1 Click the Page Options button on the dashboard page and choose Save Current Selections > Edit Saved Selections and Defaults.
2 In the Shared Selections area, locate the selection you want to assign as the default Saved Selection for others and click the security button.
3 Move a group to the Groups with Permission area to share it with that group.
4 Check the box next to a group to make this Saved Selection the default selection.
5 Click OK when you are done.
Oracle Business Intelligence Answers, Delivers, and Interactive Dashboards User Guide Version 10.1.3.2
Using Oracle BI Interactive Dashboards ■ Accessing Another Oracle BI User’s Account
220
Accessing Another Oracle BI User’s AccountThe Act As functionality allows you to access another user’s reports and dashboards. To access another user’s account, the administrator must give you permission to access that user’s account and assign you an access type (full or restricted). An access type determines whether you can view or make changes to the user’s account.
When you are granted full access to another user’s account, you inherit the target user’s privileges and can change the user’s default dashboard and modify the user’s content and preferences. When you are granted restricted access to another user’s account, you maintain your user privileges, but inherit the target user’s permission for viewing data. Restricted access only allows you to view the user’s data.
The Act As functionality can be used by technical support for troubleshooting purposes or by any user who needs to view information that resides on another user’s reports or dashboards.
You can view a list of the users with access to your account by opening the My Account page and scrolling to the Delegated Users section. This section contains the name and access type of each user that has been given access to your reports and dashboards.
To access another user’s reports and dashboards
1 Login to Oracle BI.
2 Click the Settings link and choose Act As.
The Act As dialog box appears.
3 To access another user’s account, select a user’s name from the User drop-down list and click OK.
NOTE: Based on the system settings, a text box might appear in the Act As dialog box. Generally, this text box appears if a long list of users is returned. In this text box you must type the ID of the user that you want to act as.
The user’s default dashboard appears. From this dashboard you can view or modify content, depending upon the access type that you were granted by the administrator.
4 To return to your account, access the Act As dialog box and click Stop.
Working with Oracle BI Publisher ReportsOracle BI Publisher creates highly formatted, printable reports. Oracle BI Publisher is integrated with Oracle Business Intelligence, and you access Oracle BI Publisher from the Oracle BI Answers, Delivers, and Interactive Dashboards application. BI Publisher reports are built directly against a subject area available from the Oracle BI Server, or reports can be based on an Answers request. BI Publisher reports can be added to Dashboard pages. BI Publisher and Oracle BI integration also provides single sign-on capability so that when users log into the Oracle BI, they are also simultaneously logged into the Oracle BI Publisher application.

Using Oracle BI Interactive Dashboards ■ Working with Oracle BI Publisher Reports
Oracle Business Intelligence Answers, Delivers, and InteractiveDashboards User Guide Version 10.1.3.2
221
If your organization uses Oracle BI Publisher, you can run, view, and interact with an Oracle BI Publisher report in a dashboard page. When included on a dashboard page, the Oracle BI Publisher toolbar offers the option to select a layout template, change the Oracle BI Publisher report’s output format, export the Oracle BI Publisher report, send the Oracle BI Publisher report to an available destination (for example, printer, fax, email, or FTP), schedule the Oracle BI Publisher report, and analyze the data.
NOTE: A dashboard page can only contain one Oracle BI Publisher report. Also, Oracle BI Publisher reports cannot be created or modified in Oracle BI Answers, used in Oracle BI Delivers, or saved in Oracle BI Briefing Books. The Add to Briefing Books and Printer Friendly buttons are disabled for a dashboard page that displays an Oracle BI Publisher report.
Within Oracle BI Publisher, you can also view and schedule reports, as well as launch BI Publisher Analyzer for Excel, develop report queries and data models, translate reports, and perform Oracle BI Publisher-related administrative tasks.
Use Oracle BI Publisher to create and save an Oracle BI Publisher report to the report repository. To add an Oracle BI Publisher report to a dashboard, you must browse to the repository and select the Oracle BI Publisher report.
For more information about creating or scheduling an Oracle BI Publisher report, see the Oracle Business Intelligence Publisher User Guide
This section contains the following topics:
■ “Accessing Oracle BI Publisher” on page 221
■ “Selecting an Oracle BI Publisher Report for a Dashboard Page” on page 221
■ “Using the Oracle BI Publisher Toolbar on a Dashboard Page” on page 222
■ “Using Dashboard Prompts with Parameterized Oracle BI Publisher Reports” on page 223
NOTE: For information about adding an Oracle BI Publisher report to a dashboard page, see “Adding and Displaying Content in an Oracle BI Interactive Dashboard Page Using the Dashboard Editor” on page 200.
Accessing Oracle BI PublisherYou can access the Oracle BI Publisher application from the Oracle BI Answers, Delivers, and Dashboards application.
For more information about using Oracle BI Publisher, see the Oracle Business Intelligence Publisher User Guide.
■ From the Oracle BI screen, click More Products and select BI Publisher.
The Oracle BI Publisher application appears in a new browser window.
Selecting an Oracle BI Publisher Report for a Dashboard PageSince reports may be scheduled, you might want to choose a specific run of the report that you want to include on the dashboard. The report run that you select also determines whether dashboard prompts can be used.

Oracle Business Intelligence Answers, Delivers, and Interactive Dashboards User Guide Version 10.1.3.2
Using Oracle BI Interactive Dashboards ■ Working with Oracle BI Publisher Reports
222
When a report that is not scheduled or has no previous history is included on the dashboard, the report will be executed and generated when you access the dashboard page. You can use the dashboard prompts to re-generate the report and display updated data.
When adding a report that is scheduled or has historical runs to a dashboard, you may specify either a specific historical run of the report or the latest version of the report. Since this report has been run via the scheduler, you cannot use the dashboard prompts to regenerate the report from the dashboard.
NOTE: For information about adding an Oracle BI Publisher report to a dashboard page, see “Adding and Displaying Content in an Oracle BI Interactive Dashboard Page Using the Dashboard Editor” on page 200.
Using the Oracle BI Publisher Toolbar on a Dashboard PageThe Oracle BI Publisher toolbar appears on the dashboard containing an Oracle BI Publisher report. The options that are presented to the user depend upon the user’s permissions.
To use the Oracle BI Publisher toolbar on a dashboard page■ Access the dashboard containing the Oracle BI Publisher report that you want to view. For more
information about the various functions, see the Oracle Business Intelligence Publisher User Guide.
The toolbar functions are described in the following table:
Function Description
Template If multiple report templates are available they will display in the Template list. Select a new template and then click View.
Output Type If multiple output types are available, select the desired output type (HTML, PDF, RTF, Excel, data) from the list and click View. The output will be rendered in your browser.
View Select a template or specify an output type and click this button to view the Oracle BI Publisher report.
Export When you click this button, you are prompted to save the Oracle BI Publisher report or to open the appropriate application for the output type.
Send When you click this button, the Destination dialog screen appears. From this screen, select the delivery destination (for example, Email, Printer, Fax, FTP, or Web Folder) and enter the appropriate information. You can select multiple delivery destinations.
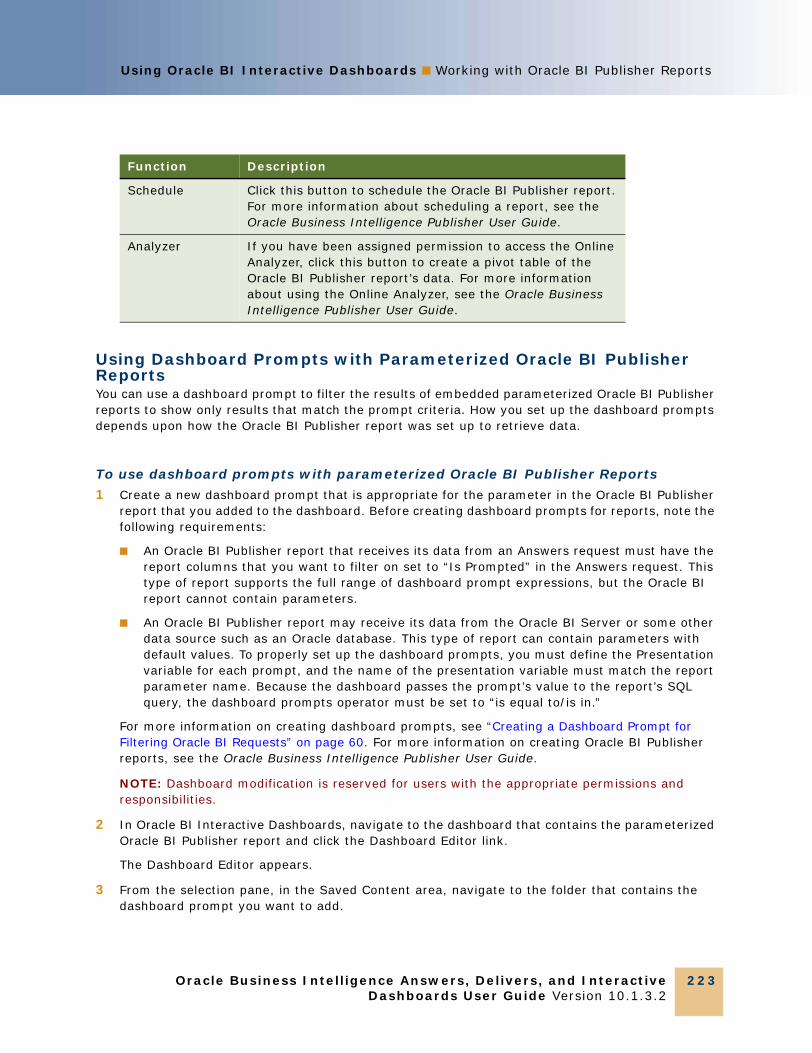
Using Oracle BI Interactive Dashboards ■ Working with Oracle BI Publisher Reports
Oracle Business Intelligence Answers, Delivers, and InteractiveDashboards User Guide Version 10.1.3.2
223
Using Dashboard Prompts with Parameterized Oracle BI Publisher ReportsYou can use a dashboard prompt to filter the results of embedded parameterized Oracle BI Publisher reports to show only results that match the prompt criteria. How you set up the dashboard prompts depends upon how the Oracle BI Publisher report was set up to retrieve data.
To use dashboard prompts with parameterized Oracle BI Publisher Reports
1 Create a new dashboard prompt that is appropriate for the parameter in the Oracle BI Publisher report that you added to the dashboard. Before creating dashboard prompts for reports, note the following requirements:
■ An Oracle BI Publisher report that receives its data from an Answers request must have the report columns that you want to filter on set to “Is Prompted” in the Answers request. This type of report supports the full range of dashboard prompt expressions, but the Oracle BI report cannot contain parameters.
■ An Oracle BI Publisher report may receive its data from the Oracle BI Server or some other data source such as an Oracle database. This type of report can contain parameters with default values. To properly set up the dashboard prompts, you must define the Presentation variable for each prompt, and the name of the presentation variable must match the report parameter name. Because the dashboard passes the prompt’s value to the report’s SQL query, the dashboard prompts operator must be set to “is equal to/is in.”
For more information on creating dashboard prompts, see “Creating a Dashboard Prompt for Filtering Oracle BI Requests” on page 60. For more information on creating Oracle BI Publisher reports, see the Oracle Business Intelligence Publisher User Guide.
NOTE: Dashboard modification is reserved for users with the appropriate permissions and responsibilities.
2 In Oracle BI Interactive Dashboards, navigate to the dashboard that contains the parameterized Oracle BI Publisher report and click the Dashboard Editor link.
The Dashboard Editor appears.
3 From the selection pane, in the Saved Content area, navigate to the folder that contains the dashboard prompt you want to add.
Schedule Click this button to schedule the Oracle BI Publisher report. For more information about scheduling a report, see the Oracle Business Intelligence Publisher User Guide.
Analyzer If you have been assigned permission to access the Online Analyzer, click this button to create a pivot table of the Oracle BI Publisher report’s data. For more information about using the Online Analyzer, see the Oracle Business Intelligence Publisher User Guide.
Function Description
Oracle Business Intelligence Answers, Delivers, and Interactive Dashboards User Guide Version 10.1.3.2
Using Oracle BI Interactive Dashboards ■ Working with Oracle BI Briefing Books
224
4 Drag and drop the dashboard prompt into the section in the dashboard page that contains the Oracle BI Publisher report.
5 Click the Save button.
Working with Oracle BI Briefing BooksIf your organization licensed Oracle BI Briefing Books, you can store a static snapshot of dashboard pages or individual requests in one or more briefing books. You can then download and share briefing books for viewing offline. Briefing books and their content can also be updated, scheduled, and delivered using Oracle BI Delivers.
NOTE: Oracle BI Publisher reports cannot be saved in briefing books.
The following topics explain how to work with briefing books.
■ “Creating an Oracle BI Briefing Book” on page 224
■ “Adding Content to an Oracle BI Briefing Book” on page 225
■ “Editing, Downloading, or Printing an Oracle BI Briefing Book” on page 226
■ “Using Oracle BI Delivers to Deliver an Oracle BI Briefing Book” on page 227
■ “Viewing an Oracle BI Briefing Book” on page 227
Creating an Oracle BI Briefing BookThe following procedure explains how to create a briefing book.
To create an Oracle BI Briefing Book
1 Navigate to a dashboard in Oracle BI Interactive Dashboards and then perform one of the following actions:
■ Click the Add to Briefing Book button, located near the bottom of the dashboard page.
NOTE: This button is not available on an empty dashboard page.
■ Click the Add to Briefing Book link that appears with an individual request on the dashboard.
The Save Briefing Book Content page appears.
2 Click the following button:
Create New Briefing Book
The Create New Briefing Book page appears.

Using Oracle BI Interactive Dashboards ■ Working with Oracle BI Briefing Books
Oracle Business Intelligence Answers, Delivers, and InteractiveDashboards User Guide Version 10.1.3.2
225
3 Type a name and a description for the briefing book, and then save the briefing book.
The briefing book appears in the Current Briefing Books list at the Save Briefing Book Content page.
4 Click the Cancel button to return to Oracle BI Interactive Dashboards.
This creates an empty briefing book. The briefing book folder appears in the selection pane in Oracle BI Answers and Oracle BI Delivers.
5 To add additional briefing books, click the Add to Briefing Book link or button, and then create them using the preceding steps.
Adding Content to an Oracle BI Briefing BookUse the following procedure to add the content of a dashboard page or an individual request to a briefing book.
To add content to an Oracle BI Briefing Book
1 Navigate to Oracle BI Interactive Dashboards and then perform one of the following actions:
■ To add the contents of a dashboard page to a briefing book, navigate to the dashboard and click the Add to Briefing Book button:
■ To add the results of an individual request to a briefing book, locate the request on the dashboard and click the following link:
Add to Briefing Book
NOTE: This link appears only if the request was added to the dashboard with the option to show the link Add to Briefing Book.
The Save Briefing Book Content page appears.
2 Choose the briefing book from the Current Briefing Books drop-down list.
3 Make your selections for the Save Options area.
a For Content Type, choose one of the following options:
❏ Snapshot. This adds the content in its current state. Snapshot content preserves the original data and is not updated when the briefing book is rerun. Snapshot content will not be updated using Oracle BI Delivers.
❏ Updatable. The content is refreshed whenever the briefing book is downloaded, or when it is specified as the delivery content for an iBot in Oracle BI Delivers.
b For Follow Briefing Book Navigation Links, choose one of the following options:
❏ No. Briefing book navigation links will not be followed.
❏ Yes. Briefing book navigation links will be followed.
Oracle Business Intelligence Answers, Delivers, and Interactive Dashboards User Guide Version 10.1.3.2
Using Oracle BI Interactive Dashboards ■ Working with Oracle BI Briefing Books
226
c If you specified Yes for Briefing Book Navigation Links, choose the number of links to follow in the briefing book.
The default value for the maximum number of links to follow is 5.
NOTE: A briefing book navigation link is a special type of link that can be added to a dashboard using the Dashboard Editor. When a briefing book navigation link is found in content included in a briefing book, the destination content for that link is also included in the briefing book. For more information, see “Adding a Briefing Book Navigation Link to an Oracle BI Interactive Dashboard Page” on page 201.
Editing, Downloading, or Printing an Oracle BI Briefing BookA saved briefing book is shown in the selection pane in Oracle BI Answers and Oracle BI Delivers. On the Catalog tab, the briefing book is shown in the My Briefing Books list. In the Presentation Catalog, briefing books are saved in the _briefingbook folder.
You can reorder and delete briefing book content, change the properties for the content type and briefing book navigation links, print the briefing book, and download the briefing book to your computer. You can also add a list of your briefing books to your dashboard page.
To edit, download, or print an Oracle BI Briefing Book
1 Access your corporate network and log in to Oracle BI.
2 Navigate to the briefing book in the selection pane in Oracle BI Answers, and then click it.
The right pane displays the contents of the briefing book.
3 To reorder content, click the Move Up and Move Down arrows.
4 To delete content, click the Delete button.
5 To change the content type, navigation link properties, or the description, click the Properties button.
The Page Properties dialog box appears.
6 Make any desired changes for the content type, briefing book navigation links, and the description, and then click OK.
7 To download the briefing book, click the Get Now button and specify the location in which to save it.
Downloaded briefing books are saved with an .ssb file extension. You can then email or share the briefing book.
NOTE: The Oracle Business Intelligence Briefing Book Reader application is required to view a downloaded briefing book. For more information, see “Viewing an Oracle BI Briefing Book” on page 227.

Using Oracle BI Interactive Dashboards ■ Working with Oracle BI Briefing Books
Oracle Business Intelligence Answers, Delivers, and InteractiveDashboards User Guide Version 10.1.3.2
227
8 To generate a PDF of the briefing book, click the Print Now button.
The system generates a PDF file, which appears in the right pane. From this pane you can click the icon to print the briefing book.
NOTE: The Adobe Reader application is required to view or print a briefing book PDF.
9 When you are done, click the Finished button to save any properties you changed.
To add a list of your briefing books to your dashboard page
1 Navigate to Oracle BI Interactive Dashboards and click the Edit Dashboard link.
The Dashboard Editor page appears.
2 From the Dashboard Objects list, drag and drop a folder object into a section.
3 Click the Properties button for the folder.
The Folder Properties dialog box opens.
4 Browse to locate the folder labeled My Folder, click the folder _briefingbook, and then click OK to return to the Folder Properties dialog box.
5 Click OK, and then click the Save button.
A folder labeled My Briefing Books is added to your dashboard:
■ To see a list of your briefing books, click the folder.
■ To edit the properties of a briefing book, click its link.
Using Oracle BI Delivers to Deliver an Oracle BI Briefing BookIf your organization licensed Oracle BI Delivers, you can use Oracle BI Delivers to specify a briefing book as the delivery content for an iBot.
To use Oracle BI Delivers to update briefing book content
1 Navigate to Oracle BI Delivers, and create or modify an appropriate iBot.
2 At the Delivery Content tab, click the Select Content button and navigate to the briefing book to which you want content delivered.
When the iBot runs, the updatable content in the briefing book is delivered.
Viewing an Oracle BI Briefing BookUse the Oracle BI Briefing Book Reader application to view downloaded briefing books. Consult your Oracle BI administrator if you need the Oracle BI Briefing Book Reader application.

Oracle Business Intelligence Answers, Delivers, and Interactive Dashboards User Guide Version 10.1.3.2
Using Oracle BI Interactive Dashboards ■ About Guided Navigation in Oracle BI
228
To view an Oracle BI Briefing Book
1 Click the briefing book to open it.
NOTE: Briefing books have an .sbb file extension.
This launches the Oracle BI Briefing Book Reader application. The briefing book opens in the browser.
2 Use the arrows or the menu options to navigate the content.
If briefing book navigation links were included, you can also click them to navigate.
About Guided Navigation in Oracle BIGuided navigation can aid users' insight into business issues and appropriate actions to take by guiding their exploration of results obtained from Oracle BI Answers. When based on common scenarios and best practices for your industry or organization, guided navigation allows users to see and analyze related issues by navigating to a related set of results, another dashboard, or a URL. Guided navigation is specified using the Dashboard Editor.
There are three types of guided navigation:
■ Guided navigation using static links. When specified for a request, the results on the dashboard always include a link to another request, a dashboard, or URL. For example, a report that shows customer satisfaction gap trends can always appear with a link to a report that shows customer satisfaction by product line.
■ Guided navigation using conditional links. When specified for a request, a link to another request, dashboard, or URL appears only if the results meet certain criteria. For example, if the number of open critical service requests exceeds a certain threshold, the result set can include a link to a report that shows customer satisfaction by employee.
■ Guided navigation using conditional sections. Entire dashboard sections can appear based upon the results returned by Oracle BI Answers for a particular request. For example, if the results show that sales are down by 15 percent or greater in the past week, a dashboard section that contains links to related reports and tools can appear.
The display of static links does not generally affect dashboard rendering time. The display of numerous conditional links or sections can affect dashboard rendering time.
For information about the Dashboard Editor, see “Adding Content to an Oracle BI Interactive Dashboard” on page 196.

Oracle Business Intelligence Answers, Delivers, and InteractiveDashboards User Guide Version 10.1.3.2
229
9 Managing Content in the Oracle BI Presentation Catalog
This chapter provides information about managing content in the Oracle BI Presentation Catalog. It contains the following topic:
■ “Managing Folders and Content in the Oracle BI Presentation Catalog” on page 229
■ “Editing Names and Descriptions of Objects in the Oracle BI Presentation Catalog” on page 232
■ “Copying or Moving Folders or Items in the Oracle BI Presentation Catalog” on page 233
Managing Folders and Content in the Oracle BI Presentation CatalogUse the Manage Catalog feature to edit, rename, set permissions for, and delete folders and items.
The Presentation Catalog holds the content created with Oracle BI Answers, Oracle BI Delivers, Oracle BI Interactive Dashboards, and other Analytics-based applications. Content is organized into folders that are either shared or personal. Types of content that can be stored in the catalog include requests and results from Oracle BI Answers, and items created using the Oracle BI Interactive Dashboards Editor, such as HTML content, plain text, and links to other images, documents, and sites.
If the Show Hidden Items check box appears at the bottom of the page, you can select this check box to see hidden folders: _Portal, _Filters, _Prefs, _Alerts, _iBots, and _Delivers. Whether this option is available depends on the setting for the "See Hidden Items" privilege in the Catalog section of the Privilege Administration page.
What you see in the Manage Catalog page depends on the security settings specified for you by your site's administrator and the Analytics product that you are using. For example, you might see the folders and contents in your personal dashboard, and any shared folders and items that you have the authority to work with. The administrator controls who can change permissions on catalog objects through the "change permissions" privilege in the Admin: Catalog section of the Privilege Administration page.
This section explains how to work with folders and content. It contains the following topics:
■ “Accessing Folders in the Oracle BI Presentation Catalog” on page 230
■ “Working with the Properties of an Item or a Folder in the Oracle BI Presentation Catalog” on page 230
■ “Assigning Permissions to Items in the Oracle BI Presentation Catalog” on page 231
■ “Archiving the Oracle BI Presentation Catalog” on page 231
■ “Deleting a Folder or Item from the Presentation Catalog” on page 232

Oracle Business Intelligence Answers, Delivers, and Interactive Dashboards User Guide Version 10.1.3.2
Managing Content in the Oracle BI Presentation Catalog ■ Managing Folders and Content in the Oracle BI Presentation Catalog
230
Accessing Folders in the Oracle BI Presentation CatalogThis section provides procedures to locate, view, and create folders.
To locate folders■ Click the My Folders link to work with your personal folders and their contents.
or
Click the Shared Folders link to work with the shared folders and items that you have permission to access.
To create a new folder■ Click the Create New Folder link and follow the instructions on the page.
To view folder contents■ Click the name of the folder.
Working with the Properties of an Item or a Folder in the Oracle BI Presentation CatalogUsers with the appropriate permissions can view the properties of an item or folder. Properties include the item or folder’s path, created, modified, and accessed dates, and attributes. A user can also view the item or folder’s current owner, as well as take ownership of the item.
To work with the properties of an item or a folder
1 In Oracle BI Answers, click the Manage Catalog button on the Catalog tab in the selection pane.
NOTE: The Manage Catalog button is available to the Administrator user ID and to users with appropriate permissions.
The Manage Catalog page appears.
2 Click the Properties button next to the item or folder.
The Item Properties page appears. At this page, you can view general information about the folder or item, such as its type, location and path, as well as historical usage information, ownership, other attributes, and an XML button and URL that are used to build an RSS feed to the folder.
3 If you have the appropriate authority, you can take ownership of the item or folder by clicking the Take Ownership of this item link or the Take Ownership of this item and all subitems link in the Ownership area.

Managing Content in the Oracle BI Presentation Catalog ■ Managing Folders andContent in the Oracle BI Presentation Catalog
Oracle Business Intelligence Answers, Delivers, and InteractiveDashboards User Guide Version 10.1.3.2
231
Assigning Permissions to Items in the Oracle BI Presentation CatalogUsers with the appropriate permissions can delete existing permissions or assign new permissions to an item. Before permissions can be assigned, they must be set up in the Oracle BI Presentation Server.
NOTE: For more information about assigning permissions, go to the Change item Permissions page and click the help button, or see the Oracle Business Intelligence Presentation Services Administration Guide.
To change permissions for a shared folder and its items
1 In Oracle BI Answers, click the Manage Catalog button on the Catalog tab in the selection pane.
NOTE: The Manage Catalog button is available to the Administrator user ID and to users with appropriate permissions.
The Manage Catalog page appears.
2 Click the Change Permissions button next to the folder.
The Change Item Permissions page appears.
3 Make your changes at the Change Item Permissions page and click the Finished button.
Archiving the Oracle BI Presentation CatalogUsers with the appropriate permissions can archive a specific folder or the entire presentation catalog. When creating the archive, you can choose to keep the permissions and timestamps for the items and folders.
NOTE: Only administrators can unarchive an archived presentation folder or catalog.
To archive a folder or the catalog
1 In Oracle BI Answers, click the Manage Catalog button on the Catalog tab in the selection pane.
NOTE: The Manage Catalog button is available to the Administrator user ID and to users with appropriate permissions.
The Manage Catalog page appears.
2 To archive the whole presentation catalog, locate the archive catalog section of the page. To archive a specific folder, browse to the folder that you want to archive and locate the archive catalog section of the page.
3 Select the Keep Permissions checkbox if you want to archive the permissions that are assigned to each item within the presentation catalog or folder.
If you do not select this option, the archiving process will not include any permissions. Upon unarchiving, the system will assign the parent folder’s permissions to all of the items and folders.
Oracle Business Intelligence Answers, Delivers, and Interactive Dashboards User Guide Version 10.1.3.2
Managing Content in the Oracle BI Presentation Catalog ■ Editing Names and Descriptions of Objects in the Oracle BI Presentation Catalog
232
4 Select the Keep Timestamp checkbox if you want to archive the timestamps that are assigned to the item and folder that you are archiving. If you do not select this option, the archiving process will not include timestamp information. Upon unarchiving, the system will apply a timestamp indicating the time at which the item or folder was unarchived.
5 Click the Archive Catalog button.
The File Download page appears.
6 Click Save.
The Save As page appears.
7 Specify the location to which you want to save the archive file. Click Save.
Deleting a Folder or Item from the Presentation CatalogUsers with the appropriate permissions can delete a folder or item from the Presentation Catalog.
To delete a folder or an item
1 In Oracle BI Answers, click the Manage Catalog button on the Catalog tab in the selection pane.
NOTE: The Manage Catalog button is available to the Administrator user ID and to users with appropriate permissions.
The Manage Catalog page appears.
2 Click the Delete button next to the folder or item you want to delete.
The Confirm Item Deletion page appears.
3 When deleting shared folders or items, be aware that other users who have added shared items such as requests to their Quick Answers list, or HTML content, links, requests, and so on, to their personal Dashboards will no longer have access to them.
4 To confirm the delete, click Yes.
Editing Names and Descriptions of Objects in the Oracle BI Presentation CatalogUsers with the appropriate permissions can use the Manage Catalog feature to edit the names and descriptions of objects in the Oracle BI Presentation Catalog. If you rename an object, you can maintain references to the previous name to prevent possible broken links. This creates a shortcut to the renamed object using the previous name.
Managing Content in the Oracle BI Presentation Catalog ■ Copying or Moving Foldersor Items in the Oracle BI Presentation Catalog
Oracle Business Intelligence Answers, Delivers, and InteractiveDashboards User Guide Version 10.1.3.2
233
To edit the name and description of an object in the Presentation Catalog
1 In Oracle BI Answers, click the Manage Catalog button on the Catalog tab in the selection pane.
NOTE: The Manage Catalog button is available to the Administrator user ID and to users with appropriate permissions.
The Manage Catalog page appears.
2 Locate the object that you want to edit and click the following button:
Edit Name and Description
3 Type a new name for the object in the Name text box.
4 To maintain references to the object that use the previous name, click the following option:
Preserve reference to old name of this item
This creates a shortcut with the old name, pointing to the renamed object.
5 Type an optional description in the Description text box.
6 Click Rename.
Copying or Moving Folders or Items in the Oracle BI Presentation CatalogUsers with the appropriate permissions can choose to copy or move an item to a new location.
To copy or move a folder or item
1 In Oracle BI Answers, click the Manage Catalog button on the Catalog tab in the selection pane.
NOTE: The Manage Catalog button is available to the Administrator user ID and to users with appropriate permissions.
The Manage Catalog page appears.
2 Click the Copy/Move button next to the folder or item you want to copy or move.
The Copy/Move page appears.
3 Click the folder to which you want to copy or move the folder or item. If you are moving the folder or item, select the Move Item checkbox.
NOTE: When you copy a folder or item, it is copied to the new location and also remains in its original location. Modifying one instance of the folder or item does not modify both instances of the folder or item.

Oracle Business Intelligence Answers, Delivers, and Interactive Dashboards User Guide Version 10.1.3.2
Managing Content in the Oracle BI Presentation Catalog ■ Copying or Moving Folders or Items in the Oracle BI Presentation Catalog
234
Oracle Business Intelligence Answers, Delivers, and InteractiveDashboards User Guide Version 10.1.3.2
235
Index
Aaccessing
another user’s account 220Oracle BI 13Oracle BI Delivers 164Oracle BI Publisher 221stand-alone Oracle BI 14
account settingsdisplaying for My Account page 23
accountsaccessing another user’s account 220create target list view, creating list of
accounts 159Adobe PDF
dashboard page, changing PDF options 214print view, using to 92print, using to 16
Advanced tababout 32
aggregation rulesoverriding default rules in pivot tables 128
alertsaccessing 189adding RSS feed 189note, about adding to My Dashboard
automatically 199note, about placement using iBots 197
Answerscolumn filter prompt, modifying
properties 58column filter, removing 54pages, display of 22
archivingnote, *.mht files 17presentation catalog 231
attachmentsadding text message iBot context 176adding variables to iBot context 176
axescolumns, selecting to display as axes 116scaling options, setting 116titles and labels, specifying in chart view 119
Bbar gauge 138Briefing Book
content, adding 225
content, editing, downloading, and printing 226
creating 224dashboard page, adding list of books to 227navigation link, adding to dashboard
page 201selection pane, refresh information 36updating using Oracle BI Delivers 227viewing a book 227
bulb gauge 138
Ccaches
about 18calculations
examples 136pivot tables, building calculations 134pivot tables, using in 133
Catalog Manageradding description to a dashboard 215
chart viewabout 88adding or modifying chart view 112axes, selecting the columns to display as 116axis scaling options, setting 116axis titles and labels, specifying in chart
view 119buttons, description of 111chart graph types 108chart properties, specifying 113colors, background, text, and borders,
specifying 115gauge types 137grid lines, controlling display of colors 114legend, specifying location 115results, about showing in 107user interaction, specifying 120
column filtercharacteristics 47combining with other column filters 55editing 54Oracle BI Answers, creating in 48Oracle BI Answers, removing in 54Oracle BI Answers, saving in 52request, removing from 55request, saving as part of 52SQL, editing for a request 64

Oracle Business Intelligence Answers, Delivers, and Interactive Dashboards User Guide Version 10.1.3.2
Index ■ C
236
using, about and elements 47Where clause, about translating into 47
column filter promptcolumn filter prompt, deleting 58execution order, moving up or down 58properties, modifying 58request, adding to 56
column formulaediting 103
column property settingssaving as system-wide defaults 75
column selector viewabout 89requests, allowing users to change columns
in 144columns
axes, selecting the columns to display as 116caution, clicking Refresh button 48clicking column, specifying what happens 70column content, formatting in Oracle BI
Answers 71column contents, editing the appearance 67column filter characteristics 47column filter, about translating into WHERE
clause 47column filter, about using and elements 47column filter, combining with other column
filters 55column filter, creating in Oracle BI
Answers 48column filter, editing 54column filter, removing from a request 55column filter, removing in Oracle BI
Answers 54column filter, saving as part of request 52column filter, saving in Oracle BI Answers 52column formatting functions, about using 67column formula, editing 103column layout, editing 69column property settings, saving as system-
wide defaults 75conditional formatting, applying to column
content 73conditional formatting, example of
applying 75custom table and column heading,
creating 70dashboard page, about working with
columns 198dashboard page, adding a new column 198dashboard page, adding section to 199dashboard page, breaking a column 198dashboard page, setting column width 198duplicate data, suppressing 70
Edit Formula button, about 34Filter By Column button, about 34Format Column button, about 34including TimeZone icon 70operators, list of and usage guidelines 49Remove Column button, about 34requests, sorting by 35results, hiding in 69saved column filter, applying to request 53saved filter, displaying properties 53tip, adding filter for 48
componentslist of 11
compound layout viewabout 87another view, accessing from 95dashboard, accessing on 96properties, using to edit 98view, using to add 96view, using to delete 97view, using to rearrange 97
conditionaldashboard page content, making appear
conditionally 200iBot recipients, allowing to be determined by
results 171links, about 201
conditional formattingcolumn content, applying to 73example of applying 75
constrained columnsnote, and dashboard prompts 60
contactscreate target list view, using to create a list of
contacts 159content
embedded content, adding to dashboard page 205
Presentation Catalog, adding saved content to dashboard page 209
copymaking of view 93
create segment viewabout 90segments, creating 158
create target list viewabout 90contacts and accounts, creating list of 159
criteria promptsabout 56
Criteria tababout 31
custom date/time format stringscustom format strings for conversion into

Index ■ D
Oracle Business Intelligence Answers, Delivers, and InteractiveDashboards User Guide Version 10.1.3.2
237
hours 78custom format strings for conversion into
hours and minutes 79custom format strings for conversion into
hours, minutes, and seconds 79custom format strings for integral fields 77entering custom date/time format strings 75general custom format strings, table 76ODBC custom format strings, table 77
custom formatter, using 90
DDashboard Editor
accessing 197Briefing Book navigation link, adding to
dashboard page 201content, about using to 196content, making appear conditionally 200dashboard page, about adding and displaying
content 200dashboard page, about working with
columns 198dashboard page, adding a new column 198dashboard page, adding section to 199dashboard page, breaking a column 198dashboard page, making section appear
horizontally 199dashboard page, saving changes to a
dashboard page 200dashboard page, selecting to edit 197dashboard page, setting column width 198dashboard pages and layout, about working
with 197dashboard prompt, editing properties 211Dashboard Properties page, accessing 215dashboard properties, changing 213deleting a dashboard page 215deleting objects on dashboard page 213description, adding for a dashboard 215embedded content, adding to dashboard
page 205guided navigation link, adding 201hiding a dashboard page 215HTML, adding to dashboard page 206objects, renaming on dashboard page 212PDF and printing options, changing 214permissions, changing 215Presentation Catalog folder, adding saved
content to a dashboard page 209renaming a dashboard page 215reordering a dashboard page 215reports, editing properties 211results, controlling when drilling down 211
style, selecting for a dashboard 215text link or image, adding to dashboard
page 202view Presentation Catalog folder, adding to
dashboard page 208dashboard page
adding RSS feed to catalog folder 209Briefing Book navigation link, adding to 201content, about adding and displaying 200content, making appear conditionally 200dashboard prompt, editing properties 211Dashboard Properties page, accessing 215dashboard properties, changing 213deleting a dashboard page 215deleting objects 213description, adding for a dashboard 215embedded content, adding to 205guided navigation link, adding 201hiding a dashboard page 215HTML, adding to 206objects, renaming 212PDF and printing options 214permissions, changing 215Presentation Catalog folder view, adding
to 208Presentation Catalog, adding saved
content 209renaming a dashboard page 215reordering a dashboard page 215reports, editing properties 211results, controlling when drilling down 211saving changes 200style, selecting for a dashboard 215text link or image, adding to 202
dashboard promptsrequests, adding to a dashboard or page 63requests, creating for filtering requests 60requests, editing 63requests, saving 63using with Oracle BI Publisher report 223
Dashboard Properties pagesaccessing 215
dashboardsabout 191Briefing Book navigation link, adding to
dashboard page 201Briefing Book, adding content 225Briefing Book, adding list of books to
dashboard page 227Briefing Book, creating 224Briefing Book, editing, downloading, and
printing 226Briefing Book, updating using Oracle BI
Delivers 227
Oracle Business Intelligence Answers, Delivers, and Interactive Dashboards User Guide Version 10.1.3.2
Index ■ D
238
Briefing Book, viewing a book 227common term definitions 192compound layout view, accessing on 96compound layout view, using to add view 96compound layout view, using to delete
view 97compound layout view, using to rearrange
view 97, 98content, about adding content 196Dashboard Editor, about adding and
displaying content 200Dashboard Editor, about working with
columns in dashboard page 198Dashboard Editor, about working with
dashboard pages and layout 197Dashboard Editor, accessing 197Dashboard Editor, adding a new column 198Dashboard Editor, adding a section to
dashboard page 199Dashboard Editor, breaking a column 198Dashboard Editor, making content appear
conditionally 200Dashboard Editor, making section appear
horizontally 199Dashboard Editor, saving changes to a
dashboard page 200Dashboard Editor, selecting dashboard page
to edit 197Dashboard Editor, setting column width 198dashboard page, navigating to 194dashboard prompt, adding to 63dashboard prompt, editing properties 211Dashboard Properties page, accessing 215deleting a dashboard page 215deleting objects on dashboard page 213description, adding for a dashboard 215description, viewing 16emailing dashboard page 17embedded content, adding to dashboard
page 205guided navigation link, adding 201guided navigation, about and types of 228hiding a dashboard page 215HTML, adding to dashboard page 206keyboard shortcut, using to navigate 194new page, adding to a dashboard 196Oracle BI Dashboards 11Oracle BI Publisher, adding reports to 210PDF and printing options, changing 214permissions, changing 215Presentation Catalog, adding saved content to
dashboard page 209printing dashboard 16prompts, about 56
properties, changing 213refreshing 18renaming a dashboard page 215renaming objects on dashboard page 212reordering a dashboard page 215reports, editing properties 211requests, embedding in 38results, controlling when drilling down 211saved requests, viewing organized by
dashboard 29selection pane, refreshing information 36style, selecting for a dashboard 215text link or image, adding to dashboard
page 202user’s account, accessing 220view Presentation Catalog folder, adding to
dashboard page 208view, previewing 93viewing a dashboard 194
dataduplicate data, suppressing 70
Data level security 13data types
formatting and configuring data-driven navigation 90
date/time format strings, customcustom format strings for conversion into
hours 78custom format strings for conversion into
hours and minutes 79custom format strings for conversion into
hours, minutes, and seconds 79custom format strings for integral fields 77entering custom date/time format strings 75general custom format strings, table 76ODBC custom format strings, table 77
default aggregation rulesoverriding in pivot tables 128
defaultssaving column property settings as system-
wide defaults 75deleting
column filter prompt 58dashboard page 215image prompt 60objects on dashboard page 213view 93view, deleting using the compound layout
view 97Delivers
pages, display of 22delivery devices
configuring delivery option 186Delivery Options section
Index ■ E
Oracle Business Intelligence Answers, Delivers, and InteractiveDashboards User Guide Version 10.1.3.2
239
about adding or modifying devices 24delivery profiles
configuring delivery option 186using, about 188
destinationsabout for the iBot 178
devicesabout for the iBot 178adding or modifying, about 24
dial gauge 137Disconnected Analytics
about using Briefing Book navigation links 201
Disconnected Application Cacheabout 179
downloadingoptions 17results, as a Web page 18results, download as tab-separated list of
values 18Drill in Place option, about using 211drilling down
about 22results, controlling display when drilling
down 211results, drilling down on 91
drop-down listsusing multiple lists in pivot tables 128
duplicate data, suppressing 70duplicating view 93
EEdit Filter option
note, about availability 54Edit Formula button
about 34emailing
dashboard page or request 17embedded content
adding to dashboard page 205Excel
format, downloading results in 17Internet Query, integrating with requests 40
execution ordercolumn filter prompt, moving up or down 58image prompt, moving up or down 60
exiting Oracle BI 16
Ffeature links, using 21filter
about 47caution, clicking Refresh button 48
column filter characteristics 47column filter, about using and elements 47column filter, combining with other column
filters 55column filter, creating in Answers 48column filter, editing 54column filter, removing from a request 55column filter, removing in Oracle BI
Answers 54column filter, saving as part of request 52column filter, saving for reuse 52column operators, list of and usage
guidelines 49filter, creating based on the another saved
request 64Oracle BI Answers filter examples 65request, applying saved column filter to
request 53saved filter, displaying properties 53SQL, editing for a column filter in a
request 64tip, adding for a column 48WHERE clause, about translating into 47
Filter By Column buttonabout 34
filtersrefreshing selection pane information 36
filters viewabout 88adding or modifying 144
folderadding RSS feed 209adding view to dashboard page 208archiving 231
Format Column button, about 34format strings
general custom format strings 76hours and minutes, conversion into 79hours, conversion into 78hours, minutes, and seconds, conversion
into 79integral fields, for 77
formulacolumn formula, editing 103
funnel chart viewabout 89showing results in 146
Ggauge view
about 88adding or modifying gauge view 139buttons, description of 138
Oracle Business Intelligence Answers, Delivers, and Interactive Dashboards User Guide Version 10.1.3.2
Index ■ H
240
results, about showing in 137grid lines
controlling display of and colors 114guided navigation
about and types of 228link, adding to dashboard page 201
Hhiding
column in results 69dashboard page 215
horizontallymaking section appear in dashboard
page 199hours
custom format strings for conversion into hours 78
custom format strings for conversion into hours and minutes 79
custom format strings for conversion into hours, minutes, and seconds 79
HTMLdashboard page, adding to 206print view, using to 92print, using to 16
IiBots
about enabling within Oracle BI Delivers 197action properties, about 180actions, about specifying 179content choices 174content delivery, selecting 175contents, about specifying 173creating 165creating and managing, about 164creating directly from a saved request in
Oracle BI Answers 32currently selected recipients and available
recipients, showing 172custom script action properties, about 181custom script, specifying when iBot
completes 182, 183daily schedule, executing on 169date and time, starting at 168delivery content, removing 176delivery content, send to iBot creator 170delivery content, send to multiple users 170delivery format options 174delivery profile, editing 166devices and destinations, specifying 177devices, about 178eligible users, allowing to subscribe to the
iBot 170eligible users, disallowing to subscribe to the
iBot 171end date, selecting 169headline, adding to appear as iBot subject
line 175headline, adding variables to 175list, showing list of 166monthly schedule, executing on 169multiple times, executing 169next iBot, selecting to run 182one time only, executing 169priority, data visibility, and impersonation,
specifying 166recipients, allowing to be determined 171request, selecting a request to trigger an
iBot 167scheduling, about 168searching, searching for 165settings, reviewing 166starting the iBot now 168subqueries, using to refine the request 167subscription list, changing list 185subscription list, viewing 184subscription list, viewing more information
about 184subscriptions, about customizing 185subscriptions, customizing 185system services, about 178text message, adding for iBot attachment
context 176text message, adding variables for iBot
attachment context 176text message, adding variables in text when
there is no iBot content 177text message, specifying when there is no iBot
content 176user destinations, about 178weekly schedule, executing on 169workflow action properties, about 181workflow, specifying to execute 182
image linkadding to dashboard page 202
image promptadding or modifying 58deleting image prompt 60execution order, moving 60properties, modifying 59
integral fieldscustom format strings 77
Internet Queryintegrating requests with 40
Index ■ L
Oracle Business Intelligence Answers, Delivers, and InteractiveDashboards User Guide Version 10.1.3.2
241
Llegend
specifying on a chart view 115legend view
about 89links
Briefing Book navigation link, adding to dashboard page 201
feature links, using 21guided navigation link, adding to dashboard
page 201text or image link, adding to dashboard
page 202tip, controlling link appearance 203
logical SQL viewabout 90showing logical SQL for a request 157
Lotus Notes databasesaving Oracle BI reports to 38
MManage Catalog
archiving the catalog 231editing name and description of an
object 232markup text
adding text to results 154Microsoft
Excel format, downloading results in 17Excel’s Internet Query, integrating requests
with 40minutes
custom format strings for conversion into hours and minutes 79
custom format strings for conversion into hours, minutes, and seconds 79
My Account pageaccount settings, displaying 23actions performed from 23devices, about adding or modifying 24preferences, setting 23Presentation Catalog, editing name and
description of an object 232My Folder folder
about and saved requests 32
Nnarrative view
about 89example 148narrative text, adding to results 148
navigatingaccessing Oracle BI, what is displayed 20
Briefing Book navigation link, adding to dashboard page 201
data-driven navigation, configuring and formatting data types 90
drilling down, about 22guided navigation link, adding to dashboard
page 201guided navigation, about and types of 228links, using 21Oracle BI pages, about components 22tip, controlling link appearance 203
no results viewabout 90no data, alerting users to 157
Notessaving Oracle BI reports to Lotus Notes
database 38
Oobjects
deleting on dashboard page 213Presentation Catalog, editing name and
description 232renaming on dashboard page 212
ODBC custom format strings, table 77Operational applications
about 11operators
list of column operators and usage guidelines 49
Oracle BI Answersabout 11Advanced tab, about 32clicking column, specifying what happens 70column content layout, adding TimeZone icon
to date/time column 70column content layout, editing 69, 70column contents, editing the appearance 67column contents, formatting 71column filter prompt, adding to a request 56column filter prompt, deleting 58column filter, combining with other column
filters 55column filter, creating 48column filter, editing 54column filter, removing from a request 55column filter, saving as part of request 52column filter, saving for reuse 52column formatting functions, about using 67column formula, editing 103column property settings, saving as system-
wide defaults 75column, hiding in results 69
Oracle Business Intelligence Answers, Delivers, and Interactive Dashboards User Guide Version 10.1.3.2
Index ■ O
242
conditional formatting, applying to column content 73
conditional formatting, example of applying 75
Criteria tab, about 31custom date/time format strings,
entering 75custom format strings for conversion into
hours 78custom format strings for conversion into
hours and minutes 79custom format strings for conversion into
hours, minutes, and seconds 79custom format strings for integral fields 77dashboard prompt, adding to a dashboard or
page 63dashboard prompt, creating for filtering
requests 60dashboard prompt, editing 63dashboard prompt, saving 63duplicate data, suppressing 70filter examples 65filter, creating based on the another saved
request 64filtering, simplifying using prompts in a
request 56general custom format strings, table 76image prompt, adding or modifying 58image prompt, deleting 60image prompt, modifying properties 59image prompt, moving in execution order 60logical SQL, examining or editing for a
request 42new request, creating 32new request, creating or changing criteria 33ODBC custom format strings, table 77Oracle BI reports, saving to Lotus Notes
database 38Prompts tab, about 32request, embedding in dashboard 38request, integrating with Excel’s Internet
Query 40request, saving to personal or shared
folder 37requests, specifying column sort order 35Results tab, about 31results, viewing and working with 37saved filter, displaying properties 53saved request, running 32saved requests organized by dashboard,
viewing 29saved requests stored in the Presentation
Catalog, viewing 29saved requests, searching for 30
selection pane, refreshing information 36SQL, editing for a column filter in a
request 64start page example 27start page, returning to 30subject areas and requests, accessing 29using and common definitions 25workspace, about accessing tabs 30workspace, accessing tabs 30
Oracle BI application business logic object security 13
Oracle BI Deliversabout 11about and common terms 162access, controlling 163accessing 164Alerts added automatically to My
Dashboard 199alerts, accessing 189Briefing Book, using to update 227content, working with saved in the
Presentation Catalog 165custom script, specifying when iBot
completes 182, 183delivery profile, editing 166delivery profiles, about using 188devices and profiles, configuring 186how Oracle BI Delivers works 162iBot subscription list, changing list 185iBot subscription list, viewing 184iBot subscription list, viewing more
information about 184iBot subscriptions, customizing 185iBot, about action properties 180iBot, about custom script action
properties 181iBot, about customizing subscriptions 185iBot, about devices 178iBot, about specifying actions 179iBot, about system services 178iBot, about user destinations 178iBot, about workflow action properties 181iBot, specifying devices and destinations 177iBot, specifying workflow to execute 182iBots, about creating and managing 164iBots, about scheduling 168iBots, about specifying content 173iBots, allowing eligible users to subscribe
to 170iBots, allowing recipients to be
determined 171iBots, delivery content choices 174iBots, delivery format options 174iBots, disallowing eligible users to subscribe
Index ■ P
Oracle Business Intelligence Answers, Delivers, and InteractiveDashboards User Guide Version 10.1.3.2
243
to 171iBots, executing multiple times 169iBots, executing on daily schedule 169iBots, executing on monthly schedule 169iBots, executing on weekly schedule 169iBots, executing one time only 169iBots, removing delivery content 176iBots, reviewing settings 166iBots, searching for 165iBots, selecting a request to trigger an
iBot 167iBots, selecting an end date 169iBots, selecting content delivery 175iBots, send delivery content to creator 170iBots, send delivery content to multiple
users 170iBots, showing currently selected recipients
and available recipients 172iBots, showing list of 166iBots, specifying priority, visibility, and
impersonation 166iBots, starting at specified date and time 168iBots, subject line, adding heading to appear
as 175iBots, subject line, adding variables to 175iBots, using subqueries to refine the
request 167new iBot, creating 165next iBot, selecting to run 182start page, returning to 166starting the iBot now 168text message, adding for iBot attachment
context 176text message, adding variables for iBot
attachment context 176text message, adding variables in text when
there is no iBot content 177text message, specifying when there is no iBot
content 176users, customizing view for 95
Oracle BI Interactive DashboardsSee dashboards
Oracle BI Publisheraccessing 221dashboards, adding reports to 210report types 221using dashboard prompts with reports 223working with 220
Oracle BI Publisher Reportstoolbar, using the 222
Oracle BI Server Cacheabout 178
Order By buttonabout 34
sort requests, using to 35
Ppages
about components 22panes
about 22parenthetical filtering
See filterPareto graph type 109PDF
dashboard page, changing PDF options 214print view, using to 92print, using to 16
permissionsdashboard page, changing for 215Oracle BI Answers, and what you see 29
personal foldernote, about prompts saved to 63request, saving to 37
Pie graph type 109pivot table view
about 88calculation examples 136calculations, building 134calculations, using 133default aggregation rules, overriding 128displaying running sums 132drop-down lists, using multiple 128formatting, adding 129item’s relative value, showing 132results, showing in 125view, adding or modifying 125
pivot tablesnote, and conditional formatting 73
preferencessetting for My Accounts page 23
preferred time zonesetting 24
Presentation Catalogarchiving 231dashboard page, adding view of folder 208object, editing name and description 232Oracle BI Delivers, working with content
saved in 165saved content, adding to dashboard
page 209saved requests, viewing stored in 29
Presentation Catalog object security 13printing
briefing book 226dashboard or saved request 16dashboard page, changing printing
Oracle Business Intelligence Answers, Delivers, and Interactive Dashboards User Guide Version 10.1.3.2
Index ■ Q
244
options 214view 92
promptscolumn filter prompt, adding to a request 56column filter prompt, deleting 58column filter prompt, modifying
properties 58dashboard prompt, adding to a dashboard or
page 63dashboard prompt, creating for filtering
requests 60dashboard prompt, editing 63dashboard prompt, editing properties 211dashboard prompt, saving 63dashboard prompt, using with Oracle BI
Publisher report 223image prompt, adding or modifying 58image prompt, deleting 60image prompt, modifying properties 59image prompt, moving in execution order 60types of 56
Prompts tababout 32
propertieschart properties, specifying 113column filter prompt, modifying
properties 58dashboard prompt, editing properties 211Dashboard Properties page, accessing 215dashboard properties, changing 213image prompt, modifying properties 59reports, editing properties 211saved filter, displaying for 53view properties, editing 98
Qquitting
Oracle BI 16
RRadar graph type 109rearrange
using compound layout view to rearrange view 97
Refresh buttoncaution, using with requests 33
Refresh Display linkabout using 37
refreshingcurrent request in a view 94dashboard or request 18Oracle BI metadata, refreshing selection pane
information 36
selection pane information 36Remove Column button, about 34renaming
dashboard page 215objects on dashboard page 212
reorderingdashboard page 215
reportsLotus Notes database, saving to 38properties, editing 211
requestscolumn filter characteristics 47column filter prompt, adding to a request 56column filter prompt, deleting 58column filter prompt, modifying
properties 58column filter, about translating into WHERE
clause 47column filter, about using and elements 47column filter, combining with other column
filters 55column filter, creating in Oracle BI
Answers 48column filter, editing 54column filter, removing from a request 55column filter, removing in Oracle BI
Answers 54, 55column filter, saving as part of request 52column filter, saving for reuse 52column formula, editing 103column selector view, allowing users to
change columns in requests 144column, specifying sort order 35dashboard prompt, adding to a dashboard or
page 63dashboard prompt, creating for filtering
requests 60dashboard prompt, editing 63dashboard prompt, saving 63dashboard, embedding in 38description, viewing 16emailing request 17Excel’s Internet Query, integrating with 40filter, about using to limit results 47filter, creating based on the another saved
request 64filtering, using prompts to simplify 56image prompt, adding or modifying 58image prompt, deleting 60image prompt, modifying properties 59image prompt, moving in execution order 60logical SQL, examining or editing for a
request 42logical SQL, showing for a request 157

Index ■ S
Oracle Business Intelligence Answers, Delivers, and InteractiveDashboards User Guide Version 10.1.3.2
245
My Folder folder, about and saved requests 32
new request, creating 32new request, creating or changing criteria 33new request, creating while working with a
view 94Oracle BI Answers filter examples 65Oracle BI Answers, about creating in 25Oracle BI Answers, accessing using 29person or shared folder, saving to 37printing saved request 16refreshing 18saved column filter, applying to request 53saved filter, displaying properties 53saved request, opening while working with a
view 94saved request, running 32saved requests, searching for 30saved requests, viewing by dashboard 29saved requests, viewing stored in
Presentation Catalog 29selection pane, refreshing information 36SQL, editing for a column filter in a
request 64tip, adding filter for a column 48
requests, formattingclicking column, specifying what happens 70column content layout, editing 69column content, formatting in Oracle BI
Answers 71column contents, editing the appearance 67column formatting function, about using 67column property settings, saving as system-
wide defaults 75column, hiding in results 69conditional formatting, applying to column
content 73conditional formatting, example of
applying 75custom date/time format strings,
entering 75custom format strings for conversion into
hours 78custom format strings for conversion into
hours and minutes 79custom format strings for conversion into
hours, minutes, and seconds 79custom format strings for integral fields 77custom table and column heading,
creating 70duplicate data, suppressing 70general custom format strings, table 76ODBC custom format strings, table 77
results
current request, refreshing 94dashboard page, controlling when drilling
down 211downloading 17drilling, about down on 91filters view, about showing applied to 144funnel chart view, adding narrative text to
results 148funnel chart view, showing results in 146no data, alerting users 157Oracle BI Answers, viewing and working
with 37pivot table view, showing in 125static text view, adding markup text to
results 154view, working with and seeing results 93
Results tababout 31
RSS feedcatalog folder 209for alerts 189reader requirements 209
Ssaving
column filter, saving as part of request 52column filter, saving for reuse 52dashboard page, saving changes 200dashboard prompt 63Oracle BI view 91
Scatter graph type 110script
custom script, about executing when iBot completes 181
custom script, specifying script when iBot completes 182, 183
scrolling tickershowing results 151
searchingsearching for saved request 30
secondscustom format strings for conversion into
hours, minutes, and seconds 79security
types of 13Security button
note, about displaying 215segments
creating using create segment view 158Select Recipients dialog box
using 172selection pane
refreshing information 19
Oracle Business Intelligence Answers, Delivers, and Interactive Dashboards User Guide Version 10.1.3.2
Index ■ T
246
shared folderrequest, saving to 37
sortingrequests by column 35
SQLcolumn filter, editing for a request 64logical SQL, examining or editing for a
request 42logical SQL, showing for a request 157
stand-alone Oracle BIabout 13accessing 14feature links, about 21
start pageexample 27returning to 30subject areas and requests, accessing 29
static text viewabout 89adding markup text to results 154
Step graph type 110subject areas
accessing using Oracle BI Answers 29subscription list
changing list 185iBot, viewing more information about 184viewing 184
system servicesabout for the iBot 178
system-wide defaultssaving column property settings as 75
Ttable view
about 87adding write back to 100working with 100
tabsabout 22
tab-separated list of valuesdownloading results 18
text linkadding to dashboard page 202
ticker viewabout 89scrolling ticker, showing results in 151
timeSee custom date/time format strings
Time Zonesetting preferred time zone 24
timestampsSee custom date/time format strings
TimeZone icon
including on date/time column 70title view
about 87working with 98
Uuser destination
about for the iBot 178
VVariables
using presentation variables and system variables 44
view selector viewabout 89
viewsaxes, selecting the columns to display as 116axis scaling options, setting 116axis titles and labels, specifying in chart
view 119calculation examples 136chart graph types 108chart view buttons 111chart view, about showing results in 107chart view, adding or modifying 112chart view, controlling display of grid lines and
colors 114chart view, specifying colors, background,
text, and borders 115chart view, specifying general chart
properties 113chart view, specifying legend location 115column selector view, allowing users to
change columns in requests 144compound layout view, accessing from
another view 95compound layout view, accessing on a
dashboard 96compound layout view, using to add view 96compound layout view, using to delete
view 97compound layout view, using to edit
properties 98compound layout view, using to rearrange
view 97copy, making 93create segment view, creating segments 158create target list view, creating lists of
contacts and accounts 159current request, refreshing results 94dashboard, previewing view 93data types, formatting and configuring data-
driven navigation 90
Index ■ W
Oracle Business Intelligence Answers, Delivers, and InteractiveDashboards User Guide Version 10.1.3.2
247
default aggregation rules, overriding 128deleting view 93drop-down lists, using multiple 128filters view, adding or modifying 144funnel chart view, showing results in 146gauge types 137gauge view buttons 138gauge view, about showing results in 137gauge view, adding or modifying 139logical SQL view, showing logical SQL for a
request 157narrative view example 148narrative view, adding narrative text to
results 148new request, creating 94no results view, alerting users to no data 157Oracle BI Delivers users, customizing view
for 95overview 86pivot table view, adding or modifying 125pivot table view, showing results in 125pivot tables, adding formatting 129pivot tables, building calculations 134pivot tables, displaying running sums 132pivot tables, showing an item’s relative
value 132pivot tables, showing calculations 133printing a view 92results data, seeing as working with view 93results, about drilling down on 91
saved request, opening 94saving a view 91static text view, adding markup text to
results 154table view, working with 100ticker view, showing results in a scrolling
ticker 151title view, working with 98user interaction, specifying 120view names and descriptions 87
WWeb page
downloading results as 18WHERE clause
translating column filter into 47workflow
iBots, about workflow action properties 181specifying to execute 182
workspaceAdvanced tab, about 32Criteria tab, about 31Prompts tab, about 32Results tab, about 31tabs, about accessing 30tabs, accessing 30
Write Backusing 19

Oracle Business Intelligence Answers, Delivers, and Interactive Dashboards User Guide Version 10.1.3.2
Index ■ W
248