object orie’d data analysis, last time distance weighted discrimination: revisit microarray data...
TRANSCRIPT
Object Orie’d Data Analysis, Last Time
Distance Weighted Discrimination:
• Revisit microarray data
• Face Data
• Outcomes Data
• Simulation Comparison
22
UNC, Stat & OR
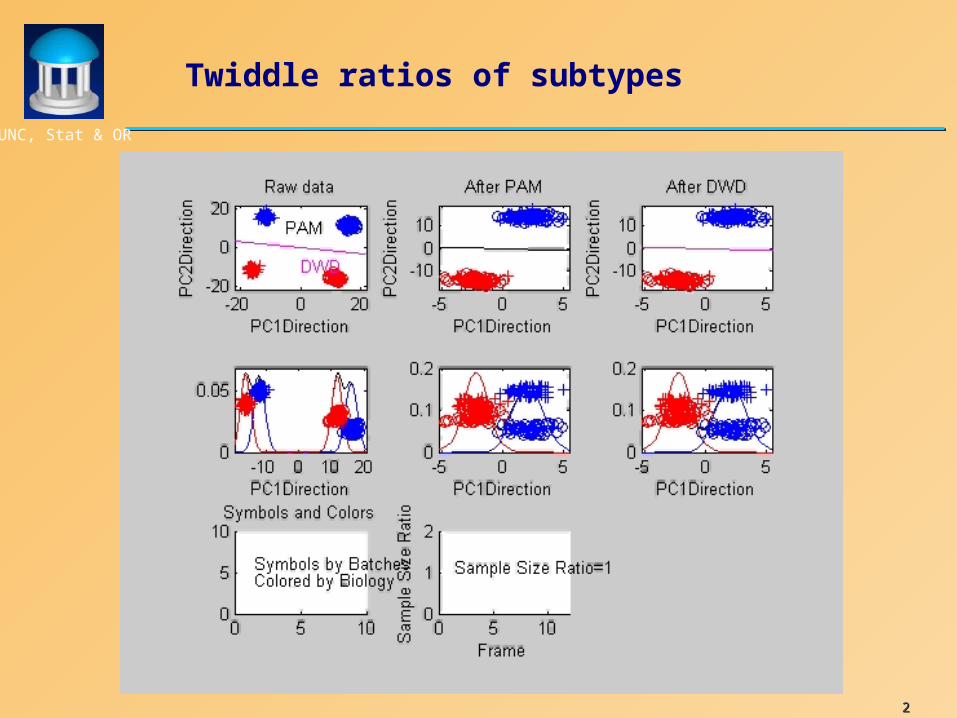
Twiddle ratios of subtypes
33
UNC, Stat & OR
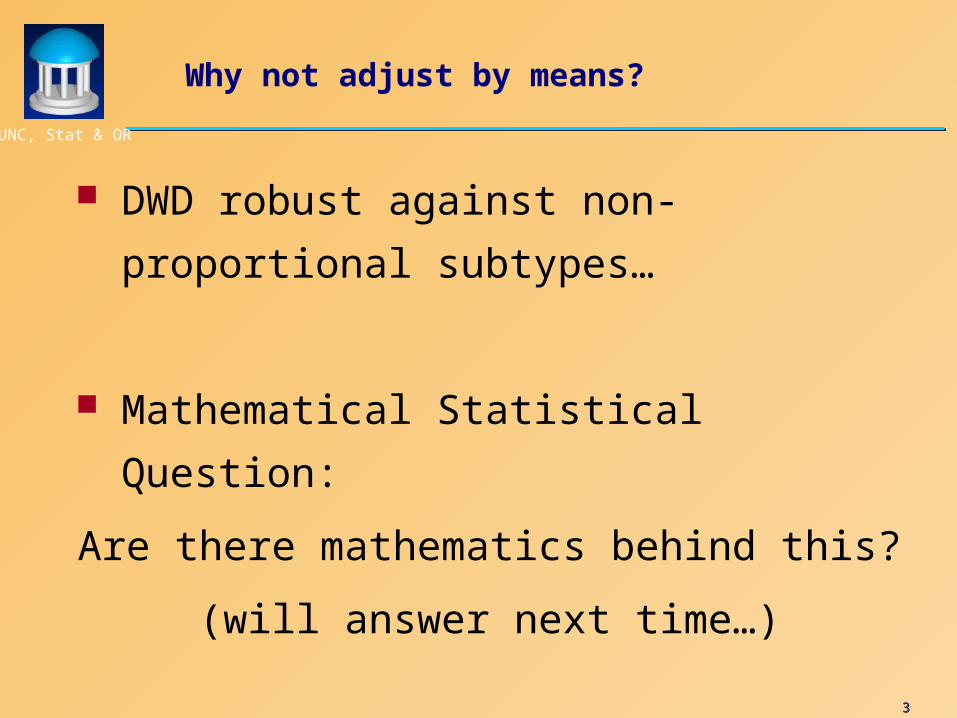
Why not adjust by means?
DWD robust against non-
proportional subtypes…
Mathematical Statistical Question:
Are there mathematics behind this?
(will answer next time…)
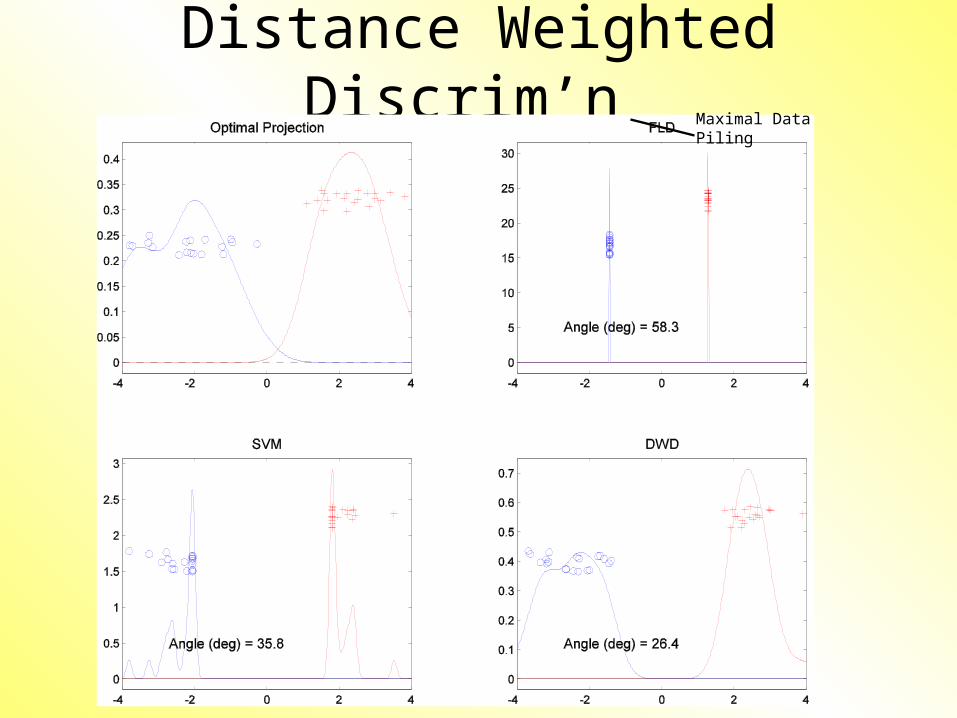
Distance Weighted Discrim’n Maximal Data Piling
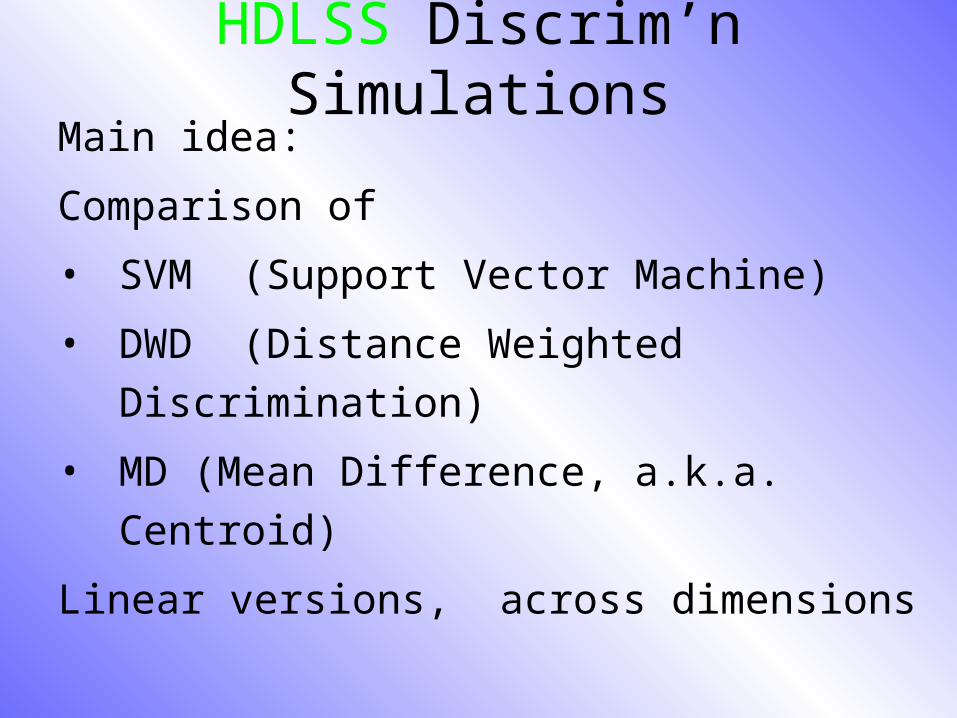
HDLSS Discrim’n Simulations
Main idea:
Comparison of
• SVM (Support Vector Machine)
• DWD (Distance Weighted Discrimination)
• MD (Mean Difference, a.k.a. Centroid)
Linear versions, across dimensions

HDLSS Discrim’n SimulationsConclusions:
• Everything (sensible) is best sometimes• DWD often very near best• MD weak beyond Gaussian
Caution about simulations (and examples):• Very easy to cherry pick best ones• Good practice in Machine Learning
– “Ignore method proposed, but read paper for useful comparison of
others”
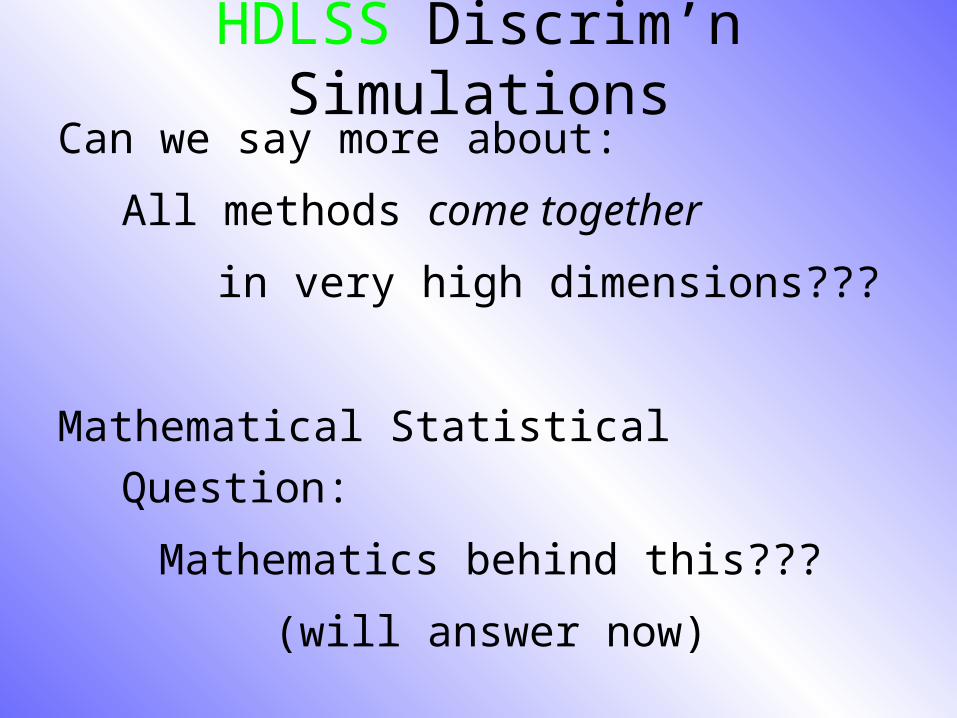
HDLSS Discrim’n Simulations
Can we say more about:
All methods come together
in very high dimensions???
Mathematical Statistical Question:
Mathematics behind this???
(will answer now)
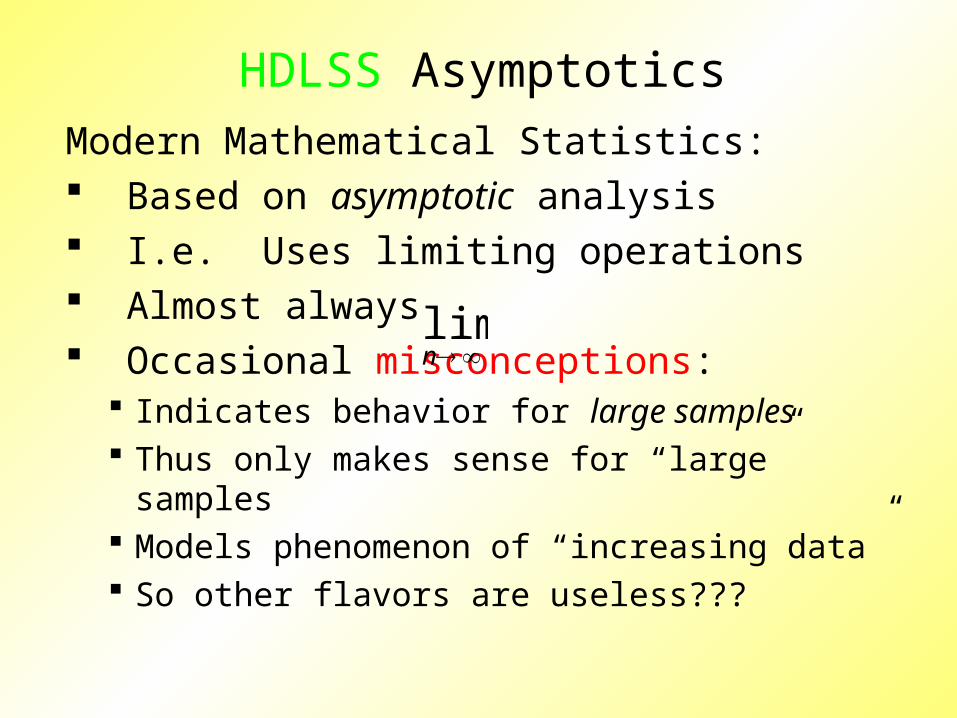
HDLSS Asymptotics
Modern Mathematical Statistics: Based on asymptotic analysis I.e. Uses limiting operations Almost always Occasional misconceptions: Indicates behavior for large samples Thus only makes sense for “large” samples Models phenomenon of “increasing data” So other flavors are useless???
nlim

HDLSS Asymptotics
Modern Mathematical Statistics: Based on asymptotic analysis Real Reasons:Approximation provides insightsCan find simple underlying structureIn complex situations
Thus various flavors are fine:
Even desirable! (find additional insights)
0,lim,lim,lim,lim dndn
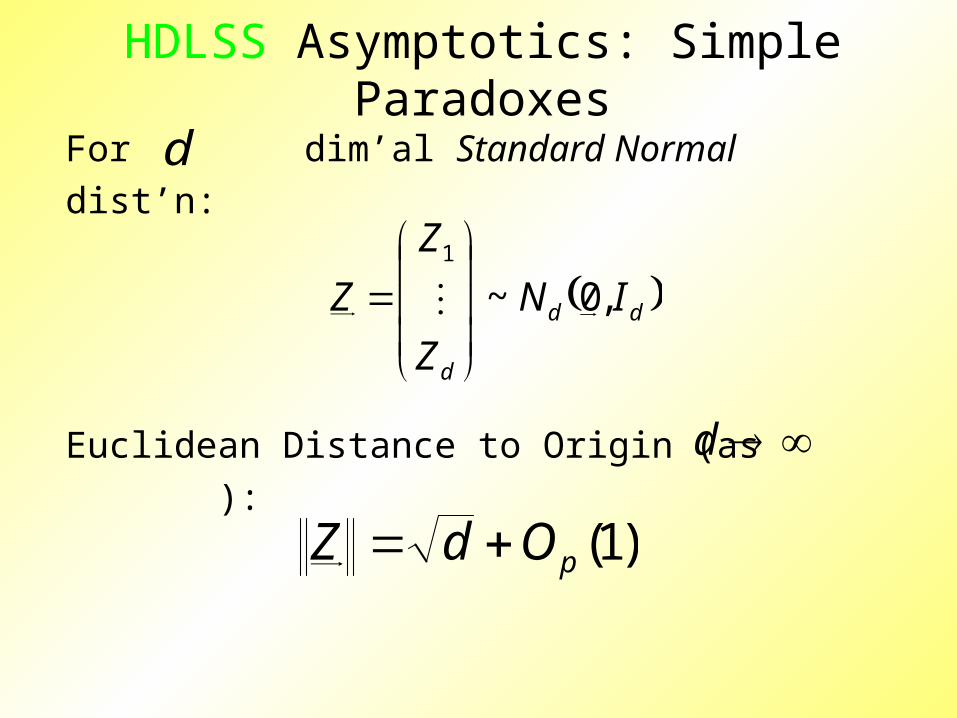
HDLSS Asymptotics: Simple Paradoxes
For dim’al Standard Normal dist’n:
Euclidean Distance to Origin (as ):
d
d
dd
d
IN
Z
Z
Z ,0~1
)1(pOdZ

HDLSS Asymptotics: Simple Paradoxes
As ,
-Data lie roughly on surface of sphere,
with radius
- Yet origin is point of highest density???
- Paradox resolved by:
density w. r. t. Lebesgue Measure
d
)1(pOdZ
d

HDLSS Asymptotics: Simple Paradoxes
For dim’al Standard Normal dist’n:
indep. of
Euclidean Dist. Between and
(as ):
Distance tends to non-random constant:
d
d
dd INZ ,0~2
)1(221 pOdZZ
1Z
1Z 2Z
HDLSS Asymptotics: Simple Paradoxes
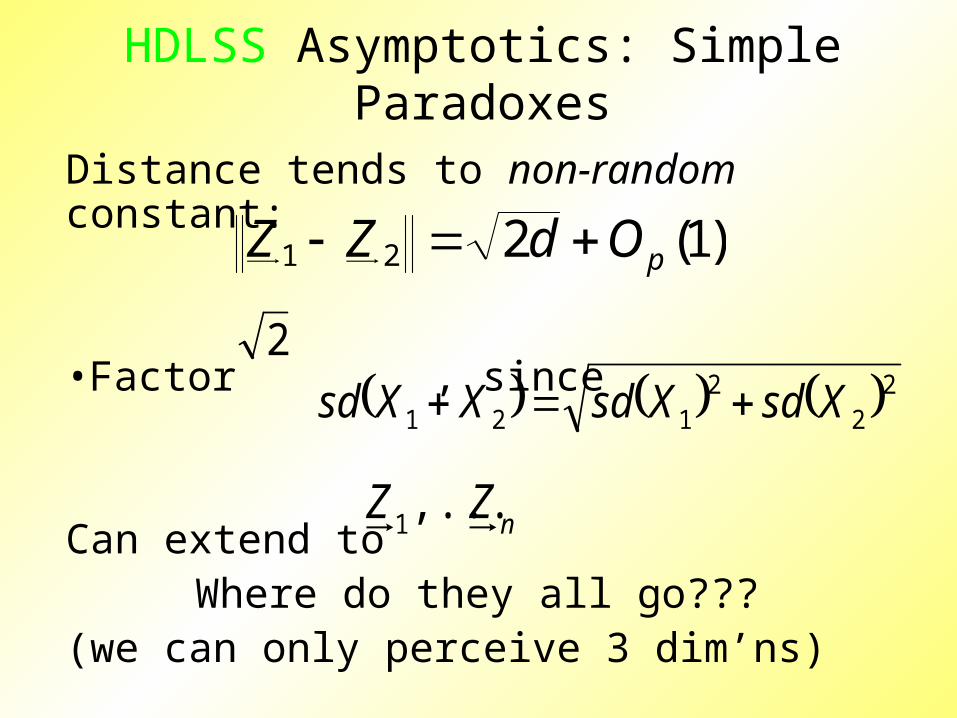
Distance tends to non-random constant:
•Factor , since
Can extend to Where do they all go???
(we can only perceive 3 dim’ns)
)1(221 pOdZZ
nZZ ,...,
1
222
121 XsdXsdXXsd 2
HDLSS Asymptotics: Simple Paradoxes
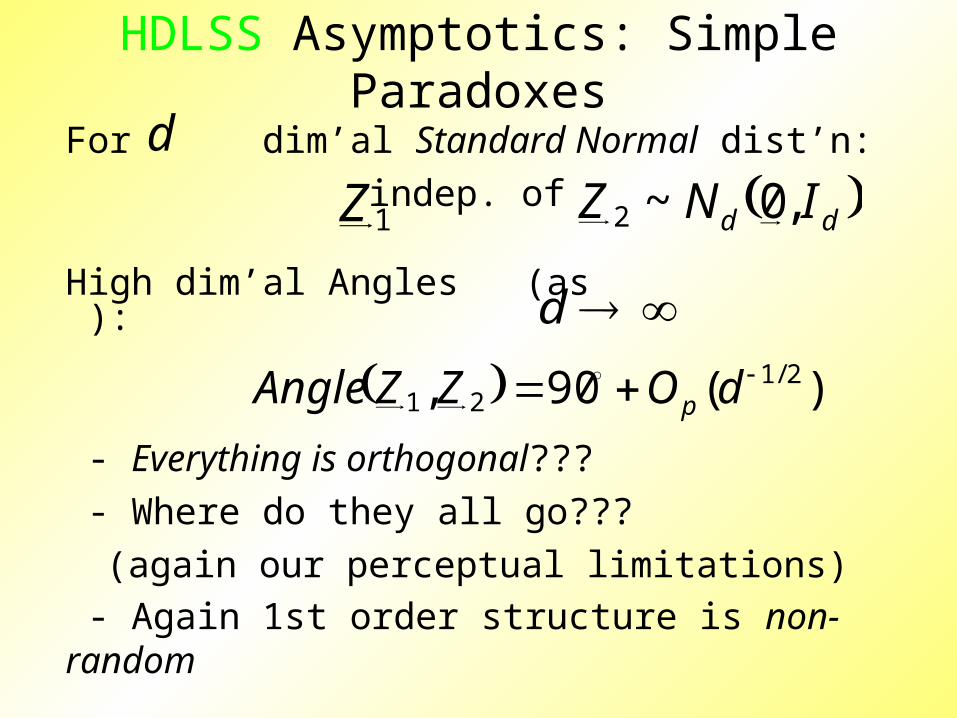
For dim’al Standard Normal dist’n:
indep. of
High dim’al Angles (as ):
- Everything is orthogonal???
- Where do they all go???
(again our perceptual limitations)
- Again 1st order structure is non-random
d
d
dd INZ ,0~2
)(90, 2/121
dOZZAngle p
1Z
HDLSS Asy’s: Geometrical Represent’n
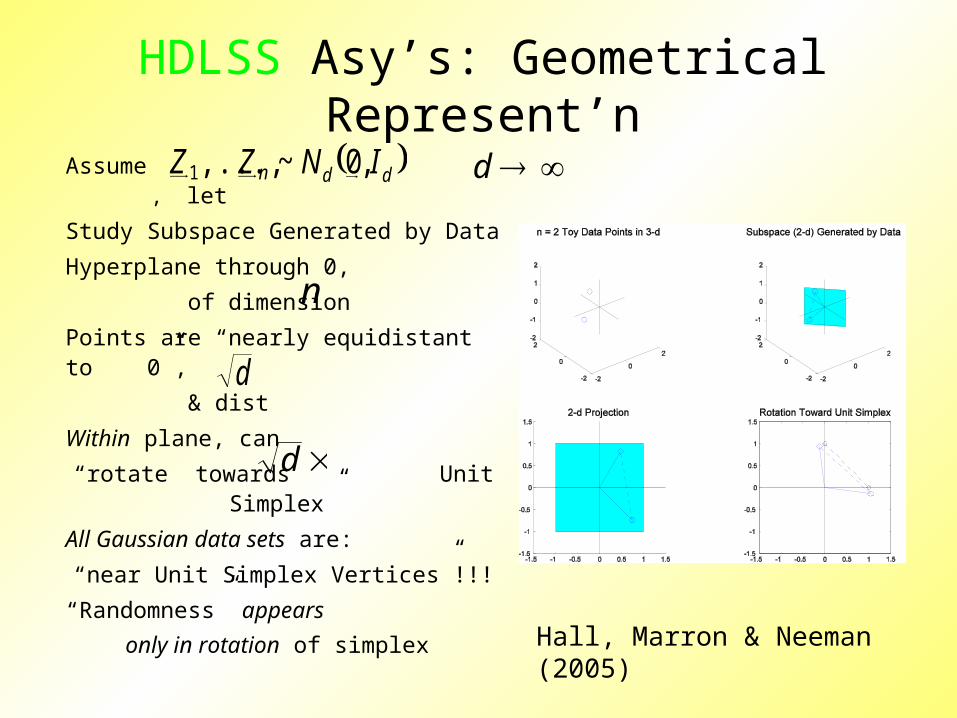
Assume , let
Study Subspace Generated by Data
Hyperplane through 0,
of dimension
Points are “nearly equidistant to 0”,
& dist
Within plane, can
“rotate towards Unit Simplex”
All Gaussian data sets are:
“near Unit Simplex Vertices”!!!
“Randomness” appears
only in rotation of simplex
n
d ddn INZZ ,0~,...,1
d
d
Hall, Marron & Neeman (2005)
HDLSS Asy’s: Geometrical Represent’n
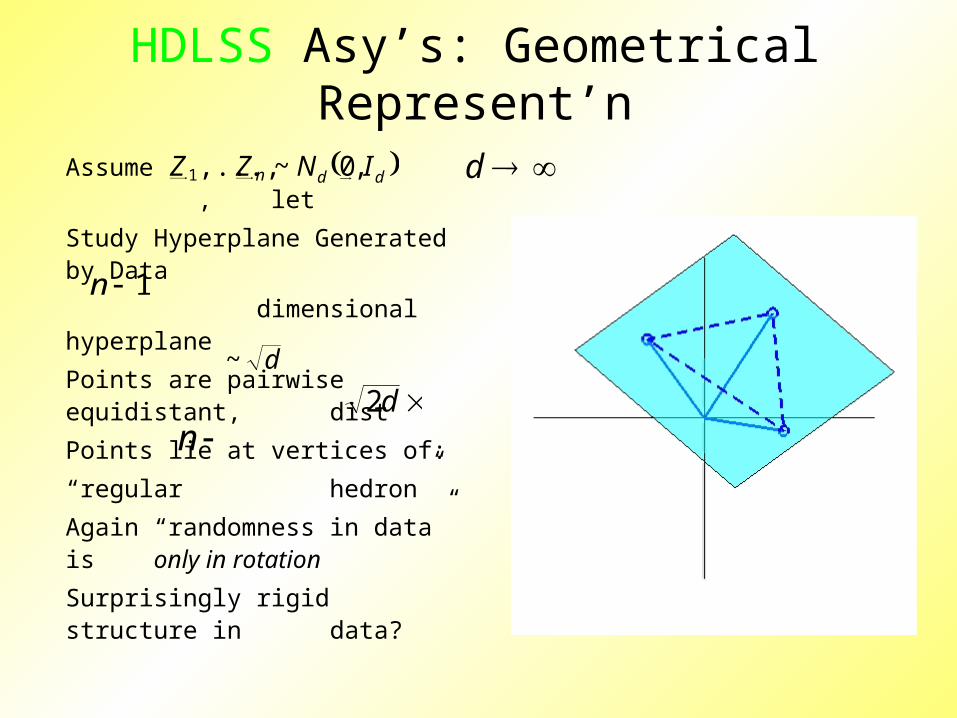
Assume , let
Study Hyperplane Generated by Data
dimensional hyperplane
Points are pairwise equidistant, dist
Points lie at vertices of:
“regular hedron”
Again “randomness in data” is only in rotation
Surprisingly rigid structure in data?
1n
d ddn INZZ ,0~,...,1
d2
d~
n
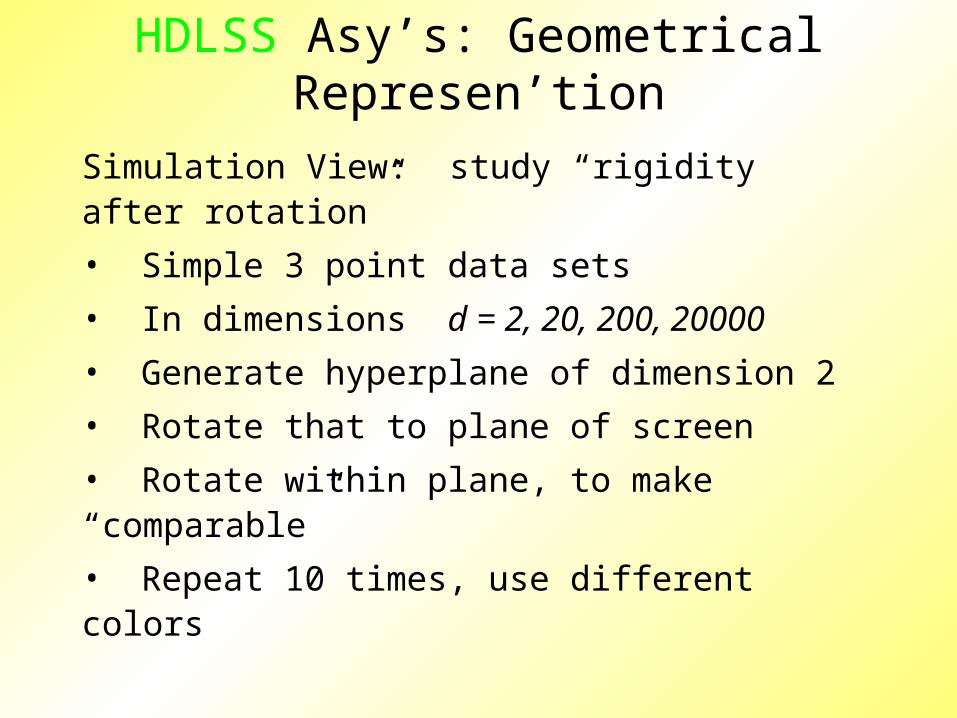
HDLSS Asy’s: Geometrical Represen’tion
Simulation View: study “rigidity after rotation”
• Simple 3 point data sets
• In dimensions d = 2, 20, 200, 20000
• Generate hyperplane of dimension 2
• Rotate that to plane of screen
• Rotate within plane, to make “comparable”
• Repeat 10 times, use different colors

HDLSS Asy’s: Geometrical Represen’tion
Simulation View: shows “rigidity after rotation”
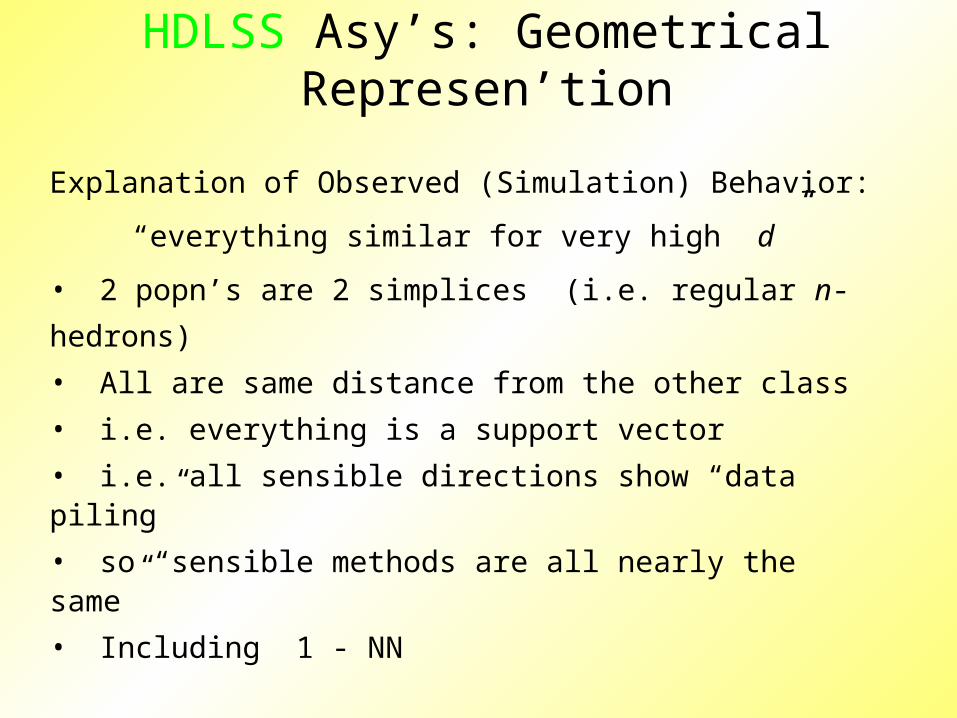
HDLSS Asy’s: Geometrical Represen’tion
Explanation of Observed (Simulation) Behavior:
“everything similar for very high d ”
• 2 popn’s are 2 simplices (i.e. regular n-hedrons)
• All are same distance from the other class
• i.e. everything is a support vector
• i.e. all sensible directions show “data piling”
• so “sensible methods are all nearly the same”
• Including 1 - NN
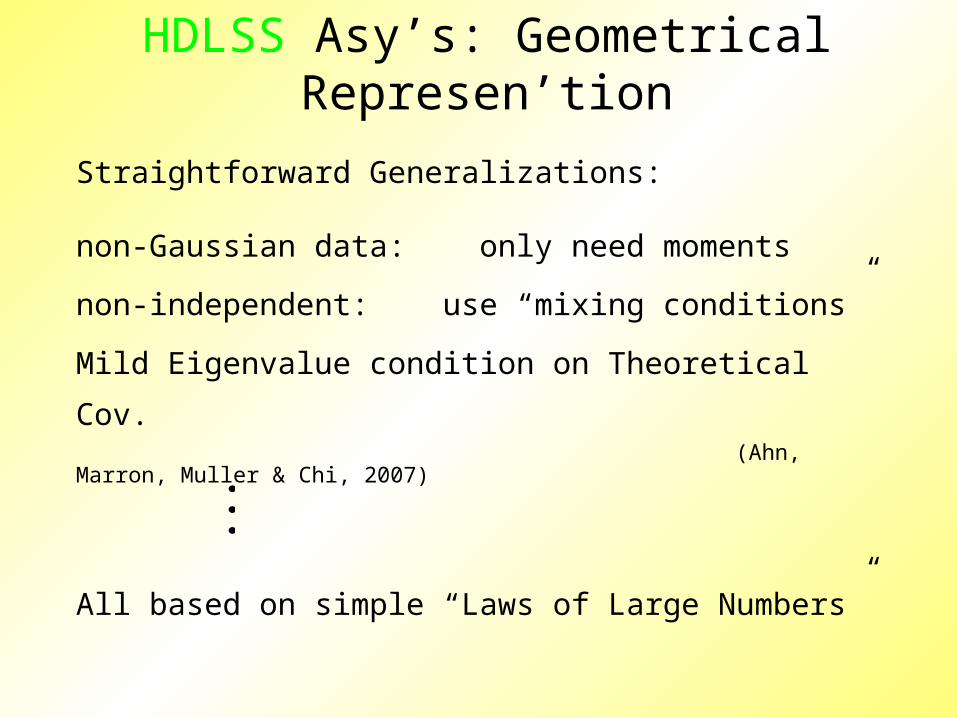
HDLSS Asy’s: Geometrical Represen’tion
Straightforward Generalizations:
non-Gaussian data: only need moments
non-independent: use “mixing conditions”
Mild Eigenvalue condition on Theoretical Cov. (Ahn, Marron, Muller & Chi, 2007)
All based on simple “Laws of Large Numbers”
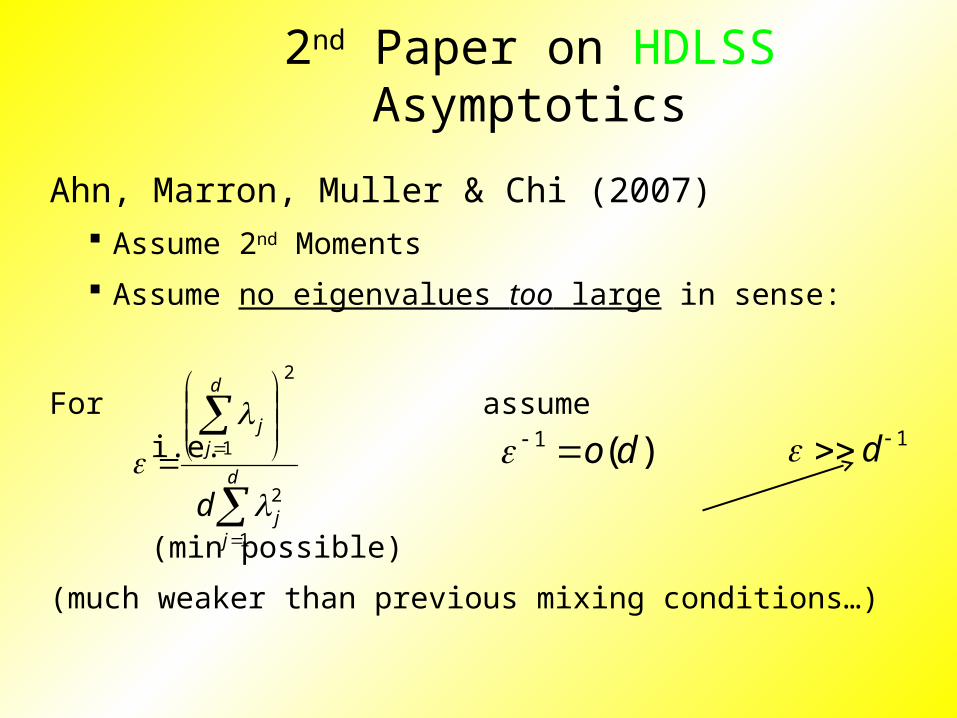
2nd Paper on HDLSS Asymptotics
Ahn, Marron, Muller & Chi (2007) Assume 2nd Moments
Assume no eigenvalues too large in sense:
For assume i.e.
(min possible)
(much weaker than previous mixing conditions…)
d
jj
d
jj
d1
2
2
1
)(1 do 1 d
2nd Paper on HDLSS Asymptotics
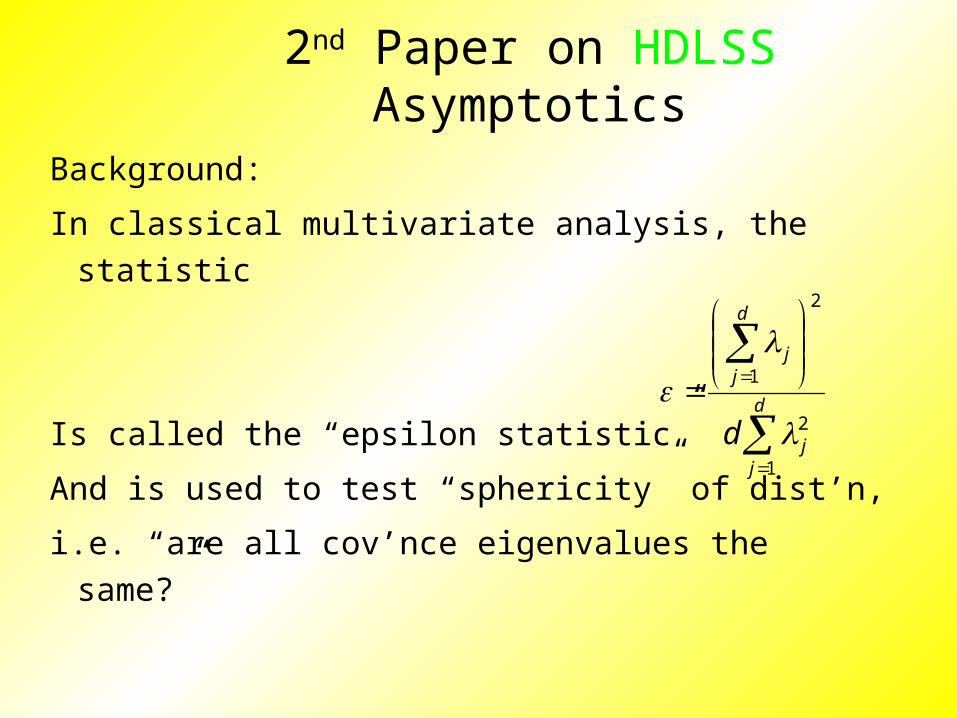
Background:
In classical multivariate analysis, the statistic
Is called the “epsilon statistic”
And is used to test “sphericity” of dist’n,
i.e. “are all cov’nce eigenvalues the same?”
d
jj
d
jj
d1
2
2
1
2nd Paper on HDLSS Asymptotics
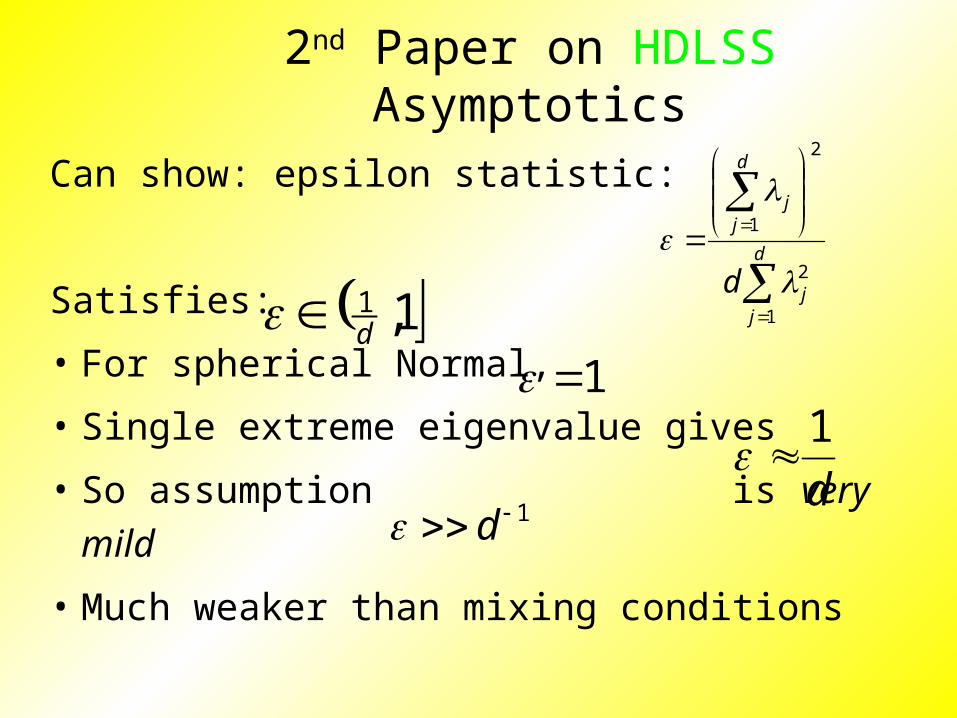
Can show: epsilon statistic:
Satisfies:
• For spherical Normal,
• Single extreme eigenvalue gives
• So assumption is very mild
• Much weaker than mixing conditions
d
jj
d
jj
d1
2
2
1
1,1d
1 d
1
d
1

2nd Paper on HDLSS Asymptotics
Ahn, Marron, Muller & Chi (2007) Assume 2nd Moments
Assume no eigenvalues too large, :
Then
Not so strong as before:
1 d
dOXX pji )1(
)1(221 pOdZZ
2nd Paper on HDLSS Asymptotics
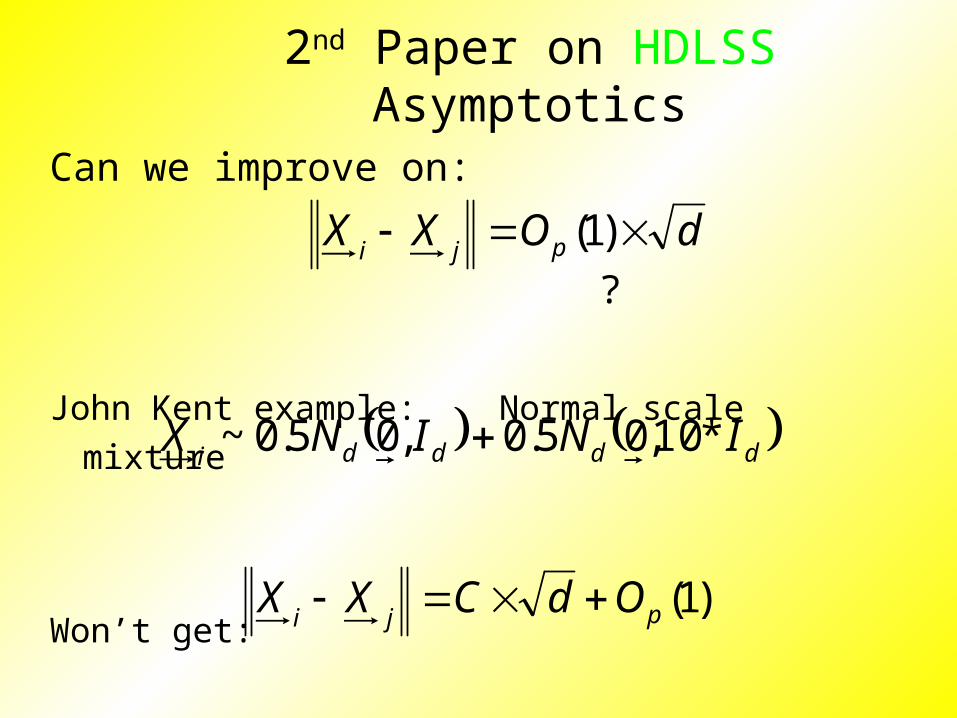
Can we improve on:
?
John Kent example: Normal scale mixture
Won’t get:
ddddiININX *10,05.0,05.0~
dOXX pji )1(
)1(pjiOdCXX
2nd Paper on HDLSS Asymptotics
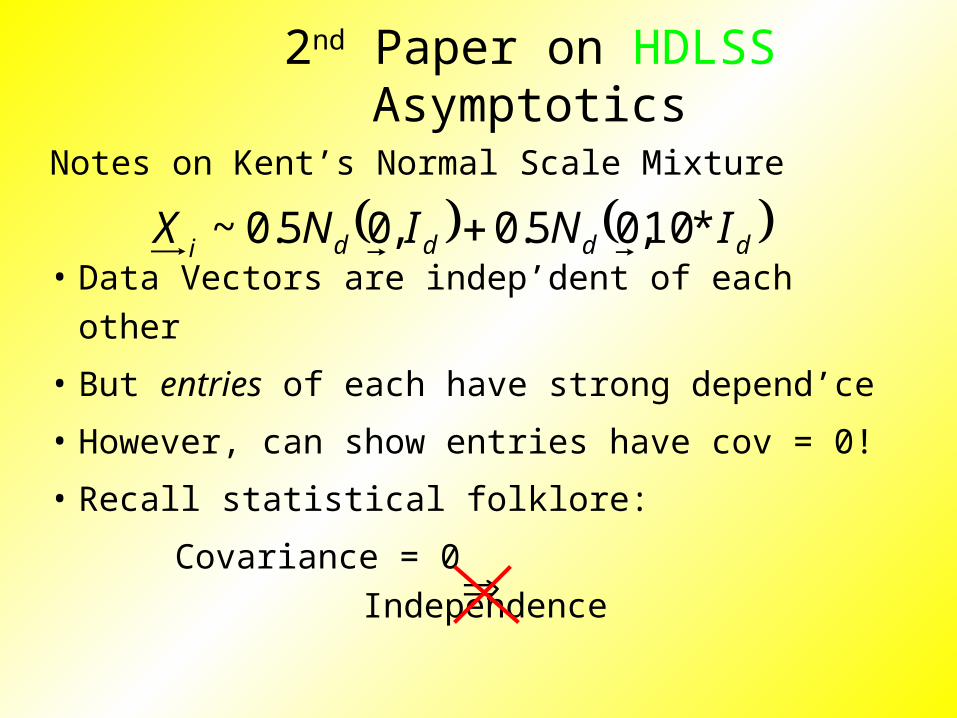
Notes on Kent’s Normal Scale Mixture
• Data Vectors are indep’dent of each other
• But entries of each have strong depend’ce
• However, can show entries have cov = 0!
• Recall statistical folklore:
Covariance = 0 Independence
ddddiININX *10,05.0,05.0~
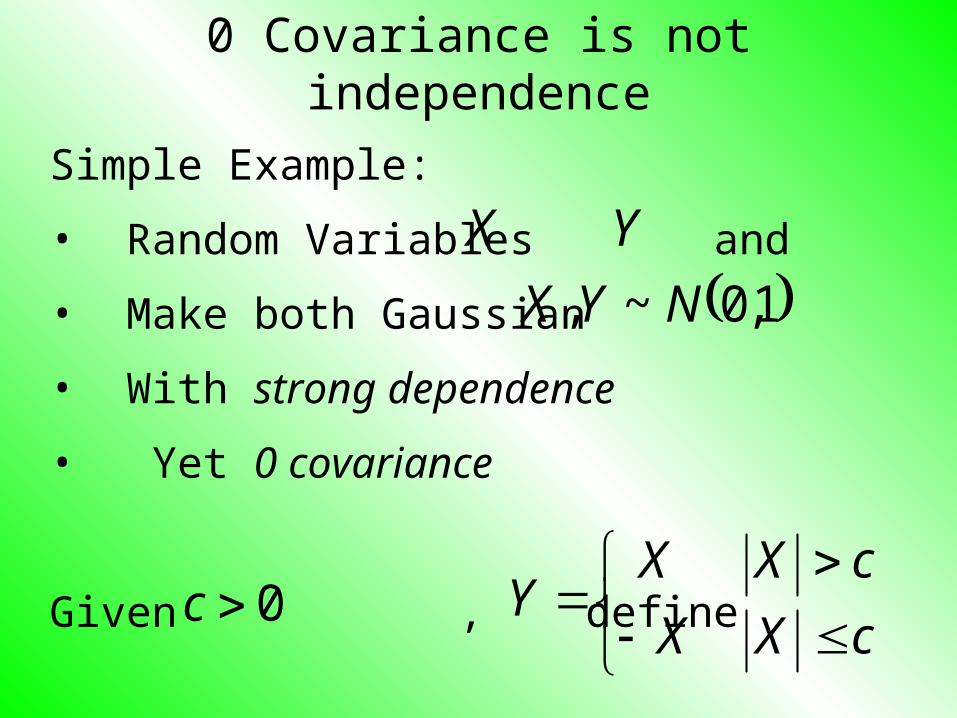
0 Covariance is not independence
Simple Example:
• Random Variables and
• Make both Gaussian
• With strong dependence
• Yet 0 covariance
Given , define
YX
1,0~, NYX
0c
cXX
cXXY
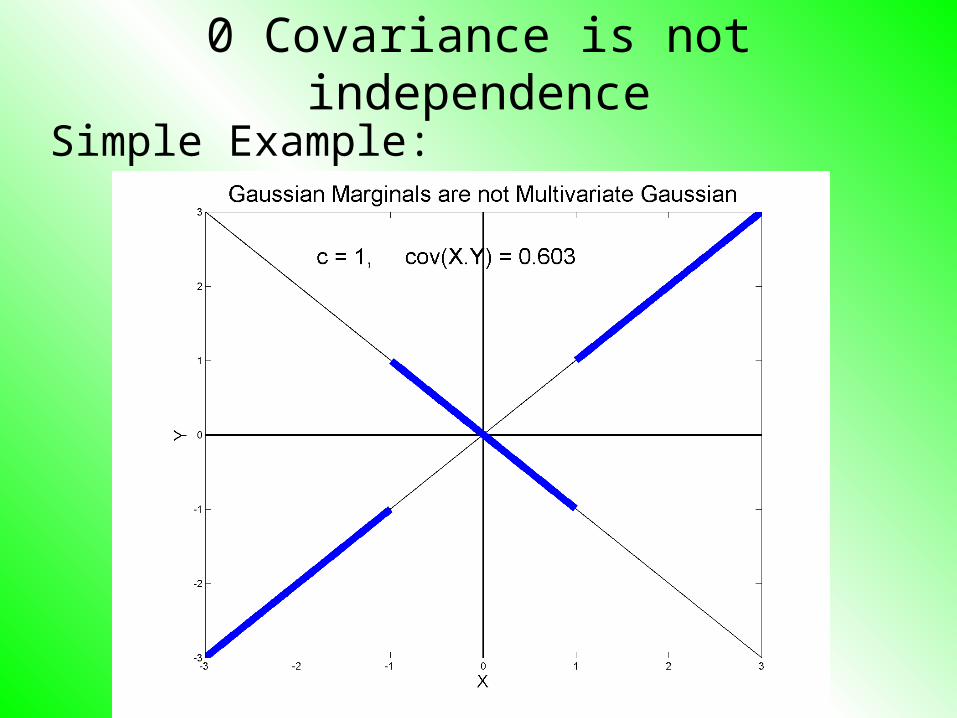
0 Covariance is not independence
Simple Example:
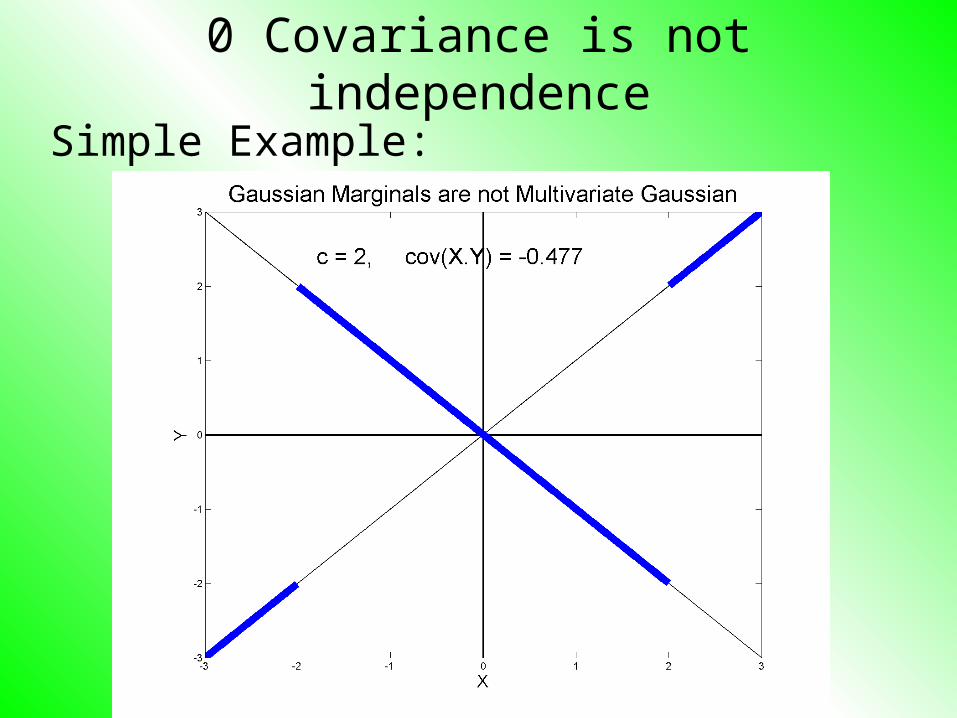
0 Covariance is not independence
Simple Example:
0 Covariance is not independence
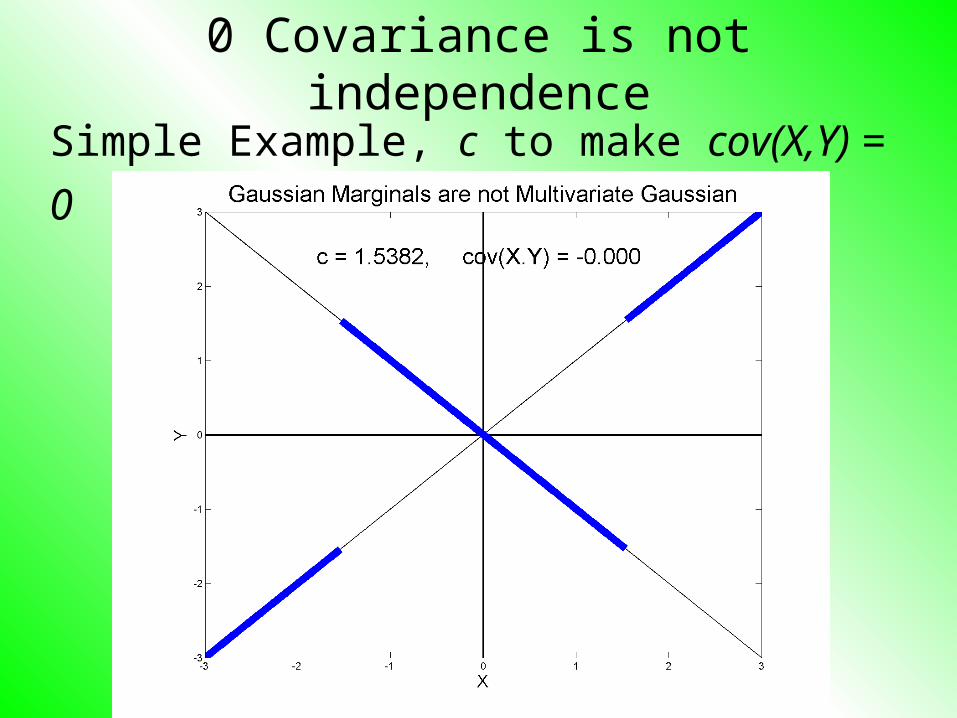
Simple Example, c to make cov(X,Y) = 0

0 Covariance is not independence
Simple Example:
• Distribution is degenerate
• Supported on diagonal lines
• Not abs. cont. w.r.t. 2-d Lebesgue meas.
• For small , have
• For large , have
• By continuity, with
0,cov YXc
c
c 0,cov YX
0,cov YX

0 Covariance is not independence
Result:
• Joint distribution of and :
– Has Gaussian marginals
– Has
– Yet strong dependence of and
– Thus not multivariate Gaussian
Shows Multivariate Gaussian means more
than Gaussian Marginals
YX
0,cov YX
X Y

HDLSS Asy’s: Geometrical Represen’tion
Further Consequences of Geometric Represen’tion
1. Inefficiency of DWD for uneven sample size(motivates weighted version, Xingye Qiao)
2. DWD more stable than SVM(based on deeper limiting distributions)
(reflects intuitive idea feeling sampling variation)(something like mean vs. median)
3. 1-NN rule inefficiency is quantified.

HDLSS Math. Stat. of PCA, I
Consistency & Strong Inconsistency:
Spike Covariance Model, Paul (2007)
For Eigenvalues:
1st Eigenvector:
How good are empirical versions,
as estimates?
1,,1, ,,2,1 dddd d
1u
1,,1 ˆ,ˆ,,ˆ uddd
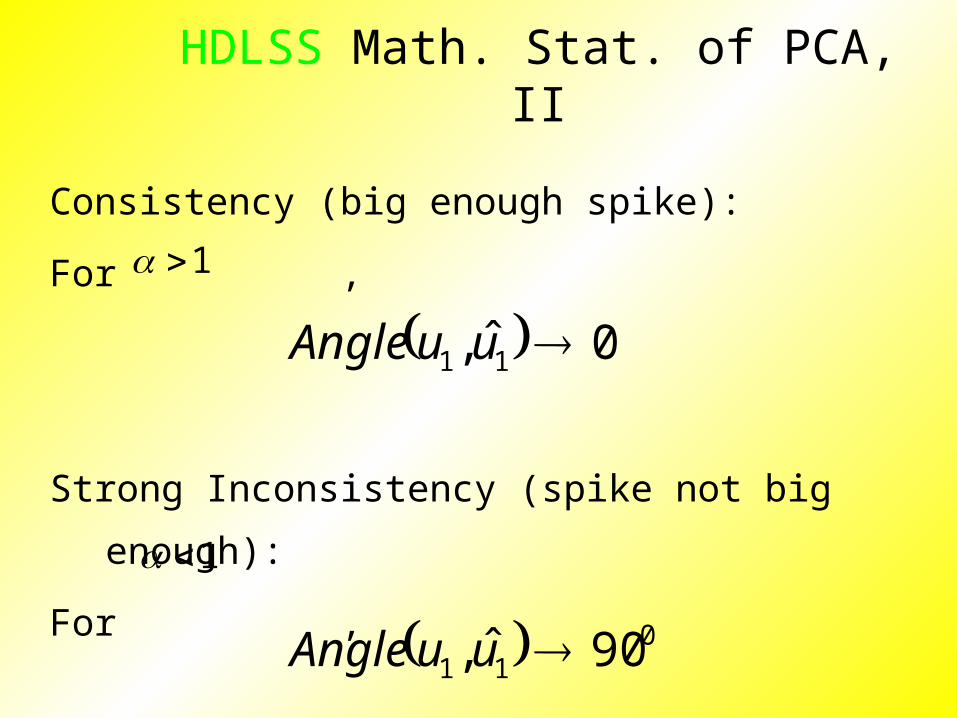
HDLSS Math. Stat. of PCA, II
Consistency (big enough spike):
For ,
Strong Inconsistency (spike not big enough):
For ,
1
0ˆ, 11 uuAngle
1
011 90ˆ, uuAngle
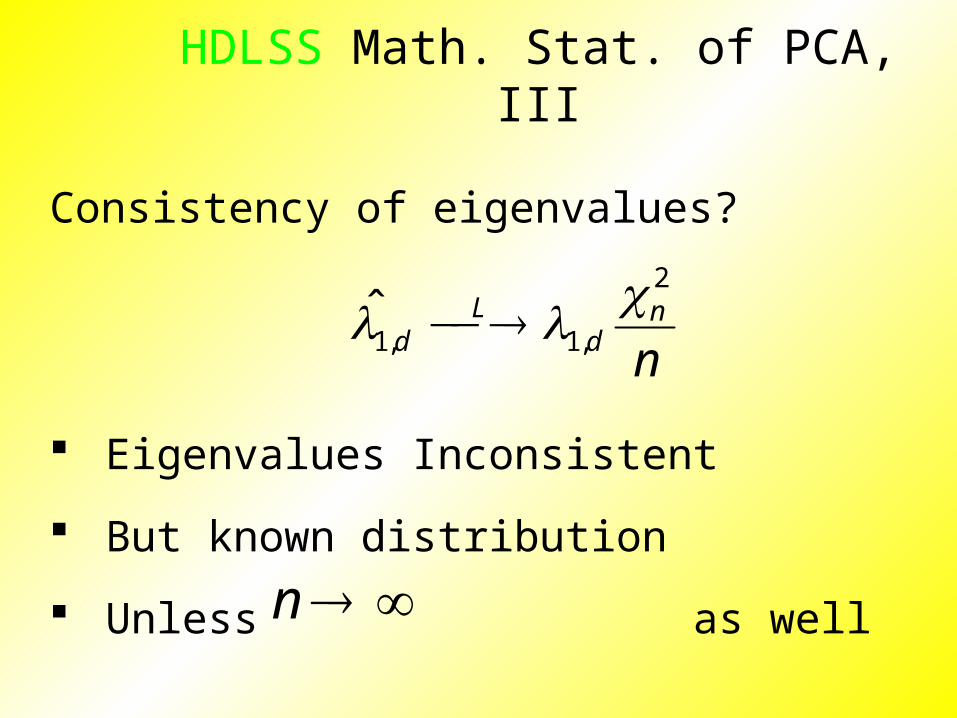
HDLSS Math. Stat. of PCA, III
Consistency of eigenvalues?
Eigenvalues Inconsistent
But known distribution
Unless as well
nn
dL
d
2
,1,1̂
n

HDLSS Work in Progress, I
Batch Adjustment: Xuxin Liu
Recall Intuition from above:
Key is sizes of biological subtypes
Differing ratio trips up mean
But DWD more robust
Mathematics behind this?
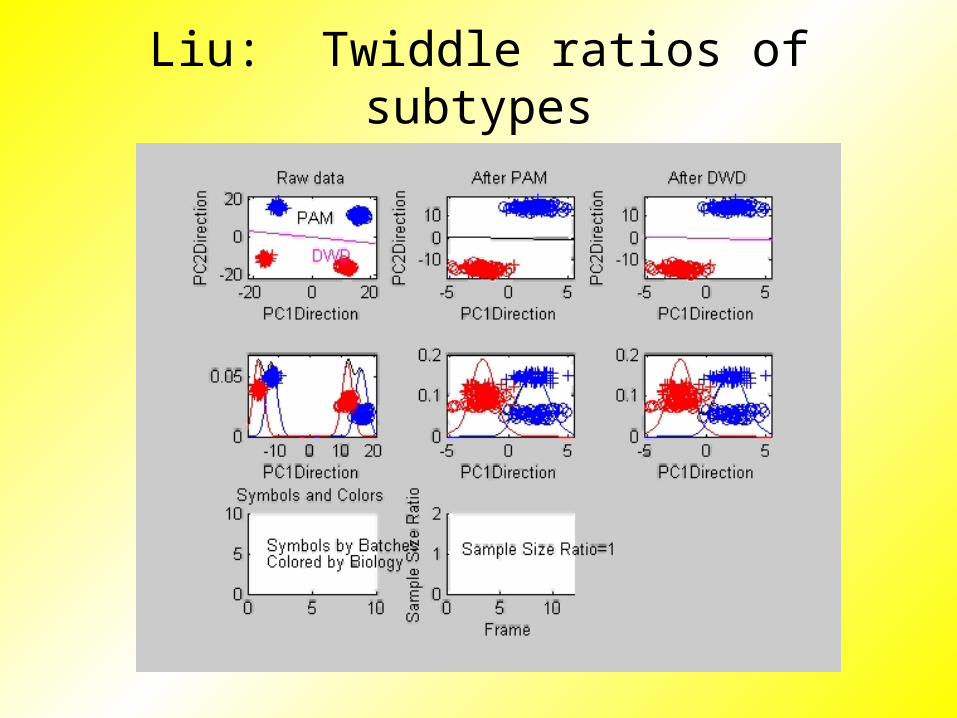
Liu: Twiddle ratios of subtypes

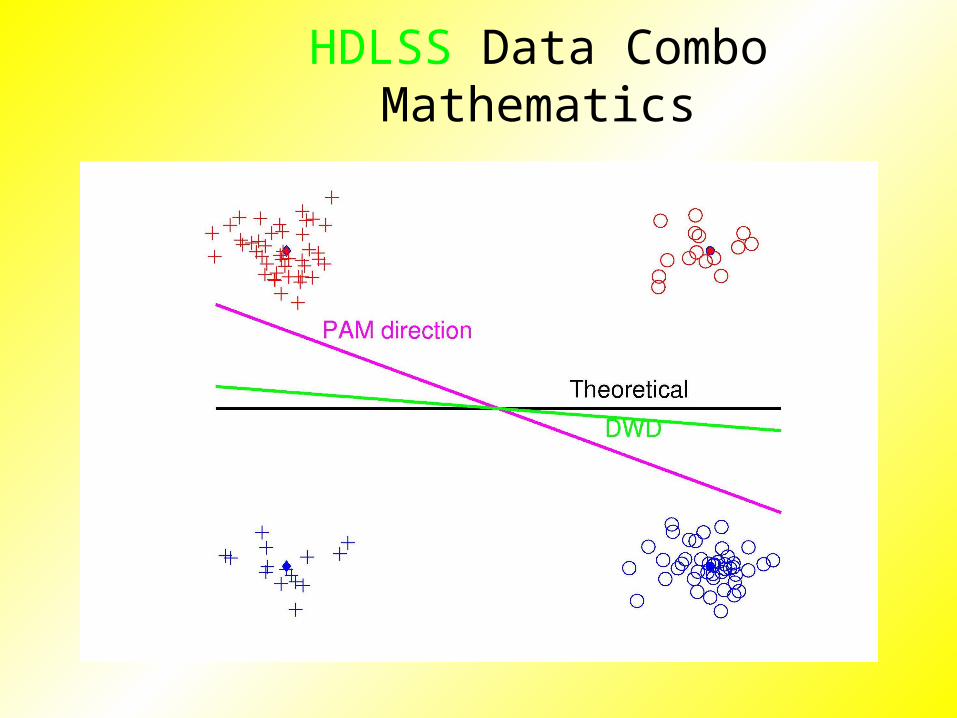
HDLSS Data Combo Mathematics
Xuxin Liu Dissertation Results:
Simple Unbalanced Cluster Model
Growing at rate as
Answers depend on
Visualization of setting….
d d

HDLSS Data Combo Mathematics
HDLSS Data Combo Mathematics

HDLSS Data Combo Mathematics
Asymptotic Results (as ):
For , DWD Consistent
Angle(DWD,Truth)
For , DWD Strongly Inconsistent
Angle(DWD,Truth)
d
2
1
2
1
0
090
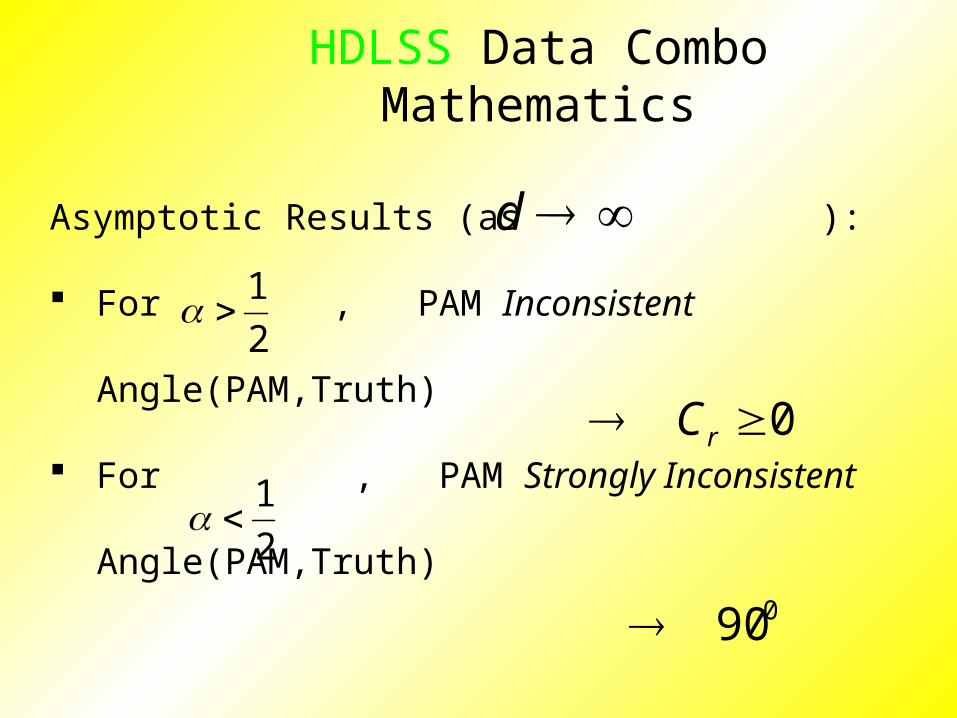
HDLSS Data Combo Mathematics
Asymptotic Results (as ):
For , PAM Inconsistent
Angle(PAM,Truth)
For , PAM Strongly Inconsistent
Angle(PAM,Truth)
d
2
1
2
1
0 rC
090
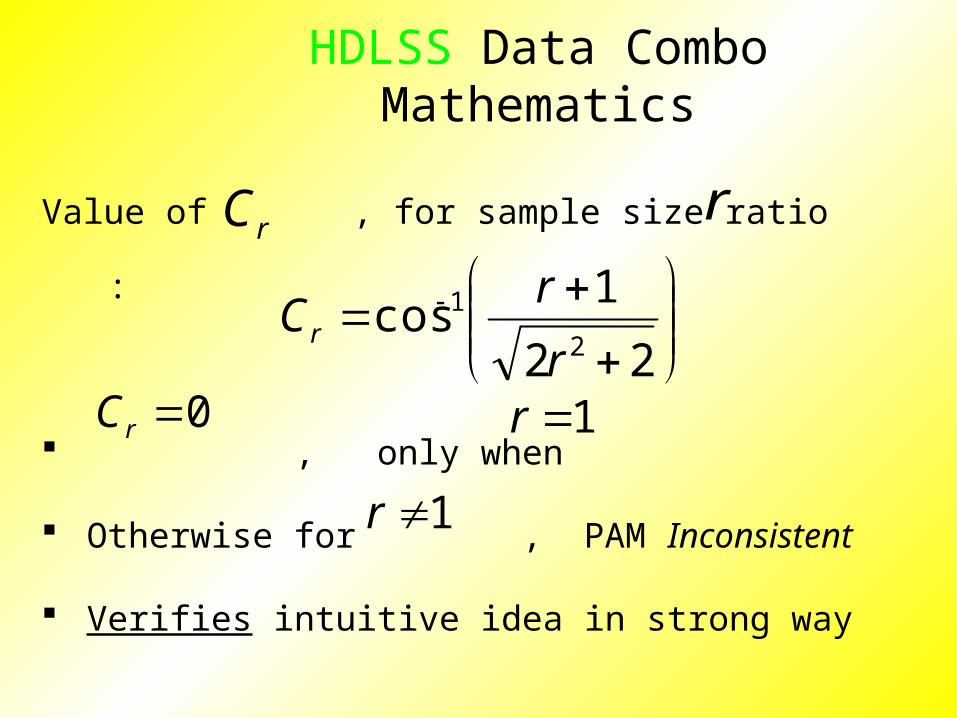
HDLSS Data Combo Mathematics
Value of , for sample size ratio :
, only when
Otherwise for , PAM Inconsistent
Verifies intuitive idea in strong way
rC
22
1cos
2
1
r
rCr
0rC
r
1r
1r
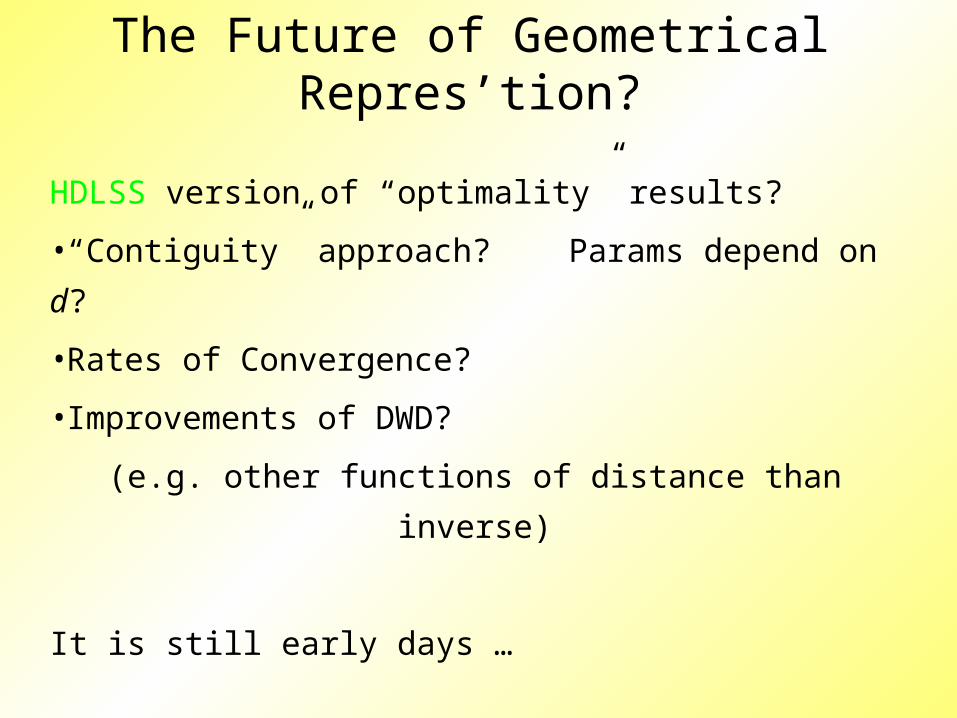
The Future of Geometrical Repres’tion?
HDLSS version of “optimality” results?
•“Contiguity” approach? Params depend on d?
•Rates of Convergence?
•Improvements of DWD?
(e.g. other functions of distance than inverse)
It is still early days …

State of HDLSS Research?
DevelopmentOf Methods
MathematicalAssessment
…
(thanks to:defiant.corban.edu/gtipton/net-fun/iceberg.html)