objective 7: tswbat explain how a lethal recessive allele can be retained in the population and why...
TRANSCRIPT

Objective 7: TSWBAT explain Objective 7: TSWBAT explain how a lethal recessive allele how a lethal recessive allele can be retained in the can be retained in the population and why lethal population and why lethal dominant genes are much dominant genes are much more rare.more rare.

• Lethal recessive alleles are maintained in the population because they are only lethal when homozygous
• Heterozygotes show no symptoms
• Likelihood of mating with another heterozygote is small and even is you do the likelihood of an affected offspring is ¼

• Heterozygote advantage
• Being heterozygous confers an advantage on you
• Example is sickle cell anemia
• Heterozygote has enhanced resistance to malaria
• Lethal dominant genes are more rare because the effects are not masked in the heterozygote
• Many are the result of mutations that subsequently the kill the developing organism
• If symptoms do not appear until late in life, then there is a possibility of passing it on
Objective 8: TSWBAT describe how inheritance has its basis in the behavior of chromosomes during sexual life cycle.
• It was not until 1900 that biology finally caught up with Gregor Mendel.
• Independently, Karl Correns, Erich von Tschermak, and Hugo de Vries all found that Mendel had explained the same results 35 years before.
• Still, resistance remained about Mendel’s laws of segregation and independent assortment until evidence had mounted that they had a physical basis in the behavior of chromosomes.
• Mendel’s hereditary factors are the genes located on chromosomes.
Introduction
Copyright © 2002 Pearson Education, Inc., publishing as Benjamin Cummings
• Around 1900, cytologists and geneticists began to see parallels between the behavior of chromosomes and the behavior of Mendel’s factors.
• Chromosomes and genes are both present in pairs in diploid cells.
• Homologous chromosomes separate and alleles segregate during meiosis.
• Fertilization restores the paired condition for both chromosomes and genes.
Mendelian inheritance has its physical basis in the behavior of chromosomes during sexual life cycles
Copyright © 2002 Pearson Education, Inc., publishing as Benjamin Cummings
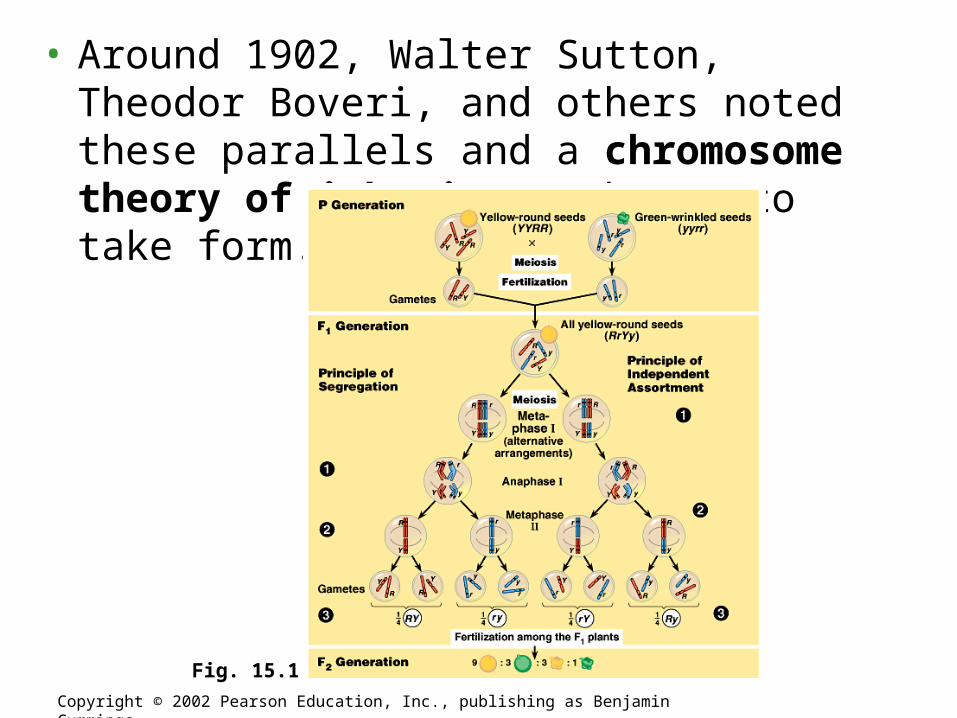
• Around 1902, Walter Sutton, Theodor Boveri, and others noted these parallels and a chromosome theory of inheritance began to take form.
Copyright © 2002 Pearson Education, Inc., publishing as Benjamin Cummings
Fig. 15.1
• Thomas Hunt Morgan was the first to associate a specific gene with a specific chromosome in the early 20th century.
• Like Mendel, Morgan made an insightful choice as an experimental animal, Drosophila melanogaster, a fruit fly species that eats fungi on fruit.
• Fruit flies are prolific breeders and have a generation time of two weeks.
• Fruit flies have three pairs of autosomes and a pair of sex chromosomes (XX in females, XY in males).
Morgan traced a gene to a specific chromosome
Copyright © 2002 Pearson Education, Inc., publishing as Benjamin Cummings
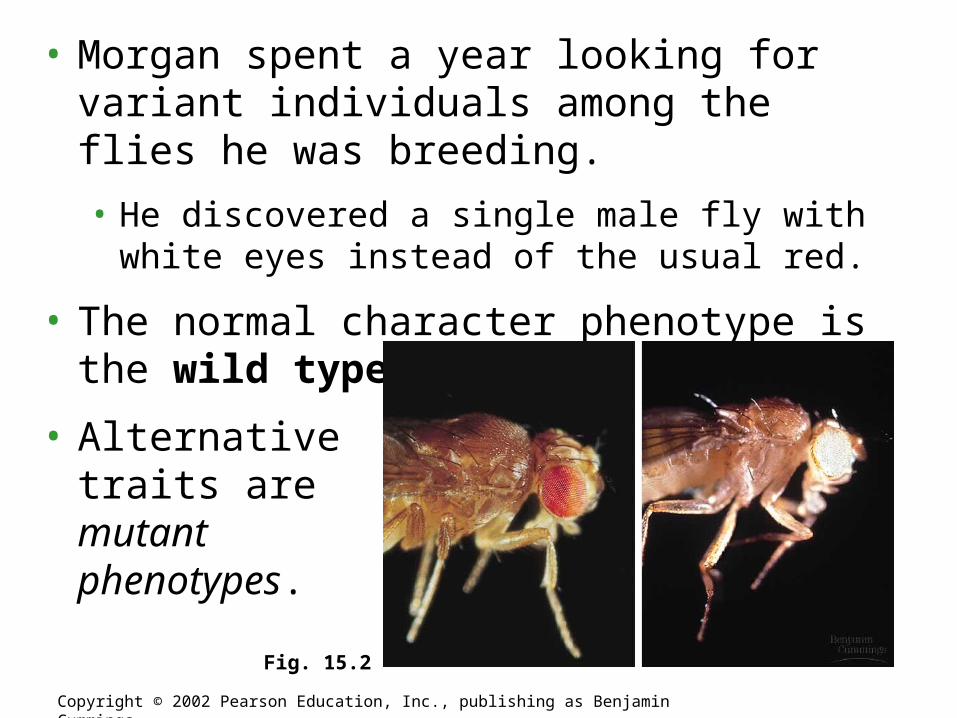
• Morgan spent a year looking for variant individuals among the flies he was breeding.
• He discovered a single male fly with white eyes instead of the usual red.
• The normal character phenotype is the wild type.
• Alternative traits are mutant phenotypes.
Copyright © 2002 Pearson Education, Inc., publishing as Benjamin Cummings
Fig. 15.2

• When Morgan crossed his white-eyed male with a red-eyed female, all the F1 offspring had red eyes,
• The red allele appeared dominant to the white allele.
• Crosses between the F1 offspring produced the classic 3:1 phenotypic ratio in the F2 offspring.
• Surprisingly, the white-eyed trait appeared only in males.
• All the females and half the males had red eyes.
• Morgan concluded that a fly’s eye color was linked to its sex.
Copyright © 2002 Pearson Education, Inc., publishing as Benjamin Cummings

• Morgan deduced that the gene with the white-eyed mutation is on the X chromosome alone, a sex-linked gene.
• Females (XX) may have two red-eyed alleles and have red eyes or may be heterozygous and have red eyes.
• Males (XY) have only a single allele and will be red eyed if they have a red-eyed allele or white-eyed if they have a white-eyed allele.
Copyright © 2002 Pearson Education, Inc., publishing as Benjamin Cummings
Fig. 15.3

• Each chromosome has hundreds or thousands of genes.
• Genes located on the same chromosome, linked genes, tend to be inherited together because the chromosome is passed along as a unit.
• Results of crosses with linked genes deviate from those expected according to independent assortment.
Linked genes tend to be inherited together because they are located on the same chromosome
Copyright © 2002 Pearson Education, Inc., publishing as Benjamin Cummings
• Morgan observed this linkage and its deviations when he followed the inheritance of characters for body color and wing size.
• The wild-type body color is gray (b+) and the mutant black (b).
• The wild-type wing size is normal (vg+) and the mutant has vestigial wings (vg).
• Morgan crossed F1 heterozygous females (b+bvg+vg) with homozygous recessive males (bbvgvg).
Copyright © 2002 Pearson Education, Inc., publishing as Benjamin Cummings

• According to independent assortment, this should produce 4 phenotypes in a 1:1:1:1 ratio.
• Surprisingly, Morgan observed a large number of wild-type (gray-normal) and double-mutant (black-vestigial) flies among the offspring.
• These phenotypes correspond to those of the parents.
Copyright © 2002 Pearson Education, Inc., publishing as Benjamin Cummings

Copyright © 2002 Pearson Education, Inc., publishing as Benjamin Cummings
Fig. 15.4

• Morgan reasoned that body color and wing shape are usually inherited together because their genes are on the same chromosome.
Copyright © 2002 Pearson Education, Inc., publishing as Benjamin Cummings

• The other two phenotypes (gray-vestigial and black-normal) were fewer than expected from independent assortment (and totally unexpected from dependent assortment).
• These new phenotypic variations must be the result of crossing over.

• The production of offspring with new combinations of traits inherited from two parents is genetic recombination.
• Genetic recombination can result from independent assortment of genes located on nonhomologous chromosomes or from crossing over of genes located on homologous chromosomes.
Independent assortment of chromosomes and crossing over produce genetic recombinants
Copyright © 2002 Pearson Education, Inc., publishing as Benjamin Cummings
• Mendel’s dihybrid cross experiments produced some offspring that had a combination of traits that did not match either parent in the P generation.
• If the P generation consists of a yellow-round parent (YYRR) crossed with a green-wrinkled seed parent (yyrr), all F1 plants have yellow-round seeds (YyRr).
• A cross between an F1 plant and a homozygous recessive plant (a test-cross) produces four phenotypes.
• Half are be parental types, with phenotypes that match the original P parents, either with yellow-round seeds or green-wrinkled seeds.
• Half are recombinants, new combination of parental traits, with yellow-wrinkled or green-round seeds.
Copyright © 2002 Pearson Education, Inc., publishing as Benjamin Cummings
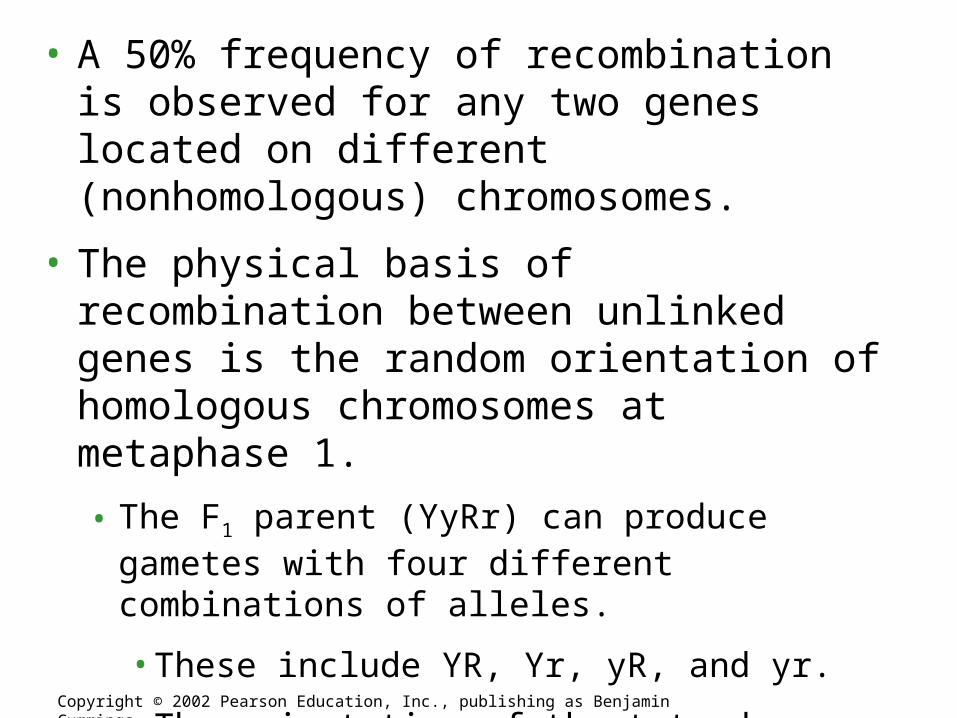
• A 50% frequency of recombination is observed for any two genes located on different (nonhomologous) chromosomes.
• The physical basis of recombination between unlinked genes is the random orientation of homologous chromosomes at metaphase 1.
• The F1 parent (YyRr) can produce gametes with four different combinations of alleles.
• These include YR, Yr, yR, and yr.
• The orientation of the tetrad containing the seed color gene has no bearing on the orientation on the tetrad with the seed shape gene.
Copyright © 2002 Pearson Education, Inc., publishing as Benjamin Cummings
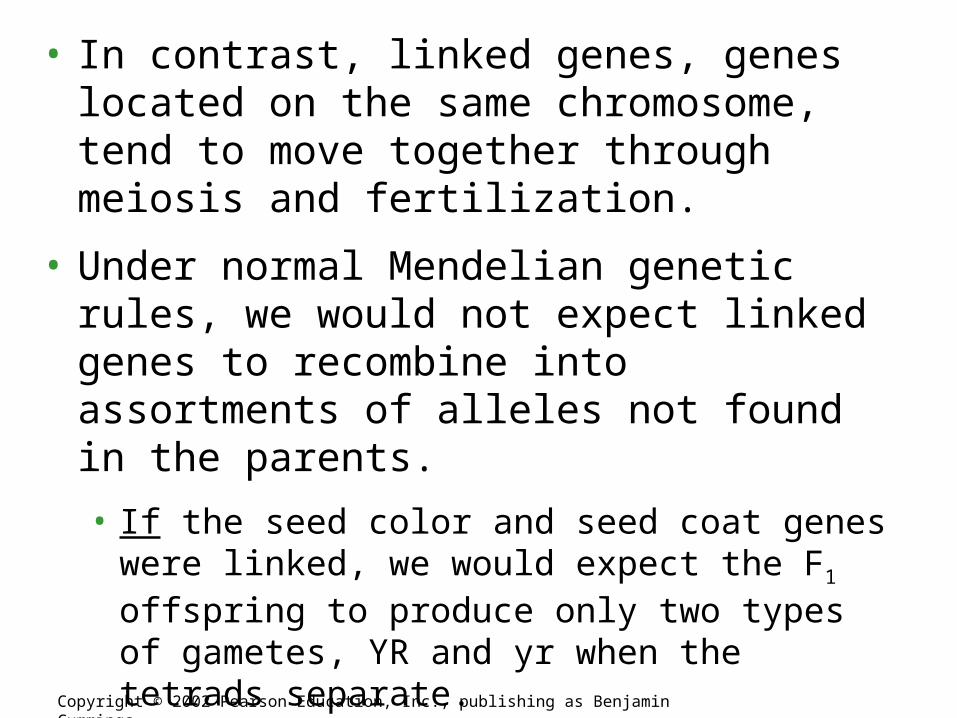
• In contrast, linked genes, genes located on the same chromosome, tend to move together through meiosis and fertilization.
• Under normal Mendelian genetic rules, we would not expect linked genes to recombine into assortments of alleles not found in the parents.
• If the seed color and seed coat genes were linked, we would expect the F1 offspring to produce only two types of gametes, YR and yr when the tetrads separate.
• One homologous chromosome from a P generation parent carries the Y and R alleles on the same chromosome and the other homologous chromosome from the other P parent carries the y and r alleles.
Copyright © 2002 Pearson Education, Inc., publishing as Benjamin Cummings
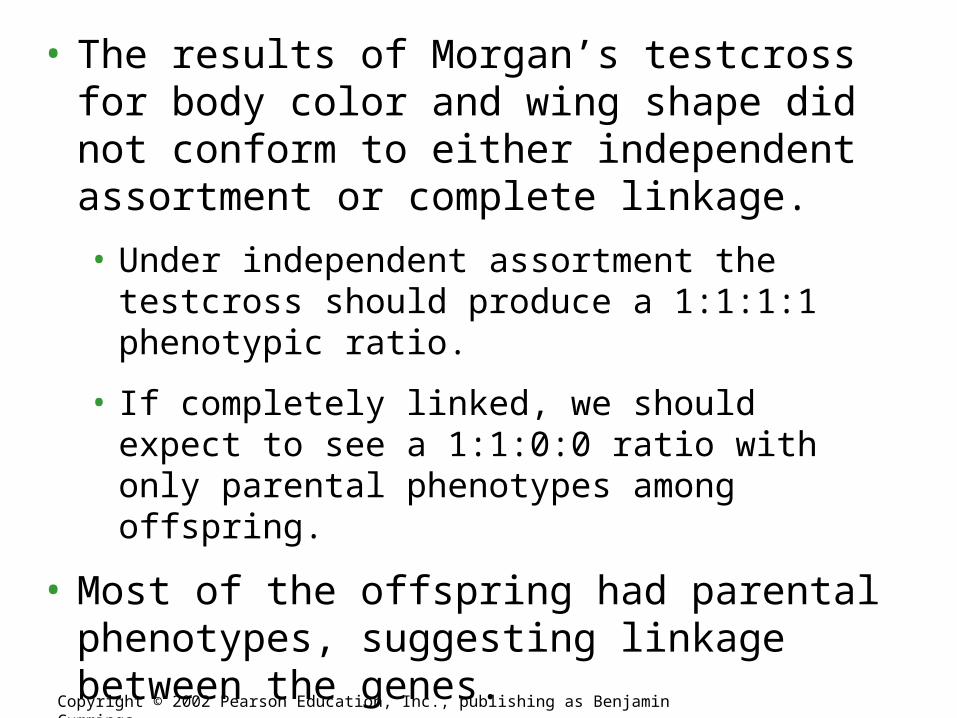
• The results of Morgan’s testcross for body color and wing shape did not conform to either independent assortment or complete linkage.
• Under independent assortment the testcross should produce a 1:1:1:1 phenotypic ratio.
• If completely linked, we should expect to see a 1:1:0:0 ratio with only parental phenotypes among offspring.
• Most of the offspring had parental phenotypes, suggesting linkage between the genes.
• However, 17% of the flies were recombinants, suggesting incomplete linkage.
Copyright © 2002 Pearson Education, Inc., publishing as Benjamin Cummings

• Morgan proposed that some mechanism occasionally exchanged segments between homologous chromosomes.
• This switched alleles between homologous chromosomes.
• The actual mechanism, crossing over during prophase I, results in the production of more types of gametes than one would predict by Mendelian rules alone.
Copyright © 2002 Pearson Education, Inc., publishing as Benjamin Cummings
Fig. 15.5a
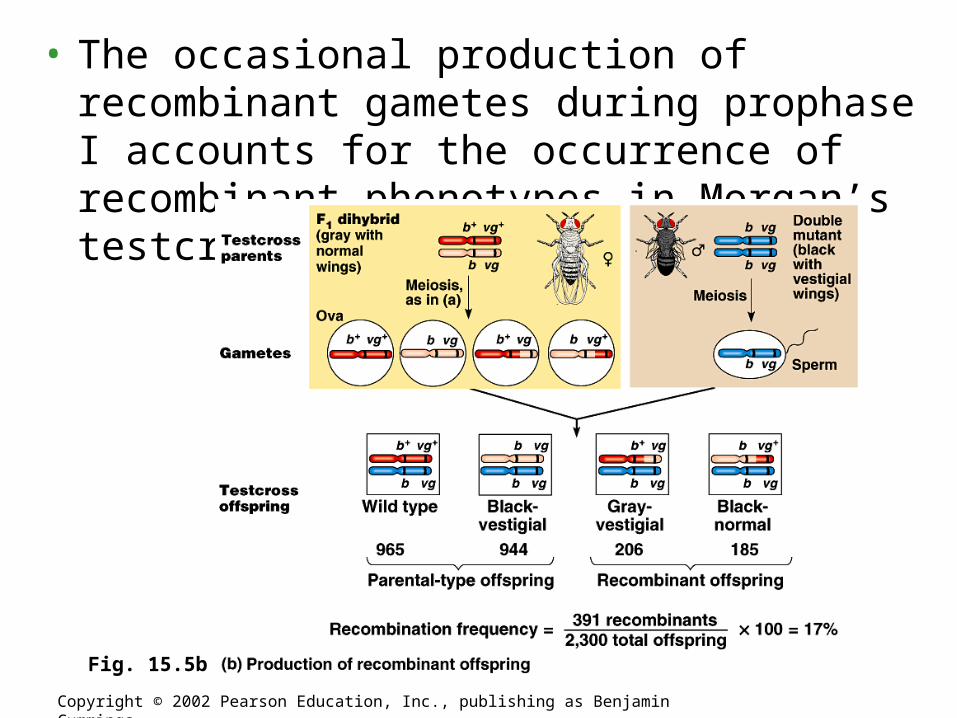
• The occasional production of recombinant gametes during prophase I accounts for the occurrence of recombinant phenotypes in Morgan’s testcross.
Copyright © 2002 Pearson Education, Inc., publishing as Benjamin Cummings
Fig. 15.5b
Objective 9: TSWBAT Objective 9: TSWBAT construct a gene map construct a gene map from recombination from recombination frequencies.frequencies.

• One of Morgan’s students, Alfred Sturtevant, used crossing over of linked genes to develop a method for constructing a chromosome map.
• This map is an ordered list of the genetic loci along a particular chromosome.
Geneticists can use recombination data to map a chromosome’s genetic loci
Copyright © 2002 Pearson Education, Inc., publishing as Benjamin Cummings
• Sturtevant hypothesized that the frequency of recombinant offspring reflected the distances between genes on a chromosome.
• The farther apart two genes are, the higher the probability that a crossover will occur between them and therefore a higher recombination frequency.
• The greater the distance between two genes, the more points between them where crossing over can occur.
• Sturtevant used recombination frequencies from fruit fly crosses to map the relative position of genes along chromosomes, a linkage map.
Copyright © 2002 Pearson Education, Inc., publishing as Benjamin Cummings

• Sturtevant used the test cross design to map the relative position of three fruit fly genes, body color (b), wing size (vg), and eye color (cn).
• The recombination frequency between cn and b is 9%.
• The recombination frequency between cn and vg is 9.5%.
• The recombination frequency between b and vg is 17%.
• The only possible arrangement of these three genes places the eye color gene between the other two.
Copyright © 2002 Pearson Education, Inc., publishing as Benjamin Cummings
Fig. 15.6

• Sturtevant expressed the distance between genes, the recombination frequency, as map units.
• One map unit (sometimes called a centimorgan) is equivalent to a 1% recombination frequency.
• You may notice that the three recombination frequencies in our mapping example are not quite additive: 9% (b-cn) + 9.5% (cn-vg) > 17% (b-vg).
• This results from multiple crossing over events.
• A second crossing over “cancels out” the first and reduced the observed number of recombinant offspring.
• Genes father apart (for example, b-vg) are more likely to experience multiple crossing over events.
Copyright © 2002 Pearson Education, Inc., publishing as Benjamin Cummings

• Some genes on a chromosome are so far apart that a crossover between them is virtually certain.
• In this case, the frequency of recombination reaches is its maximum value of 50% and the genes act as if found on separate chromosomes and are inherited independently.
• In fact, several genes studies by Mendel are located on the same chromosome.
• For example, seed color and flower color are far enough apart that linkage is not observed.
• Plant height and pod shape should show linkage, but Mendel never reported results of this cross.
Copyright © 2002 Pearson Education, Inc., publishing as Benjamin Cummings
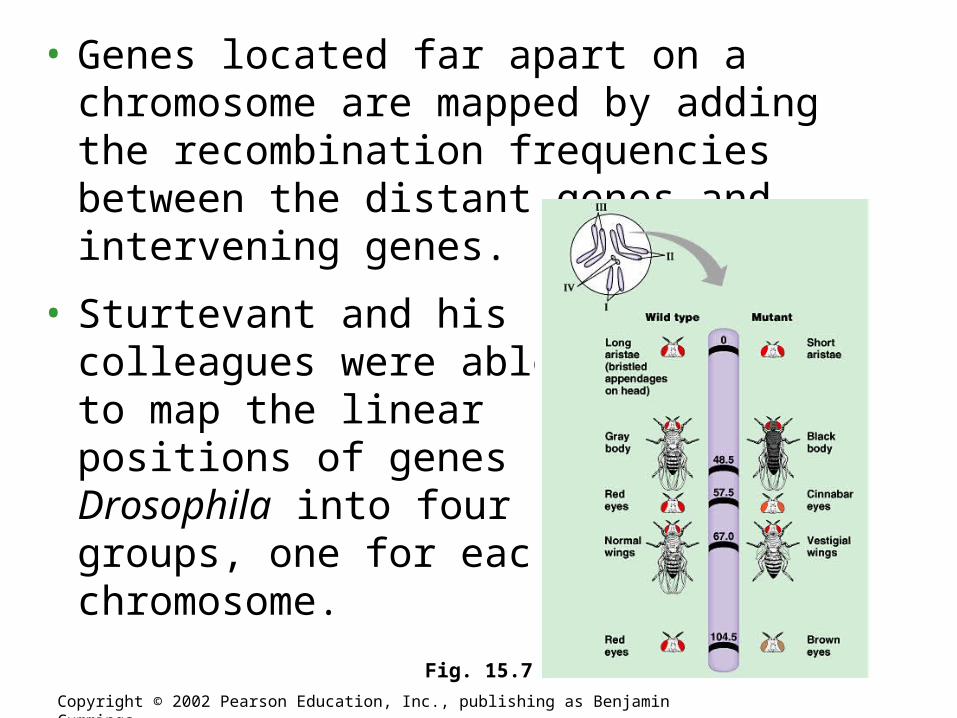
• Genes located far apart on a chromosome are mapped by adding the recombination frequencies between the distant genes and intervening genes.
• Sturtevant and his colleagues were able to map the linear positions of genes in Drosophila into four groups, one for each chromosome.
Copyright © 2002 Pearson Education, Inc., publishing as Benjamin Cummings
Fig. 15.7

• A linkage map provides an imperfect picture of a chromosome.
• Map units indicate relative distance and order, not precise locations of genes.
• The frequency of crossing over is not actually uniform over the length of a chromosome.
• Combined with other methods like chromosomal banding, geneticists can develop cytological maps.
• These indicated the positions of genes with respect to chromosomal features.
• More recent techniques show the absolute distances between gene loci in DNA nucleotides.
Copyright © 2002 Pearson Education, Inc., publishing as Benjamin Cummings