objectives - · pdf fileobjectives 0 making mexican desserts more than an after thought, but...
TRANSCRIPT

Mission
I will provide a full service Mexican restaurant serving a combination of regional dishes and decedent desserts bringing together tradition and flavor. My restaurant will
emphasize quality in all that is to be served; from beginning to end of your dining experience. My mission
is to immerse people in authentic cuisine and to give one crucial advice, “save room for dessert” because it
will be the pinnacle of your visit.
Objectives
0 MakingMexicandessertsmorethananafterthought,butanidealconclusiontoagreatmeal.
0 Apledgetoquality,freshness,andflavor.
0 Mexicancultureisafoodculture:remainfaithfultotraditionalcuisine,definingMexicanfoodinanewway

:Market Analysis:Industry Analysis
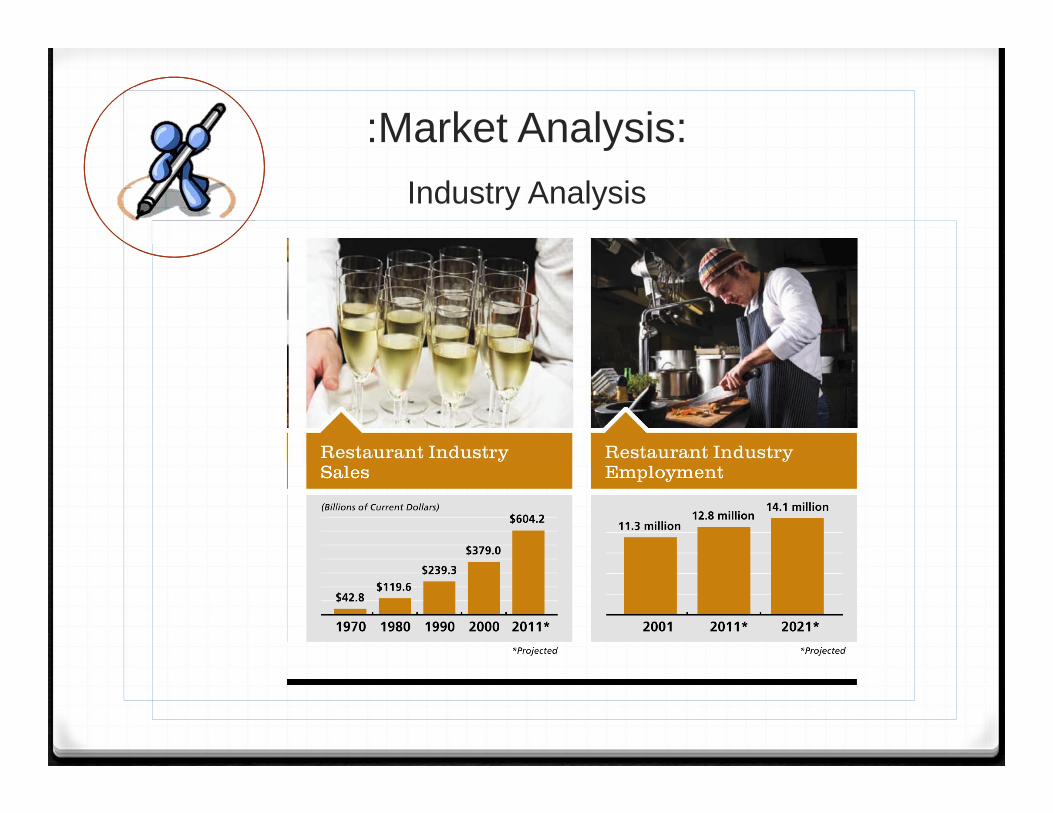
:Market Analysis:Industry Analysis

:Market Analysis: Target Market
0 DesiredTargetMarketwouldbefamilies
0 CustomerProfile:• Income: Lower‐Mid and upward• Ages: Families in all age groups• Size: 4‐6 members• VALS Segment Profile:“experiencers”, “believers”, and “thinkers”.

0 Location:Napa!
0 Pros:• WorldClasstouristdestination• FamilyFriendlyrestaurantsarelimited• DessertandMexicanrestaurants0 Cons:• Highrisk• Location• Oversaturation
:Market Analysis: Target Market

:Market Analysis:Competitive Analysis
Competitor 1 Competitor 2 Competitor 3 Your BusinessName Name Name
FACTORS VillaCorona Red Hen Taqueria Rosita
Products 2 3 2 1Price 2 3 2 2Quality 2 2 2 1Product Selection 3 3 3 1Customer Service 3 2 2 1Reliability 3 1 1 1Expertise 1 1 1 3Location 1 1 1 3Appearance 3 1 3 1Sales Method 3 2 2 2Availabilty 1 1 1 1Management 3 1 1 3Stability 2 1 1 3Communications 2 2 2 3
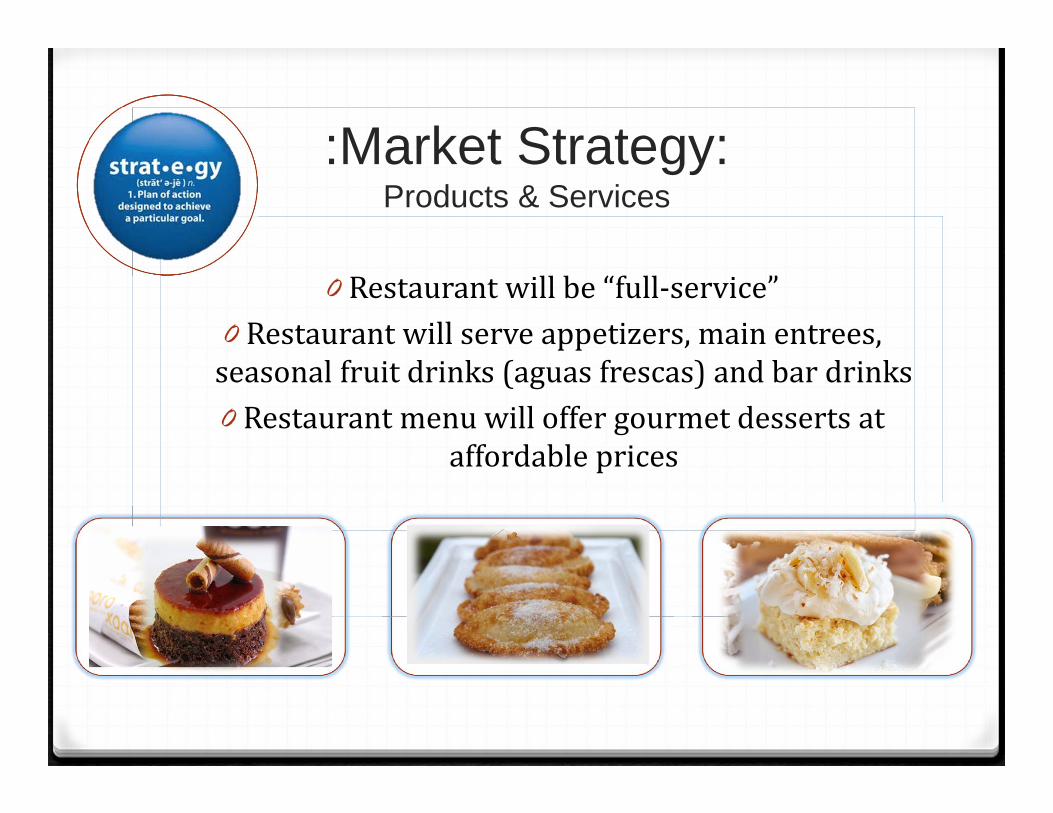
:Market Strategy:Products & Services
0 Restaurantwillbe“full‐service”0 Restaurantwillserveappetizers,mainentrees,seasonalfruitdrinks(aguas frescas)andbardrinks0 Restaurantmenuwilloffergourmetdessertsat
affordableprices

:Market Strategy:Methods
“Social media savvy consumers (frequent users of at least one social media tool,
including Facebook, Twitter, mobile phone applications such as Foursquare or Urban Spoon, or online review sites such as Yelp) are more active in the restaurant community
and dine out more frequently than the general public”
The National Restaurant Association

:Market Strategy:Methods
Frequent Customer s Ar e ConnectedFrequent restaurant customers are more likely than the general public to use various forms of technology daily. Eighty-one percent of f requent fullservice and quickservice customers and 77 percent of f requent of f -premises dinner customers said they f requent ly used the Internet , compared with 72 percent of all adults. All three f requent customer groups are more likely than the general public to habitually use e-mail.
Tapping In to TechnologyProportion of adults who frequently use the following forms of technology
Frequent Frequent All Fullservice Quickservice Off -Premises Adults Customers Customers Dinner Customers
Internet 72% 81% 81% 77%
E-mail 68% 80% 75% 74%
Text messaging 45% 40% 54% 59%
Facebook 33% 31% 45% 48%Mobile phone applicat ions, e.g., Foursquare or Urban Spoon 8% 13% 11% 17%
Online review sites, such as Yelp 7% 10% 9% 6%
Twit ter 4% 8% 8% 11%
Source: National Restaurant Association, National Household Sur vey, 2010

:Marketing Strategy:Marketing Mix
0 FortheLocals:• BilingualStaff• Take‐Out• Affordable• DowntownLocation• SportsTeamSponsorship• Kid’sMenu• ChurroTruck• FrequentBuyerCards

:Marketing Strategy:Marketing Mix
0 FortheTourists:• Pairingwinewithrestaurantdishes• Multi‐lingualMenus• Location• Advertisement• Website

:Customer Service Plan:

:Operational Plan:Timeline for 1st Year
0 “Activities”:• Website:www.godaddy.com• BusinessCheckingAccount
• BookKeeper• Insurance
• BusinessCards• BusinessLicense
• FirePreventionInfo• LandUsePermit• ZoningClearance
• DBA• RegisteringBusinesswithState
• WorkersCompensation• EmployerIdentificationNumber
• TaxForms

:Management Plan:
0 PrincipalOwners
0 Stakeholders
0 EntityofBusiness
0 Employees

Financials

:Fin
anci
als:
Tota
l Sta
rt-U
p C
osts
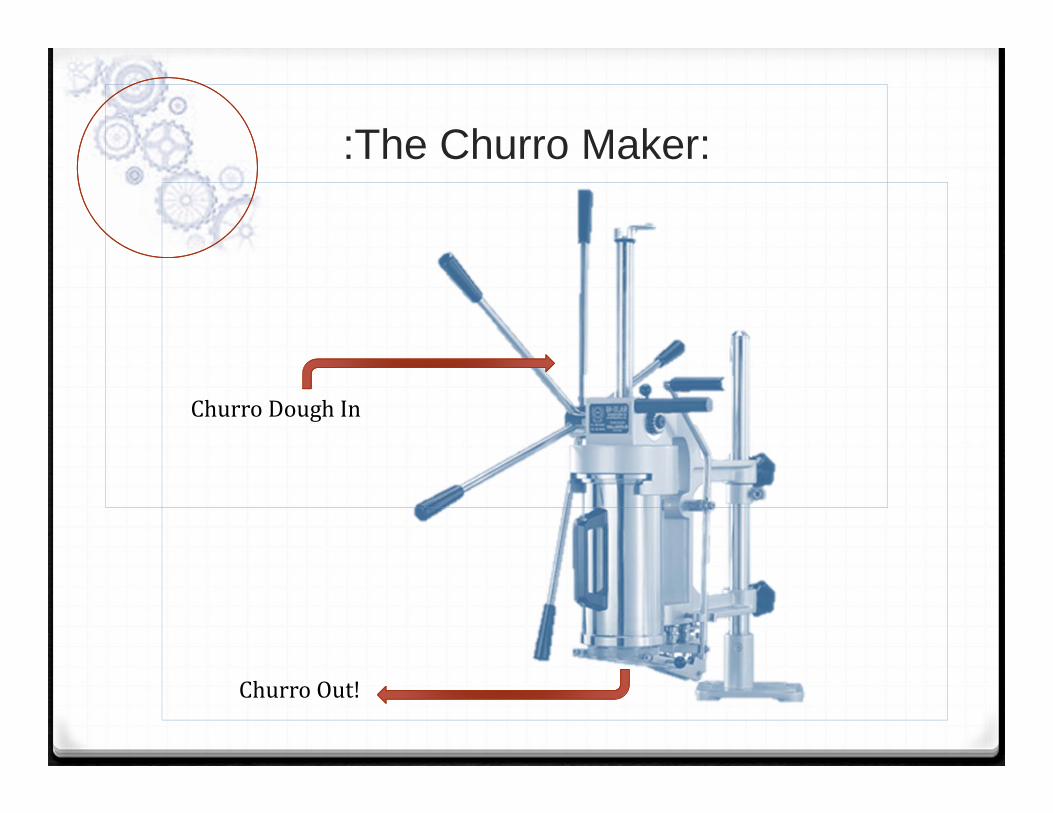
:The Churro Maker:
ChurroDoughIn
ChurroOut!

:Operational Plan:Projections and Rational
Assumptions
# of Customers
Projected Customer Counts Ave Check Mon Tues Wed Thurs Friday Sat Sunday TotalTotal Sales
Lunch Food 10.00 30 30 50 60 60 80 80 390 3,900 Lunch Bar 3.75 15 15 25 30 30 40 35 190 713 Dinner Food 14.00 30 30 40 50 70 80 70 370 5,180 Dinner Bar 5.00 15 15 20 25 35 40 35 185 925
0 -0 -560 10,718
SpreadSheetSource:CharlieMonahanRestaurantSalesEstimatorNapaValleyCollegeSmallBusinessDevelopmentCenter

:Financials:Projections and Rational
Summary TotalsWeekly Food Sales 9,080 Weekly Bar Sales 1,638 Total Weekly Sales 10,718
Monthly Food Sales 38,590 Monthly Bar Sales 6,959 Total Monthly Sales 45,549
Food Portion of Sales 85%Bar Portion of Sales 15%
Weekly Lunch Sales 4,613 Weekly Dinner Sales 6,105
10,718
Lunch Sales to Total Sales 43.0%Dinner Sales to Total Sales 57.0%
2011Annual Food Sales 463,080 Annual Beverage Sales 83,513 Total Annual Sales 546,593

Year 2011 Jan Feb Mar April May June July Aug Sept Oct Nov Dec YTD 2011Food Sales 34,268 36,120 37,973 39,825 40,751 41,214 41,677 42,140 40,751 39,362 33,342 35,657 463,080 Beverage Sales 6,180 6,514 6,848 7,182 7,349 7,433 7,516 7,600 7,349 7,099 6,013 6,430 83,513 GROSS SALES 40,448 42,634 44,821 47,007 48,100 48,647 49,193 49,740 48,100 46,460 39,355 42,088 546,593
-Cost of SalesFood (33%) 11,308 11,920 12,531 13,142 13,448 13,601 13,753 13,906 13,448 12,989 11,003 11,767 152,816 Beverage (25%) 1,545 1,628 1,712 1,796 1,837 1,858 1,879 1,900 1,837 1,775 1,503 1,608 20,878 TOTAL COST OF SALES 12,853 13,548 14,243 14,938 15,285 15,459 15,633 15,806 15,285 14,764 12,506 13,374 173,695
-GROSS PROFIT 27,594 29,086 30,578 32,069 32,815 33,188 33,561 33,934 32,815 31,696 26,849 28,713 372,898
- - - - - - - -General and AdministrativeEmployee Salaries (25%) 10,112 10,659 11,205 11,752 12,025 12,162 12,298 12,435 12,025 11,615 9,839 10,522 136,648 Management Salaries 3,400 3,400 3,400 3,400 3,400 3,400 3,400 3,400 3,400 3,400 3,400 3,400 40,800 Employer Taxes/Benefits (15% Wages) 1,621 1,687 1,753 1,818 1,851 1,867 1,884 1,900 1,851 1,802 1,589 1,671 21,294 Workers Compensation (6% Wages) 811 844 876 909 926 934 942 950 926 901 794 835 10,647 Advertising 200 200 200 200 200 200 200 200 200 200 200 200 2,400 Bookkeeping 150 150 150 150 150 150 150 150 150 150 150 150 1,800 Credit Card Charges (1%) 404 426 448 470 481 486 492 497 481 465 394 421 5,466 Insurance 250 250 250 250 250 250 250 250 250 250 250 250 3,000 Legal and Professional Fees 100 100 100 100 100 100 100 100 100 100 100 100 1,200 Misc. Other 250 250 250 250 250 250 250 250 250 250 250 250 3,000 Office Supplies 175 175 175 175 175 175 175 175 175 175 175 175 2,100 Rent 3,000 3,000 3,000 3,000 3,000 3,000 3,000 3,000 3,000 3,000 3,000 3,000 36,000 Repair and Maintenance 300 300 300 300 300 300 300 300 300 300 300 300 3,600 Small Equipment 200 200 200 200 200 200 200 200 200 200 200 200 2,400 Telephone 150 150 150 150 150 150 150 150 150 150 150 150 1,800 Garbage 200 200 200 200 200 200 200 200 200 200 200 200 2,400 Utilities 1,200 1,200 1,200 1,200 1,200 1,200 1,200 1,200 1,200 1,200 1,200 1,200 14,400 Total Gen. and Admin. (Fixed) 22,524 23,190 23,857 24,524 24,858 25,024 25,191 25,358 24,858 24,357 22,190 23,024 288,955
-NET PROFIT OR LOSS 5,071 5,896 6,720 7,545 7,957 8,164 8,370 8,576 7,957 7,339 4,658 5,689 83,943 SBA Loan 1,333 1,333 1,333 1,333 1,333 1,333 1,333 1,333 1,333 1,333 1,333 1,333 15,996 Cash Flow After Financing 3,738 4,563 5,387 6,212 6,624 6,831 7,037 7,243 6,624 6,006 3,325 4,356 67,947 Draw 4,000 4,000 4,000 4,000 4,000 4,000 4,000 4,000 4,000 4,000 4,000 4,000 48,000 Net Cash Flow (262) 563 1,387 2,212 2,624 2,831 3,037 3,243 2,624 2,006 (675) 356 19,947
Accumulated Cash Flow 300 1,688 3,900 6,524 9,355 12,392 15,635 18,259 20,265 19,591 19,947
Average Daily Sales / 22 days 1,839 1,938 2,037 2,137 2,186 2,211 2,236 2,261 2,186 2,112 1,789 1,913
:Financials: Projections and Rational SpreadSheetSource:CharlieMonahanRestaurantSalesEstimatorNapaValleyCollegeSmallBusinessDevelopmentCenter

:Financials:The Break Even
Full Year Fixed Costs Including Debt $304,951 Contribution Margin 68.2%
Break Even Sales $447,470
Monthly Fixed Costs Including Debt $25,413 Minimum Monthly Break Even $37,289 Daily Break Even (30 days) $1,242

:Conclusion: