objectives method instrument - american university of beirut · bus 230 2 10:00 badm conf shibl en...
TRANSCRIPT

As part of the process improvement initiative, the Office of Tests and Measurements administered in October 2001 a survey that evaluates student satisfaction with the Fall 2001 Registration procedure. Objectives ! To measure students’ level of satisfaction with the registration process as a whole,
and with its different processes. ! To evaluate the effect of changes initiated this year on student satisfaction with the
process. ! To identify existing problems, if any, and recommend changes.
Method Instrument The Student Satisfaction Feedback Survey was prepared using the same guidelines adopted for the 1999 and 2000 surveys (Appendix A). A five-point rating scale was used to assess students satisfaction / dissatisfaction with various phases of the registration process. The Survey included the following components: # Biographical data. A number of questions requesting information on student
background, gender, status, major, etc.. . # The nine registration steps: Placement Tests, Pre-registration, New Student
Orientation, Academic Advising, On-line Registration, Statement of Fees, ID Card & Renewal of Stickers, and AUB net Account and Drop & Add. Items measuring the time each step took and the level of student satisfaction with that specific phase of the process were also included.
# Global items measuring students’ overall satisfaction with the process, in general, and with specific elements like ambiance, courtesy, instructions given, etc.
# Other related issues like Drop & Add, Financial Aid, etc. # Comments section at the end of every step and at the end of the Survey to solicit
feedback and suggestions. Sample The sample consisted of 640 students from all faculties representing 11% of the population. Cluster sampling was used. The sample came from 21 classrooms selected using similar guidelines to the ones followed in selecting the 1999 and 2000 samples. Table 1 provides a list of course sections covered by the Survey. A breakdown of the sample by faculty, gender, nationality, class, and status is presented in Tables 2 – 6. In addition, these tables provide the population figures (if available at time of writing of report) for the University on each of these dimensions.
1
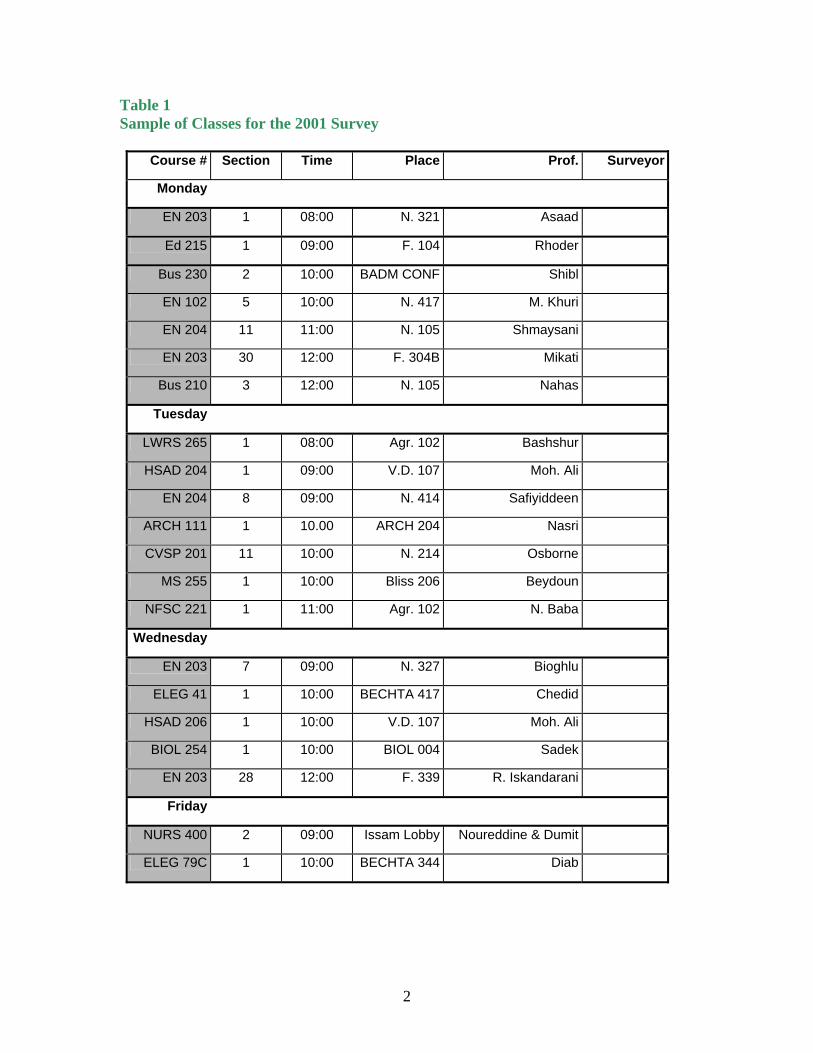
Table 1 Sample of Classes for the 2001 Survey
Course # Section Time Place Prof. Surveyor
Monday
EN 203 1 08:00 N. 321 Asaad
Ed 215 1 09:00 F. 104 Rhoder
Bus 230 2 10:00 BADM CONF Shibl
EN 102 5 10:00 N. 417 M. Khuri
EN 204 11 11:00 N. 105 Shmaysani
EN 203 30 12:00 F. 304B Mikati
Bus 210 3 12:00 N. 105 Nahas
Tuesday
LWRS 265 1 08:00 Agr. 102 Bashshur
HSAD 204 1 09:00 V.D. 107 Moh. Ali
EN 204 8 09:00 N. 414 Safiyiddeen
ARCH 111 1 10.00 ARCH 204 Nasri
CVSP 201 11 10:00 N. 214 Osborne
MS 255 1 10:00 Bliss 206 Beydoun
NFSC 221 1 11:00 Agr. 102 N. Baba
Wednesday
EN 203 7 09:00 N. 327 Bioghlu
ELEG 41 1 10:00 BECHTA 417 Chedid
HSAD 206 1 10:00 V.D. 107 Moh. Ali
BIOL 254 1 10:00 BIOL 004 Sadek
EN 203 28 12:00 F. 339 R. Iskandarani
Friday
NURS 400 2 09:00 Issam Lobby Noureddine & Dumit
ELEG 79C 1 10:00 BECHTA 344 Diab
2
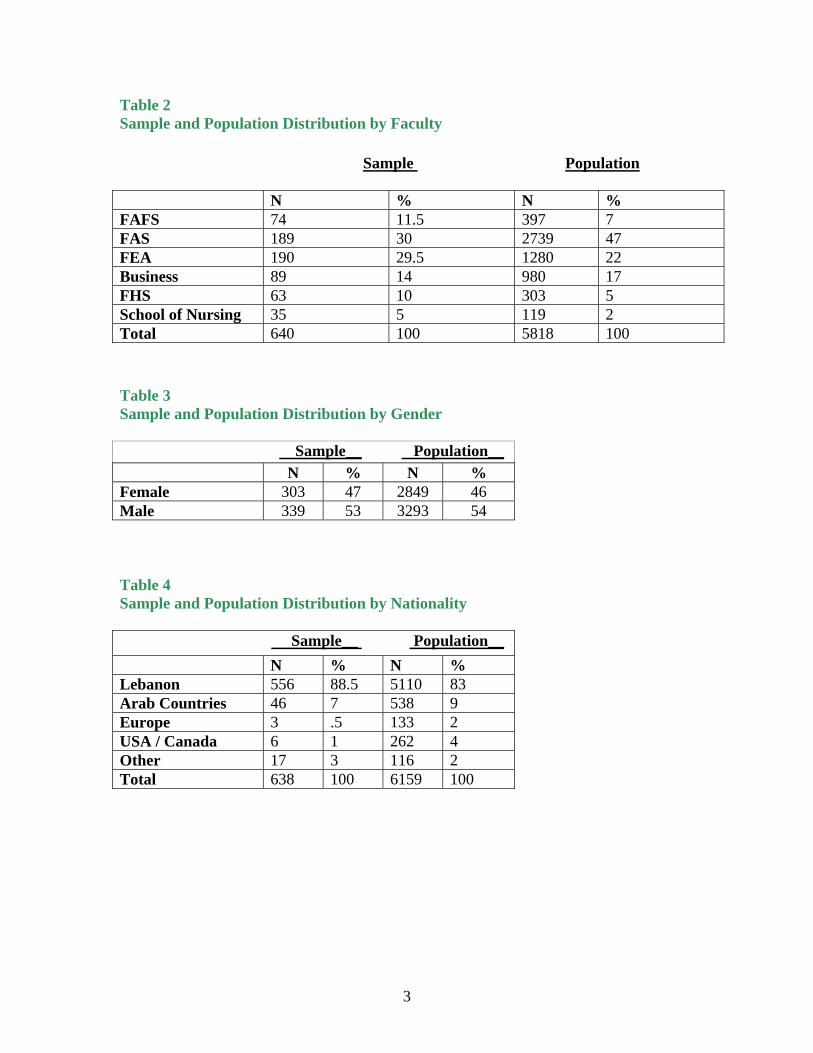
Table 2 Sample and Population Distribution by Faculty Sample Population N % N % FAFS 74 11.5 397 7 FAS 189 30 2739 47 FEA 190 29.5 1280 22 Business 89 14 980 17 FHS 63 10 303 5 School of Nursing 35 5 119 2 Total 640 100 5818 100 Table 3 Sample and Population Distribution by Gender Sample__ Population__
N % N % Female 303 47 2849 46 Male 339 53 3293 54 Table 4 Sample and Population Distribution by Nationality Sample__ Population__ N % N % Lebanon 556 88.5 5110 83 Arab Countries 46 7 538 9 Europe 3 .5 133 2 USA / Canada 6 1 262 4 Other 17 3 116 2 Total 638 100 6159 100
3
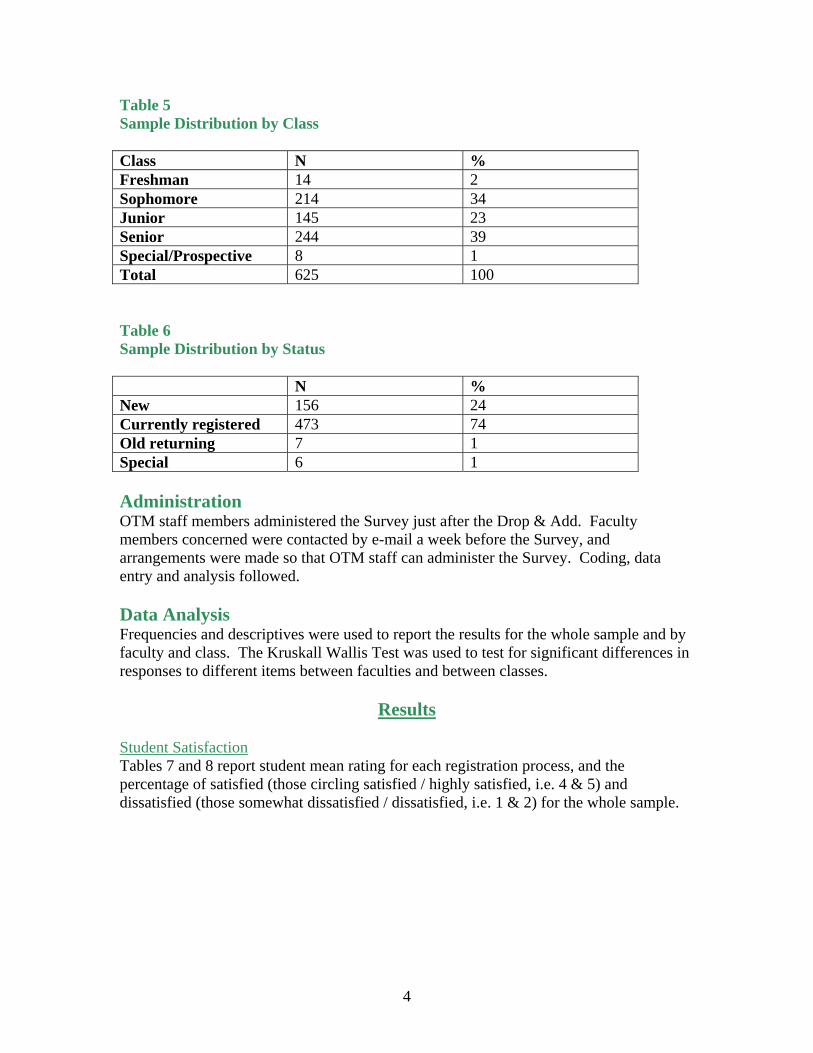
Table 5 Sample Distribution by Class Class N % Freshman 14 2 Sophomore 214 34 Junior 145 23 Senior 244 39 Special/Prospective 8 1 Total 625 100 Table 6 Sample Distribution by Status N % New 156 24 Currently registered 473 74 Old returning 7 1 Special 6 1 Administration OTM staff members administered the Survey just after the Drop & Add. Faculty members concerned were contacted by e-mail a week before the Survey, and arrangements were made so that OTM staff can administer the Survey. Coding, data entry and analysis followed. Data Analysis Frequencies and descriptives were used to report the results for the whole sample and by faculty and class. The Kruskall Wallis Test was used to test for significant differences in responses to different items between faculties and between classes.
Results Student Satisfaction Tables 7 and 8 report student mean rating for each registration process, and the percentage of satisfied (those circling satisfied / highly satisfied, i.e. 4 & 5) and dissatisfied (those somewhat dissatisfied / dissatisfied, i.e. 1 & 2) for the whole sample.
4
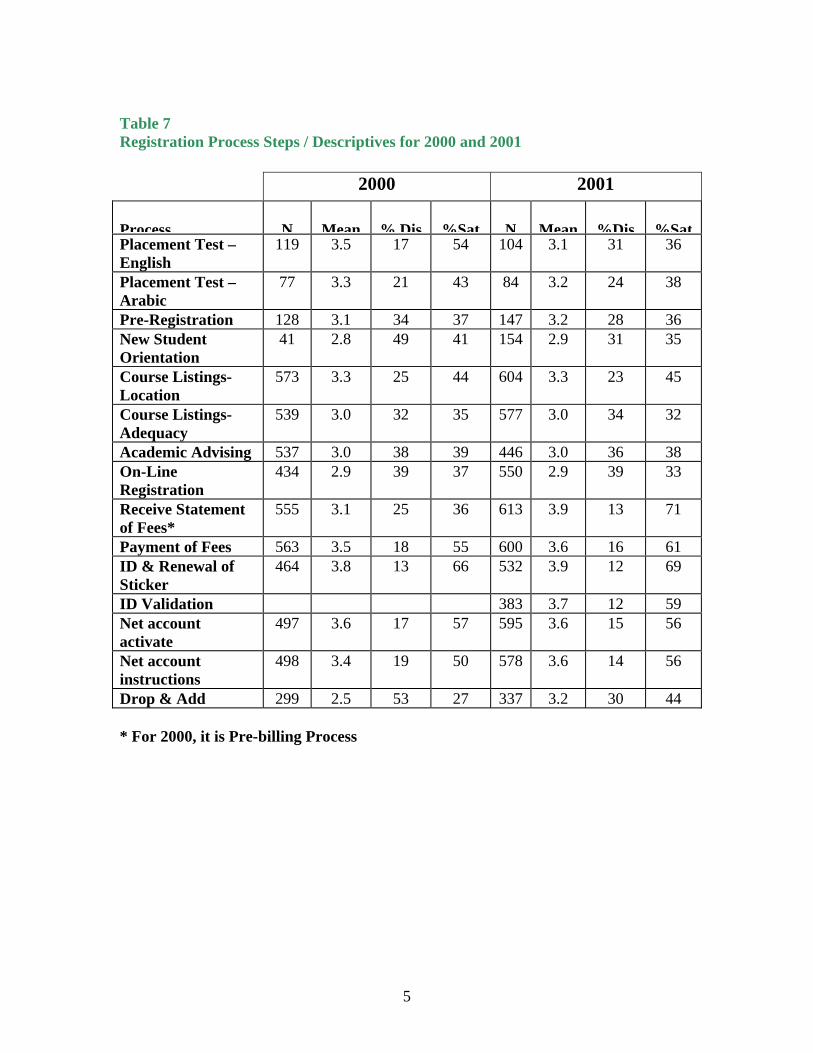
Table 7 Registration Process Steps / Descriptives for 2000 and 2001
2000 2001 Process
N
Mean
% Dis
%Sat
N
Mean
%Dis
%Sat
Placement Test – English
119 3.5 17 54 104 3.1
31 36
Placement Test –Arabic
77 3.3 21 43 84 3.2 24 38
Pre-Registration 128 3.1 34 37 147 3.2 28 36 New Student Orientation
41 2.8 49 41 154 2.9 31 35
Course Listings- Location
573 3.3 25 44 604 3.3 23 45
Course Listings- Adequacy
539 3.0 32 35 577 3.0 34 32
Academic Advising 537 3.0 38 39 446 3.0 36 38 On-Line Registration
434 2.9 39 37 550 2.9 39 33
Receive Statement of Fees*
555 3.1 25 36 613 3.9 13 71
Payment of Fees 563 3.5 18 55 600 3.6 16 61 ID & Renewal of Sticker
464 3.8 13 66 532 3.9 12 69
ID Validation 383 3.7 12 59 Net account activate
497 3.6 17 57 595 3.6 15 56
Net account instructions
498 3.4 19 50 578 3.6 14 56
Drop & Add 299 2.5 53 27 337 3.2 30 44 * For 2000, it is Pre-billing Process
5
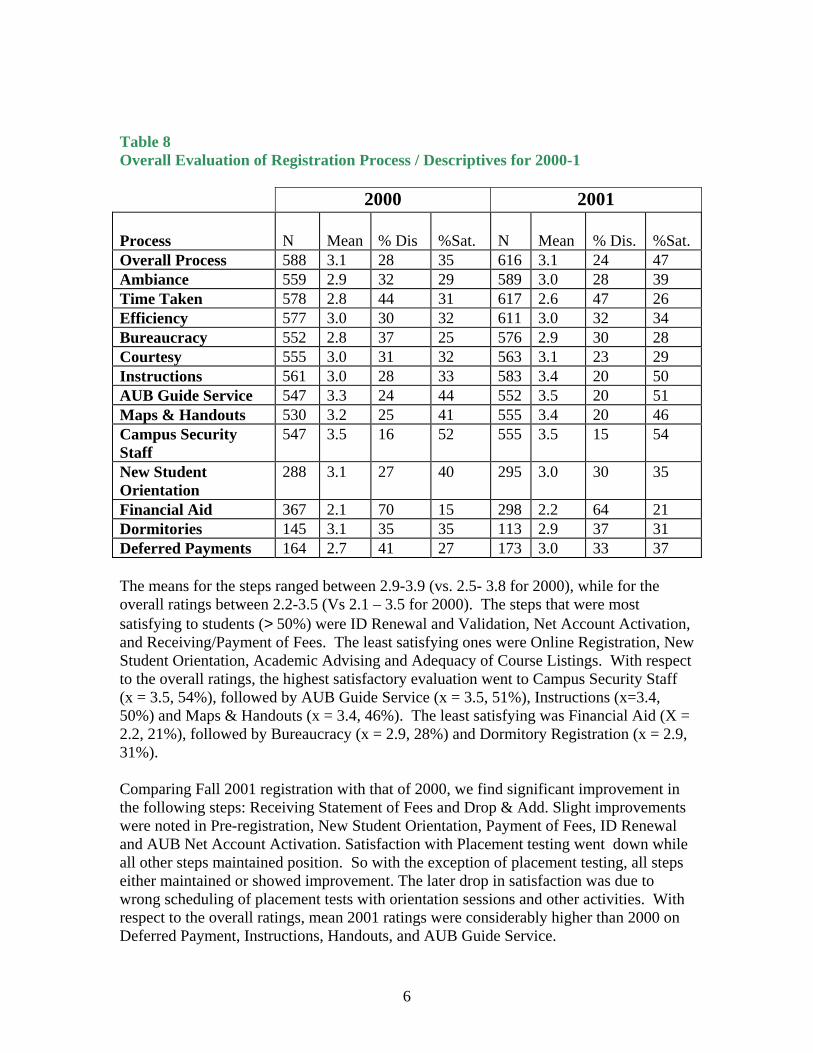
Table 8 Overall Evaluation of Registration Process / Descriptives for 2000-1 2000 2001 Process
N
Mean
% Dis
%Sat.
N
Mean
% Dis.
%Sat.
Overall Process 588 3.1 28 35 616 3.1 24 47 Ambiance 559 2.9 32 29 589 3.0 28 39 Time Taken 578 2.8 44 31 617 2.6 47 26 Efficiency 577 3.0 30 32 611 3.0 32 34 Bureaucracy 552 2.8 37 25 576 2.9 30 28 Courtesy 555 3.0 31 32 563 3.1 23 29 Instructions 561 3.0 28 33 583 3.4 20 50 AUB Guide Service 547 3.3 24 44 552 3.5 20 51 Maps & Handouts 530 3.2 25 41 555 3.4 20 46 Campus Security Staff
547 3.5 16 52 555 3.5 15 54
New Student Orientation
288 3.1 27 40 295 3.0 30 35
Financial Aid 367 2.1 70 15 298 2.2 64 21 Dormitories 145 3.1 35 35 113 2.9 37 31 Deferred Payments 164 2.7 41 27 173 3.0 33 37 The means for the steps ranged between 2.9-3.9 (vs. 2.5- 3.8 for 2000), while for the overall ratings between 2.2-3.5 (Vs 2.1 – 3.5 for 2000). The steps that were most satisfying to students (> 50%) were ID Renewal and Validation, Net Account Activation, and Receiving/Payment of Fees. The least satisfying ones were Online Registration, New Student Orientation, Academic Advising and Adequacy of Course Listings. With respect to the overall ratings, the highest satisfactory evaluation went to Campus Security Staff (x = 3.5, 54%), followed by AUB Guide Service (x = 3.5, 51%), Instructions (x=3.4, 50%) and Maps & Handouts (x = 3.4, 46%). The least satisfying was Financial Aid (X = 2.2, 21%), followed by Bureaucracy (x = 2.9, 28%) and Dormitory Registration (x = 2.9, 31%). Comparing Fall 2001 registration with that of 2000, we find significant improvement in the following steps: Receiving Statement of Fees and Drop & Add. Slight improvements were noted in Pre-registration, New Student Orientation, Payment of Fees, ID Renewal and AUB Net Account Activation. Satisfaction with Placement testing went down while all other steps maintained position. So with the exception of placement testing, all steps either maintained or showed improvement. The later drop in satisfaction was due to wrong scheduling of placement tests with orientation sessions and other activities. With respect to the overall ratings, mean 2001 ratings were considerably higher than 2000 on Deferred Payment, Instructions, Handouts, and AUB Guide Service.
6
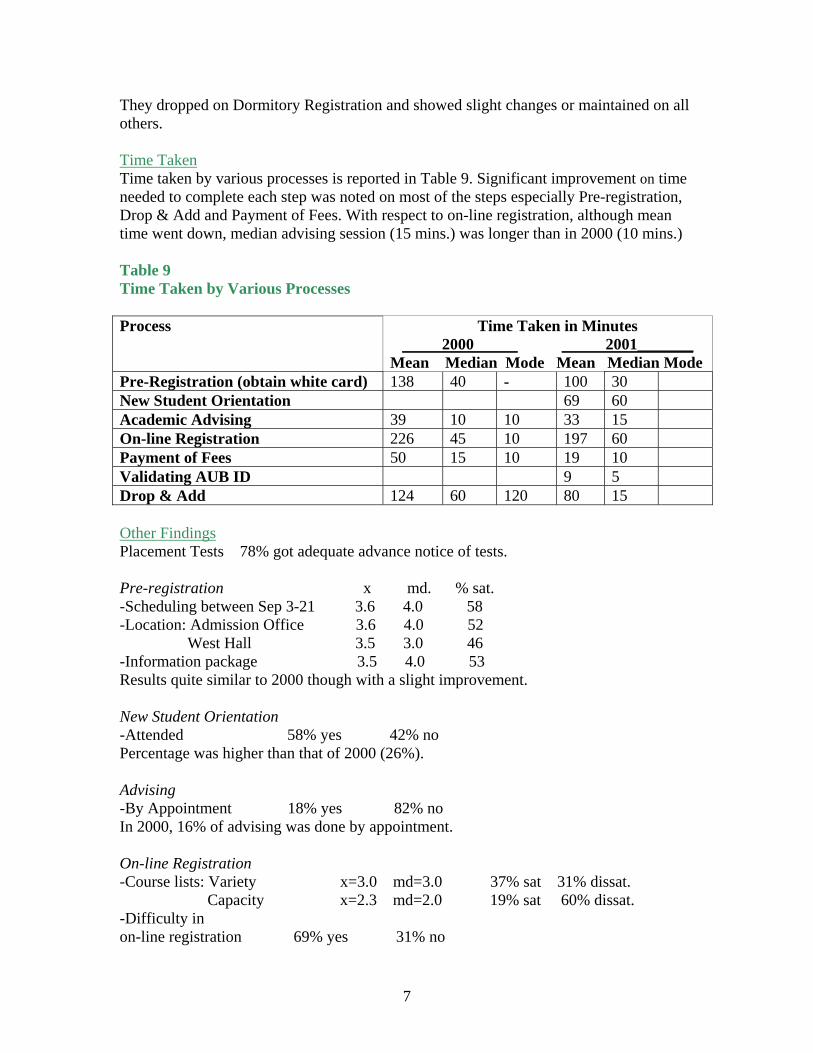
They dropped on Dormitory Registration and showed slight changes or maintained on all others. Time Taken Time taken by various processes is reported in Table 9. Significant improvement on time needed to complete each step was noted on most of the steps especially Pre-registration, Drop & Add and Payment of Fees. With respect to on-line registration, although mean time went down, median advising session (15 mins.) was longer than in 2000 (10 mins.) Table 9 Time Taken by Various Processes Process
Time Taken in Minutes 2000 2001_______ Mean Median Mode Mean Median Mode
Pre-Registration (obtain white card) 138 40 - 100 30 New Student Orientation 69 60 Academic Advising 39 10 10 33 15 On-line Registration 226 45 10 197 60 Payment of Fees 50 15 10 19 10 Validating AUB ID 9 5 Drop & Add 124 60 120 80 15 Other Findings Placement Tests 78% got adequate advance notice of tests. Pre-registration x md. % sat. -Scheduling between Sep 3-21 3.6 4.0 58 -Location: Admission Office 3.6 4.0 52 West Hall 3.5 3.0 46 -Information package 3.5 4.0 53 Results quite similar to 2000 though with a slight improvement. New Student Orientation -Attended 58% yes 42% no Percentage was higher than that of 2000 (26%). Advising -By Appointment 18% yes 82% no In 2000, 16% of advising was done by appointment. On-line Registration -Course lists: Variety x=3.0 md=3.0 37% sat 31% dissat. Capacity x=2.3 md=2.0 19% sat 60% dissat. -Difficulty in on-line registration 69% yes 31% no
7
-Reason for difficulty: 64% Capacity/course/ section 23% other (outlined in comment section) 7% Course sections 5% No. of courses offered. -Type of course difficulty found in: 40% University required courses 29% upper level courses in major 13% lower level courses in major 3% other (outlined in comment section) Statement of Fees -Banks 13% Arab Bank 51% Bank Audi 30% HSBC 7% Mediterranean Bank AUB Net Account -Adequacy of instructions x=3.6, md=4.0, 56% satisfied (50% in 2000).. Student Satisfaction by Faculty Tables 10-11 report mean satisfaction ratings by faculty on the registration steps and on the overall ratings. The Kruskall Wallis Test was used to identify areas where significant differences existed between faculties. The following is a summary of major findings: Pre-registration -Process means ranged between 3.0-3.2 for all faculties except for Business (3.9). -All faculties were more satisfied with Admission Office location than with West Hall. New Student Orientation -Attendance percentages: 33 (FHS), 50 Business, 52 A&S, 57 FAFS, 68 (FEA, Nursing) with a mean of 58. Advising -By Appointment percentages: 9 (FEA), 13 Business, 16 A&S, 18 (FAFS), 23 (Nursing) and 44 (FHS). -Advising process was unsatisfactory (<3.0) in most faculties except for FHS (3.7). On-line Registration -Process was more satisfactory in Business, FEA, and Nursing (3.1) -Course listings variability. Satisfaction was higher in FHS (3.4) and Business (3.2) while for all other faculties it was 2.9-3.0. -Course listings capacity. Satisfaction was lowest with A&S (2.1), highest with FHS (2.7) while all other faculties had a mean rating of 2.4.
8
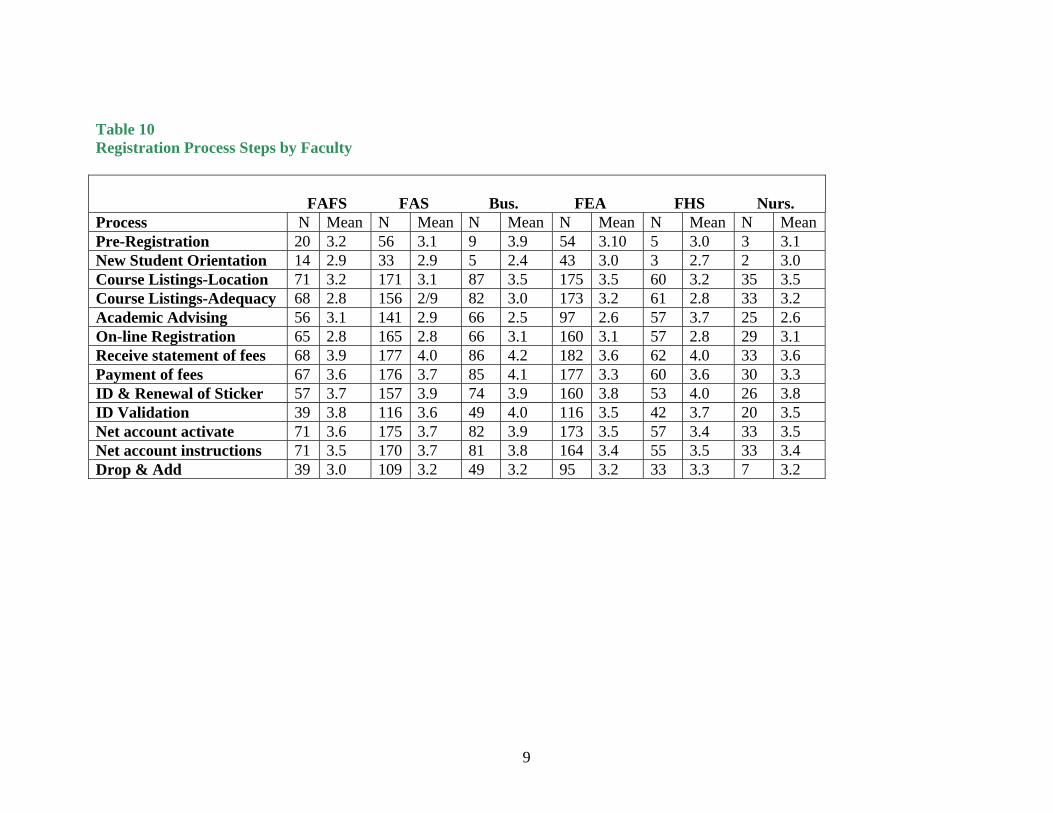
Table 10 Registration Process Steps by Faculty FAFS FAS Bus. FEA FHS Nurs. Process N Mean N Mean N Mean N Mean N Mean N Mean Pre-Registration 20 3.2 56 3.1 9 3.9 54 3.10 5 3.0 3 3.1 New Student Orientation 14 2.9 33 2.9 5 2.4 43 3.0 3 2.7 2 3.0Course Listings-Location 71 3.2 171 3.1 87 3.5 175 3.5 60 3.2 35 3.5Course Listings-Adequacy 68 2.8 156 2/9 82 3.0 173 3.2 61 2.8 33 3.2Academic Advising 56 3.1 141 2.9 66 2.5 97 2.6 57 3.7 25 2.6On-line Registration 65 2.8 165 2.8 66 3.1 160 3.1 57 2.8 29 3.1Receive statement of fees 68 3.9 177 4.0 86 4.2 182 3.6 62 4.0 33 3.6Payment of fees 67 3.6 176 3.7 85 4.1 177 3.3 60 3.6 30 3.3ID & Renewal of Sticker 57 3.7 157 3.9 74 3.9 160 3.8 53 4.0 26 3.8ID Validation 39 3.8 116 3.6 49 4.0 116 3.5 42 3.7 20 3.5Net account activate 71 3.6 175 3.7 82 3.9 173 3.5 57 3.4 33 3.5Net account instructions 71 3.5 170 3.7 81 3.8 164 3.4 55 3.5 33 3.4Drop & Add 39 3.0 109 3.2 49 3.2 95 3.2 33 3.3 7 3.2
9
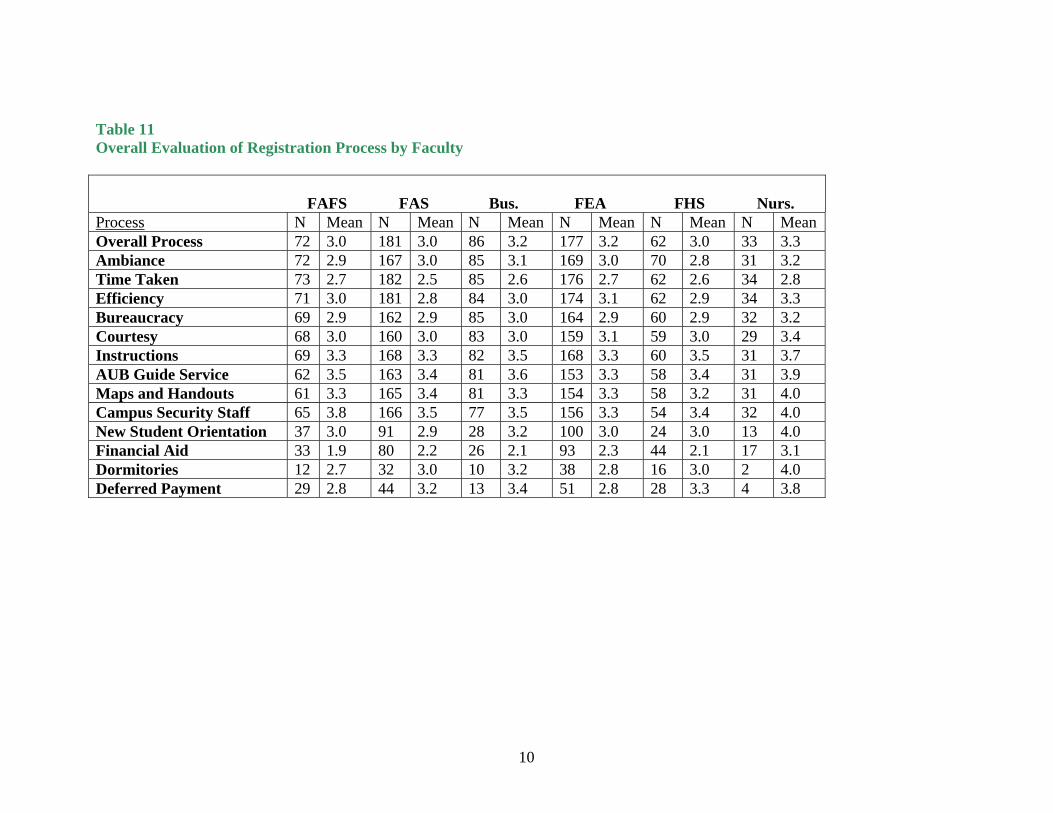
Table 11 Overall Evaluation of Registration Process by Faculty FAFS FAS Bus. FEA FHS Nurs. Process N Mean N Mean N Mean N Mean N Mean N Mean Overall Process 72 3.0 181 3.0 86 3.2 177 3.2 62 3.0 33 3.3 Ambiance 72 2.9 167 3.0 85 3.1 169 3.0 70 2.8 31 3.2Time Taken 73 2.7 182 2.5 85 2.6 176 2.7 62 2.6 34 2.8Efficiency 71 3.0 181 2.8 84 3.0 174 3.1 62 2.9 34 3.3Bureaucracy 69 2.9 162 2.9 85 3.0 164 2.9 60 2.9 32 3.2Courtesy 68 3.0 160 3.0 83 3.0 159 3.1 59 3.0 29 3.4Instructions 69 3.3 168 3.3 82 3.5 168 3.3 60 3.5 31 3.7AUB Guide Service 62 3.5 163 3.4 81 3.6 153 3.3 58 3.4 31 3.9Maps and Handouts 61 3.3 165 3.4 81 3.3 154 3.3 58 3.2 31 4.0Campus Security Staff 65 3.8 166 3.5 77 3.5 156 3.3 54 3.4 32 4.0New Student Orientation 37 3.0 91 2.9 28 3.2 100 3.0 24 3.0 13 4.0Financial Aid 33 1.9 80 2.2 26 2.1 93 2.3 44 2.1 17 3.1Dormitories 12 2.7 32 3.0 10 3.2 38 2.8 16 3.0 2 4.0Deferred Payment 29 2.8 44 3.2 13 3.4 51 2.8 28 3.3 4 3.8
10
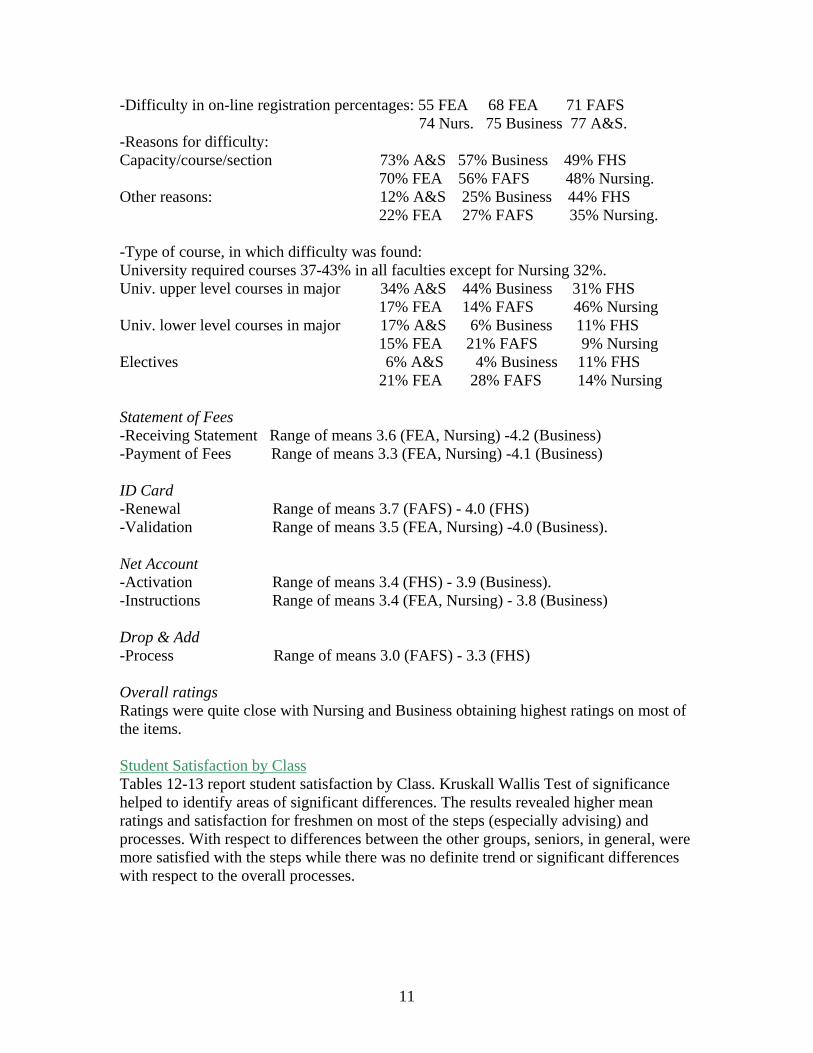
-Difficulty in on-line registration percentages: 55 FEA 68 FEA 71 FAFS 74 Nurs. 75 Business 77 A&S. -Reasons for difficulty: Capacity/course/section 73% A&S 57% Business 49% FHS 70% FEA 56% FAFS 48% Nursing. Other reasons: 12% A&S 25% Business 44% FHS 22% FEA 27% FAFS 35% Nursing. -Type of course, in which difficulty was found: University required courses 37-43% in all faculties except for Nursing 32%. Univ. upper level courses in major 34% A&S 44% Business 31% FHS 17% FEA 14% FAFS 46% Nursing Univ. lower level courses in major 17% A&S 6% Business 11% FHS 15% FEA 21% FAFS 9% Nursing Electives 6% A&S 4% Business 11% FHS 21% FEA 28% FAFS 14% Nursing Statement of Fees -Receiving Statement Range of means 3.6 (FEA, Nursing) -4.2 (Business) -Payment of Fees Range of means 3.3 (FEA, Nursing) -4.1 (Business) ID Card -Renewal Range of means 3.7 (FAFS) - 4.0 (FHS) -Validation Range of means 3.5 (FEA, Nursing) -4.0 (Business). Net Account -Activation Range of means 3.4 (FHS) - 3.9 (Business). -Instructions Range of means 3.4 (FEA, Nursing) - 3.8 (Business) Drop & Add -Process Range of means 3.0 (FAFS) - 3.3 (FHS) Overall ratings Ratings were quite close with Nursing and Business obtaining highest ratings on most of the items. Student Satisfaction by Class Tables 12-13 report student satisfaction by Class. Kruskall Wallis Test of significance helped to identify areas of significant differences. The results revealed higher mean ratings and satisfaction for freshmen on most of the steps (especially advising) and processes. With respect to differences between the other groups, seniors, in general, were more satisfied with the steps while there was no definite trend or significant differences with respect to the overall processes.
11
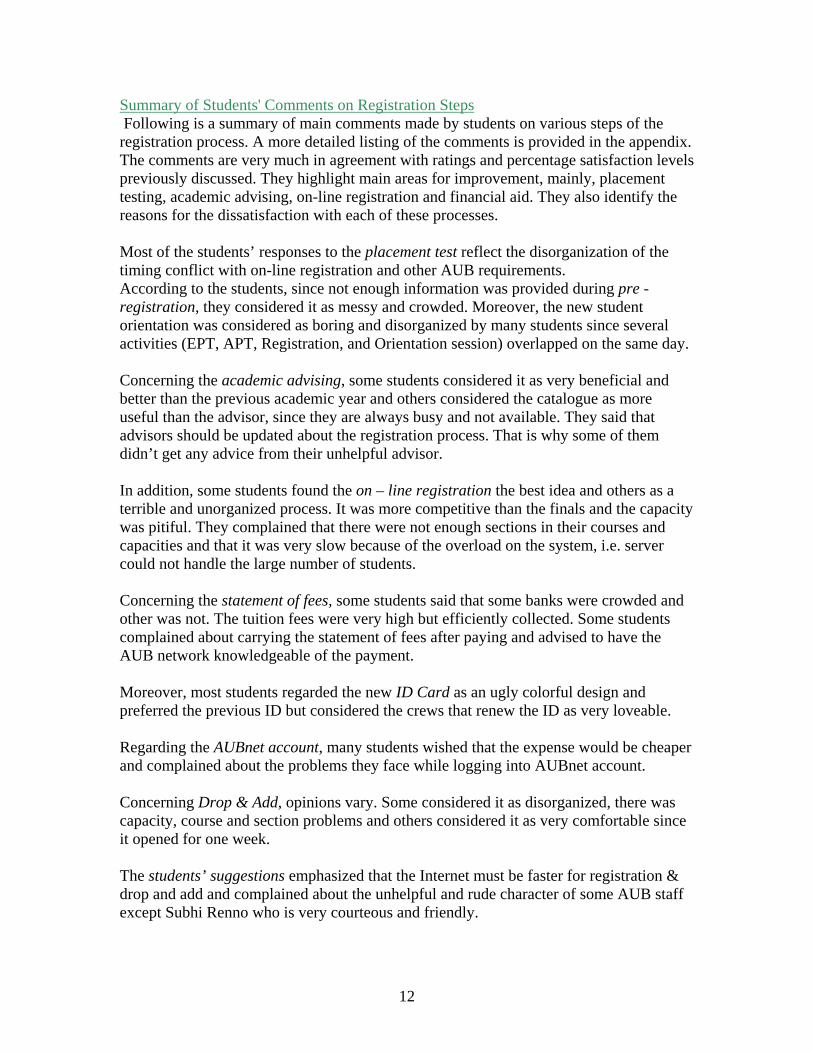
Summary of Students' Comments on Registration Steps Following is a summary of main comments made by students on various steps of the registration process. A more detailed listing of the comments is provided in the appendix. The comments are very much in agreement with ratings and percentage satisfaction levels previously discussed. They highlight main areas for improvement, mainly, placement testing, academic advising, on-line registration and financial aid. They also identify the reasons for the dissatisfaction with each of these processes. Most of the students’ responses to the placement test reflect the disorganization of the timing conflict with on-line registration and other AUB requirements. According to the students, since not enough information was provided during pre -registration, they considered it as messy and crowded. Moreover, the new student orientation was considered as boring and disorganized by many students since several activities (EPT, APT, Registration, and Orientation session) overlapped on the same day. Concerning the academic advising, some students considered it as very beneficial and better than the previous academic year and others considered the catalogue as more useful than the advisor, since they are always busy and not available. They said that advisors should be updated about the registration process. That is why some of them didn’t get any advice from their unhelpful advisor. In addition, some students found the on – line registration the best idea and others as a terrible and unorganized process. It was more competitive than the finals and the capacity was pitiful. They complained that there were not enough sections in their courses and capacities and that it was very slow because of the overload on the system, i.e. server could not handle the large number of students. Concerning the statement of fees, some students said that some banks were crowded and other was not. The tuition fees were very high but efficiently collected. Some students complained about carrying the statement of fees after paying and advised to have the AUB network knowledgeable of the payment. Moreover, most students regarded the new ID Card as an ugly colorful design and preferred the previous ID but considered the crews that renew the ID as very loveable. Regarding the AUBnet account, many students wished that the expense would be cheaper and complained about the problems they face while logging into AUBnet account. Concerning Drop & Add, opinions vary. Some considered it as disorganized, there was capacity, course and section problems and others considered it as very comfortable since it opened for one week. The students’ suggestions emphasized that the Internet must be faster for registration & drop and add and complained about the unhelpful and rude character of some AUB staff except Subhi Renno who is very courteous and friendly.
12

Table 12 Registration Process Steps by Class
Freshman Sophomore Junior Senior Process N Mean N Mean N Mean N Mean Pre-Registration 14 3.5 125 3.1 1 4.0 2 4.0 New Student Orientation 9 2.9 85 2.9 0 - 1 4.0 Course Listings-Location 12 3.1 196 3.3 137 3.2 232 3.4 Course Listings-Adequacy 10 3.1 191 3.0 130 2.9 222 3.0 Academic Advising 11 3.8 149 2.9 103 3.1 165 2.8 On-line Registration 12 3.7 186 2.9 123 2.9 204 2.8 Receive statement of fees 12 3.6 197 3.8 139 3.9 239 4.1 Payment of fees 13 4.2 191 3.7 137 3.4 233 3.8 ID & Renewal of Sticker 10 4.2 181 3.7 126 3.9 192 4.0 ID Validation 8 3.4 122 3.6 98 3.6 141 3.8 Net account activate 14 3.7 200 3.7 138 3.6 219 3.6 Net account instructions 13 3.8 192 3.5 131 3.6 216 3.7 Drop & Add 8 4 120 3.2 86 3.1 111 3.1 Table 13 Overall Evaluation of Registration Process by Class Freshman Sophomore Junior Senior Process N Mean N Mean N Mean N Mean Overall Process 13 3.3 197 3.1 142 3.1 239 3.1 Ambiance 10 4.0 187 3.1 134 2.8 231 3.0 Time Taken 13 3.2 197 2.7 141 2.5 239 2.6 Efficiency 13 3.2 194 3.1 141 2.8 236 3.0 Bureaucracy 11 3.5 185 3.0 126 2.9 228 2.9 Courtesy 9 4.1 142 2.4 130 2.9 219 3.1 Instructions 11 3.5 185 3.2 133 3.3 229 3.5 AUB Guide Service 12 3.9 180 3.5 124 3.3 213 3.4 Maps and Handouts 11 4.6 183 3.4 126 3.2 215 3.3 Campus Security Staff 11 4.5 182 3.6 126 3.6 211 3.4 New Student Orientation 12 3.4 134 3.0 45 3.0 94 3.1 Financial Aid 3 3.3 75 2.1 82 2.2 124 2.2 Dormitories 3 3.7 30 2.6 25 2.9 46 3.0 Deferred Payment 3 4.3 47 2.9 42 3.0 75 3.0
13

14